

Abstract
Background:
Neonatal hypoxic-ischemic encephalopathy (HIE) is associated with dysfunctional cerebral autoregulation. Resistive index (RI) measured in the anterior cerebral artery on transfontanellar head ultrasound is a noninvasive measure of blood flow and may indicate autoregulation dysfunction. We tested whether RI was associated with brain injury on diffusion tensor imaging magnetic resonance imaging (MRI).
Materials and Methods:
Seventy-five neonates who underwent therapeutic hypothermia for HIE were enrolled. Resistive index values were obtained from head ultrasound performed at the end of therapeutic hypothermia. Apparent diffusion coefficient scalars were measured on MRIs performed before day of life 10.
Results:
Lower RI was associated with lower apparent diffusion coefficient in the centrum semiovale, basal ganglia, thalamus, and posterior limb of the internal capsule. Combining RI and Apgar scores improved the ability to distinguish injury severity on MRI relative to either metric alone.
Conclusions:
Low RI correlated with worse brain injury on diffusion tensor imaging and may serve as an early marker of brain injury in cooled HIE neonates.
Keywords: hypoxic-ischemic encephalopathy, neonates, head ultrasound
Although magnetic resonance imaging (MRI) is the most sensitive and specific neuroimaging modality to evaluate neonatal brain injury from hypoxic-ischemic encephalopathy (HIE), head ultrasound (HUS) can play an important role because it is radiation-free and performed at the bedside, which is especially helpful for clinically unstable neonates.1 Cerebrovascular autoregulation holds cerebral blood flow relatively constant across changes in blood pressure. Dysfunctional autoregulation results in cerebral blood flow that is passive to blood pressure. Hypoxic-ischemic encephalopathy is associated with dysfunctional cerebral autoregulation, which may lead to further brain injury. Identifying neonates with dysfunctional autoregulation may stratify those patients requiring closer monitoring of blood pressure to better support autoregulation.2 Spectral Doppler ultrasound of the cerebral arteries allows for calculation of the resistive index (RI), defined as the ratio between (peak systolic-end diastolic velocity) divided by peak systolic velocity. The RI values in the anterior cerebral circulation are a noninvasive measure of cerebral blood flow, which can identify dysfunctional cerebral autoregulation.3–5 Low RI values before or after therapeutic hypothermia (TH) have been shown to be associated with worse morbidity and neurodevelopmental outcomes,6–10 although may not be predictive of outcomes when performed during cooling.8 Little is known, however, about the correlation between RI and brain MRI findings.11 Since infants suffering with HIE may be too hemodynamically unstable to be transferred to the MRI scanner, evaluating brain injury with bedside ultrasound during TH may guide potential adjuvant therapies by identifying those infants at higher risk for brain injury.12–15 Other clinical measures such as Apgar scores, cord PH, base excess have been studies in neonates with HIE.16–20 We tested whether RI values in the anterior cerebral artery (ACA) measured by HUS was associated with apparent diffusion coefficient (ADC) scalars. We hypothesized that lower RI at the end of TH would be associated with lower ADC scalars in neonates with HIE. In addition, we tested whether clinical measures such as Apgar, cord PH, base excess would strengthen this association.
MATERIALS AND METHODS
Study Population and Clinical Measures
This study was approved by the Institutional Review Board. Between September 2010 and July 2015, all neonates who underwent TH for HIE were screened for study enrollment. Inclusion criteria for TH included gestational age 35 weeks or greater and the clinical criteria reported in the Eunice Kennedy Shriver National Institute of Child Health and Human Development Neonatal Research Network's trial of TH in HIE.6,21 Neonates who required extracorporeal membrane support were excluded.
Neonates received whole-body TH for 72 hours to a goal rectal temperature of 33.5 ± 0.5°C according to our previously described protocol.6,22,23 Their medical records were reviewed to obtain clinical markers including Apgar scores, blood gas pH and base deficit from the umbilical cord or first hour of life. The presence of a clinically significant patent ductus arteriosus (PDA), persistent pulmonary hypertension of the newborn (PPHN), and inotrope and ventilator use during TH were also recorded. Significant PDA was defined as a ductus arteriosus identified by echocardiogram, producing shunting from systemic to pulmonary circulation. Persistent pulmonary hypertension of the newborn was determined by 2D echocardiogram suggesting increased right ventricular pressures that clinically resulted in decreased oxygenation and needs for supplemental oxygen, inhaled nitrous oxide or pulmonary vasodilators. Any mode of ventilation was included in the ventilator use variable, but the most common was synchronized invasive mechanical ventilation with pressure support.
Head Ultrasound
At our institution, HUS are typically performed in neonates with HIE at the beginning of cooling and after rewarming, typically on day of life (DOL) 4. For this study, we analyzed the HUS performed after rewarming. All HUS were performed by experienced pediatric sonographers according to departmental protocol that included multiplanar images through the anterior, posterior and mastoidal fontanelles. Color Doppler with angle correction including spectral analysis of the ACA was also obtained through the anterior fontanelle in the sagittal plane in the beginning of the examination. RI was calculated by the HUS machine according to the following formula: (peak systolic velocity - end-diastolic velocity)/peak systolic velocity. Normal RI for term neonate is considered to be between 0.6 and 0.8 (Fig. 1).
FIGURE 1.

Full term neonate with history of placental abruption. HUS performed at DOL 4 immediately after TH. (A) Bilateral diffuse symmetric increased echogenicity of the white matter, thalami and basal ganglia. Although identifiable for experienced radiologists, this finding can easily be missed. (B) The resistive index in the ACA measures <0.6, abnormal. Figure 1 can be viewed online in color at www.jcat.org.
MR Imaging
All MR examinations were performed during normothermia after cessation of cooling using a 1.5T (Avanto) or 3T (Siemens, Erlangen, German) scanner and neonatal head coil during natural sleep and without anesthesia. All MRIs were performed between days of life 4 and 9, as some infants may not be stable for transport immediately after rewarming. Our standard department protocol includes sagittal T1-weighted, axial T2-weighted, and axial susceptibility-weighted images as well as a single-shot, spin-echo, echo-planar axial diffusion tensor imaging (DTI) sequence with diffusion gradients along 20 noncollinear directions using b values of 0 and 1000 s/mm2 (Fig. 2). The ADC values are automatically calculated by the MR scanner using vendor-specific software.
FIGURE 2.
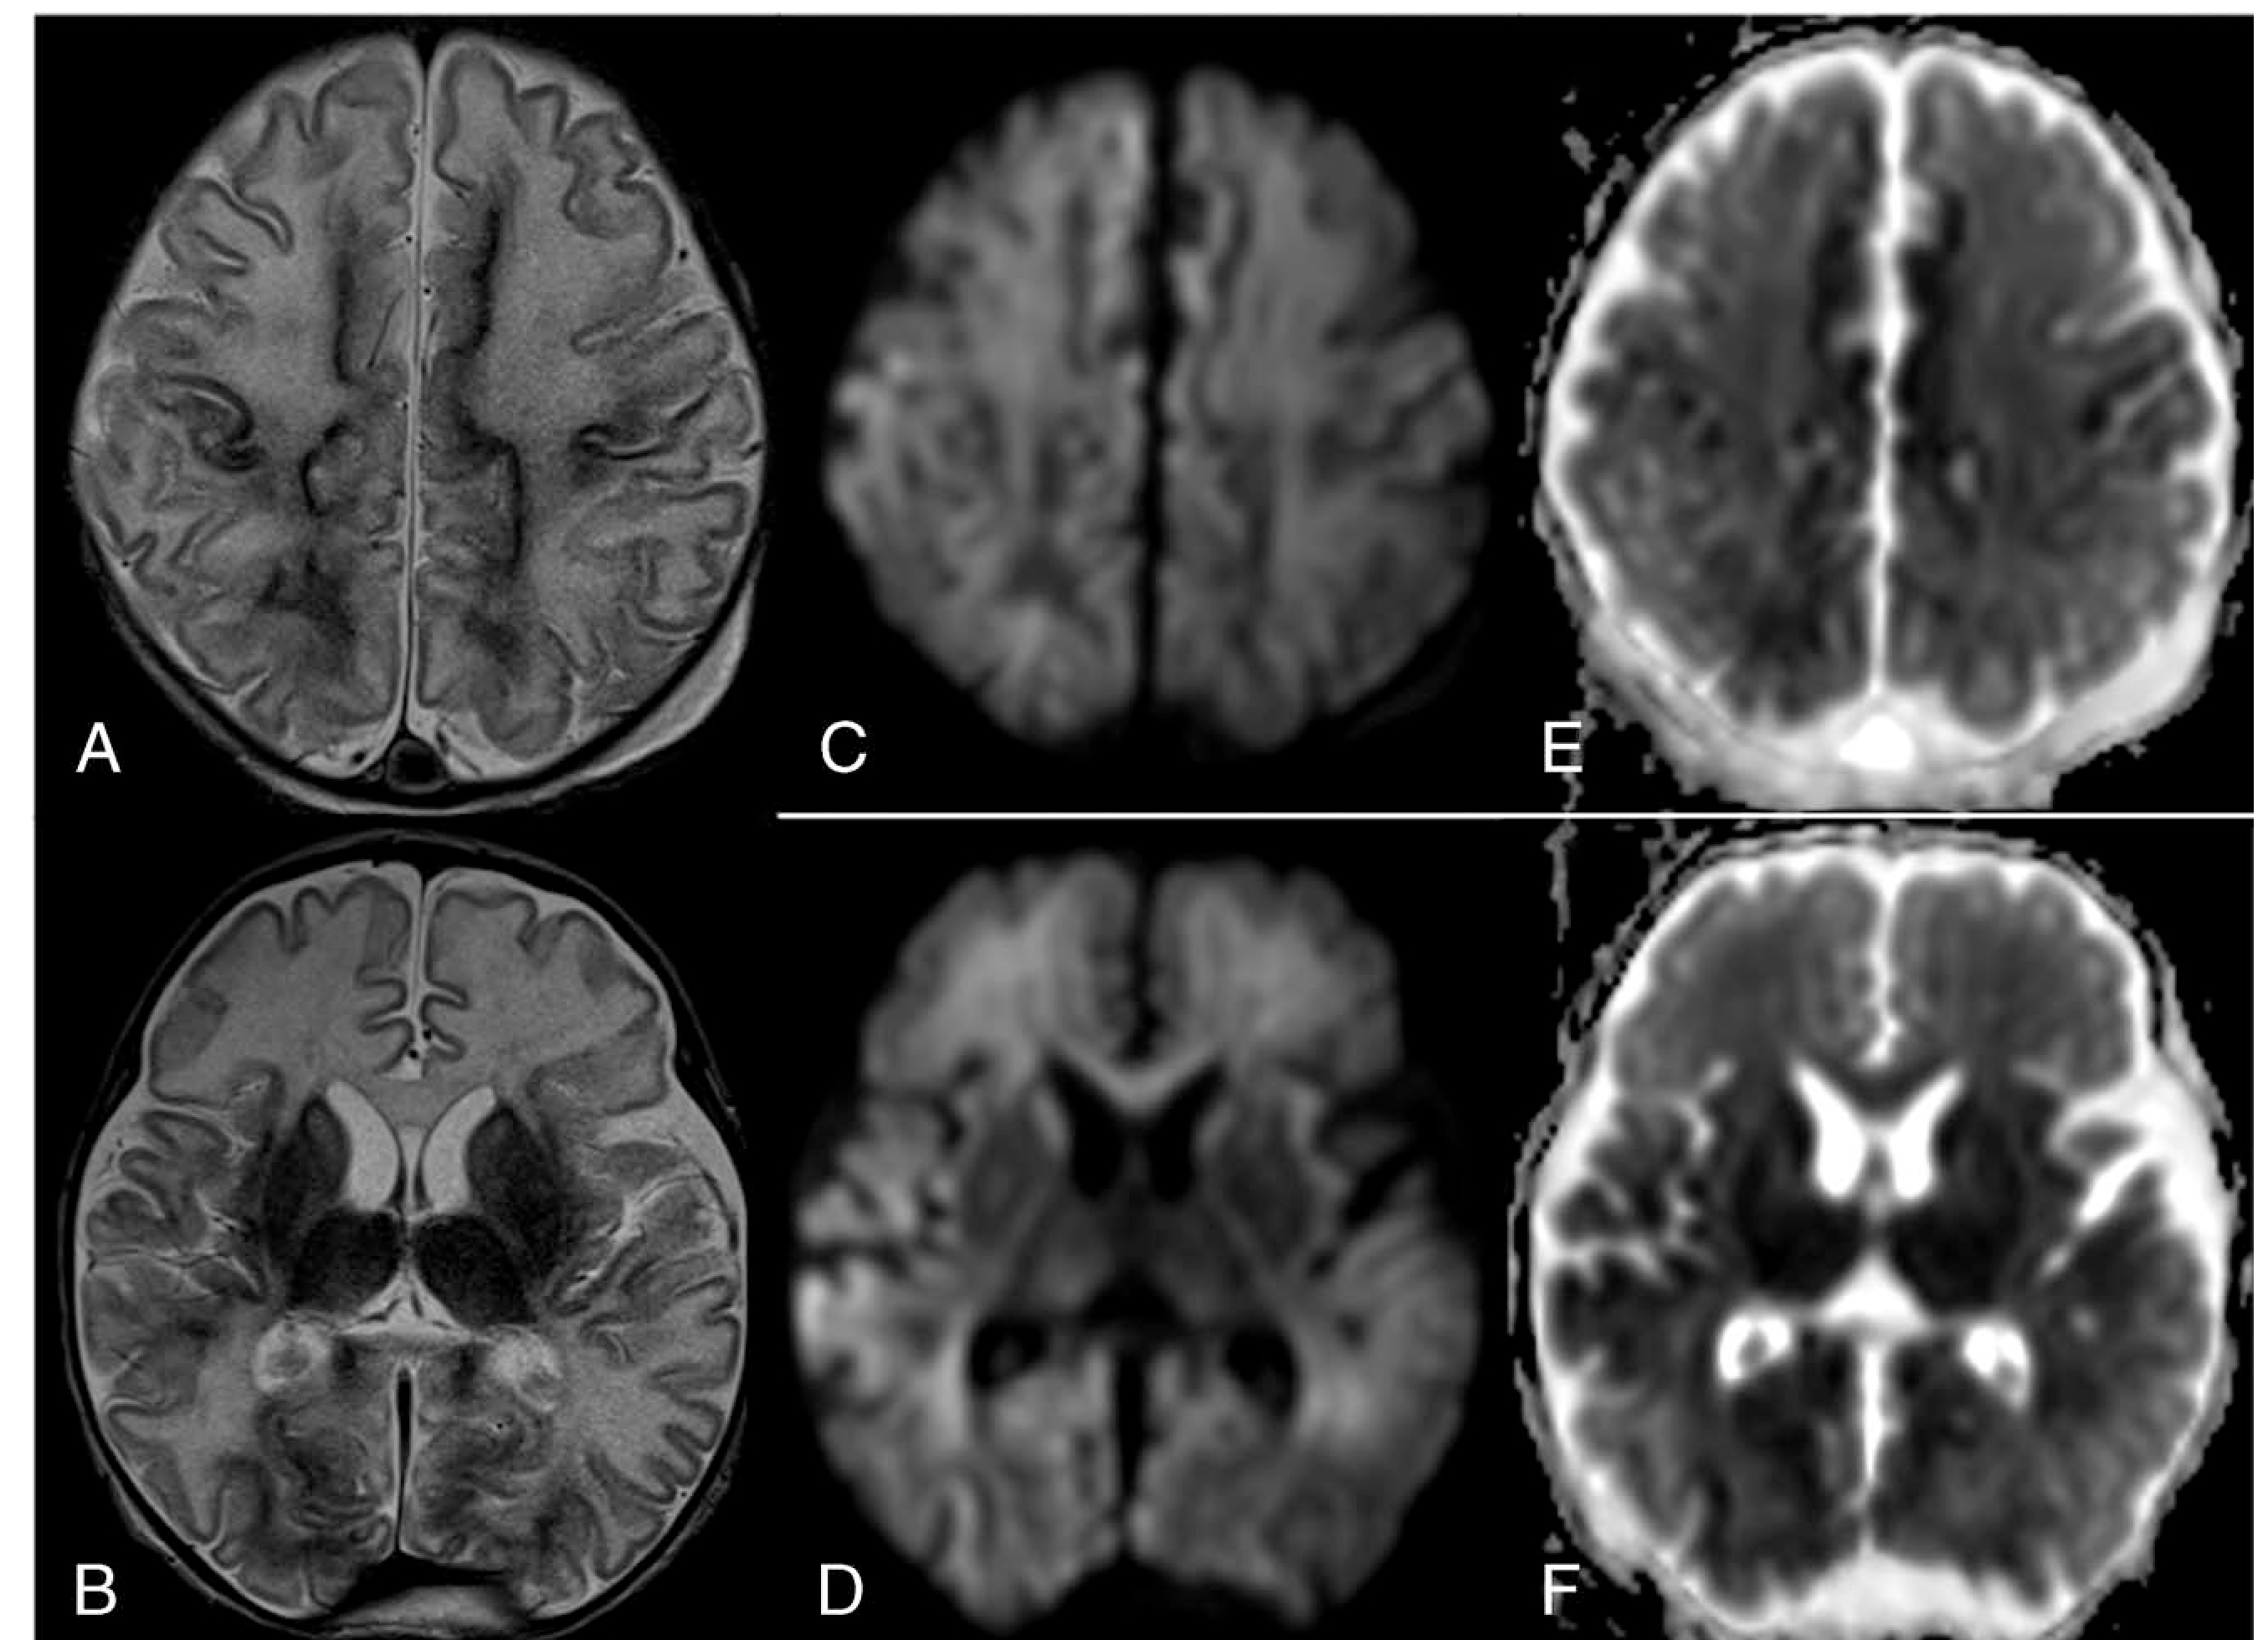
Same patient as in Figure 1. Neonatal brain MRI performed at DOL 9. (A, B) axial T2-weighted images demonstrate bilateral symmetric diffusely increased T2 signal of the white matter. Note the bilateral symmetric dark T2 signal of the basal ganglia and thalami, and cortex most notable in the Rolandic gyri, mesial frontoparietal and occipital cortices. Lateral ventricles appear larger than that of HUS (Fig. 1), likely secondary to reduced acute edema and/or volume loss in the brain parenchyma. Diffusion tracer images (C, D) and corresponding ADC maps (E, F) show restricted diffusion in similar areas as mentioned in A and B.
Two dedicated pediatric neuroradiologists with at least 15 years of experience interpreted the brain MRIs on a PACS workstation. We only analyzed neonates who had an MRI performed between DOL 4 and 9 because ADC values are lower at younger ages, and to account for pseudonormalization of the ADC signal after hypothermia.24 ADC scalars were measured by manually placing oval region of interests in 7 anatomic regions in each cerebral hemisphere: anterior centrum semiovale (ACS), posterior centrum semiovale (PCS), posterior limb of the internal capsule (PLIC), putamen and globus pallidus, and the entire thalamus, pons, and middle cerebellar peduncle.25 The ADC values were measured for each region on 3 contiguous axial slices, and the median was calculated and used as the ADC value for that region as described.25,26
Statistical Analysis
We used linear regression to test the relationships between RI and ADC scalars. In addition, Apgar score at 1 and 5 minutes, cord pH and base excess, were also tested. We controlled the data for clinically significant PDA, PPHN, use of inotropes and ventilator support because these may affect RI values. A P value less than 0.05 was considered statistically significant RI and Apgar score combined was compared with ADC scalars using area under the receiver operating characteristic curve (AUC). The best threshold was calculated using Youden's index.27
RESULTS
Seventy-five neonates with HIE were initially enrolled into the study. Sixty-nine neonates had HUS after rewarming. Diffusion tensor imaging MRI was analyzed in 41 neonates who had their brain MRI performed between DOL 4 and 9. The median Apgar score at 1 and 5 minutes was 1 (interquartile range [IQR], 1–2)and 3 (IQR,2–5;Table1). The mean RI was 0.63 (SD = 0.11), which was within the range of normal (0.6–0.8). The RI values were not associated with 1- or 5-minute Apgar scores, umbilical cord pH or base excess levels.
Lower RI values on HUS were associated with lower ADC values in ACS (P = 0.039 for right, P = 0.015 for left), PCS (P = 0.018 for right, P = 0.022 for left), basal ganglia (P = 0.039 for right, P = 0.048 for left), thalamus (P = 0.004 for right; P = 0.004 for left), and PLIC (P = 0.004 for right, P = 0.001 for left) in adjusted analyses (Table 2).
TABLE 2.
Correlation Between ADC (by Region) and US RI Without Pressure for Neonates With ADC Measured at DOL 9 or earlier
| Unadjusted Association |
Adjusted Association* |
|||
|---|---|---|---|---|
| Brain Region | β (est) 95% CI | P | β (est) 95% CI | P |
| Right ACS | 0.054† (0.012–0.096) | 0.015 | 0.053† (0.004, 0.103) | 0.039 |
| Left ACS | 0.074† (0.026–0.122) | 0.004 | 0.072† (0.016, 0.128) | 0.015 |
| Right PCS | 0.062† (0.020–0.103) | 0.005 | 0.060† (0.012, 0.108) | 0.018 |
| Left PCS | 0.049† (0.014–0.084) | 0.008 | 0.049† (0.008, 0.090) | 0.022 |
| Right basal ganglia | 0.033† (0.003–0.064) | 0.037 | 0.038† (0.003, 0.073) | 0.039 |
| Left basal ganglia | 0.026 (−0.007 to 0.059) | 0.126 | 0.038† (0.001, 0.075) | 0.048 |
| Right thalamus | 0.037† (0.013–0.062) | 0.004 | 0.040†(0.014, 0.065) | 0.004 |
| Left thalamus | 0.037† (0.010–0.063) | 0.009 | 0.044† (0.016, 0.073) | 0.004 |
| Right PLIC | 0.040† (0.018–0.063) | 0.001 | 0.040† (0.014, 0.066) | 0.004 |
| Left PLIC | 0.037† (0.014–0.059) | 0.002 | 0.045† (0.020, 0.069) | 0.001 |
| Pons | 0.016 (−0.002 to 0.035) | 0.094 | 0.017 (−0.005, 0.039) | 0.145 |
| Cerebellar white matter | 0.014 (−0.007 to 0.035) | 0.192 | 0.015 (−0.008, 0.039) | 0.200 |
Adjusted for presence of PPHN, days of ventilator support, use of inotropes, and presence of a significant PDA.
P < 0.05.
β is the expected change in ADC for a 0.1 unit increase in RI.
Table 3 shows the receiver-operating characteristic AUCs for RI, Apgar scores, and combination of RI and Apgar scores in distinguishing ADC above or below 1000 by DTI MRI. The AUC was greater than 0.8 for RI and ADC in bilateral thalamus and left cerebellar white matter. When combined with Apgar scores, the RI increased the AUC to exceed that of RI alone or Apgar alone in left thalamus, bilateral PLIC, pons, and right cerebellar white matter.
TABLE 3.
ROC AUC) for Distinguishing ADC ≥1000 or <1000 in 32 Neonates With Data for RI, Apgar, ADC on DOL 9 or earlier
| ROC Analysis | |||||
|---|---|---|---|---|---|
| ADC Region | N Below 1000 | AUC | Best Threshold* | Sensitivity | Specificity |
| HUS RI | |||||
| Thalamus (R) | 2 | 1.00 | 0.50 | 1.00 | 1.00 |
| Thalamus (L) | 3 | 0.84 | 0.52 | 0.67 | 1.00 |
| PLIC (R) | 6 | 0.83 | 0.40 | 0.67 | 0.96 |
| PLIC (L) | 11 | 0.73 | 0.49 | 0.45 | 0.90 |
| Pons | 5 | 0.69 | 0.09 | 1.00 | 0.37 |
| CerWM (R) | 4 | 0.66 | 0.13 | 0.75 | 0.68 |
| CerWM (L) | 2 | 0.92 | 0.06 | 1.00 | 0.83 |
| Apgar score at 1 and 5 min | |||||
| Thalamus (R) | 2 | 0.68 | 0.07 | 1.00 | 0.50 |
| Thalamus (L) | 3 | 0.71 | 0.09 | 1.00 | 0.48 |
| PLIC (R) | 6 | 0.72 | 0.19 | 0.67 | 0.73 |
| PLIC (L) | 11 | 0.65 | 0.39 | 0.73 | 0.57 |
| Pons | 5 | 0.59 | 0.11 | 1.00 | 0.22 |
| CerWM (R) | 4 | 0.73 | 0.40 | 0.50 | 1.00 |
| CerWM (L) | 2 | 0.65 | 0.07 | 1.00 | 0.57 |
| HUS RI + Apgar score at 1 and 5 min | |||||
| Thalamus (R) | 2 | 1.00 | 0.50 | 1.00 | 1.00 |
| Thalamus (L) | 3 | 0.87 | 0.56 | 0.67 | 1.00 |
| PLIC (R) | 6 | 0.84 | 0.59 | 0.67 | 1.00 |
| PLIC (L) | 11 | 0.78 | 0.33 | 0.82 | 0.71 |
| Pons | 5 | 0.76 | 0.10 | 1.00 | 0.56 |
| CerWM (R) | 4 | 0.80 | 0.19 | 0.75 | 0.82 |
| CerWM (L) | 2 | 0.90 | 0.06 | 1.00 | 0.80 |
Selected by Youden’s index, the threshold with the largest total sum of sensitivity and specificity.27
ROC indicates receiver-operating characteristic.
DISCUSSION
We found that low RI measurements in the ACA are associated with low ADC scalars in brain MRI. Low RI values in the infants' cerebral arteries reflects pressure-passive blood flow and can be a surrogate marker of autoregulatory dysfunction.3,5 Therefore, our results suggest that neonates with low RI values may be at risk for worse brain injury detected by DTI. These results expound on earlier findings that lower RI portends worse clinical outcome—low RI values indicate more severe brain injury, which can lead to the poorer outcomes.6,9,10,28–30
Combining the RI with Apgar scores increased the ability to distinguish whether a neonate had regional ADC values less than 1000 or 1000 or greater compared with RI alone or Apgar scores alone. Thus, RI may be used with other clinical markers to assess which neonates may be at risk for more severe neurologic injury.
We published that dysfunctional autoregulation measured by correlating continuous arterial blood pressure and near infrared spectroscopy (NIRS) is associated with greater brain injury on MRI and poorer neurocognitive outcomes.22,23,25,26,31–33 However, NIRS autoregulation monitoring requires an accurate arterial blood pressure catheter and software to calculate autoregulation indices. These resources are not always available and obtaining an arterial catheter can be challenging early in the neonatal intensive care unit course. Head ultrasound, then, may be able to offer a noninvasive, rapid method to potentially assess autoregulation, which could identify those neonates who may benefit from continuous autoregulation monitoring.
Epelman et al11 previously demonstrated good diagnostic accuracy of head ultrasound using state-of-the-art techniques. Epelman et al11 noted that RI alone was not a good marker for injury from HIE, in contradiction to our findings. There are several potential reasons for this difference; first, we included a narrow subgroup of infants in this study, namely those who underwent TH for clinical diagnosis of HIE whereas Epelman et al11 included any encephalopathic neonate who underwent MRI, most commonly for the indication of seizure. Second, neonates in the Epelman study were imaged from days of life 1 to 44, whereas infants in our MRI analysis were only included if DTI was performed during days of life 4 and 9. The RI values in this study were obtained after rewarming as well.
Although HUS is operator-dependent, RI values are particularly reproducible by trained operators. As shown in our study, RI values can assess brain parenchymal injury, which can often subtle on gray scale qualitative assessment. The RI values may assist clinicians with early clinical decision making to identify neonates at greatest risk of brain injury who might benefit from optimization of blood pressure management or adjuvant treatments until an MRI is feasible.
There are several limitations to this study. We conducted this observational study at a single, academic neonatal intensive care unit with a relatively small cohort. Not all infants had a brain MRI performed in the first 9 days of life, so ADC could not be analyzed in the entire cohort. Rapid brain injury evolution in severe HIE could affect the ability of RI to predict future brain MRI,5,34 and additional studies are needed in larger cohorts that include more babies with severe HIE.
In conclusion, RI can serve as a first screening neuroimaging marker for brain injury in HIE. Resistive index can be used to identify neonates at greatest risk of brain injury who could benefit from adjuvant treatments early in cooled HIE neonates before an MRI can be obtained after TH.
TABLE 1.
Demographics for 75 Neonates
| n | Mean (SD) or n (%) | |
|---|---|---|
| Sex (male) | 75 | 44 (59%) |
| Vasopressor (any) | 75 | 50 (67%) |
| Seizures | 75 | 28 (37%) |
| HIE score (from 1 to 8), median (IQR) | 75 | 6 (5,7) |
| 1-min Apgar, median (IQR) | 72 | 1 (1,2) |
| 5-min Apgar, median (IQR) | 73 | 3 (2,5) |
| 10-min Apgar, median (IQR) | 66 | 5 (3,7) |
| Base excess (mEq/L) | 50 | −15.6 (7.1) |
| Cord PH | 56 | 6.9 (0.2) |
| HUS-2 RI, without pressure | 69 | 0.63 (0.11) |
Acknowledgments
The JHU-SOM Clinician Scientist Award, The Sutland-Pakula Endowment for Neonatal Research provided funding for authors F.J.N. (RO1HD070996, RO1HD086058, R21AG061643), A.T.B. (RO1HD086058), and R.C.V. (KO8NS096115, 3K08NS096115–03S1).
Footnotes
The authors declare no conflicts of interest.
REFERENCES
- 1.Chao CP, Zaleski CG, Patton AC. Neonatal hypoxic-ischemic encephalopathy: multimodality imaging findings. Radiographics. 2006; 26(suppl 1):S159–S172. [DOI] [PubMed] [Google Scholar]
- 2.Massaro AN, Govindan RB, Vezina G, et al. Impaired cerebral autoregulation and brain injury in newborns with hypoxic-ischemic encephalopathy treated with hypothermia. J Neurophysiol. 2015;114: 818–824. [DOI] [PMC free article] [PubMed] [Google Scholar]
- 3.Blankenberg FG, Loh NN, Norbash AM, et al. Impaired cerebrovascular autoregulation after hypoxic-ischemic injury in extremely low-birth-weight neonates: detection with power and pulsed wave Doppler US. Radiology. 1997;205:563–568. [DOI] [PubMed] [Google Scholar]
- 4.Archer LN, Levene MI, Evans DH. Cerebral artery Doppler ultrasonography for prediction of outcome after perinatal asphyxia. Lancet. 1986;2:1116–1118. [DOI] [PubMed] [Google Scholar]
- 5.Salas J, Tekes A, Hwang M, et al. Head ultrasound in neonatal hypoxic-ischemic injury and its mimickers for clinicians: a review of the patterns of injury and the evolution of findings over time. Neonatology. 2018;114:185–197. [DOI] [PubMed] [Google Scholar]
- 6.Gerner GJ, Burton VJ, Poretti A, et al. Transfontanellar duplex brain ultrasonography resistive indices as a prognostic tool in neonatal hypoxic-ischemic encephalopathy before and after treatment with therapeutic hypothermia. J Perinatol. 2016;36:202–206. [DOI] [PMC free article] [PubMed] [Google Scholar]
- 7.Jongeling BR, Badawi N, Kurinczuk JJ, et al. Cranial ultrasound as a predictor of outcome in term newborn encephalopathy. Pediatr Neurol. 2002;26:37–42. [DOI] [PubMed] [Google Scholar]
- 8.Skranes JH, Elstad M, Thoresen M, et al. Hypothermia makes cerebral resistance index a poor prognostic tool in encephalopathic newborns. Neonatology. 2014;106:17–23. [DOI] [PubMed] [Google Scholar]
- 9.Stark JE, Seibert JJ. Cerebral artery Doppler ultrasonography for prediction of outcome after perinatal asphyxia. J Ultrasound Med. 1994;13: 595–600. [DOI] [PubMed] [Google Scholar]
- 10.Liao HT, Hung KL. Anterior cerebral artery Doppler ultrasonography for prediction of outcome after perinatal asphyxia. Zhonghua Min Guo Xiao Er Ke Yi Xue Hui Za Zhi. 1997;38:208–212. [PubMed] [Google Scholar]
- 11.Epelman M, Daneman A, Kellenberger CJ, et al. Neonatal encephalopathy: a prospective comparison of head US and MRI. Pediatr Radiol. 2010; 40:1640–1650. [DOI] [PubMed] [Google Scholar]
- 12.Rüegger CM, Davis PG, Cheong JL. Xenon as an adjuvant to therapeutic hypothermia in near-term and term newborns with hypoxic-ischaemic encephalopathy. Cochrane Database Syst Rev. 2018;8:CD012753. [DOI] [PMC free article] [PubMed] [Google Scholar]
- 13.Juul SE, Comstock BA, Heagerty PJ, et al. High-dose erythropoietin for asphyxia and encephalopathy (HEAL): a randomized controlled trial—background, aims, and study protocol. Neonatology. 2018;113:331–338. [DOI] [PMC free article] [PubMed] [Google Scholar]
- 14.Sheng L, Li Z. Adjuvant treatment with monosialoganglioside may improve neurological outcomes in neonatal hypoxic-ischemic encephalopathy: a meta-analysis of randomized controlled trials. PLoS One. 2017;12:e0183490. [DOI] [PMC free article] [PubMed] [Google Scholar]
- 15.Hagag AA, El Frargy MS, Abd El-Latif AE. Vitamin D as an adjuvant therapy in neonatal hypoxia: is it beneficial? Endocr Metab Immune Disord Drug Targets. 2019;19:341–348. [DOI] [PMC free article] [PubMed] [Google Scholar]
- 16.Malin GL, Morris RK, Khan KS. Strength of association between umbilical cord pH and perinatal and long term outcomes: systematic review and meta-analysis. BMJ. 2010;340:c1471. [DOI] [PMC free article] [PubMed] [Google Scholar]
- 17.Laptook AR, Shankaran S, Ambalavanan N, et al. Outcome of term infants using Apgar scores at 10 minutes following hypoxic-ischemic encephalopathy. Pediatrics. 2009;124:1619–1626. [DOI] [PMC free article] [PubMed] [Google Scholar]
- 18.Victory R, Penava D, Da Silva O, et al. Umbilical cord pH and base excess values in relation to adverse outcome events for infants delivering at term. Am J Obstet Gynecol. 2004;191:2021–2028. [DOI] [PubMed] [Google Scholar]
- 19.Ross MG, Gala R. Use of umbilical artery base excess: algorithm for the timing of hypoxic injury. Am J Obstet Gynecol. 2002;187:1–9. [DOI] [PubMed] [Google Scholar]
- 20.Ehrenstein V. Association of Apgar scores with death and neurologic disability. Clin Epidemiol. 2009;1:45–53. [DOI] [PMC free article] [PubMed] [Google Scholar]
- 21.Shankaran S, Laptook AR, Ehrenkranz RA, et al. Whole-body hypothermia for neonates with hypoxic-ischemic encephalopathy. N Engl J Med. 2005;353:1574–1584. [DOI] [PubMed] [Google Scholar]
- 22.Howlett JA, Northington FJ, Gilmore MM, et al. Cerebrovascular autoregulation and neurologic injury in neonatal hypoxic-ischemic encephalopathy. Pediatr Res. 2013;74:525–535. [DOI] [PMC free article] [PubMed] [Google Scholar]
- 23.Lee JK, Poretti A, Perin J, et al. Optimizing cerebral autoregulation may decrease neonatal regional hypoxic-ischemic brain injury. Dev Neurosci. 2017;39:248–256. [DOI] [PMC free article] [PubMed] [Google Scholar]
- 24.Bednarek N, Mathur A, Inder T, et al. Impact of therapeutic hypothermia on MRI diffusion changes in neonatal encephalopathy. Neurology. 2012;78: 1420–1427. [DOI] [PMC free article] [PubMed] [Google Scholar]
- 25.Tekes A, Poretti A, Scheurkogel MM, et al. Apparent diffusion coefficient scalars correlate with near-infrared spectroscopy markers of cerebrovascular autoregulation in neonates cooled for perinatal hypoxic-ischemic injury. Am J Neuroradiol. 2015;36: 188–193. [DOI] [PMC free article] [PubMed] [Google Scholar]
- 26.Carrasco M, Perin J, Jennings JM, et al. Cerebral autoregulation and conventional and diffusion tensor imaging magnetic resonance imaging in neonatal hypoxic-ischemic encephalopathy. Pediatr Neurol. 2018;82: 36–43. [DOI] [PMC free article] [PubMed] [Google Scholar]
- 27.Schisterman EF, Perkins NJ, Liu A, et al. Optimal cut-point and its corresponding Youden index to discriminate individuals using pooled blood samples. Epidemiology. 2005;16:73–81. [DOI] [PubMed] [Google Scholar]
- 28.Ilves P, Lintrop M, Talvik I, et al. Changes in cerebral and visceral blood flow velocities in asphyxiated term neonates with hypoxic-ischemic encephalopathy. J Ultrasound Med. 2009;28:1471–1480. [DOI] [PubMed] [Google Scholar]
- 29.Liu J, Cao H-Y, Huang X- H, et al. The pattern and early diagnostic value of Doppler ultrasound for neonatal hypoxic-ischemic encephalopathy. J Trop Pediatr. 2007;53:351–354. [DOI] [PubMed] [Google Scholar]
- 30.Pinto PS, Tekes A, Singhi S, et al. White-gray matter echogenicity ratio and resistive index: sonographic bedside markers of cerebral hypoxic-ischemic injury/edema? J Perinatol. 2012;32: 448–453. [DOI] [PMC free article] [PubMed] [Google Scholar]
- 31.Burton VJ, Gerner G, Cristofalo E, et al. A pilot cohort study of cerebral autoregulation and 2-year neurodevelopmental outcomes in neonates with hypoxic-ischemic encephalopathy who received therapeutic hypothermia. BMC Neurol. 2015;15:209. [DOI] [PMC free article] [PubMed] [Google Scholar]
- 32.Chavez-Valdez R, O'Connor M, Perin J, et al. Sex-specific associations between cerebrovascular blood pressure autoregulation and cardiopulmonary injury in neonatal encephalopathy and therapeutic hypothermia. Pediatr Res. 2017;81:759–766. [DOI] [PMC free article] [PubMed] [Google Scholar]
- 33.Lee JK, Perin J, Parkinson C, et al. Relationships between cerebral autoregulation and markers of kidney and liver injury in neonatal encephalopathy and therapeutic hypothermia. J Perinatol. 2017;37: 938–942. [DOI] [PMC free article] [PubMed] [Google Scholar]
- 34.Barkovich AJ, Miller SP, Bartha A, et al. MR imaging, MR spectroscopy, and diffusion tensor imaging of sequential studies in neonates with encephalopathy. AJNR Am J Neuroradiol. 2006;27:533–547. [PMC free article] [PubMed] [Google Scholar]