

Abstract
Mammalian TFEB and TFE3, as well as their ortholog in Caenorhabditis elegans HLH‐30, play an important role in mediating cellular response to a variety of stress conditions, including nutrient deprivation, oxidative stress, and pathogen infection. In this study, we identify a novel mechanism of TFEB/HLH‐30 regulation through a cysteine‐mediated redox switch. Under stress conditions, TFEB‐C212 undergoes oxidation, allowing the formation of intermolecular disulfide bonds that result in TFEB oligomerization. TFEB oligomers display increased resistance to mTORC1‐mediated inactivation and are more stable under prolonged stress conditions. Mutation of the only cysteine residue present in HLH‐30 (C284) significantly reduced its activity, resulting in developmental defects and increased pathogen susceptibility in worms. Therefore, cysteine oxidation represents a new type of TFEB post‐translational modification that functions as a molecular switch to link changes in redox balance with expression of TFEB/HLH‐30 target genes.
Keywords: glutathionylation, HLH‐30, lysosomes, TFE3, TFEB
Subject Categories: Membrane & Intracellular Transport; Post-translational Modifications, Proteolysis & Proteomics
Oxidative stress‐induced glutathionylation or formation of an intermolecular disulfide bond boosts the activity of transcription factor TFEB/HLH‐30 in mammalian cells, and regulates development and pathogen resistance in Caenorhabditis elegans.

Introduction
Animals have the ability to adapt to numerous internal and external perturbations, thus ensuring organismal homeostasis throughout their lifetime. In recent years, the MiT/TFE family of basic helix–loop–helix leucine‐zipper transcription factors has emerged as a critical component of the cellular response to stress (Raben & Puertollano, 2016). The MiT/TFE family includes four members, MITF, TFEB, TFE3, and TFEC, which are present in most metazoan organisms and can heterodimerize with each other (Steingrimsson et al, 2004; Pogenberg et al, 2012). In contrast, only one member of the family is present in Drosophila melanogaster and Caenorhabditis elegans, termed Mitf and HLH‐30, respectively (Rehli et al, 1999; Hallsson et al, 2004).
TFEB and TFE3, as well as its C. elegans ortholog HLH‐30, are activated in response to a variety of stressors, including starvation (Settembre et al, 2011; Martina et al, 2012; Roczniak‐Ferguson et al, 2012; Settembre et al, 2012; O'Rourke & Ruvkun, 2013; Settembre et al, 2013; Martina et al, 2014), oxidative stress (Zhang et al, 2016; Martina & Puertollano, 2018; Sharma et al, 2018), DNA damage (Brady et al, 2018; Slade et al, 2020), accumulation of unfolded proteins (Martina et al, 2016), mitochondrial stress (Nezich et al, 2015; Bennett et al, 2017), and pathogen infection (Visvikis et al, 2014; Campbell et al, 2015; Gray et al, 2016; Pastore et al, 2016). Thus, stress‐dependent activation of MiT/TFE family members appears to be conserved across metazoan, allowing the coordinate initiation of multiple stress response pathways that lead to the repair and elimination of damaged macromolecules and organelles, the preservation of cellular functions, and, ultimately, the restoration of cellular homeostasis. In cases in which the damage is too extensive, TFEB and TFE3 can promote the elimination or proliferative inactivation of aberrant cells by regulating cell cycle and cell death (Martina et al, 2016; Brady et al, 2018).
Phosphorylation plays a critical role in the regulation of TFEB and TFE3 activation by modulating their intracellular distribution. Under basal (non‐stressed) conditions, TFEB and TFE3 are recruited to the surface of lysosomes through their ability to interact with active Rag GTPases (Martina & Puertollano, 2013). This interaction brings TFEB and TFE3 in close proximity to the serine/threonine kinase mTORC1, which phosphorylates the transcription factors on multiple residues (Martina et al, 2012; Roczniak‐Ferguson et al, 2012; Settembre et al, 2012; Martina et al, 2014). mTORC1‐dependent phosphorylation of TFEB on serine 211 (S211) and TFE3 on S321 (S321) creates a binding site for the cytosolic chaperone 14‐3‐3, resulting in sequestration of TFEB and TFE3 in the cytosol (Martina et al, 2012; Roczniak‐Ferguson et al, 2012; Martina et al, 2014). In addition to mTORC1, other kinases are likely to participate in TFEB/TFE3 regulation (Puertollano et al, 2018).
Stresses that cause dephosphorylation of TFEB‐S211 and TFE3‐S321, for example by inactivation of the mTORC1 kinase (Martina et al, 2012; Roczniak‐Ferguson et al, 2012; Settembre et al, 2012; Martina et al, 2014) or activation of specific phosphatases, such as calcineurin or PP2A (Medina et al, 2015; Martina & Puertollano, 2018), induce dissociation of the TFEB (or TFE3)/14‐3‐3 complex and consequent translocation of the transcription factors into the nucleus. In the nucleus, TFEB and TFE3 induce the expression of hundreds of genes, allowing activation and coordination of multiple stress pathways. This results in increased cellular clearance by promoting induction of autophagy, enhanced lysosomal biogenesis and activity, and changes in lysosomal positioning (Sardiello et al, 2009; Settembre et al, 2011; Lapierre et al, 2013; O'Rourke & Ruvkun, 2013; Willett et al, 2017), as well as maintenance of energy homeostasis via modulation of mitochondrial activity and expression of key metabolic regulators (Settembre et al, 2013; Wada et al, 2016; Pastore et al, 2017). In particular cell types, or in response to specific types of stress, TFEB and TFE3 have also shown to play an important role in immune response (Visvikis et al, 2014; Gray et al, 2016; Pastore et al, 2016; Murano et al, 2017), protein synthesis and folding (Song et al, 2013; Martina et al, 2016), DNA repair (Brady et al, 2018; Slade et al, 2020), and differentiation (Steingrimsson et al, 2002; Villegas et al, 2019).
In addition to phosphorylation, it is very likely that other types of post‐translational modifications influence TFEB and TFE3 activation. For example, TFEB acetylation regulates its dimerization and transcriptional activity (Bao et al, 2016; Zhang et al, 2018; Wang et al, 2020), while ubiquitination mediates degradation of inactive TFEB (Sha et al, 2017). Furthermore, most studies have analyzed the role of TFEB and TFE3 in response to acute stress conditions, but little is known about potential mechanisms to allow sustained TFEB and TFE3 activation under chronic stress.
In this study, we characterize a novel mechanism of TFEB and TFE3 regulation. We describe the presence of a cysteine‐based redox switch that controls the shift between TFEB and TFE3 oligomeric states. Detachment of 14‐3‐3 following stress exposes a single cysteine residue that undergoes ROS‐dependent disulfide‐bond formation, resulting in the assembly of TFEB and TFE3 oligomers. Oligomer formation is rapid and reversible, and occurs in response to a variety of stresses both in vitro and in vivo. Oligomers are further stabilized under prolonged stress conditions and show increased resistance to inactivation. In C. elegans, inhibition of oligomers assembly also affects HLH‐30 activity, resulting in deleterious phenotypes like developmental delay, altered dauer function, and increased pathogen susceptibility. Our findings reveal a novel and evolutionary conserved mechanism important to maintain MiT/TFE transcription factors activation under prolonged stress conditions.
Results
TFEB and TFE3 form high molecular weight oligomers in response to different stress conditions
We recently described that TFEB and TFE3 are activated in response to oxidative stress (Martina & Puertollano, 2018). During the course of these experiments, we made an intriguing observation. We found that when cell lysates were analyzed under non‐reducing conditions, a setting that better mimics the cellular environment under oxidative stress, recombinant TFEB appeared not only as the ~ 65 kDa monomer typically seen under reducing conditions, but also as high molecular weight oligomers (Fig 1A). In some cases, we also detected a faint band of around 130 kDa that may correspond to dimers (Fig 1A). TFEB dimerization is mediated by a leucine‐zipper domain (Pogenberg et al, 2012). Since this is a non‐covalent interaction, dimers most likely dissociate in the presence of detergent (Meng et al, 2001), thus explaining the difficulty of visualizing them in SDS–PAGE.
Figure 1. TFEB and TFE3 oligomerization in response to stress conditions.
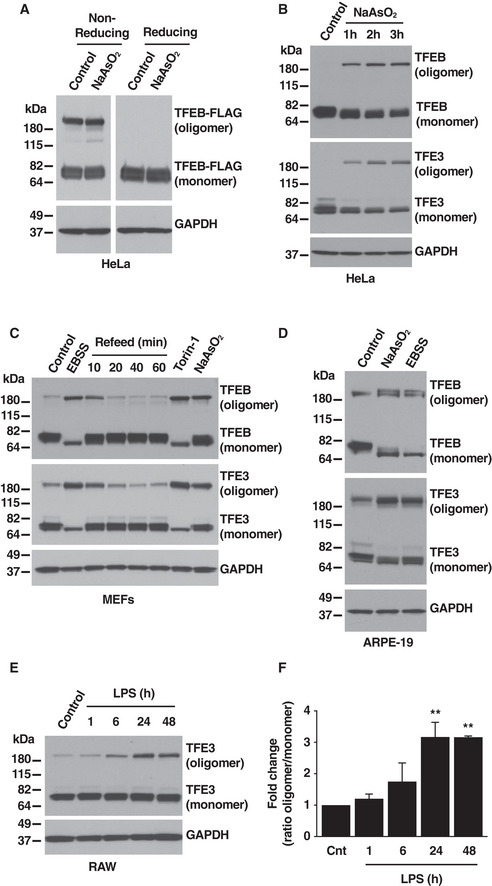
- Immunoblot analysis of protein lysates from HeLa cells stably expressing TFEB‐FLAG treated with 250 μM NaAsO2 for 1 h run under either non‐reducing or reducing conditions.
- Immunoblot analysis of protein lysates from HeLa cells treated with 250 μM of NaAsO2 for the indicated times and run under non‐reducing conditions.
- Immunoblot analysis of protein lysates from MEF cells treated with EBSS, 250 nM Torin‐1, or 100 μM NaAsO2 for 1 h and run under non‐reducing conditions. For refeed condition, starved cells were incubated in complete medium for the indicated times.
- Immunoblot analysis of protein lysates from ARPE‐19 cells treated with 250 μM NaAsO2 or EBSS for 1 h and run under non‐reducing conditions.
- Immunoblot analysis of protein lysates from Raw 264.7 cells treated with 1 μg/ml LPS for the indicated times and run under non‐reducing conditions. Immunoblots are representative of at least three independent experiments.
- Quantification of oligomer versus monomer ratios from Raw 264.7 cells treated with 1 μg/ml LPS, as shown in (E). Quantified results are fold change of oligomer versus monomer ratios from its corresponding vehicle‐treated cells. Data are presented as mean ± SD using one‐way ANOVA **P < 0.01, from two independent experiments.
Source data are available online for this figure.
To rule out potential artifacts due to TFEB overexpression, we analyzed endogenous TFEB and TFE3 in HeLa cells untreated or treated with sodium arsenite (NaAsO2), a well‐known oxidative stressor, for different periods of time. Interestingly, we observed that in basal conditions, TFEB and TFE3 appeared almost exclusively as monomers. However, oligomers quickly formed upon exposure to NaAsO2, suggesting that this conformational change could be important in regulating the cellular function of TFEB and TFE3 during stress responses (Fig 1B).
We next monitored oligomer formation in other cell types in response to a variety of stress conditions. In mouse embryonic fibroblasts (MEFs), increased TFEB and TFE3 oligomer formation occurred not only in response to oxidative stress but also under other conditions known to cause TFEB and TFE3 activation, such as starvation and inhibition of mTORC1 by Torin‐1 (Fig 1C). Furthermore, when starved cells were placed back in complete medium (refeed) the oligomers rapidly dissociated, indicating that the process of oligomer formation is reversible and highly dynamic (Fig 1C). Increased TFEB and TFE3 oligomer formation in response to starvation and oxidative stress was also observed in ARPE‐19 cells (Fig 1D). Finally, a significant increase in the TFE3 oligomer/monomer ratio was seen in RAW 246.7 cells after activation with LPS (Fig 1E and F). In agreement with our previous observations, the higher degree of oligomerization corresponded to those times (24h and 48h) at which we had reported maximal TFE3 nuclear accumulation (Pastore et al, 2016).
We also observed that TFEB and TFE3 can form oligomers independently of each other. For example, increase in TFE3 oligomerization in response to different types of stress was comparable between wild‐type MEFs (MEF‐WT) and MEFs depleted of TFEB (MEF‐TFEB‐KO) (Fig EV1A). Likewise, endogenous TFEB and TFE3 formed oligomers in RAW 264.7 cells depleted of TFE3 and TFEB, respectively (Fig EV1B).
Figure EV1. Oligomerization of TFEB or TFE3 is independent of each other.
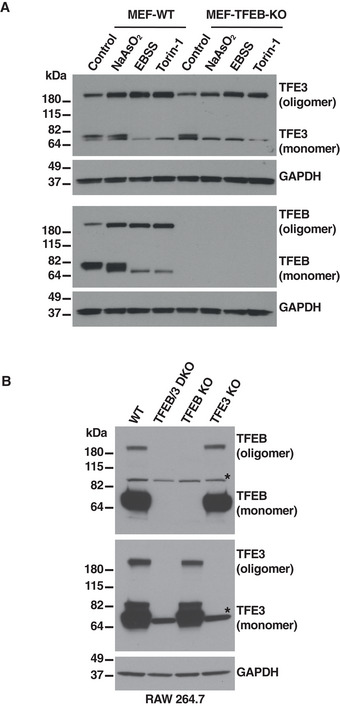
- Immunoblot analysis of protein lysates from MEFs wild‐type (WT) or MEFs TFEB knockout treated with 100 μM NaAsO2, EBSS, or 250 nM Torin‐1 for 1 h run under non‐reducing conditions.
- Immunoblot analysis of protein lysates from RAW 264.7 cells wild type (WT), TFEB/TFE3 double knockout (DKO), TFEB knockout or TFE3 knockout run under non‐reducing conditions. Asterisks indicate non‐specific protein bands recognized by the antibodies.
Source data are available online for this figure.
Therefore, our results indicate that TFEB and TFE3 oligomerization correlates with their activation, is highly dynamic and reversible, and occurs in multiple cell types and in response to different types of stress.
A single cysteine residue in TFEB and TFE3 mediates oligomerization
Redox‐regulated changes in a protein quaternary structure are often mediated by cysteine residues. Exposure of a cysteine thiol to reactive oxygen species (ROS) results in the formation of a sulfenic acid (–RSOH), which can react with GSH (glutathionylation) or with a nearby cysteine to form a reversible inter or intramolecular disulfide bond (Poole et al, 2004; Rehder & Borges, 2010).
Sequence alignment of TFEB homologs revealed the presence of a cysteine residue in position 212 (human TFEB) that is highly conserved between different vertebrate species (Fig 2A). This residue is interesting for several reasons. First, most TFEB homologs present only one cysteine residue in their entire sequence; second, C212 is adjacent to S211, which plays a critical role in TFEB regulation by mediating interaction with 14‐3‐3 and subsequent cytoplasmic retention; and third, a cysteine residue is also present in TFE3 in an equivalent position (C322 in human TFE3; Fig 2B).
Figure 2. TFEB and TFE3 oligomerization is mediated by a single cysteine residue.

- Multi sequence alignment of TFEB orthologs showing conserved homology between different species of the region containing TFEB Cysteine 212.
- Sequence homology analysis between human TFEB and TFE3 depicting the region containing the single cysteine residue in the entire proteins. Multi sequence alignment of TFE3 orthologs showing conserved homology between different species of the region containing TFE3 Cysteine 322.
- Immunoblot analysis of protein lysates from ARPE‐19 cells expressing TFEB‐FLAG‐WT or mutants treated with 250 μM NaAsO2 or EBSS for 1 h and run under non‐reducing condition.
- Immunoblot analysis of protein lysates from ARPE‐19 cells expressing TFE3‐GFP‐WT or mutants run under non‐reducing condition.
- Immunoblot analysis of co‐immunoprecipitated TFEB‐FLAG and 14‐3‐3 from ARPE‐19 cells overexpressing TFEB‐WT or TFEB‐C212S mutant.
- Immunoblot analysis of co‐immunoprecipitated TFEB‐FLAG, 14‐3‐3 and endogenous TFE3 from ARPE‐19 cells overexpressing TFEB‐WT or TFEB‐C212A mutant. Immunoblots are representative of at least three independent experiments.
Source data are available online for this figure.
To test the involvement of TFEB‐C212 and TFE3‐C322 in oligomer formation, we mutated these residues to either serine or alanine. Our results showed that mutation of C212 or C322 completely abolished oligomer formation under basal or stress conditions (Fig 2C and D). A concern about mutating C212 was the possibility that it may impact proper S211 phosphorylation, thus affecting TFEB localization and interpretation of the data. In fact, mutation of C212 to serine prevented S211 phosphorylation in control conditions, as revealed by our anti‐phospho S211 antibody (Fig 2C), and binding to 14‐3‐3 (Fig 2E). In contrast, substitution of C212 by alanine did not affect phosphorylation of S211 or binding to 14‐3‐3 under control conditions (Fig 2C and F), or S211 dephosphorylation following stress (Fig 2C). Therefore, we focused on the TFEB‐C212A mutant for subsequent experiments.
It is important to note that mutation of C212 does not affect leucine zipper‐dependent dimer formation. It is well established that TFEB forms homodimers and heterodimers with other members of the MiTF/TFE family through its leucine‐zipper domain, and this process is critical to increase the efficiency of DNA binding (Roman et al, 1992; Muhle‐Goll et al, 1994; Pogenberg et al, 2012). As such, both TFEB‐WT and TFEB‐C212A were able to pull‐down endogenous TFE3 (Fig 2F), while TFEB‐C212A and TFE3‐C322A co‐immunoprecipitated as efficiently as TFEB and TFE3 wild‐type (Fig EV2A), thus reflecting their ability to form TFEB/TFE3 heterodimers. Furthermore, a recent study has described that acetylation of K274 and K279 disrupts TFEB dimerization and binding to its target promoters (Wang et al, 2020). However, treatment with MB‐3, an inhibitor of acetylation that stabilizes dimer formation, did not induce oligomer formation, further suggesting that leucine zipper–mediated dimerization and cysteine‐mediated oligomerization are independent processes (Fig EV2B and C).
Figure EV2. Inhibition of acetylation does not induce TFEB or TFE3 oligomerization.

-
AImmunoblot analysis of co‐immunoprecipitated TFEB‐WT and TFE3‐WT and corresponding cysteine mutants from ARPE‐19 cells overexpressing TFEB‐WT‐FLAG, TFE3‐WT‐GFP, TFEB‐C212A‐FLAG, and TFE3‐C322A‐GFP.
-
B, CImmunoblot analysis of protein lysates from ARPE‐19 (B) and HeLa (C) cells treated with 250 μM NaAsO2 or 250 nM Torin‐1 for 1 h, 50 μM MB‐3 for 16 h or a combination of these drugs with MB‐3 and run under non‐reducing condition.
Source data are available online for this figure.
Cysteine 212 undergoes either glutathionylation or formation of disulfide bonds following stress
To further confirm that oxidation plays a role in TFEB and TFE3 oligomerization, we assessed oligomer formation in response to different stressors in the presence or absence of the antioxidant N‐acetyl‐cysteine (NAC). Perhaps not surprisingly, NAC treatment completely abolished TFEB and TFE3 oligomer formation in response to NaAsO2 both in HeLa and ARPE‐19 cells (Figs 3A and B and Fig EV3A and B). Less expected was the observation that NAC also significantly decreased oligomer formation following starvation and Torin‐1 treatment, indicating that oxidative stress contributes to TFEB and TFE3 activation in response to a variety of stressors (Fig 3A and B).
Figure 3. Cysteine 212 glutathionylation and TFEB/14‐3‐3 disassembly are necessary for efficient oligomerization.

- Immunoblot analysis of protein lysates from HeLa cells treated with 250 μM NaAsO2, EBSS, 250 nM Torin‐1, 15 mM NAC, or a combination of these drugs with NAC for 1 h and run under non‐reducing condition.
- Quantification of immunoblot data shown in (A). Data are presented as mean ± SD using one‐way ANOVA *P < 0.05, ***P < 0.001, and ****P < 0.0001 from two independent experiments.
- Higher‐energy collisional dissociation (HCD) spectrum of TFEB‐C212 containing peptide (VGVTSSSCPADL), left top panel indicates the assigned b‐ and y‐fragment ions, and left bottom panel their mass deviations from corresponding theoretical values showing glutathionylation at Cysteine 212. Right panel shows extracted ion chromatograms (XIC) of TFEB glutathionylated peptide from cells either untreated (control) or treated with NaAsO2.
- Immunoblot analysis of protein lysates from ARPE‐19 cells overexpressing TFEB‐FLAG or TFE3‐MYC, treated with 250 nM Torin‐1 for 1 h and run under non‐reducing condition.
- Quantification of immunoblot data shown in (D). Data are presented as mean ± SD using two‐tailed t‐test *P < 0.05 from three independent experiments.
- Immunoblot analysis of protein lysates from ARPE‐19 cells overexpressing TFEB‐FLAG‐WT, TFEB‐FLAG‐S211A, TFE3‐MYC‐WT, or TFE3‐MYC‐S321A and run under non‐reducing condition.
- Quantification of immunoblot data shown in (F). Data are presented as mean ± SD using two‐tailed t‐test *P < 0.05 and **P < 0.01 from three independent experiments.
Source data are available online for this figure.
Figure EV3. Glutathionylation of cysteine 212 in TFEB is required for efficient oligomerization in response to stress.

- Immunoblot analysis of protein lysates from ARPE‐19 cells treated with 250 μM NaAsO2, EBSS, 250 nM Torin‐1, 15 mM NAC, or a combination of these drugs with NAC for 1 h and run under non‐reducing condition.
- Quantification of immunoblot data shown in (A). Data are presented as mean ± SD using one‐way ANOVA *P < 0.05, **P < 0.01 from two independent experiments.
- Extracted ion chromatograms (XIC) of TFEB glutathionylated peptide from cells either untreated (control) or treated with NaAsO2.
- Immunoblot analysis of protein lysates from ARPE‐19 cells expressing TFEB‐FLAG‐WT or TFEB‐C212A‐FLAG.
- Quantification of immunoblot data shown in (D). Data are presented as mean ± SD using two‐tailed t‐test **P < 0.01 from five independent experiments.
- Quantification of immunoblot data shown in (Fig 2F). Data are presented as mean ± SD using two‐tailed t‐test ***P < 0.001 from three independent experiments.
Source data are available online for this figure.
As mentioned earlier, oxidative stress can induce cysteine glutathionylation or formation of disulfide bonds. To better understand the role of C212 in TFEB regulation, we performed mass spectrometry (MS) analysis. Recombinant TFEB‐FLAG was immunoprecipitated from cells treated with or without NaAsO2. The samples were run on non‐reducing SDS–PAGE gels, and the bands corresponding to either monomers or oligomers were isolated and analyzed by MS (Table EV1). The analysis of the band corresponding to monomers revealed that C212 was glutathionylated. Interestingly, the abundance of glutathionylated peptides increased following treatment with NaAsO2 (Fig 3C; results from an independent experiment are shown in Fig EV3C), whereas the abundance of peptides containing both glutathionylation and phosphorylation, decreased under stress, consistent with the described NaAsO2‐induced dephosphorylation of key TFEB residues (Martina & Puertollano, 2018). In contrast, glutathionylation was not detected in oligomers. Furthermore, peptides containing C212 were only found when oligomers were analyzed by MS reducing conditions, suggesting that in the higher molecular weight species the cysteine residues are forming disulfide bonds, thus precluding their identification (Table EV1). Our data are consistent with a model in which dissociation of 14‐3‐3 following stress exposes C212, which is highly reactive. Under these circumstances, C212 may undergo two alternative modifications; it can be glutathionylated or form disulfide bonds, leading to formation of higher molecular weight complexes.
We next investigated the potential interaction between S211 and C212. One interesting possibility is that phosphorylation of S211 and subsequent binding of 14‐3‐3 might prevent the accessibility of C212 to redox modification. In this case, inhibition of 14‐3‐3 binding should result in increased oligomerization. Accordingly, incubation with Torin‐1 or mutation of TFEB‐S211 to alanine (S321 in the case of TFE3), two treatments known to cause dissociation of the TFEB (or TFE3)/14‐3‐3 complex, was sufficient to increase oligomer/monomer ratios considerably (Fig 3D–G). We also explored whether redox modifications of the cysteine residue might influence the phosphorylation of S211. Indeed, we found that mutation of C212 resulted in a significant increase in S211 phosphorylation and 14‐3‐3 binding, suggesting that glutathionylation or formation of disulfide bonds may compete with the phosphorylation of S211 (Fig EV3D–F).
Altogether our results suggest two mutually exclusive states for TFEB and TFE3. In basal conditions, 14‐3‐3 binding to the transcription factors protects the cysteine residue from oxidation and prevents oligomer formation. Following stress, TFEB‐S211 and TFE3‐S321 dephosphorylation and subsequent 14‐3‐3 dissociation exposes the cysteine that undergoes either glutathionylation or formation of disulfide bonds, changing the quaternary structure of the protein.
Oligomerization is not required for TFEB activation in response to stress
Next, we investigated the physiological function of TFEB and TFE3 oligomers. We first assessed whether oligomerization affects TFEB activation. For this, we infected ARPE‐19 cells with adenovirus expressing either FLAG‐tagged TFEB‐WT or TFEB‐C212A and measured the intracellular distribution of these proteins under control and stress conditions. We did not detect significant differences in the nuclear translocation of TFEB‐WT and TFEB‐C212A in response to starvation or NaAsO2 (Fig 4A and B). Comparable activation of TFEB‐WT and TFEB‐C212A was also observed in RAW 264.7 cells treated with LPS (Fig EV4A). Likewise, both proteins exited the nucleus to a similar degree following refeed after starvation, suggesting that the oligomers are not preferentially retained in the nucleus (Fig 4B).
Figure 4. TFEB activation in response to stress does not require oligomerization.

- Immunofluorescence confocal microscopy of ARPE‐19 cells overexpressing TFEB‐FLAG‐WT or TFEB‐FLAG‐C212A showing the subcellular distribution of recombinant TFEB in response to treatments with EBSS for 4 h or 250 μM NaAsO2 for 1 h. Scale bars, 10 μm.
- Quantification of the nuclear localization of recombinant TFEB in ARPE‐19 cells treated with 250 μM NaAsO2 for 1 h or EBSS for 4h and incubated in complete medium (refeed) for the indicated times. Data are presented as mean ± SD using two‐way ANOVA, (ns) not significant as compared to the same treatment in TFEB‐WT overexpressing cells, with > 200 cells counted per trial from three independent experiments.
- Immunoblot analysis of protein lysates from MEF cells treated with EBSS, 250 nM Torin‐1, or 100 μM NaAsO2 for 1 h, subjected to subcellular fractionation and run under non‐reducing condition.
- Relative quantitative RT–PCR analysis of the mRNA expression of autophagy‐ (UVRAG), mitochondria‐ (PGC‐1α) and lysosome (MCOLN1, ATPV1C1, and HEXA)‐related genes in ARPE‐19 cells overexpressing TFEB‐FLAG‐WT or TFEB‐FLAG‐C212A. Data are presented as mean ± SD using two‐way ANOVA, (ns) not significant as compared to the same gene in TFEB‐WT overexpressing cells, from three independent experiments.
Source data are available online for this figure.
Figure EV4. TFEB dissociation from lysosomes is not affected by the absence of cysteine 212 glutathionylation in response to oxidative stress.
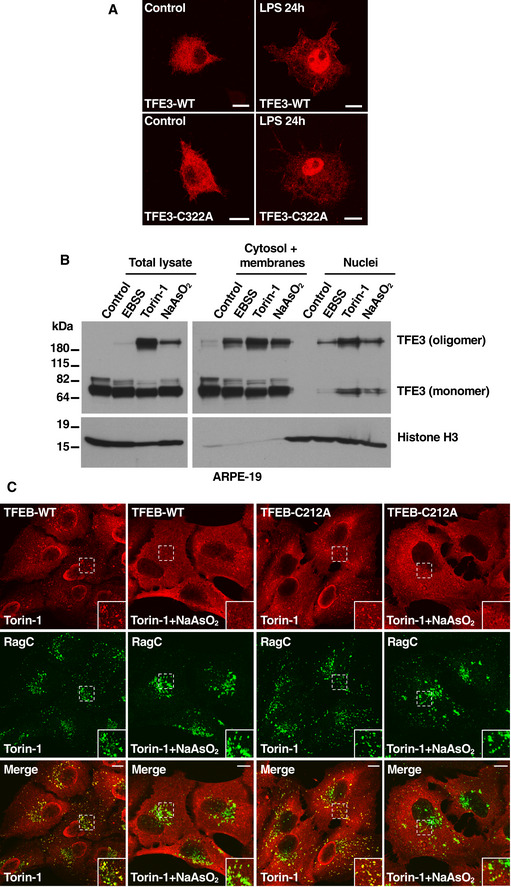
- Immunofluorescence confocal microscopy of RAW 264.7 cells overexpressing TFE3‐FLAG‐WT or TFE3‐FLAG‐C322A untreated (control) or treated with 1 μg/ml LPS for 24 h. Scale bars, 10 μm.
- Immunoblot analysis of protein lysates from ARPE‐19 cells treated with EBSS, 250 nM Torin‐1, or 250 μM NaAsO2 for 1 h, subjected to subcellular fractionation and run under non‐reducing condition.
- Immunofluorescence confocal microscopy of ARPE‐19 cells overexpressing TFEB‐FLAG‐WT or TFEB‐FLAG‐C212A showing lysosomal colocalization with RagC (yellow color in merge images) in the presence of 250 nM Torin‐1 or Torin‐1 in combination with 300 μM NaAsO2 treatment for 1 h. Insets represent a 1.85‐fold magnification of the indicated area. Scale bars, 10 μm.
Source data are available online for this figure.
These results were confirmed by subcellular fractionation. Experiments in MEFs and ARPE‐19 showed an increase in nuclear TFEB and TFE3 in response to different stressors, including starvation, Torin‐1 and NaAsO2. However, TFEB and TFE3 oligomers were present both in nuclear and cytosolic fractions, arguing against the accumulation of oligomers in a specific cellular compartment (Figs 4, EV4).
We also addressed whether C212 may affect the interaction of TFEB with Rag GTPases. TFEB is recruited to the lysosome surface via interaction with active Rag GTPases, and this association is enhanced by Torin‐1 (Martina & Puertollano, 2013). As seen in Fig EV4C, TFEB‐WT and TFEB‐C212A were efficiently recruited to lysosomes in cells treated with Torin‐1. Furthermore, both proteins rapidly dissociated from lysosomal membranes after incubation with NaAsO2, indicating that the binding between TFEB and Rag GTPases is inhibited by oxidative stress but is not affected by mutation of C212 (Fig EV4C).
Finally, we did not find significant differences in the ability of TFEB‐WT and TFEB‐C212A to induce transcription of well‐known target genes, such as UVRAG, PGCalpha, MCOLN1, ATP6V1C1, and HEXA, under basal conditions (Fig 4D). These results are consistent with our observation that TFEB‐C212A can still form leucine zipper‐dependent homodimers and heterodimers (Figs 2, EV2 and 2, EV2), suggesting that at least under overexpression conditions like the ones achieved with adenovirus expression, the mutant protein can efficiently bind DNA and induce transcription.
TFEB and TFE3 oligomers are more stable than monomers upon prolonged stress conditions
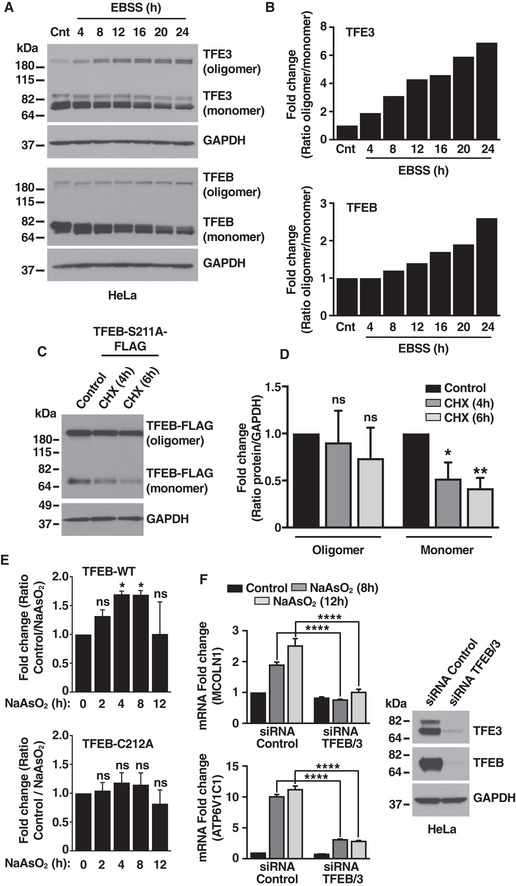
Many of the stressors that induce TFEB and TFE3 activation, such as nutrient deprivation, oxidative stress, or pathogen infection, may persist for long periods of time in vivo. At the same time, changes in the quaternary structure of a protein have been shown to make a critical contribution to its stability (Bleicken & Zeth, 2009; Hashimoto & Panchenko, 2010). Therefore, we monitored endogenous TFEB and TFE3 oligomeric state under conditions of prolonged stress. ARPE‐19 and HeLa cells were treated with NaAsO2 for up to 12 h. Interestingly, under these conditions we observed a progressive disappearance of TFEB and TFE3 monomers (Fig 5A). In contrast, the levels of oligomers remained constant or even increased over time (Fig 5A–C). Between 8 h and 12 h of treatment with NaAsO2, endogenous TFEB and TFE3 were almost exclusively present in their oligomeric form. These data suggest that TFEB and TFE3 monomers might be less stable and easily degraded than their oligomeric form under prolonged stress, although we cannot rule out a rapid and almost complete conversion of monomers into oligomers under these conditions.
Figure 5. Increased stability of TFEB and TFE3 oligomers in response to prolonged stress conditions.

- Immunoblot analysis of protein lysates from ARPE‐19 and HeLa cells treated for the indicated times with 100 μM and 50 μM NaAsO2, respectively, and run under non‐reducing conditions.
- Quantification of immunoblot data shown in (A). Data are presented as mean ± SD using one‐way ANOVA *P < 0.05, **P < 0.01, ***P < 0.001, and ****P < 0.0001 from three independent experiments.
- Quantification of immunoblot data shown in (A). Data are presented as mean ± SD using one‐way ANOVA *P < 0.05, **P < 0.01, and ***P < 0.001 from three independent experiments.
- Immunoblot analysis of protein lysates from ARPE‐19 cells overexpressing TFEB‐FLAG‐WT or TFEB‐FLAG‐C212A treated with 100 μM NaAsO2 for the indicated times and run under non‐reducing conditions.
- Quantification of immunoblot data from TFEB‐WT shown in (D). Data are presented as mean ± SD using one‐way ANOVA *P < 0.05, **P < 0.01, and ***P < 0.001 from three independent experiments. Some error bars are the same size or smaller than the data point symbols.
- Immunofluorescence confocal microscopy of ARPE‐19 cells showing the nuclear localization of TFE3 in response to treatment with 100 μM NaAsO2 for 8 h. Scale bars, 10 μm.
- Relative quantitative RT–PCR analysis of the mRNA expression of lysosome‐related genes (MCOLN1 and ATPV61C1) in ARPE‐19 and HeLa cells treated with 100 μM and 50 μM NaAsO2, respectively, for the indicated times. Data are presented as mean ± SD using one‐way ANOVA *P < 0.05, **P < 0.01, ***P < 0.001 from two independent experiments.
Source data are available online for this figure.
A similar trend was observed with recombinant proteins. Prolonged oxidative stress resulted in a continuing decrease in the amount of monomeric TFEB, while the levels of TFEB oligomers increased, further suggesting that monomeric TFEB is more susceptible to degradation (Fig 5D and E). Although less apparent, a progressive increase in oligomeric forms was also observed under prolonged starvation (Fig EV5A and B). To explore in more detail the different stability of monomers and oligomers, we expressed the TFEB‐S211A mutant in ARPE‐19 cells, which allow us to visualize both monomers and oligomers in basal conditions and performed incubations with cycloheximide (CHX) for different period of time to monitor protein stability. As expected, we observed a significant decrease in the levels of TFEB‐S211A monomers after 4 h and 6 h treatment with CHX, while the oligomers levels were not significantly changed during the same period of time, thus confirming increased oligomer stability (Fig EV5C and D). Furthermore, when the samples corresponding to the experiments shown in Fig 5D and E were run under reducing conditions to better compare total protein levels, we found that the levels of TFEB‐WT were higher than the levels of TFEB‐C212A (Fig EV5E). This indicates that the stability of the TFEB‐C212A mutant is reduced under conditions of prolonged stress.
Figure EV5. Oligomeric forms are more stable than monomers under prolonged stress conditions.
- Immunoblot analysis of protein lysates from HeLa cells treated with EBSS for the indicated times.
- Quantification of immunoblot data shown in (A) from one experiment.
- Immunoblot analysis of protein lysates from ARPE‐19 cells expressing TFEB‐S211A‐FLAG treated with Cycloheximide (CHX) for the indicated times.
- Quantification of immunoblot data shown in (C). Data are presented as mean ± SD using one‐way ANOVA *P < 0.05, and **P < 0.01 from three independent experiments.
- Quantification of immunoblot data shown in (Fig 5D) run under reducing conditions. Data are presented as mean ± SD using one‐way ANOVA *P < 0.05 from three independent experiments.
- Immunoblot analysis of protein lysates from HeLa cells treated with siRNA control or TFEB/TFE3. Relative quantitative RT–PCR analysis of the mRNA expression of lysosome‐related genes (MCOLN1 and ATPV1C1) in HeLa cells treated with siRNA control or TFEB/TFE3 and 50 μM NaAsO2 for the indicated times. Data are presented as mean ± SD using two‐way ANOVA ****P < 0.0001 from two independent experiments.
Source data are available online for this figure.
Induction of sustained oxidative stress allowed us to have conditions in which only TFEB and TFE3 oligomers are present, making easier to assess their localization and transcriptional potential. Immunofluorescence and RT–qPCR analyses determined that TFEB and TFE3 oligomers localized to the nucleus and had high transcriptional activity (Figs 5F and G, and EV5F). Altogether, our results suggest that cysteine‐mediated formation of disulfide bonds may play an important role in maintaining sustained TFEB and TFE3 activation under chronic stress conditions.
TFEB and TFE3 oligomers are more resistant to mTORC1‐mediated inactivation
We have shown that binding of 14‐3‐3 to TFEB and TFE3 precludes their oligomerization (Fig 3D–G). Now, we tested whether oligomerization may prevent TFEB and TFE3 inactivation. For this, HeLa and ARPE‐19 cells were placed in starvation medium following by refeed, and S211 and S321 phosphorylation levels were monitored in both, monomers and oligomers. As expected, starvation caused mTORC1 inactivation, TFEB‐S211 and TFE3‐S321 dephosphorylation, and an increase in endogenous TFEB and TFE3 oligomerization (Fig 6A–C and Appendix Fig S1A–C). Reactivation of mTORC1 and mTORC1‐mediated phosphorylation of TFEB and TFE3 monomers following refeed was very fast, with levels of phospho‐S211 and phospho‐S321 returning to basal levels within 10 or 20 min (Fig 6A–C and Appendix Fig S1A–C). In contrast, no phosphorylation of TFEB and TFE3 oligomers was observed at any refeed time, even though the levels of oligomerization remained high until 40 min refeed (Fig 6A–C). These data suggest that TFEB and TFE3 oligomerization makes S211 and S321 less accessible to mTORC1, preventing their phosphorylation, interaction with 14‐3‐3, and cytoplasmic retention.
Figure 6. Oligomers make TFEB and TFE3 less accessible to inactivation by mTORC1.

- Immunoblot analysis of protein lysates from HeLa cells treated with EBSS for 1 h and then incubated with complete medium (refeed) for the indicated times. Samples were run under non‐reducing conditions.
- Quantification of immunoblot data shown in (A). Data are presented as mean ± SD using one‐way ANOVA *P < 0.05, and ***P < 0.001 from three independent experiments.
- Quantification of immunoblot data shown in (A). Data are presented as mean ± SD using one‐way ANOVA *P < 0.05, and ***P < 0.001 from three independent experiments.
- Relative quantitative RT–PCR analysis of the mRNA expression of autophagy‐ (UVRAG), lysosome‐ (ATP6V1C1), oxidative stress response‐ (TXNRD1 and HMOX1), cell cycle control‐ (CDKN1a), and cytokine production (IL6)‐related genes in TFEB/TFE3‐double knockout MEFs cells stably expressing TFEB‐FLAG‐WT or TFEB‐FLAG‐C212A and treated with 5 μM arsenic trioxide (ATO) or 12.5 μM NaAsO2 for 12 h. Data are presented as mean ± SD using two‐way ANOVA *P < 0.05, **P < 0.01, ***P < 0.001, and ****P < 0.0001 from three independent experiments.
- Schematic representation of TFEB/TFE3 redox regulation in response to chronic stress conditions.
Source data are available online for this figure.
We hypothesized that the increased stability and resistance to inactivation of the oligomers may have an important impact on the transcriptional potential of TFEB and TFE3, mainly under conditions of prolonged stress in which activity of phosphatases and kinases may fluctuate depending on cellular needs. To test this hypothesis, we generated TFEB‐WT and TFEB‐C212A stable clones. These clones were generated in TFEB/TFE3‐double knockout MEFs to eliminate any potential contribution of the endogenous proteins (Appendix Fig S1D–F). As predicted, the expression of several TFEB targets in response to prolonged oxidative stress induced by either NaAsO2 or arsenic trioxide (ATO) was significantly decreased in clones expressing TFEB‐C212A (Fig 6D). These targets include genes implicated in different cellular pathways, such as lysosomal function, autophagy, response to oxidative stress, cytokine production, and cell cycle control (Fig 6D).
Altogether, our results indicate that cysteine‐mediated oligomerization regulates TFEB stability and resistance to inactivation and is, thereby, critical for sustained activity during prolonged stress conditions (Fig 6E).
HLH‐30, the C. elegans TFEB/TFE3 orthologue, forms oligomers that are not required for its activation in response to stress
To explore the functional role of the TFEB/TEF3 cysteine residue and oligomer formation in vivo and in the context of a complete organism, we turned to the nematode Caenorhabditis elegans. C. elegans possess only one member of the TFEB/TFE3 family of transcription factors, named HLH‐30 (Rehli et al, 1999; Lapierre et al, 2013) which, similarly to TFEB/TFE3, has been shown to play a key role in the induction of autophagy, regulation of lifespan, and defense against different stresses like starvation, exposure to toxicants, or bacterial infections (Lapierre et al, 2013; Visvikis et al, 2014; Lin et al, 2018). Interestingly, HLH‐30 also has one single cysteine residue at position 284 (referred to HLH‐30 isoform a) that, like TFEB/TFE3, is adjacent to a conserved serine residue, although the function of this serine residue on worm HLH‐30 function has not yet been addressed (Appendix Fig S2).
To determine whether worm HLH‐30 also forms oligomers and whether they are dependent on the conserved cysteine residue, we first expressed recombinant HLH‐30(WT)‐FLAG and HLH‐30(C284A)‐FLAG in mammalian ARPE‐19 cells. As shown in Fig 7A, worm HLH‐30 was able to oligomerize and this oligomerization was fully dependent on the cysteine residue, similar to what we found for TFEB and TFE3 (Fig 2C and D). Next, using a strain expressing a single‐copy knock‐in HLH‐30::3xFLAG::eGFP reporter from the endogenous hlh‐30 locus, we evaluated whether HLH‐30 oligomerization is conserved in C. elegans. We found that under basal conditions the vast majority of endogenous HLH‐30 was found in its monomeric form while the dimeric and oligomeric forms appeared under starvation stress and required the cysteine 284 residue (Fig 7B). Hence, cysteine‐dependent oligomer formation of TFEB/HLH‐30 transcription factors appears as a conserved mechanism through metazoan evolution.
Figure 7. Oligomer formation and subcellular localization of C. elegans HLH‐30.

- Immunoblot analysis of protein lysates from ARPE‐19 cells overexpressing FLAG‐tagged C. elegans HLH‐30 wild‐type or mutated HLH‐30(C284A) mutant. Samples were run under non‐reducing conditions.
- Immunoblot analysis of protein lysates from C. elegans knock‐in strains expressing HLH‐30::3xFLAG::eGFP and HLH‐30(C284A)::3xFLAG::eGFP subjected to 4 h of starvation. Samples were run under non‐reducing conditions.
- Representative examples of HLH‐30::3xFLAG::eGFP subcellular localization: Cytoplasmic, diffuse GFP distribution along the whole body of the worm; Weak nuclear, some cells in the posterior part of the worm display nuclear GFP labeling but no nuclear labeling is found in the head cells; Strong nuclear, distinct nuclear GFP labeling in cells along the worm body, including neurons in the head area. Arrowheads denote nuclear localization of HLH‐30::3xFLAG::eGFP. Scale bar 200 µm and 50 µm.
- Quantification of the subcellular distribution of HLH‐30::3xFLAG::eGFP and HLH‐30(C284A)::3xFLAG::eGFP upon treatment with different stimuli. Data are from three independent experiments with at least 50 animals per experiment.
Source data are available online for this figure.
Next, we set out to study whether oligomer formation is needed for HLH‐30 activation upon stress. For this purpose, we mutated the C284 residue to alanine in nematodes expressing the HLH‐30::3xFLAG::eGFP single‐copy reporter and treated these worms with different stressors known to induce HLH‐30/TFEB nuclear translocation (O'Rourke & Ruvkun, 2013; Visvikis et al, 2014; Bennett et al, 2017; Kumsta et al, 2017; Martina & Puertollano, 2018). We classified the subcellular localization of the HLH‐30::3xFLAG::eGFP reporter in three different categories: i) cytoplasmic (diffuse fluorescence distribution in all worm tissues); ii) weak nuclear (faint nuclear labeling in some cells in the posterior part of the worm with no nuclear labeling in head neurons); and iii) strong nuclear (robust nuclear fluorescence in both the posterior part and head neurons) (Fig 7C). As shown in Fig 7D and Appendix Fig S3A, all stress treatments provoked a rapid and powerful nuclear translocation of both HLH‐30::3xFLAG::eGFP or HLH‐30(C284A)::3xFLAG::eGFP reporters. Of note, the acetylcholine receptor agonist levamisole (commonly used to paralyze worms for microscopy visualization) caused an instantaneous nuclear localization of the fluorescence reporter while the rest of the stresses did so within the first hour of exposure (using sodium azide as worm immobilizer). Importantly, the HLH‐30::3xFLAG::eGFP reporter remained in the nucleus after three hours of exposure in all treatments except diethyl maleate (DEM; Fig 7D and Appendix Fig S3A). As DEM is an alkylating agent that depletes cellular GSH, these data further support our previous results showing that glutathione homeostasis is key to retain HLH‐30 in the nucleus upon sustained stress (Guerrero‐Gomez et al, 2019), an effect that is independent of the C284 residue. Together, our data indicate that the C284 residue is not required for HLH‐30 activation, similar to what we have found with TFEB/TFE3 (Fig 4A and B), thus reinforcing the evolutionary conservation of the functional regulation of these transcription factors. These results may appear contradictory with those of a recent report identifying C212/312 residue to be required for TFEB/TFE3 activation and nuclear translocation upon H2O2 treatment (Wang et al, 2019). However, using our single‐copy HLH‐30::3xFLAG::eGFP or HLH‐30(C284A)::3xFLAG::eGFP reporter strains, we were unable to confirm such regulatory role for HLH‐30 C284 residue on H2O2 challenge in vivo (Appendix Fig S3B).
Cysteine 284 is required for specific HLH‐30 functions
Once demonstrated that TFEB‐C212 and HLH‐30‐C284 are required for oligomer formation but not for activation upon stress, we aimed to explore the in vivo role of the cysteine residue in the C. elegans model. To this purpose, as HLH‐30 has been shown to be a major determinant of worm longevity (Lapierre et al, 2013), we first evaluated the lifespan of adult worms expressing HLH‐30(C284A) and found no decrease in survival as compared with wild‐type control worms (Fig 8A). Likewise, we did not detect any difference in survival when exposing adult worms to lethal acute doses of NaAsO2 (Fig 8B), although the response to this toxicant was highly variable between assays. In contrast, we found that HLH‐30 C284 residue was required for worm resistance to Staphylococcus aureus infection (Fig 8C).
Figure 8. In vivo role of C. elegans HLH‐30 Cys284 residue.

- Lifespan assay of hlh‐30 mutants at 25°C. Graph represents Kaplan–Meier survival plots of two independent experiments initiated with 100 animals per strain. **P < 0.01 and ****P < 0.0001 by Log‐rank (Mantel‐Cox) test compared with wild‐type control.
- Survival of hlh‐30 mutants on 7.5 mM NaAsO2. Data are the mean ± SD of three independent experiments initiated with 120 animals per strain. ****P < 0.0001 by two‐way ANOVA compared with wild‐type control.
- Survival of hlh‐30 mutants to infection by Staphylococcus aureus. Data are the mean ± SD of three independent experiments initiated with 100 animals per strain. ****P < 0.0001 by two‐way ANOVA compared with wild‐type control.
- Quantification of the subcellular distribution of HLH‐30::3xFLAG::eGFP and HLH‐30(C284A)::3xFLAG::eGFP in an eat‐2(ad1116) mutant background. Data are from three independent experiments with at least 50 animals per experiment.
- Synthetic developmental delay phenotype of eat‐2(ad1116) worms carrying mutations in the hlh‐30 gene. Data are the mean ± SD of three independent experiments with at least 20 animals per assay. ****P < 0.0001 by one‐way ANOVA with multiple comparison test.
- Representative images of worms quantified in (E). Scale bars 200 µm.
- Quantification of the subcellular distribution of HLH‐30::3xFLAG::eGFP and HLH‐30(C284A)::3xFLAG::eGFP in a daf‐2(e1370) mutant background. Data are from three independent experiments with at least 50 animals per experiment.
- Effect of hlh‐30 mutations on the dauer formation phenotype of daf‐2(e1370) worms. Data are the mean ± SD of four independent experiments. ***P < 0.001; ****P < 0.0001 by one‐way ANOVA with multiple comparison test.
- Effect of hlh‐30 mutations on the dauer recovery phenotype of daf‐2(e1370) worms. Data are the mean ± SD of three independent experiments. ****P < 0.0001 by two‐way ANOVA compared with wild‐type control.
Source data are available online for this figure.
Because of the differential role of the HLH‐30 C284 residue in longevity, NaAsO2 and S. aureus assays and given the fact that all these treatments are carried out in adult (and therefore post‐mitotic) worms, we asked whether C284 may have a more prominent role during development. Indeed, in addition to nutritional, toxicological, or infective treatments, it has been shown that specific mutant backgrounds that impair development by mechanistically distinct signaling pathways also induce HLH‐30 nuclear translocation and transactivation activity. For instance, inhibition of insulin/IGF‐1 signaling (daf‐2, insulin receptor mutant), dietary restriction (eat‐2, pharyngeal pumping mutant), inhibition of notch signaling (glp‐1, germline proliferation mutant), or impaired mitochondrial function (clk‐1, ubiquinone synthesis) all cause an increase of around 50% in HLH‐30 nuclear translocation (Lapierre et al, 2013). Hence, we set to explore the role of HLH‐30 C284 during development in eat‐2 and daf‐2 mutant backgrounds.
eat‐2 mutants are under constitutive, genetically induced caloric restriction due to a reduced frequency of pharyngeal pumping (Raizen et al, 1995). As a consequence, eat‐2 worms have a smaller body size and a very pale appearance (because of decreased fat accumulation), phenotypes that have been associated with reduced mTOR signaling (Bar et al, 2016). Consistent with this notion, and similar to the treatments used in Fig 7D, nuclear translocation of the endogenous HLH‐30::3xFLAG::eGFP reporter was induced in eat‐2(ad1116) mutants and this activation was independent on the C284 residue (Fig 8D). To further show that HLH‐30 is a downstream effector of the eat‐2 mutation, we generated a double mutant eat‐2(ad1116); hlh‐30(tm1978) and, surprisingly, we found a striking reduction in body size as compared to that of eat‐2 single mutants (Fig 8E and F). Importantly, eat‐2 mutants expressing HLH‐30(C284A) also have a significant reduction of body size, although not as robust as that of hlh‐30 null mutants (Fig 8E and F). These results demonstrate that reduced nutrient availability during larval development activates HLH‐30 in a C284‐independent manner, but this residue is required for an optimal response to this stress.
When facing harsh environmental conditions, developing C. elegans larvae arrest at an endurance stage named dauer (Cassada & Russell, 1975) and insulin receptor daf‐2 mutants display a temperature‐dependent constitutive dauer phenotype, which is dependent on autophagy function (Kimura et al, 1997; Melendez et al, 2003). Consistently, hlh‐30(tm1978) null mutants have been shown to increase the number of dauers produced by daf‐2(e1370) mutants grown at 22.5°C (Lin et al, 2018). We used this readout to test the effect of the HLH‐30 C284A mutation in a daf‐2 mutant background and found that, like eat‐2 mutants, the C284 residue is not needed for daf‐2‐dependent HLH‐30 nuclear translocation (Fig 8G) but it is required for the enhanced dauer formation of daf‐2; hlh‐30 mutants (Fig 8H). In contrast to dauer formation, the role of autophagy and/or HLH‐30 on dauer recovery has not yet been examined. Therefore, we investigated whether HLH‐30 is also required for efficient daf‐2 dauer recovery upon restoring optimal growth conditions. Strikingly, we found that HLH‐30 is absolutely required for recovery of daf‐2 dauers as daf‐2(e1370); hlh‐30(tm1978) dauers failed to resume growth after 7‐day incubation at 20°C in the presence of food (Fig 8I). The HLH‐30 C284 residue appears to be important for this phenotype as daf‐2 dauers expressing the HLH‐30(C284A) variant resume growth at a much slower pace than daf‐2 control dauers (Fig 8I). Intriguingly, when the assay was performed at 16°C, we found no difference in dauer recovery between daf‐2(e1370) single mutants and the doubles daf‐2; hlh‐30(tm1978) and daf‐2; hlh‐30(C>A) (Appendix Fig S3C), indicating that the role of HLH‐30 in dauer recovery is temperature dependent. Taken together, the data with the C. elegans model support a functional role of the C284 residue in vivo, with higher relevance during worm development.
Discussion
Transcription factors activity is modulated by a variety of factors. The main regulatory mechanism for the transcription factors TFEB and TFE3 is the control of their translocation from the cytosol to the nucleus, although changes in their stability (Ferron et al, 2013), dimerization (Wang et al, 2020), degradation (Sha et al, 2017), and nuclear export (Napolitano et al, 2018) may also be important contributors. Retention of TFEB and TFE3 in the cytosol is achieved by phosphorylation of specific residues that mediate binding to the cytosolic chaperone 14‐3‐3. However, recent evidence suggests that in addition to phosphorylation, other post‐translational modifications, such as acetylation (Wang et al, 2019) and sumoylation (Miller et al, 2005), may also affect TFEB and TFE3 transcriptional activity.
In this study, we identify a novel and evolutionarily conserved mechanism of TFEB and TFE3 regulation. We show that mammalian TFEB and TFE3 possess a single cysteine residue that is modified in response to stress, allowing formation of intermolecular disulfide bonds and generation of homo‐oligomers and hetero‐oligomers with increased transcriptional activity (as depicted in the model shown in Fig 6E). Therefore, cysteine‐mediated oligomerization represents a new type of oxidative post‐translational modification that functions as a molecular switch to link changes in redox balance with expression of TFEB and TFE3 targets. Future experiments will need to address the nature of the TFEB/TFE3 oligomers in more detail. The molecular weight of the oligomers (close to 220 kDa) suggests that they may represent trimers. However, we cannot discard that profound changes in the quaternary structure of the protein alter the mobility of TFEB/3 dimers under non‐reducing SDS–PAGE conditions, as it has been described for ATF6 (Koba et al, 2020).
Glutathionylation has recently emerged as an important redox switch implicated in the modulation of key signaling pathways, including regulation of gene expression by modification of histones and transcription factors (Brigelius‐Flohe & Flohe, 2011). In many instances, glutathionylation leads to inactivation of a particular transcription factor by preventing its nuclear translocation or ability to bind DNA. These include NFKB, c‐jun, STAT3, and p53 (Lermant & Murdoch, 2019). However, glutathionylation can also promote transcriptional activity. For example, glutathionylation of the Nrf2 inhibitor, Keap1, induces Nrf2 nuclear translocation and expression of its downstream targets (Carvalho et al, 2016; Wang et al, 2018). Likewise, STAT1 activity and HIF‐1 alpha stability are enhanced by glutathionylation (Watanabe et al, 2016; Butturini et al, 2018; Jeon et al, 2018). Our mass spectrometry analysis revealed that TFEB monomers, but not oligomers, are glutathionylated on C212, and the levels of glutathionylated peptides increase under oxidative stress conditions. Therefore, our data identify glutathionylation as novel type of TFEB post‐translational modification that contribute to the regulation of TFEB conformation and activity.
Our data also show that cysteine‐mediated oligomerization increases protein stability. We observe a progressive disappearance of TFEB/TFE3 monomers under conditions of prolonged oxidative stress, while the levels of TFEB/TFE3 oligomers increased over time. Previous work has shown that activation of the E3‐ubiquitin ligase STUB1 under stress conditions results in ubiquitination and degradation of phosphorylated TFEB (Sha et al, 2017). Since TFEB and TFE3 can form dimers via their leucine‐zipper domain, this implies that under stress, dimerization of phosphorylated and non‐phosphorylated forms may target active TFEB for degradation, resulting in an inefficient response. In contrast, formation of disulfide bonds, which only happens after 14‐3‐3 dissociation, may be a way to favor dimerization between non‐phosphorylated TFEB, thus preventing degradation and increasing transcriptional capability.
Beyond its protective functions, our results also reveal a fundamentally important link between redox shifts and phosphorylation‐dephosphorylation signaling. The unique positioning of TFEB‐C212 and TFE3‐C322, adjacent to the serine residue responsible for binding to 14‐3‐3 and cytosolic retention, suggests a precise coordination between these two processes. As such, inhibition of the interaction between TFEB/TFE3 and 14‐3‐3 is sufficient to drastically increase TFEB/TFE3 oligomerization, indicating that 14‐3‐3 may prevent cysteine oxidation. This implies that in basal conditions, TFEB and TFE3 are mainly present in their monomeric/dimeric forms. Under stress, dephosphorylation of TFEB‐S211 and TFE3‐S321 and consequent 14‐3‐3 dissociation, facilitates cysteine oxidation and formation of intermolecular disulfide bonds, changing the quaternary structure of the proteins. At the same time, mutation of C212 was sufficient to increase phosphorylation of S211 and binding to 14‐3‐3, indicating that S211 phosphorylation and C212 redox modifications have antagonistic functions, promoting TFEB inactivation and activation, respectively. Accordingly, oligomeric TFEB/TFE3 forms were not phosphorylated by mTORC1 following refeed after starvation, while TFEB/TFE3 monomers phosphorylation, and thereby inactivation, was quite rapid and efficient. These data indicate that oligomers may be more resistant to inactivation, suggesting that even a transient reduction in mTORC1 activity may be sufficient to induce sustained TFEB/TFE3 nuclear accumulation, a scenario that may be particularly relevant in vivo, where prolonged mTORC1 inactivation could have detrimental consequences for cell viability and proliferation.
This hypothesis seems to be confirmed by our in vivo experiments with C. elegans which show that mutation of the single cysteine residue significantly impaired the activity of HLH‐30 in a variety of stress assays. Genetic and pharmacological interventions that induce autophagy via TFEB/HLH‐30 promote organismal longevity (Lapierre et al, 2013; Wang et al, 2017) and, on the other hand, ROS and oxidative stress have been shown to regulate lifespan (Labunskyy & Gladyshev, 2013; Schaar et al, 2015). Despite cysteine residues being the main ROS targets, we were surprised to observe that HLH‐30 C284 was not required for C. elegans adult lifespan or survival to NaAsO2. This unexpected result could be explained by the fact that ROS generated naturally during early development, but not at adult stages, are crucial for redox homeostasis maintenance, which ultimately results in oxidative stress resistance and longer lifespan (Bazopoulou et al, 2019).
To investigate the role of HLH‐30 C284 during worm development, we used two different long‐lived mutants that exhibit developmental phenotypes: eat‐2 worms which have a smaller size due to restricted nutrient availability (Morck & Pilon, 2006) and daf‐2 worms that form dauer larvae when grown at non‐permissive temperatures (Cassada & Russell, 1975). We found that inactivation of hlh‐30 in eat‐2 mutants profoundly affects postembryonic development, resulting in worms with a body length of half the size of wild‐type control and, notably, this effect on worm size is dependent on HLH‐30 C284. This synthetic phenotype is in agreement with previous data showing that autophagy is required for normal cell size in C. elegans (Morck & Pilon, 2006; Aladzsity et al, 2007). Thus, abolishing HLH‐30‐dependent autophagy in animals with reduced nutrient intake would strongly compromise worm growth. Similarly, eliminating HLH‐30 function in daf‐2 worms raised at 22.5°C strongly induces dauer formation and hlh‐30(C284A) mutants reproduce this phenotype. The role of HLH‐30 in dauer formation has been recently explained by a coordinated opposite response with DAF‐16/FOXO transcription factor, a major regulator of C. elegans stress response (Lin et al, 2018). Hence, upon harmful stimuli or under low insulin signaling like in daf‐2 mutants, these two transcription factors interact and translocate into the nucleus as complexes of high molecular weight. However, whereas DAF‐16 induces transcription of genes that enhance dauer formation, HLH‐30 opposes it by inducing transcription of dauer‐preventing genes and repressing the expression of dauer‐promoting genes (Lin et al, 2018). Therefore, abolishing HLH‐30 activity robustly enhances the number of dauers generated by the daf‐2 mutation.
The same reasoning applies for the striking finding of HLH‐30 being absolutely required for dauer exit at 20°C, which also appears to be partially dependent on C284 function. Thus, in the absence of HLH‐30, dauer‐promoting genes would be expressed, preventing dauer recovery even under permissive conditions. The fact that HLH‐30 is not needed for dauer exit at 16°C suggests the existence of alternative pathways that overcome HLH‐30 requirement at this temperature. Muscarinic signaling has been shown to mediate daf‐2 dauer recovery upon temperature downshift in the presence of food (Tissenbaum et al, 2000). Remarkably, in addition to causing a rapid activation of HLH‐30, Staphylococcus aureus infection in C. elegans induces an acetylcholine‐dependent defensive response mediated by downstream Wnt signaling (Labed et al, 2018). In this context, it will be very interesting to study whether muscarinic signaling triggered by thermosensory neurons regulates daf‐2; hlh‐30 dauer recovery at 16°C through Wnt‐dependent mechanisms.
Related to S. aureus infection, despite the prominent role of HLH‐30 in worm development, we have also found a role of HLH‐30 C284 residue in the response of adult worms to infection by this pathogen. It has been recently shown that, in mammals, S. aureus phagocytosis by macrophages triggers an NADPH oxidase‐dependent oxidative burst that culminates in TFEB nuclear translocation and transcriptional activation (preprint: Najibi et al, 2019). Similarly, worms exposed to S. aureus (and other pathogens) induce ROS production via the dual oxidase BLI‐3 that are used by the heme peroxidase HPX‐2 to counteract the infection (Liu et al, 2019). Given the rapid activation of HLH‐30 upon S. aureus infection (Visvikis et al, 2014), HLH‐30 C284 may act as ROS sensor to mediate the fast‐defensive response mounted upon pathogen exposure.
In agreement with our results, a recent study has described oxidation of TFEB‐C212 in response to oxidative stress (Wang et al, 2019). However, this study suggested that C212 oxidation inhibits TFEB association with Rag GTPases, promoting its delivery to the nucleus. In contrast, we found that mutation of C212 did not affect the interaction between TFEB and Rags or its nuclear translocation in response to multiple stress conditions. The disagreement between these results is unclear at the moment and may be due to different experimental conditions. While Wang and colleagues used overexpression of GFP‐TFEB in HEK293 cells treated with H2O2 for eight minutes, we used ARPE‐19 cells expressing low levels of recombinant TFEB and treated with starvation and NaAsO2 for different periods of time. Importantly, mutation of C284 on endogenous HLH‐30 did not affect transport to the nucleus under any of the multiple different types of stress that we tested, including H2O2, suggesting that C284 is not required for HLH‐30 activation in vivo.
In summary, our study undercovers a novel, conserved regulatory mechanism of the MiTF/TFE family of transcription factors by oxidative stress. We identify cysteine oxidation as a post‐transcriptional modification that directly modulated the quaternary structure and activity of these transcription factors. Our data highlight the key role of TFEB/TFE3/HLH‐30 redox regulation for homeostasis development and maintenance.
Materials and Methods
Cell line cultures and treatments
ARPE‐19 cells (CRL‐2302, American Type Culture Collection) were grown at 37°C in a 1:1 mixture of DMEM and Ham’s F12 media supplemented with 10% fetal bovine serum (Invitrogen), 2 mM GlutaMax™, 100 U/ml penicillin, and 100 μg/ml streptomycin (Gibco) in a humidified 5% CO2 atmosphere. Mouse embryonic fibroblasts (MEF) wild‐type (CRL‐2977, American Type Culture Collection), HeLa cells (CCL‐2, American Type Culture Collection), RAW 264.7 cells (TIB‐71, American Type Culture Collection), and HeLa (CF7) cells stably expressing TFEB‐FLAG (previously described in (Martina et al, 2012)) were grown in DMEM media supplemented with fetal bovine serum, GlutaMax™ and antibiotics as indicated for ARPE‐19 cells media. TFEB/TFE3 DKO MEF cells were generated as described in (Martina et al, 2016). For transient expression, ARPE19 and RAW 264.7 cells were nucleofected using Cell Line Nucleofector® Kit V (Lonza) following manufacturer’s recommendations. Cells were analyzed 24 h post‐nucleofection. For drug treatment experiments, cells were incubated for the indicated time at 37°C in medium containing one of the following reagents: DMSO (Sigma‐Aldrich), 250 nM Torin‐1 (TOCRIS), 15 mM N‐Acetyl‐L‐cysteine (NAC, Sigma‐Aldrich), 100 μg/ml Cycloheximide (CHX, Cell Signaling Technology), 1 μg/ml Lipopolysaccharides (LPS, Sigma‐Aldrich), 5‐8 μM arsenic trioxide (ATO, Sigma‐Aldrich), or 12.5‐300 μM NaAsO2 (Sodium Arsenite, Santa Cruz Biotechnology). For starvation experiments, cells were washed three times in Hank’s balances salt solution (Invitrogen) and incubated for 1–4 h at 37°C in Earle’s balanced salt solution (Sigma‐Aldrich).
Antibodies
The following mouse monoclonal antibodies were used: clone M2 to Flag (Sigma‐Aldrich, F3165), clone H4A3 to Lamp1 (Developmental Studies Hybridoma Bank, H4A3‐s), clone 9E10 to MYC (Developmental Studies Hybridoma Bank), and clone 6C5 to GAPDH (Ambion, AM4300). The following polyclonal antibodies were also used: anti‐phospho‐4E‐BP1, anti‐4E‐BP1, anti‐14‐3‐3, anti‐Phospho‐TFEB‐S211, and anti‐Histone H3 were from Cell Signaling Technology (9451, 9452, 8312, 37681, 9715, respectively), anti‐TFEB (Bethyl Laboratories, Inc, A303‐673A), anti‐Phospho‐TFEB‐S211 (previously described in (Martina & Puertollano, 2018), anti‐TFE3 (Sigma‐Aldrich, HPA023881), and anti‐Phospho‐TFE3‐S321 (previously described in (Martina et al, 2016)). HRP‐conjugated anti‐mouse or anti‐rabbit IgG were acquired from Cell Signaling Technology (7076 and 7074). C. elegans samples were immunoblotted using the following antibodies: anti‐FLAG M2 (Sigma‐Aldrich, 1804), GAPDH (Ambion, AM4300), and ECL α‐mouse IgG horseradish Peroxidase (Healthcare, NA931).
Recombinant DNA plasmid
HLH‐30‐FLAG‐WT and HLH‐30‐FLAG‐C284A expression vectors were generated by cloning the full‐length encoding sequence of C. elegans HLH‐30 obtained by PCR amplification from pET28a‐6myc‐HLH‐30‐WT (a gift from Prof. Christian Riedel (Lin et al, 2018) or pET28a‐6myc‐HLH‐30‐C284A cDNA (this study) followed by in‐frame cloning into HindIII‐BamHI sites of p3xFLAG‐CMV‐14 (Sigma‐Aldrich) with a triple FLAG tag fused to the carboxy‐termini of HLH‐30 using In‐fusion HD EcoDry system (Takara Bio USA,Inc.). Amino acid substitutions in TFEB, TFE3, and HLH‐30 were made using the QuickChange Lightning site‐directed mutagenesis kit (Agilent Technologies) according to the manufacturer's instructions.
Adenovirus production
Adenovirus expressing TFEB‐FLAG‐C212A was prepared, amplified, and purified by Welgen, Inc. Adenovirus expressing TFEB‐FLAG‐WT, TFEB‐FLAG‐S211A, TFE3‐MYC‐WT, and TFE3‐MYC‐S321A have been previously described (Martina et al, 2014).
Generation of MEFs stable cell lines
TFEB/TFE3 double knockout MEF cells were nucleofected with p3xFLAG‐CMV‐14‐TFEB‐FLAG‐WT or p3xFLAG‐CMV‐14‐TFEB‐FLAG‐C212A using MEF‐2 Nucleofector Kit (VPD‐1005, Lonza) and program A‐23 following manufacturer’s recommendations. Seventy‐two hours after nucleofection cells were selected with 600 μg/ml G418 Sulfate (Fisher Scientific). Individual clones were isolated by limiting dilution cloning, and TFEB‐FLAG‐WT or TFEB‐FLAG‐C212A was confirmed via immunoblotting with anti‐FLAG antibody.
Immunofluorescence confocal microscopy
For immunofluorescence, cells grown on coverslips were washed with PBS and fixed with 4% formaldehyde for 15 min at room temperature. For monitoring nuclear localization of TFEB and TFE3, cells were permeabilized in PBS containing 0.2% Triton X‐100 for 10 min at room temperature. Cells were then incubated with the indicated primary antibodies in PBS containing 10% Fetal Bovine Serum and 0.1% (wt/v) saponin for 1 h at room temperature, followed by incubation with the corresponding secondary antibodies Alexa Fluor 488‐conjugated goat anti‐rabbit IgG and Alexa Fluor 568‐conjugated goat anti‐mouse IgG (Fisher Scientific, A‐11008 and A‐11004, respectively). After staining, the coverslips were mounted onto glass slides with Fluoromount‐G (Southern Biotech, 0100‐01). Images were acquired using a Zeiss LSM 510 confocal system equipped with filter sets for FITC and Rhodamine, 488 nm and 543 nm laser excitation, an Axiocam camera, a 63X NA 1.4 oil immersion objective, and LSM 510 operating software (Carl Zeiss). Confocal images taken with the same acquisition parameters were processed with ImageJ software (NIH) and Photoshop CC 2018 and Adobe Illustrator CC 2020 software were used to produce the figures.
Immunoprecipitation, electrophoresis and immunoblotting
Cells washed with ice‐cold PBS were lysed in lysis buffer containing 25 mM Tris–HCl, pH 7.5, 150 mM NaCl, 5 mM EDTA, and 1% Triton X‐100 (wt/v) and supplemented with protease and phosphatase inhibitors cocktail (Sigma‐Aldrich). Cell lysates were incubated on ice for 30 min and then were passed 10 times through a 25‐gauge needle. Cell lysates were centrifuged at 16,000 g for 10 min at 4°C. For immunoprecipitation, the soluble fractions were incubated with 20 μl of anti‐FLAG M2 affinity gel beads (Sigma‐Aldrich) for 4 h at 4°C. The immunoprecipitates were collected, washed three times with lysis buffer, and proteins were eluted with Laemmli sample buffer without reducing agent. For C. elegans immunoblotting, synchronized young adult worms from 5 or 6 Nematode Growth Medium (NGM) plates (90mm) were harvested with M9 buffer (22 mM KH2PO4, 42 mM Na2HPO4, 86 mM NaCl, and 1 mM MgSO4) and collected in 50‐ml Falcon tubes. Proteins extraction and immunoblotting were performed as previously described (Gomez‐Orte et al, 2019).
Samples were analyzed by SDS–PAGE (4–20% gradient or 6% gels, Life Technologies) under either reducing or non‐reducing conditions and transferred to nitrocellulose membranes. Membranes were immunoblotted using the indicated antibodies. Horseradish peroxidase‐conjugated anti‐mouse, anti‐rabbit IgG, or anti‐rat IgG (Cell Signaling Technology or GE Healthcare) were used at a dilution of 1:8,000. HRP‐chemiluminescence was developed using Western Lightning Chemiluminescence Reagent Plus (PerkinElmer Life Sciences). The exposed films were scanned, and the protein band intensities quantified using ImageJ software (NIH) and Photoshop CC 2018 software was used to produce the figures.
Subcellular fractionation
Cells were lysed in NP‐40 lysis buffer (10 mM Tris, pH 7.9, 140 mM KCl, 5 mM MgCl2, and 0.5 % NP‐40) supplemented with protease and phosphatase inhibitors at a concentration of 3–5 × 10⁷ cells/ml. Cell were gently mixed and kept on ice for 15 min. The lysates were then centrifugated at 1,000 g for 5 min. The supernatant represents the cytosolic plus the membrane fraction. The pellets (nuclear fraction) were washed twice in NP‐40 lysis buffer and then sonicated in Laemmli sample on ice using a Misonix sonicator Processor XL2020 equipped with a horn/probe (fine tip). The sonication processing time was 1 min with pulses of 10 s every 5 s intervals and power setting at position 2.
RNA isolation and relative quantitative Real‐Time PCR
RNA was isolated from samples with the PureLink RNA Mini Kit (Thermo Fisher 12183018A) and reverse transcribed using SuperScript III First‐Strand Synthesis SuperMix kit (Thermo Fisher, 11752). Quantitative real‐time PCRs were set up in triplicate with 50 ng cDNA per reaction and 200 nM forward and reverse primers along with SYBR Green PCR Master Mix (Applied Biosystems, 4309155). Reactions were run and analyzed using a QuantStudio 12K Flex Real‐Time PCR system (Applied Biosystems, Life Technologies). Relative expression levels were displayed relative to control conditions and normalized using Actb and Gapdh (mouse genes) or ACTB and GAPDH (human genes) using the ΔΔCT method.
Mass spectrometry
Immunoprecipitated TFEB‐FLAG from CF7 HeLa cells treated with the indicated reagents was subjected to SDS–PAGE, and gel bands from corresponding molecular weights were cut out for enzymatic digestion. Briefly, the samples were first alkylated with chloroacetamide (CAA) (Sigma‐Aldrich) to protect free cysteines and then digested with chymotrypsin (Promega). The resulting peptide mixtures were analyzed with an Orbitrap Fusion Lumos that is equipped with a Dionex Ultimate 3000 nanoLC system (Thermo Fisher Scientific). Peptide IDs and phosphorylation and glutathionylation sites were assigned with Mascot V2.5 (Matrix Science). The confidence of phosphorylation and glutathionylation site localization is assessed with ptmRS node in Proteome Discoverer 2.2 platform (Thermo Fisher Scientific). All peptides were filtered out at 1% false discovery rate (FDR), and their relative abundances were compared based on the areas under curve (AUC) of their corresponding chromatographic peaks.
C. elegans strains
The standard methods used for culturing and maintenance of C. elegans were as previously described (Stiernagle, 2006). A list of all strains used and generated in this study is provided in Table EV2. The hlh‐30 alleles syb1452, syb1623, and syb1731 were generated at SunyBiotech (http://www.sunybiotech.com) by CRISPR‐Cas9 editing. All VZ strains are 6x outcrossed with N2 wild type, except those carrying the syb1452, syb1623, and syb1731 alleles that were 2x outcrossed. Worm reagents and details on the protocols used for genotyping the different alleles reported in this work can be provided upon request. Unless otherwise noted, all experiments were performed on synchronized worms generated by allowing 10 to 15 gravid hermaphrodites to lay eggs during two to three hours on seeded plates at 20°C.
HLH‐30::3xFLAG::eGFP subcellular localization
Worms expressing HLH‐30::3xFLAG::eGFP and HLH‐30(C284A)::3xFLAG::eGFP reporters were scored at 40x magnification at the first day of adulthood for cytoplasmic versus nuclear GFP localization in an Olympus BX61 fluorescence microscope equipped with a DP72 digital camera coupled to CellSens Software for image acquisition and analysis. Photoshop CC 2018 and Adobe Illustrator software were used to produce figures.
For levamisole assay, animals were paralyzed with 10mM levamisole mounted on a slice with a 3% agarose pad and scored immediately. For the rest of experiments, worms were paralyzed with 1% sodium azide that does not cause HLH‐30::3xFLAG::eGFP nuclear translocation during the time of scoring.
For the starvation assay, animals were incubated at 20°C for 1 and 3 h on NGM plates without OP50 and supplemented with 1 mg/ml ampicillin. For the heat shock assay, worms were incubated at 30°C on NGM plates for 1 and 3 h. For Staphylococcus aureus assay, 100 µl of an S. aureus ATCC29213 overnight culture was seeded on NGM plates and incubated at 37°C for 24 h. Animals were then placed on the S. aureus plates for 1 and 3 h at 20°C. For arsenite and diethyl maleate assays, worms were incubated on NGM plates containing 5 mM and 3mM of each chemical at 20°C for 1 and 3 h.
Synchronized eat‐2(ad1116) and daf‐2(e1370) mutants expressing HLH‐30::3xFLAG::eGFP and HLH‐30(C284A)::3xFLAG::eGFP reporters were incubated on NGM plates at 20°C and 22.5°C and scored after four and five days, respectively.
Lifespan assay
Pregnant hermaphrodites were disrupted with a hypochlorite/NaOH solution, and eggs were allowed to hatch and develop to adults. Twenty animals were transferred to a new NGM plate for egg‐lay synchronization for 2 h and then parents were removed, and embryos were further incubated at 20°C until animals reached L4 stage. One hundred L4 worms (25 per plate) were transferred to NGM plates and incubated at 25°C. Lifespan assay was initiated the first day of adulthood, and viability was scored daily. Animals were daily transferred to new NGM plates until the end of their egg‐lay period and every second day onwards. Worms were scored as dead when no pharyngeal pumping is detected and do not respond to a gently touch with a platinum pick. Dead animals by non‐natural causes like desiccation on the plate borders or internal hatching were censored.
Arsenite survival
Synchronized embryos were incubated at 20°C for 52 h. Then, 120 animals (40 per plate) were placed on NGM plates containing 7.5 mM NaAsO2, incubated at 20°C and scored as dead or alive at different time points. NaAsO2 NGM plates were seeded with a bit of E. coli OP50 at the center of the plate (manually transferred from a non‐treated NGM plate) to avoid the compounding effect of starvation. Worms were scored as dead when no pharyngeal pumping is detected and do not respond to a gently touch with a platinum pick.
Staphylococcus aureus infection
One colony of S. aureus NCTC8325 was grown at 37°C overnight in tryptic soy broth (TSB) supplemented with 10µg/ml nalidixic acid (Nal). The overnight culture was diluted 1:10 in TBS + Nal 10 µg/ml, and 10 µl were seeded on 3.5 cm tryptic soy agar (TSA) plates supplemented with 10 µg/ml Nal and incubated for 6 h at 37°C. Plates were dried under sterile flow until plates were equilibrated at room temperature. Ninety L4 animals grown in E. coli OP50 were placed on S. aureus plates (30 per plate), incubated at 25°C, and animals were scored as dead or alive at different time points. A worm was scored as dead when no pharyngeal pumping is detected and does not respond to a gently touch with a platinum pick.
eat‐2 mutants length quantification
eat‐2(ad1116) worms and their derivatives were 1 h egg‐lay synchronized and incubated at 20°C for 72 h. Image acquisition was performed in worms paralyzed with 1% sodium azide on a slice with 3% agarose pad, at 10x magnification in an Olympus BX61 fluorescence microscope equipped with a DP72 digital camera coupled to CellSens Software. ImageJ Software was used to quantify the length of the worms. Adobe Illustrator CC 2018 software were used to produce the figures.
Dauer formation and dauer recovery
For dauer formation assays, the plates with synchronized embryos (three biological replicates) were transferred to 22.5°C after parent removal. Dauer quantification was performed after three days in daf‐2(+) backgrounds and after six days in daf‐2(e1370) backgrounds. In the latter case, animals that bypassed dauer entry were removed daily from plates to avoid progeny growth. For dauer recovery assays, the plates with synchronized embryos (three biological replicates) were transferred to 25°C after parent removal and incubated for four days to induce 100% dauers. Next, plates were transferred to 25°C or 16°C and dauer recovery was scored daily.
Statistical analysis
Data were processed in Excel (Microsoft Corporation) then Prism (GraphPad Software) to generate curve and bar charts and perform statistical analyses. Student’s t‐test, one‐way ANOVA, two‐way ANOVA, log‐rank (Mantel‐Cox), and pairwise post‐tests were performed for each dependent variable, as specified in each figure legend. All data are presented as mean ± SD. P < 0.05 was considered statistically significant *P < 0.01 very significant **P < 0.001 extremely significant (***), and P < 0.0001 extremely significant (****). P > 0.05 was considered not significant (n.s.).
Author contributions
Experimental strategy, experiments, data analysis, and preparation of the manuscript: J.A.M., D.G.G., and E.G.O; Research design, data analysis, project supervision, and preparation of the manuscript: J.A.B. and J.C.; Research design, data analysis, project supervision, and manuscript writing: A.M.V. and R.P. Manuscript reviewing: All authors.
Conflict of interest
The authors declare that they have no conflict of interest.
Supporting information
Appendix
Expanded View Figures PDF
Table EV1
Table EV2
Source Data for Expanded View and Appendix
Review Process File
Source Data for Figure 1
Source Data for Figure 2
Source Data for Figure 3
Source Data for Figure 4
Source Data for Figure 5
Source Data for Figure 6
Source Data for Figure 7
Source Data for Figure 8
Acknowledgements
Some C. elegans strains were provided by the CGC, which is funded by NIH Office of Research Infrastructure Programs (P40 OD010440). J.A.M. and R.P. were supported by the Intramural Research Program of the NIH, National Heart, Lung, and Blood Institute (NHLBI). E.G.O., D.G.G., J.C., and A.M.V. were supported by the Project PGC2018‐094276‐B‐I00 and JAB by the Project BFU2016‐80006‐P (both financed by the Spanish Ministerio de Ciencia, Innovación y Universidades (MCIU), the Spanish Agencia Estatal de Investigación (AEI), and the Fondo Europeo de Desarrollo Regional (FEDER). We thank Dr. Yong Chen and Dr. Marjan Gucek, NHLBI Proteomics Core Facility, for help to perform and interpret the mass spectrometry analysis. We also thank Prof. Christian Riedel (Karolinska Institute, Sweden) for providing the pET‐28a::6xmyc::HLH‐30 construct.
The EMBO Journal (2021) 40: e105793.
Contributor Information
Antonio Miranda‐Vizuete, Email: amiranda-ibis@us.es.
Rosa Puertollano, Email: puertolr@mail.nih.gov.
Data availability
Source data for Figs 1, 2, 3, 4, 5, 6, 7, 8 and Fig EV1, EV2, EV3, EV4, EV5 and Appendix Fig S1 and S3 are provided with the paper. The mass spectrometry proteomics data have been deposited to the ProteomeXchange Consortium (http://proteomecentral.proteomexchange.org) via the PRIDE partner repository (Perez‐Riverol et al, 2019) with the dataset identifier PXD022258 (http://www.ebi.ac.uk/pride/archive/projects/PXD022258).
References
- Aladzsity I, Toth ML, Sigmond T, Szabo E, Bicsak B, Barna J, Regos A, Orosz L, Kovacs AL, Vellai T (2007) Autophagy genes unc‐51 and bec‐1 are required for normal cell size in Caenorhabditis elegans. Genetics 177: 655–660 [DOI] [PMC free article] [PubMed] [Google Scholar]
- Bao J, Zheng L, Zhang Q, Li X, Zhang X, Li Z, Bai X, Zhang Z, Huo W, Zhao X et al (2016) Deacetylation of TFEB promotes fibrillar Abeta degradation by upregulating lysosomal biogenesis in microglia. Protein Cell 7: 417–433 [DOI] [PMC free article] [PubMed] [Google Scholar]
- Bar DZ, Charar C, Dorfman J, Yadid T, Tafforeau L, Lafontaine DL, Gruenbaum Y (2016) Cell size and fat content of dietary‐restricted Caenorhabditis elegans are regulated by ATX‐2, an mTOR repressor. Proc Natl Acad Sci USA 113: E4620–4629 [DOI] [PMC free article] [PubMed] [Google Scholar]
- Bazopoulou D, Knoefler D, Zheng Y, Ulrich K, Oleson BJ, Xie L, Kim M, Kaufmann A, Lee YT, Dou Y et al (2019) Developmental ROS individualizes organismal stress resistance and lifespan. Nature 576: 301–305 [DOI] [PMC free article] [PubMed] [Google Scholar]
- Bennett CF, Kwon JJ, Chen C, Russell J, Acosta K, Burnaevskiy N, Crane MM, Bitto A, Vander Wende H, Simko M et al (2017) Transaldolase inhibition impairs mitochondrial respiration and induces a starvation‐like longevity response in Caenorhabditis elegans. PLoS Genet 13: e1006695 [DOI] [PMC free article] [PubMed] [Google Scholar]
- Bleicken S, Zeth K (2009) Conformational changes and protein stability of the pro‐apoptotic protein Bax. J Bioenerg Biomembr 41: 29–40 [DOI] [PMC free article] [PubMed] [Google Scholar]
- Brady OA, Jeong E, Martina JA, Pirooznia M, Tunc I, Puertollano R (2018) The transcription factors TFE3 and TFEB amplify p53 dependent transcriptional programs in response to DNA damage. Elife 7: e40856 [DOI] [PMC free article] [PubMed] [Google Scholar]
- Brigelius‐Flohe R, Flohe L (2011) Basic principles and emerging concepts in the redox control of transcription factors. Antioxid Redox Signal 15: 2335–2381 [DOI] [PMC free article] [PubMed] [Google Scholar]
- Butturini E, Cozzolino F, Boriero D, Carcereri de Prati A, Monti M, Rossin M, Canetti D, Cellini B, Pucci P, Mariotto S (2018) S‐glutathionylation exerts opposing roles in the regulation of STAT1 and STAT3 signaling in reactive microglia. Free Radic Biol Med 117: 191–201 [DOI] [PubMed] [Google Scholar]
- Campbell GR, Rawat P, Bruckman RS, Spector SA (2015) Human immunodeficiency virus type 1 nef inhibits autophagy through transcription factor EB sequestration. PLoS Pathog 11: e1005018 [DOI] [PMC free article] [PubMed] [Google Scholar]
- Carvalho AN, Marques C, Guedes RC, Castro‐Caldas M, Rodrigues E, van Horssen J, Gama MJ (2016) S‐Glutathionylation of Keap1: a new role for glutathione S‐transferase pi in neuronal protection. FEBS Lett 590: 1455–1466 [DOI] [PubMed] [Google Scholar]
- Cassada RC, Russell RL (1975) The dauerlarva, a post‐embryonic developmental variant of the nematode Caenorhabditis elegans. Dev Biol 46: 326–342 [DOI] [PubMed] [Google Scholar]
- Ferron M, Settembre C, Shimazu J, Lacombe J, Kato S, Rawlings DJ, Ballabio A, Karsenty G (2013) A RANKL‐PKCbeta‐TFEB signaling cascade is necessary for lysosomal biogenesis in osteoclasts. Genes Dev 27: 955–969 [DOI] [PMC free article] [PubMed] [Google Scholar]
- Gomez‐Orte E, Saenz‐Narciso B, Zheleva A, Ezcurra B, de Toro M, Lopez R, Gastaca I, Nilsen H, Sacristan MP, Schnabel R et al (2019) Disruption of the Caenorhabditis elegans Integrator complex triggers a non‐conventional transcriptional mechanism beyond snRNA genes. PLoS Genet 15: e1007981 [DOI] [PMC free article] [PubMed] [Google Scholar]
- Gray MA, Choy CH, Dayam RM, Ospina‐Escobar E, Somerville A, Xiao X, Ferguson SM, Botelho RJ (2016) Phagocytosis enhances lysosomal and bactericidal properties by activating the transcription factor TFEB. Curr Biol 26: 1955–1964 [DOI] [PMC free article] [PubMed] [Google Scholar]
- Guerrero‐Gomez D, Mora‐Lorca JA, Saenz‐Narciso B, Naranjo‐Galindo FJ, Munoz‐Lobato F, Parrado‐Fernandez C, Goikolea J, Cedazo‐Minguez A, Link CD, Neri C et al (2019) Loss of glutathione redox homeostasis impairs proteostasis by inhibiting autophagy‐dependent protein degradation. Cell Death Differ 26: 1545–1565 [DOI] [PMC free article] [PubMed] [Google Scholar]
- Hallsson JH, Haflidadottir BS, Stivers C, Odenwald W, Arnheiter H, Pignoni F, Steingrimsson E (2004) The basic helix‐loop‐helix leucine zipper transcription factor Mitf is conserved in Drosophila and functions in eye development. Genetics 167: 233–241 [DOI] [PMC free article] [PubMed] [Google Scholar]
- Hashimoto K, Panchenko AR (2010) Mechanisms of protein oligomerization, the critical role of insertions and deletions in maintaining different oligomeric states. Proc Natl Acad Sci USA 107: 20352–20357 [DOI] [PMC free article] [PubMed] [Google Scholar]
- Jeon D, Park HJ, Kim HS (2018) Protein S‐glutathionylation induced by hypoxia increases hypoxia‐inducible factor‐1alpha in human colon cancer cells. Biochem Biophys Res Commun 495: 212–216 [DOI] [PubMed] [Google Scholar]
- Kimura KD, Tissenbaum HA, Liu Y, Ruvkun G (1997) daf‐2, an insulin receptor‐like gene that regulates longevity and diapause in Caenorhabditis elegans. Science 277: 942–946 [DOI] [PubMed] [Google Scholar]
- Koba H, Jin S, Imada N, Ishikawa T, Ninagawa S, Okada T, Sakuma T, Yamamoto T, Mori K (2020) Reinvestigation of disulfide‐bonded oligomeric forms of the unfolded protein response transducer ATF6. Cell Struct Funct 45: 9–21 [DOI] [PMC free article] [PubMed] [Google Scholar]
- Kumsta C, Chang JT, Schmalz J, Hansen M (2017) Hormetic heat stress and HSF‐1 induce autophagy to improve survival and proteostasis in C. elegans. Nat Commun 8: 14337 [DOI] [PMC free article] [PubMed] [Google Scholar]
- Labed SA, Wani KA, Jagadeesan S, Hakkim A, Najibi M, Irazoqui JE (2018) Intestinal epithelial wnt signaling mediates acetylcholine‐triggered host defense against infection. Immunity 48(5): 963–978 [DOI] [PMC free article] [PubMed] [Google Scholar]
- Labunskyy VM, Gladyshev VN (2013) Role of reactive oxygen species‐mediated signaling in aging. Antioxid Redox Signal 19: 1362–1372 [DOI] [PMC free article] [PubMed] [Google Scholar]
- Lapierre LR, De Magalhaes Filho CD, McQuary PR, Chu CC, Visvikis O, Chang JT, Gelino S, Ong B, Davis AE, Irazoqui JE et al (2013) The TFEB orthologue HLH‐30 regulates autophagy and modulates longevity in Caenorhabditis elegans. Nat Commun 4: 2267 [DOI] [PMC free article] [PubMed] [Google Scholar]
- Lermant A, Murdoch CE (2019) Cysteine glutathionylation acts as a redox switch in endothelial cells. Antioxidants (Basel) 8: 315 [DOI] [PMC free article] [PubMed] [Google Scholar]
- Lin XX, Sen I, Janssens GE, Zhou X, Fonslow BR, Edgar D, Stroustrup N, Swoboda P, Yates JR 3rd, Ruvkun G et al (2018) DAF‐16/FOXO and HLH‐30/TFEB function as combinatorial transcription factors to promote stress resistance and longevity. Nat Commun 9: 4400 [DOI] [PMC free article] [PubMed] [Google Scholar]
- Liu Y, Kaval KG, van Hoof A, Garsin DA (2019) Heme peroxidase HPX‐2 protects Caenorhabditis elegans from pathogens. PLoS Genet 15: e1007944 [DOI] [PMC free article] [PubMed] [Google Scholar]
- Martina JA, Chen Y, Gucek M, Puertollano R (2012) MTORC1 functions as a transcriptional regulator of autophagy by preventing nuclear transport of TFEB. Autophagy 8: 903–914 [DOI] [PMC free article] [PubMed] [Google Scholar]
- Martina JA, Diab HI, Brady OA, Puertollano R (2016) TFEB and TFE3 are novel components of the integrated stress response. EMBO J 35: 479–495 [DOI] [PMC free article] [PubMed] [Google Scholar]
- Martina JA, Diab HI, Lishu L, Jeong AL, Patange S, Raben N, Puertollano R (2014) The nutrient‐responsive transcription factor TFE3 promotes autophagy, lysosomal biogenesis, and clearance of cellular debris. Sci Signal 7: ra9 [DOI] [PMC free article] [PubMed] [Google Scholar]
- Martina JA, Puertollano R (2013) Rag GTPases mediate amino acid‐dependent recruitment of TFEB and MITF to lysosomes. J Cell Biol 200: 475–491 [DOI] [PMC free article] [PubMed] [Google Scholar]
- Martina JA, Puertollano R (2018) Protein phosphatase 2A stimulates activation of TFEB and TFE3 transcription factors in response to oxidative stress. J Biol Chem 293: 12525–12534 [DOI] [PMC free article] [PubMed] [Google Scholar]
- Medina DL, Di Paola S, Peluso I, Armani A, De Stefani D, Venditti R, Montefusco S, Scotto‐Rosato A, Prezioso C, Forrester A et al (2015) Lysosomal calcium signalling regulates autophagy through calcineurin and TFEB. Nat Cell Biol 17: 288–299 [DOI] [PMC free article] [PubMed] [Google Scholar]
- Melendez A, Talloczy Z, Seaman M, Eskelinen EL, Hall DH, Levine B (2003) Autophagy genes are essential for dauer development and life‐span extension in C. elegans . Science 301: 1387–1391 [DOI] [PubMed] [Google Scholar]
- Meng FG, Zeng X, Hong YK, Zhou HM (2001) Dissociation and unfolding of GCN4 leucine zipper in the presence of sodium dodecyl sulfate. Biochimie 83: 953–956 [DOI] [PubMed] [Google Scholar]
- Miller AJ, Levy C, Davis IJ, Razin E, Fisher DE (2005) Sumoylation of MITF and its related family members TFE3 and TFEB. J Biol Chem 280: 146–155 [DOI] [PubMed] [Google Scholar]
- Morck C, Pilon M (2006) C. elegans feeding defective mutants have shorter body lengths and increased autophagy. BMC Dev Biol 6: 39 [DOI] [PMC free article] [PubMed] [Google Scholar]
- Muhle‐Goll C, Gibson T, Schuck P, Schubert D, Nalis D, Nilges M, Pastore A (1994) The dimerization stability of the HLH‐LZ transcription protein family is modulated by the leucine zippers: a CD and NMR study of TFEB and c‐Myc. Biochemistry 33: 11296–11306 [DOI] [PubMed] [Google Scholar]
- Murano T, Najibi M, Paulus GLC, Adiliaghdam F, Valencia‐Guerrero A, Selig M, Wang X, Jeffrey K, Xavier RJ, Lassen KG et al (2017) Transcription factor TFEB cell‐autonomously modulates susceptibility to intestinal epithelial cell injury in vivo. Sci Rep 7: 13938 [DOI] [PMC free article] [PubMed] [Google Scholar]
- Najibi M, Moreau JA, Honwad HH, Irazoqui JE (2019) A novel PHOX/CD38/MCOLN1/TFEB axis important for macrophage activation during bacterial phagocytosis. bioRxiv 10.1101/669325 [PREPRINT] [DOI] [PMC free article] [PubMed] [Google Scholar]
- Napolitano G, Esposito A, Choi H, Matarese M, Benedetti V, Di Malta C, Monfregola J, Medina DL, Lippincott‐Schwartz J, Ballabio A (2018) mTOR‐dependent phosphorylation controls TFEB nuclear export. Nat Commun 9: 3312 [DOI] [PMC free article] [PubMed] [Google Scholar]
- Nezich CL, Wang C, Fogel AI, Youle RJ (2015) MiT/TFE transcription factors are activated during mitophagy downstream of Parkin and Atg5. J Cell Biol 210: 435–450 [DOI] [PMC free article] [PubMed] [Google Scholar]
- O'Rourke EJ, Ruvkun G (2013) MXL‐3 and HLH‐30 transcriptionally link lipolysis and autophagy to nutrient availability. Nat Cell Biol 15: 668–676 [DOI] [PMC free article] [PubMed] [Google Scholar]
- Pastore N, Brady OA, Diab HI, Martina JA, Sun L, Huynh T, Lim JA, Zare H, Raben N, Ballabio A et al (2016) TFEB and TFE3 cooperate in the regulation of the innate immune response in activated macrophages. Autophagy 12: 1240–1258 [DOI] [PMC free article] [PubMed] [Google Scholar]
- Pastore N, Vainshtein A, Klisch TJ, Armani A, Huynh T, Herz NJ, Polishchuk EV, Sandri M, Ballabio A (2017) TFE3 regulates whole‐body energy metabolism in cooperation with TFEB. EMBO Mol Med 9: 605–621 [DOI] [PMC free article] [PubMed] [Google Scholar]
- Perez‐Riverol Y, Csordas A, Bai J, Bernal‐Llinares M, Hewapathirana S, Kundu DJ, Inuganti A, Griss J, Mayer G, Eisenacher M et al (2019) The PRIDE database and related tools and resources in 2019: improving support for quantification data. Nucleic Acids Res 47: D442–D450 [DOI] [PMC free article] [PubMed] [Google Scholar]
- Pogenberg V, Ogmundsdottir MH, Bergsteinsdottir K, Schepsky A, Phung B, Deineko V, Milewski M, Steingrimsson E, Wilmanns M (2012) Restricted leucine zipper dimerization and specificity of DNA recognition of the melanocyte master regulator MITF. Genes Dev 26: 2647–2658 [DOI] [PMC free article] [PubMed] [Google Scholar]
- Poole LB, Karplus PA, Claiborne A (2004) Protein sulfenic acids in redox signaling. Annu Rev Pharmacol Toxicol 44: 325–347 [DOI] [PubMed] [Google Scholar]
- Puertollano R, Ferguson SM, Brugarolas J, Ballabio A (2018) The complex relationship between TFEB transcription factor phosphorylation and subcellular localization. EMBO J 37: e98804 [DOI] [PMC free article] [PubMed] [Google Scholar]
- Raben N, Puertollano R (2016) TFEB and TFE3: linking lysosomes to cellular adaptation to stress. Annu Rev Cell Dev Biol 32: 255–278 [DOI] [PMC free article] [PubMed] [Google Scholar]
- Raizen DM, Lee RY, Avery L (1995) Interacting genes required for pharyngeal excitation by motor neuron MC in Caenorhabditis elegans. Genetics 141: 1365–1382 [DOI] [PMC free article] [PubMed] [Google Scholar]
- Rehder DS, Borges CR (2010) Cysteine sulfenic acid as an intermediate in disulfide bond formation and nonenzymatic protein folding. Biochemistry 49: 7748–7755 [DOI] [PMC free article] [PubMed] [Google Scholar]
- Rehli M, Den Elzen N, Cassady AI, Ostrowski MC, Hume DA (1999) Cloning and characterization of the murine genes for bHLH‐ZIP transcription factors TFEC and TFEB reveal a common gene organization for all MiT subfamily members. Genomics 56: 111–120 [DOI] [PubMed] [Google Scholar]
- Roczniak‐Ferguson A, Petit CS, Froehlich F, Qian S, Ky J, Angarola B, Walther TC, Ferguson SM (2012) The transcription factor TFEB links mTORC1 signaling to transcriptional control of lysosome homeostasis. Sci Signal 5: ra42 [DOI] [PMC free article] [PubMed] [Google Scholar]
- Roman C, Matera AG, Cooper C, Artandi S, Blain S, Ward DC, Calame K (1992) mTFE3, an X‐linked transcriptional activator containing basic helix‐loop‐helix and zipper domains, utilizes the zipper to stabilize both DNA binding and multimerization. Mol Cell Biol 12: 817–827 [DOI] [PMC free article] [PubMed] [Google Scholar]
- Sardiello M, Palmieri M, di Ronza A, Medina DL, Valenza M, Gennarino VA, Di Malta C, Donaudy F, Embrione V, Polishchuk RS et al (2009) A gene network regulating lysosomal biogenesis and function. Science 325: 473–477 [DOI] [PubMed] [Google Scholar]
- Schaar CE, Dues DJ, Spielbauer KK, Machiela E, Cooper JF, Senchuk M, Hekimi S, Van Raamsdonk JM (2015) Mitochondrial and cytoplasmic ROS have opposing effects on lifespan. PLoS Genet 11: e1004972 [DOI] [PMC free article] [PubMed] [Google Scholar]
- Settembre C, De Cegli R, Mansueto G, Saha PK, Vetrini F, Visvikis O, Huynh T, Carissimo A, Palmer D, Klisch TJ et al (2013) TFEB controls cellular lipid metabolism through a starvation‐induced autoregulatory loop. Nat Cell Biol 15: 647–658 [DOI] [PMC free article] [PubMed] [Google Scholar]
- Settembre C, Di Malta C, Polito VA, Garcia Arencibia M, Vetrini F, Erdin S, Erdin SU, Huynh T, Medina D, Colella P et al (2011) TFEB links autophagy to lysosomal biogenesis. Science 332: 1429–1433 [DOI] [PMC free article] [PubMed] [Google Scholar]
- Settembre C, Zoncu R, Medina DL, Vetrini F, Erdin S, Erdin S, Huynh T, Ferron M, Karsenty G, Vellard MC et al (2012) A lysosome‐to‐nucleus signalling mechanism senses and regulates the lysosome via mTOR and TFEB. EMBO J 31: 1095–1108 [DOI] [PMC free article] [PubMed] [Google Scholar]
- Sha Y, Rao L, Settembre C, Ballabio A, Eissa NT (2017) STUB1 regulates TFEB‐induced autophagy‐lysosome pathway. EMBO J 36: 2544–2552 [DOI] [PMC free article] [PubMed] [Google Scholar]
- Sharma M, Pandey R, Saluja D (2018) ROS is the major player in regulating altered autophagy and lifespan in sin‐3 mutants of C. elegans. Autophagy 14: 1239–1255 [DOI] [PMC free article] [PubMed] [Google Scholar]
- Slade L, Biswas D, Ihionu F, El Hiani Y, Kienesberger PC, Pulinilkunnil T (2020) A lysosome independent role for TFEB in activating DNA repair and inhibiting apoptosis in breast cancer cells. Biochem J 477: 137–160 [DOI] [PubMed] [Google Scholar]
- Song W, Wang F, Savini M, Ake A, di Ronza A, Sardiello M, Segatori L (2013) TFEB regulates lysosomal proteostasis. Hum Mol Genet 22: 1994–2009 [DOI] [PubMed] [Google Scholar]
- Steingrimsson E, Copeland NG, Jenkins NA (2004) Melanocytes and the microphthalmia transcription factor network. Annu Rev Genet 38: 365–411 [DOI] [PubMed] [Google Scholar]
- Steingrimsson E, Tessarollo L, Pathak B, Hou L, Arnheiter H, Copeland NG, Jenkins NA (2002) Mitf and Tfe3, two members of the Mitf‐Tfe family of bHLH‐Zip transcription factors, have important but functionally redundant roles in osteoclast development. Proc Natl Acad Sci USA 99: 4477–4482 [DOI] [PMC free article] [PubMed] [Google Scholar]
- Stiernagle T (2006) Maintenance of C. elegans . WormBook 1–11 [DOI] [PMC free article] [PubMed] [Google Scholar]
- Tissenbaum HA, Hawdon J, Perregaux M, Hotez P, Guarente L, Ruvkun G (2000) A common muscarinic pathway for diapause recovery in the distantly related nematode species Caenorhabditis elegans and Ancylostoma caninum. Proc Natl Acad Sci USA 97: 460–465 [DOI] [PMC free article] [PubMed] [Google Scholar]
- Villegas F, Lehalle D, Mayer D, Rittirsch M, Stadler MB, Zinner M, Olivieri D, Vabres P, Duplomb‐Jego L, De Bont E et al (2019) Lysosomal signaling licenses embryonic stem cell differentiation via inactivation of Tfe3. Cell Stem Cell 24(2): 257–270 [DOI] [PubMed] [Google Scholar]
- Visvikis O, Ihuegbu N, Labed SA, Luhachack LG, Alves AF, Wollenberg AC, Stuart LM, Stormo GD, Irazoqui JE (2014) Innate host defense requires TFEB‐mediated transcription of cytoprotective and antimicrobial genes. Immunity 40: 896–909 [DOI] [PMC free article] [PubMed] [Google Scholar]
- Wada S, Neinast M, Jang C, Ibrahim YH, Lee G, Babu A, Li J, Hoshino A, Rowe GC, Rhee J et al (2016) The tumor suppressor FLCN mediates an alternate mTOR pathway to regulate browning of adipose tissue. Genes Dev 30: 2551–2564 [DOI] [PMC free article] [PubMed] [Google Scholar]
- Wang C, Niederstrasser H, Douglas PM, Lin R, Jaramillo J, Li Y, Oswald NW, Zhou A, McMillan EA, Mendiratta S et al (2017) Small‐molecule TFEB pathway agonists that ameliorate metabolic syndrome in mice and extend C. elegans lifespan. Nat Commun 8: 2270 [DOI] [PMC free article] [PubMed] [Google Scholar]
- Wang H, Wang N, Xu D, Ma Q, Chen Y, Xu S, Xia Q, Zhang Y, Prehn JHM, Wang G et al (2019) Oxidation of multiple MiT/TFE transcription factors links oxidative stress to transcriptional control of autophagy and lysosome biogenesis. Autophagy 16: 1683–1696 [DOI] [PMC free article] [PubMed] [Google Scholar]
- Wang L, Qu G, Gao Y, Su L, Ye Q, Jiang F, Zhao B, Miao J (2018) A small molecule targeting glutathione activates Nrf2 and inhibits cancer cell growth through promoting Keap‐1 S‐glutathionylation and inducing apoptosis. RSC Advances 8: 792–804 [DOI] [PMC free article] [PubMed] [Google Scholar]
- Wang Y, Huang Y, Liu J, Zhang J, Xu M, You Z, Peng C, Gong Z, Liu W (2020) Acetyltransferase GCN5 regulates autophagy and lysosome biogenesis by targeting TFEB. EMBO Rep 21: e48335 [DOI] [PMC free article] [PubMed] [Google Scholar]
- Watanabe Y, Murdoch CE, Sano S, Ido Y, Bachschmid MM, Cohen RA, Matsui R (2016) Glutathione adducts induced by ischemia and deletion of glutaredoxin‐1 stabilize HIF‐1alpha and improve limb revascularization. Proc Natl Acad Sci USA 113: 6011–6016 [DOI] [PMC free article] [PubMed] [Google Scholar]
- Willett R, Martina JA, Zewe JP, Wills R, Hammond GRV, Puertollano R (2017) TFEB regulates lysosomal positioning by modulating TMEM55B expression and JIP4 recruitment to lysosomes. Nat Commun 8: 1580 [DOI] [PMC free article] [PubMed] [Google Scholar]
- Zhang J, Wang J, Zhou Z, Park JE, Wang L, Wu S, Sun X, Lu L, Wang T, Lin Q et al (2018) Importance of TFEB acetylation in control of its transcriptional activity and lysosomal function in response to histone deacetylase inhibitors. Autophagy 14: 1043–1059 [DOI] [PMC free article] [PubMed] [Google Scholar]
- Zhang X, Yu L, Xu H (2016) Lysosome calcium in ROS regulation of autophagy. Autophagy 12: 1954–1955 [DOI] [PMC free article] [PubMed] [Google Scholar]
Associated Data
This section collects any data citations, data availability statements, or supplementary materials included in this article.
Supplementary Materials
Appendix
Expanded View Figures PDF
Table EV1
Table EV2
Source Data for Expanded View and Appendix
Review Process File
Source Data for Figure 1
Source Data for Figure 2
Source Data for Figure 3
Source Data for Figure 4
Source Data for Figure 5
Source Data for Figure 6
Source Data for Figure 7
Source Data for Figure 8
Data Availability Statement
Source data for Figs 1, 2, 3, 4, 5, 6, 7, 8 and Fig EV1, EV2, EV3, EV4, EV5 and Appendix Fig S1 and S3 are provided with the paper. The mass spectrometry proteomics data have been deposited to the ProteomeXchange Consortium (http://proteomecentral.proteomexchange.org) via the PRIDE partner repository (Perez‐Riverol et al, 2019) with the dataset identifier PXD022258 (http://www.ebi.ac.uk/pride/archive/projects/PXD022258).