Other reviews in this collection cover the basic aspects of various anabolic and catabolic pathways. In mammalian cells, these pathways are tightly regulated by availability of nutrients and stimulation of signaling pathways by cell-surface receptors engaged by extracellular factors. Mammalian cells take up nutrients under the instruction of these signaling pathways, unlike yeast cells, which take up nutrients in a cell-autonomous manner. These signaling pathways maintain homeostasis by allowing sufficient nutrient uptake to maintain metabolic demand. In the presence of ample nutrients and certain growth factors, cells grow in size and at times this is coupled with cell proliferation. If a particular nutrient (amino acid, oxygen, or glucose) becomes depleted, then cells have nutrient-sensing mechanisms that switch from an anabolic program to a catabolic program. Similarly, if nutrients are abundant, but the extracellular factors that activate signaling pathways for nutrient uptake are absent, then cells also undergo a catabolic program. By decreasing anabolism, the cells diminish their metabolic demand, and by activating catabolic pathways, they try to increase metabolic supply with the ultimate goal of maintaining an energy charge ratio that sustains survival (see Chandel 2020a). Autophagy (“self-eating”) is a catabolic metabolic program that is activated when intracellular nutrient uptake or availability is diminished. Autophagy generates intracellular amino acids and other substrates that can be used to generate ATP. Cells cannot forever sustain autophagy because eventually there is nothing left to catabolize and the cells die of bioenergetic collapse. Amazingly, before this collapse, the reintroduction of intracellular nutrients allows the cells to grow back to their original size.
This review focuses on signaling pathways that promote nutrient uptake, respond to changes in nutrients, and regulate autophagy. Two critical metabolic pathways are glycolysis and mitochondrial oxidative metabolism (see Chandel 2020b,c); thus, we will discuss signaling pathways that are activated when glucose or oxygen levels diminish. Finally, this review focuses on how metabolites can confer posttranslational modifications (PTMs), such as acetylation, to regulate enzymes within metabolic pathways.
SIGNAL TRANSDUCTION REGULATES UPTAKE AND USE OF NUTRIENTS
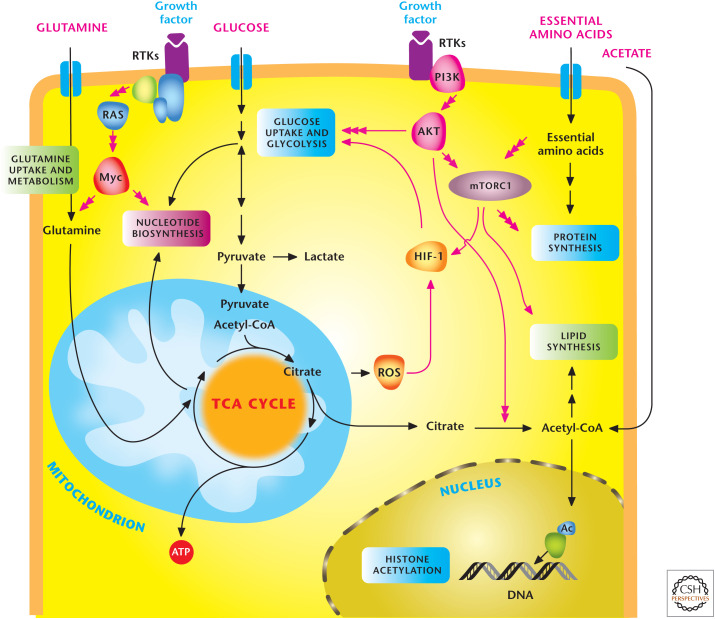
Extracellular factors engage their receptors to activate signal transduction pathways that concomitantly activate anabolic metabolic pathways and transporters for nutrient uptake in mammalian cells (Fig. 1). Insulin is perhaps the most potent anabolic factor. It stimulates the insulin receptor, a member of the cell membrane receptor tyrosine kinases (RTKs), resulting in uptake of glucose, amino acids, and fatty acids into cells and promotes synthesis of lipids, proteins, and carbohydrates. The RTKs stimulate a diverse series of signaling pathways, including the PI3K/AKT/mTOR and RAS/RAF/MEK pathways. RTK activates the lipid kinase phosphoinositide 3-kinase (PI3K), which phosphorylates membrane lipid phosphatidylinositol 4,5-bisphosphate (PIP2) to generate phosphatidylinositol 3,4,5-trisphosphate (PIP3). PIP3 recruits serine/threonine-specific protein kinase AKT, also known as protein kinase B, to the cell membrane, where it is activated by phosphorylation by phosphoinositide-dependent kinase 1 (at threonine 308) and the mechanistic target of rapamycin complex 2 (mTORC2 at serine 473). The major output of AKT signaling is the activation of mechanistic target of rapamycin complex 1 (mTORC1), which increases multiple anabolic pathways, including protein and lipid synthesis (discussed in the next section). AKT, through mTORC1-independent and -dependent pathways, can increase both the activity and expression of glucose and amino acid transporters at the surface. Furthermore, AKT stimulates the activity of multiple glycolytic enzymes, including hexokinase, the first rate-limiting step of glycolysis. AKT, through mTORC1, can also increase the translation of HIF1α protein. HIF1α can heterodimerize with HIF1β to generate the transcriptionally active HIF1, which increases glucose transporters and glycolytic enzymes.
Figure 1.
Signal transduction pathways regulate metabolism. In multicellular organisms, cells use growth factors to uptake nutrients. Growth factors through receptor tyrosine kinases (RTKs) activate the PI3K to stimulate AKT and mTORC1, which promotes glycolysis and lipid synthesis. mTORC1 signaling responds to levels of essential amino acids to stimulate protein synthesis. The HIF-1 transcription factor further promotes glycolysis. RTK activation also activates Myc transcription factor, which enhances both glycolysis and mitochondrial metabolism. Myc stimulates glutamine metabolism necessary to sustain mitochondrial metabolism and nucleotide biosynthesis. Mitochondrial ROS and acetyl-CoA production promote HIF-1 activation and histone acetylation, respectively, as examples of metabolism feeding back on signaling. (Adapted, with permission, from Ward and Thompson 2012.)
Additional transcriptional induction of metabolic enzymes comes from stabilization of the MYC protein by the RAS (rat sarcoma viral oncogene) activation of ERK mitogen-activated protein kinase. The newly synthesized MYC protein undergoes ubiquitination and degradation, but can be stabilized when phosphorylated at serine 62 (Ser62) by ERK activity. Stabilized MYC protein heterodimerizes with the MAX protein to activate transcription of enzymes involved in glycolysis and mitochondrial metabolism, as well as lipid, nucleotide, amino acid, and carbohydrate metabolism. In summary, signal transduction controls metabolism through posttranslational regulation by AKT and mTORC1 coupled with transcriptional regulation by HIF-1 and MYC of metabolic enzymes and nutrient transporters.
mTOR INTEGRATES NUTRIENT AVAILABILITY AND GROWTH FACTOR SIGNALING
As noted above, both nutrients and RTKs regulate metabolism. The atypical serine/threonine protein kinase mTOR integrates metabolic regulation by growth factors and nutrients. The identification of mTOR began in the early 1990s in genetic screens in yeast that elucidated target of rapamycin (TOR1 and TOR2) as mediators of the toxic effects of rapamycin on yeast (Box 1). Subsequently, biochemical approaches led to the discovery of mTOR. On entry into mammalian cells, rapamycin binds to FKBP12, creating a drug–receptor complex that binds mTOR. The mechanism by which the rapamcyin–FKBP12 interaction disrupts mTOR function is not fully understood. mTOR is a component of two large protein complexes known as mTOR Complex I (mTORC1) and mTOR Complex 2 (mTORC2). The two complexes share common proteins, but they also have distinct proteins within their complexes. Importantly, the two complexes participate in divergent biological functions.
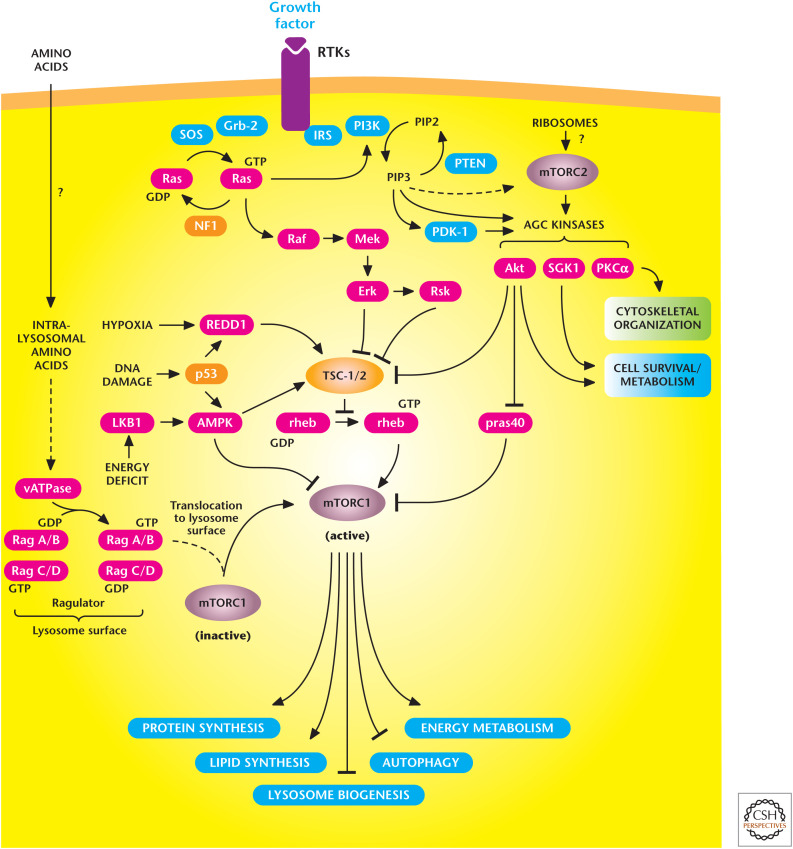
In the presence of ample nutrients and growth factors, mTORC1 activation promotes anabolic pathways involved in protein synthesis and lipid synthesis and also stimulates glycolysis and mitochondrial metabolism (Fig. 2). mTORC1 suppression blocks these pathways and induces autophagy and lysosomal biogenesis. A salient feature of mTORC1 is that it changes its activity in response to availability of amino acids, oxygen, and growth factors, as well as decreases in the energetic status of cells. The upstream regulator of mTORC1 is the heterodimer consisting of tuberous sclerosis 1 and 2 (TSC1 and TSC2), which functions as a GTPase-activating protein for the Ras homolog enriched in brain (RHEB) GTPase. The GTP-bound RHEB stimulates mTORC1 kinase activity, and the TSC1/2 complex converts RHEB into the inactive GDP-bound state. Thus, repressing TSC1/2 allows RHEB to stimulate mTORC1 kinase activity. There are many inputs that either repress or activate TSC1/TSC2 to control mTORC1 activity. Growth factor activation of AKT inhibits TSC1/TSC2, resulting in mTORC1 stimulation to promote anabolism. In contrast, when cells are under limited oxygen (hypoxia) or energetically stressed, mTORC1 is inhibited to block energy-consuming anabolic pathways and stimulate catabolic pathways, such as autophagy.
Figure 2.
The mechanistic target of rapamycin (mTOR) signaling pathway controls metabolism and cell survival. mTORC1 stimulates multiple anabolic metabolic pathways (lipid and protein synthesis) in the presence of nutrients and growth factors. Conversely, limiting nutrient or growth factor availability promotes catabolic pathways (autophagy). mTORC2 promotes cell survival through activation of AKT. (Adapted from Laplante and Sabatini 2012.)
The availability of amino acids also regulates mTORC1 activity, but not through TSC1/TSC2. Instead, the abundance of amino acids, particularly leucine and arginine, through unknown mechanisms is sensed at the lysosome surface to activate RAG (Ras-related GTP binding) GTPases, which promote mTORC1 activation. It is important to note that when cells are energetically stressed or have diminished oxygen or amino acid availability, they inhibit mTORC1 activity, even in the presence of growth factor stimulation. Thus, growth factors cannot promote mTORC1-dependent anabolism in the absence of nutrients. In contrast to mTORC1, mTORC2 primarily responds to growth factors and is insensitive to nutrients. It is not clear how mTORC2 is activated, but recent evidence suggests that perhaps ribosomes bind mTORC2 in a PI3K-dependent manner to activate mTORC2. This activation results in phosphorylation of the AGC subfamily of kinases, notably phosphorylating AKT at Ser-473, which enhances the strength of AKT activation downstream from PI3K and increases the range of effective AKT substrates. Understanding the complexity of mTOR pathways is important for the development of drugs that target this pathway given that laboratory studies indicate that mTOR activation is critical for nutrient overload resulting in obesity, whereas pharmacologic or genetic reduction in mTOR activity in multiple model organisms extends life span.
BOX 1.
mTOR AND EASTER ISLAND
The story of the discovery of mTOR begins in 1964 when Canadian scientists sailed across the Pacific to Easter Island, known as Rapa Nui by the locals, to collect soil and other biological materials. The expedition shared their soil samples with scientists at Ayerst's research laboratories in Montreal. This island renowned for its famous statues (moai) would contain a biological gem in a lipophilic macrolide produced by the bacteria Streptomyces hygroscopicus found in the soil. This antibiotic was identified and isolated in 1972 by Dr. Suren Sehgal and named rapamycin (generic name: sirolimus), after Easter Island's native name. Dr. Sehgal and his colleagues discovered that rapamycin showed potent antifungal properties and also suppressed the immune system. They sent the drug to the National Cancer Institute, where it was discovered that rapamycin displayed antitumorigenic activity. Rapamycin was not pursued further until the late 1980s when Ayerst had merged with Wyeth, and it was then developed as an immunosuppressant to prevent transplant rejection. In 1999, the Food and Drug Administration approved rapamycin (trade name Rapamune) for use in prevention of organ rejection in kidney transplant patients. In the past decade, rapamycin and its derivatives have been approved for a variety of uses, including prevention of restenosis following angioplasty and as a treatment for certain forms of cancer.
AMPK INDUCES CATABOLISM
mTOR positively regulates anabolic processes when nutrients are ample, but cells also have signaling mechanisms to switch to a catabolic program when nutrients are limiting. Cells constantly require an optimal energy charge that is compatible with maintaining cellular processes required for survival (Chandel 2020a). Thus, ATP demand and supply have to be balanced. AMPK (AMP-activated protein kinase) is activated when metabolic demand exceeds metabolic supply, resulting in a decrease in the ATP/ADP ratio, which switches off anabolic pathways, such as lipid and protein synthesis, while promoting catabolic pathways, such as autophagy, to restore energy homeostasis. A typical energetically unstressed cell has an ATP/ADP ratio of 10:1 and an ATP/AMP ratio of 100:1. Cells couple energetically unfavorable reactions to a high ATP/ADP ratio (see Chandel 2020a). An increase in ATP consumption, not matched by ATP supply, will result in an increase in ADP that will be rapidly converted to ATP by adenylate kinases, which catalyze the reversible reaction 2ADP ↔ ATP + AMP. When this occurs, this reaction generates a drastic increase in AMP levels compared with changes in ATP or ADP.
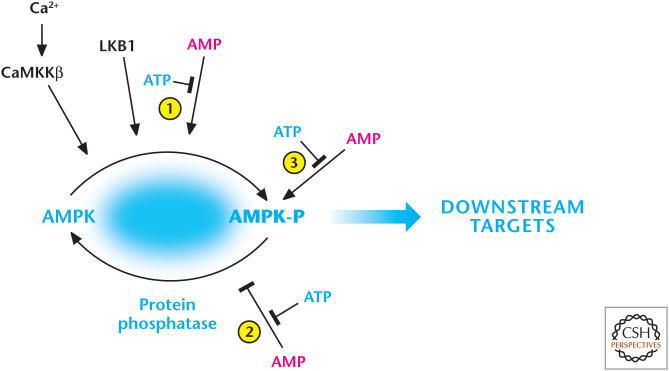
The kinase AMPK responds to increases in AMP levels (Fig. 3). AMPK exists as a heterotrimer, consisting of a catalytic subunit (α) and two regulatory subunits (β and γ). The γ subunit binds to AMP, ADP, and ATP to regulate the phosphorylation of Thr172 within the activation loop of the α-subunit kinase domain, the key step in promoting AMPK activation. There are multiple mechanisms by which AMP promotes AMPK activation. First, AMP causes promotion of Thr172 phosphorylation by a complex containing the tumor suppressor kinase liver kinase B1 (LKB1). Second, the effect of increased phosphorylation is amplified up to 10-fold further by allosteric activation by binding of AMP. Third, both ADP and AMP inhibit dephosphorylation of Thr172 by the phosphatases. However, AMP is about 10-fold more potent than ADP. ATP antagonizes all of these effects. AMPK can also be activated by Thr-172 phosphorylation catalyzed by CaMKKβ through a mechanism that requires an increase in intracellular calcium without any changes in adenine nucleotides.
Figure 3.
AMP and calcium activate AMP-activated protein kinase (AMPK). AMP displaces ATP on the AMPK-γ subunit to (1) promote phosphorylation and (2) inhibit dephosphorylation of threonine-172, resulting in robust activation of AMPK. The constitutively active kinase LKB1 is required for phosphorylation of threonine-172. AMP further activates the phosphorylated AMPK (3). AMPK can also be activated by threonine-172 phosphorylation catalyzed by CaMKKβ, which also activates AMPK at threonine-172 through an increase in intracellular calcium, but independent of AMP and LKB1. (Adapted from Hardie and Alessi 2013.)
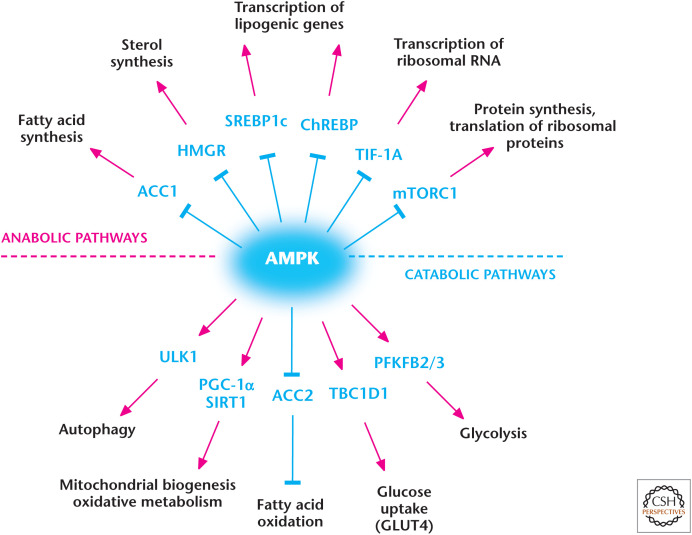
Originally, AMPK was discovered to phosphorylate and inactivate the enzymes acetyl-CoA carboxylase (ACC) and 3-hydroxy-3-methylglutaryl-CoA reductase, which are key regulators of fatty acid and sterol biosynthesis, respectively. Subsequently, AMPK was discovered to phosphorylate multiple metabolic enzymes, as well as transcription factors and coactivators, to collectively diminish anabolic pathways that use NADPH and ATP while activating catabolic pathways that generate ATP (Fig. 4). For example, AMPK also promotes fatty acid oxidation in the mitochondria to increase ATP production while preventing de novo fatty acid synthesis, an ATP- and NADPH-consuming pathway. AMPK also suppresses the anabolic kinase mTORC1 activity by phosphorylating TSC2 and raptor, a regulatory subunit of mTORC1. The major catabolic program that AMPK engages in is the activation of autophagy, discussed in the next section.
Figure 4.
AMP-activated protein kinase (AMPK) regulates metabolism. AMPK positively and negatively regulates catabolic and anabolic pathways, respectively. (Adapted from Hardie and Alessi 2013.)
AUTOPHAGY IS A CATABOLIC PROGRAM THAT MAINTAINS SURVIVAL
The late Christian de Duve (1974 Nobel Prize winner for the discovery of lysosomes), in the 1960s, observed and coined the term “autophagy.” Decades later, in the early 1990s, the molecular details underlying autophagy began to be elucidated largely through genetic approaches in yeast that analyzed autophagy-defective mutants. These studies identified multiple autophagy-related genes (ATGs), many of which are functionally conserved in mammals. Autophagy is thought to have evolved as a stress response to allow unicellular eukaryotic organisms to survive starvation by generating amino acids needed to produce a subset of proteins required for adaptation to starvation and are catabolized through the TCA cycle to produce ATP for survival. Autophagy has been shown to be crucial for surviving starvation in multiple organisms, including yeast, flies, and worms. In mice, autophagy is up-regulated in most tissues, except the nervous tissues, and shortly after birth, when nutrient supply from the placenta is abruptly terminated. Autophagy-deficient mice display normal amino acid levels at birth, but die within hours after birth because of their inability to maintain the amino acid pool. Interestingly, induction of low levels of autophagy is thought to promote longevity by clearing damaged organelles and aberrant proteins that accumulate over time.
There are three types of autophagy: macroautophagy, microautophagy, and chaperone-mediated autophagy (CMA) (Fig. 5). Macroautophagy occurs when large regions of the cytosol containing organelles are sequestered into a double-membrane vesicle called the autophagosome, which fuses with lysosomes for degradation; this generates metabolites, such as amino acids, which can be used to generate ATP for survival. In contrast, in microautophagy, the lysosomal membrane invaginates to sequester small regions of the cytosol, which are internalized into the lysosomal lumen as single-membrane vesicles. In CMA, substrate proteins are specifically recognized by a cytosolic chaperone that transports them to the surface of the lysosome where they translocate by receptor-mediated mechanisms to the lysosomal lumen for degradation. It is important to note that autophagy occurs at a basal level in the presence of growth factors and ample nutrients as it is involved in degradation of damaged organelles and proteins. Nutrient and/or growth factor deprivation that limits nutrient uptake dramatically induce macroautophagy.
Figure 5.
Overview of autophagy. The autophagy pathway has multiple steps, including an autophagosome that contains damaged organelles that are degraded in the final stage. This ensures organelle quality control and can generate metabolites for ATP production during nutrient-limiting conditions. (Adapted, with permission, from Choi et al. 2013, © Massachusetts Medical Society.)
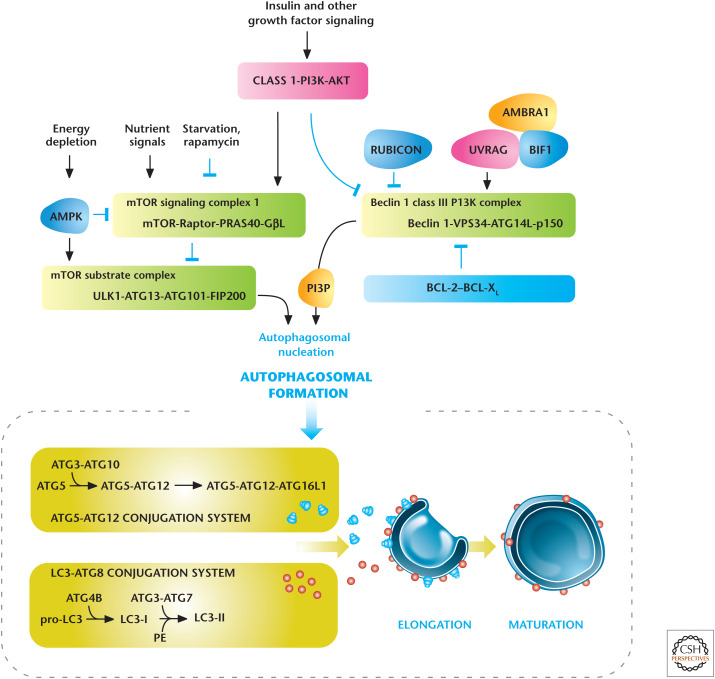
The macroautophagy pathway can be broken down into several discrete phases, including initiation involving the formation of a preautophagosomal structure leading to an isolation membrane followed by vesicle expansion and autophagosome maturation. Subsequently, the autophagosome fuses with the lysosome and the autophagosomal contents are degraded by lysosomal acid hydrolases generating metabolites, such as amino acids, which can be used as a fuel source to maintain an optimal energy charge for survival. These molecular events are executed by homologs of products of the ATGs (Atg) originally identified in yeast. Autophagosomal membrane initiation requires translocation of a complex consisting of UNC-51-like kinase 1 (ULK1), ATG13, ATG101, and FIP200 from the cytosol to certain domains of the endoplasmic reticulum, resulting in the recruitment of the Beclin 1 interacting complex (consisting of Beclin 1, the class III phosphatidylinositol 3-kinase [VPS34], and ATG14 L) to generate phosphatidylinositol-3-phosphate (PIP3), the key initiating step (Fig. 6). Autophagosomal expansion requires two ubiquitin-like conjugation systems, the microtubule-associated protein light chain 3 (LC3–ATG8) and the ATG5–ATG12 complex. Autophagosome formation is indicated by the conversion of a cytosolic truncated form of LC3 (LC3-I) to its autophagosomal membrane-associated, phosphatidylethanolamine-conjugated form (LC3-II).
Figure 6.
Regulators of autophagy. Growth factors and nutrients through PI3K/AKT and mTORC1, respectively, negatively regulate autophagy. AMP-activated protein kinase (AMPK) positively regulates autophagy. Autophagy is also regulated by the Beclin 1 interacting complex. Autophagosomal elongation requires the ATG5-ATG12 and LC3-ATG8 ubiquitin-like conjugation systems. In mammals, the conversion of LC3-I (free-form) to LC3-II (phosphoethanolamine-conjugated form) is used as a marker of autophagy. (Adapted, with permission, from Choi et al. 2013, © Massachusetts Medical Society.)
Autophagy has to be tightly controlled so that it is not inadvertently stimulated when intracellular nutrient availability is ample and cells are in an anabolic mode. The kinases mTORC1 and AMPK are two dominant regulators of autophagy. mTORC1 is maintained in an active conformation to concomitantly stimulate an anabolic program compatible with cellular growth while suppressing the catabolic program of autophagy when intracellular amino acids and other nutrients are abundant. mTORC1 phosphorylates and negatively regulates ULK1 to suppress autophagy when nutrients are limiting, especially amino acids. Nutrient limitation also activates AMPK (as discussed above), which inhibits mTORC1, and also directly phosphorylates ULK1 to initiate autophagy. Thus, ULK1 integrates mTORC1 and AMPK signaling to regulate autophagy.
OXYGEN AND GLUCOSE REGULATE TRANSCRIPTIONAL NETWORKS
Two nutrient changes that cells respond to are those in environmental oxygen and glucose levels. Oxygen homeostasis is essential for the life and health of metazoans. Thus, multiple mechanisms evolved for adaptation to decreases in oxygen levels (i.e., hypoxia). These organismal adaptive responses include increased ventilation and constriction of the pulmonary artery, angiogenesis (formation of new blood vessels), and erythropoiesis (generation of red blood cells), as well as a cellular transcriptional program that promotes glycolysis. It makes sense that as oxygen levels are diminishing there would be enhanced glycolysis coupled with angiogenesis to bring more blood flow, as well as stimulation of erythropoiesis to increase oxygen-carrying capacity.
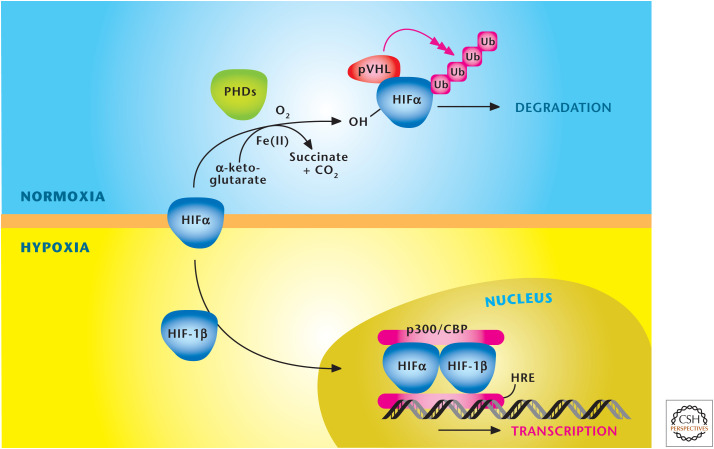
At the cellular level, oxygen levels starting at 5% begin to noticeably activate the hypoxia-inducible transcription factors (HIFs) (Fig. 7). HIFs bind to hypoxia-response elements in the promoter/enhancer regions of a large number of target genes, including all the glycolytic enzymes, erythropoietin to simulate erythropoiesis, and proangiogenic factor vascular endothelial growth factor. HIFs are a heterodimer consisting of two basic helix–loop–helix/PAS proteins, HIF-1α or HIF-2α and HIF-1β. The HIF-1β subunit is constitutively present in the cell, but the HIFα subunit is only present during hypoxia. During normoxia, HIF-1α is polyubiquitinated and targeted for degradation by an E3 ubiquitin ligase, which contains the specificity factor, the von Hippel–Lindau tumor suppressor (VHL). The binding of VHL to HIFα is dependent on the hydroxylation of proline residues within the oxygen-dependent degradation domain (ODD) of HIFα. A family of α-ketoglutrate-dependent dioxygenases, termed prolyl hydroxylases 1, 2, and 3 (PHDs 1–3), catalyze this hydroxylation event. Genetic studies have revealed that PHD2 is the primary enzyme responsible for hydroxylation of the HIFα subunit. The activity of PHD2 is inhibited under hypoxic conditions, allowing the accumulation of HIFα protein and the subsequent binding to HIFβ subunit to induce the transcriptional response. HIF1 and -2 have distinct and overlapping gene targets. HIFs are activated by other stimuli, notably ROS, and have been implicated in pathological conditions including pulmonary hypertension, inflammation, and cancer.
Figure 7.
Oxygen levels control stabilization of HIFs. HIFs are a heterodimer, consisting of a constitutively stable HIF-1β and an oxygen-sensitive HIFα subunit. The HIFα subunit is hydroxylated at proline residues in the ODD by PHDs under normoxia. In addition to oxygen, the PHDs require iron (Fe2+) and α-ketoglutrate as substrates for hydroxylation. The von Hippel–Lindau protein (pVHL) recognizes hydroxylated proline residues and targets the HIFα subunit for rapid degradation by the proteasome. Hypoxia diminishes hydroxylation of HIFα to prevent its degradation and promote dimerization with HIF-1β to bind specific hypoxia response elements (HRE) in the promoter regions of its target genes. (Adapted, with permission, from Balligand et al. 2009, © The American Physiological Society.)
An important adaptation of hypoxia is to reduce metabolism as measured by a decrease in the mitochondrial oxygen consumption of cells (i.e., the respiratory rate) occurring at oxygen levels (1%–3% O2) that are well above the threshold in which oxygen becomes limiting (<0.3% O2) to cytochrome c oxidase (complex IV), a phenomenon referred to as oxygen conformance. Complex IV is the main enzyme in the electron transport chain (ETC) that uses oxygen and couples it to the generation of ATP (see Chandel 2020c). ATP, ADP, and AMP levels do not change in 1%–3% O2 levels. Nevertheless, AMPK is activated within minutes through CaMKKβ at these oxygen levels to repress mTORC1, thus, shifting from anabolism to catabolism. Within minutes, hypoxia also decreases the activity of the plasma membrane Na/K-ATPase, a major ATP consumer. Longer exposure to hypoxia results in HIF-1-mediated repression of mTORC1 and other anabolic processes while stimulating glycolysis and autophagy (Fig. 8).
Figure 8.
HIFs regulate adaptation to hypoxia. Multiple inputs, including hypoxia, ROS, TCA metabolites (succinate and fumarate), and NO, inhibit prolyl hydroxlases (PHDs) to activate hypoxia inducible factors (HIFs). At the organismal level, HIFs stimulate angiogenesis, erythropoiesis, and ventilation to increase oxygen delivery. At the cellular level, HIFs diminish oxidative phosphorylation and increase glycolysis. HIFs also suppress ATP-consuming generation to preserve a high ATP/ADP ratio in cells. (Adapted from Kaelin and Ratcliffe 2008.)
A perplexing observation under hypoxia is that cells display an increase in ROS generated from the mitochondrial ETC. The details underlying this phenomenon are not fully understood. However, suppression of mitochondrial ROS can diminish many of the effects of hypoxia, such as HIF and AMPK activation. Thus, mitochondrial ROS serve as signaling molecules that couple lowering of oxygen levels to multiple biological effects. A long-term consequence of hypoxia would be a marked state of high ROS, which could accumulate to levels that would cause oxidative damage to cells. Cells have adapted strategies to counteract the buildup of ROS during hypoxia. In particular, HIF-1 decreases pyruvate conversion to acetyl-CoA through induction of lactate dehydrogenase A (LDH-A) and pyruvate dehydrogenase kinase 1 (PDK1). PDK1 phosphorylates and inactivates the catalytic subunit of pyruvate dehydrogenase (PDH). An increase in PDK1 protein levels decreases PDH activity, thereby preventing the conversion of pyruvate to acetyl-CoA, while also driving pyruvate conversion to lactate. LDH-A converts the pyruvate to lactate by using the NADH generated from glycolysis. The coordinated up-regulation of PDK1 and LDH-A diverts pyruvate from fueling the mitochondria to generation of lactate. The decreased acetyl-CoA levels in the mitochondria diminish the TCA cycle activity, resulting in reduced generation of mitochondrial NADH and FADH2 levels and reduced electron flux through the ETC. HIF-1 also decreases complex I and IV activity by inducing genes that regulate these complexes. Indeed, loss of HIF1 under hypoxia increases ROS to levels that induce death. Overall, HIF-1 diminishes ETC activity to prevent overproduction of ROS during hypoxia.
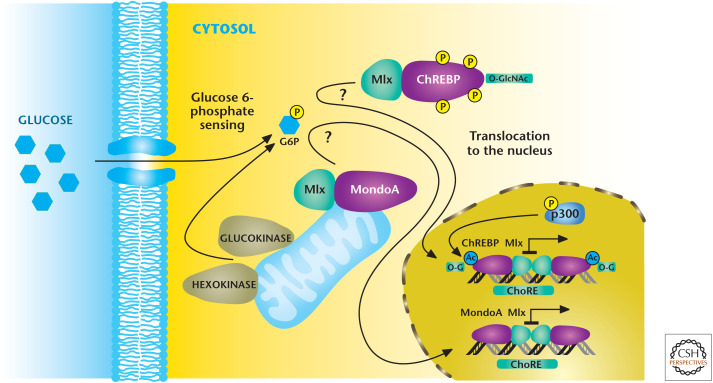
Mammalian cells also have mechanisms to monitor changes in glucose levels and couple them to transcriptional responses. Intracellular glucose is rapidly converted into glucose 6-phosphate, which, through unidentified mechanisms, activates MondoA and ChREBP that in turn heterodimerize with the Mlx protein to make functional transcriptional factors (Fig. 9). The MondoA/Mlx complex localizes to the outer mitochondrial membrane, whereas the ChREBP/Mlx is localized in the cytosol under low-glucose conditions. In response to an increase in glucose 6-phosphate levels, MondoA/Mlx and ChREBP/Mlx complexes translocate to the nucleus where they bind to carbohydrate response elements (ChoRE), resulting in activation of genes that encode enzymes in glycolysis and lipid synthesis. The initial identification of ChoRE allowed the purification of ChREBP (carbohydrate response element binding protein). ChREBP also undergoes various PTMs, notably O-GlcNAcylation, for maximal transcriptional activation.
Figure 9.
Mondo transcription factors respond to glucose flux. Mondo transcription factors ChREBP and MondoA, with their common binding partner Mlx, are stimulated through unknown mechanisms to an increase in glucose 6-phosphate levels. Subsequently, MondoA/Mlx and ChREBP/Mlx complexes translocate to the nucleus where they bind to ChoRE, resulting in activation of genes that encode enzymes in glycolysis and lipid synthesis. (Adapted from Havula and Hietakangas 2012, with permission from Elsevier.)
A downstream production of glucose 6-phosphate is fructose 6-phosphate, which can funnel into the hexosamine pathway to generate O-GlcNAcylation. ChREBP is detectable in most tissues, but is at its highest levels in liver. The ChREBP/Mlx complex redirects glucose metabolism to support lipogenesis by inducing a number of key genes involved in fatty acid synthesis, including ACC, fatty acid synthase, and stearoyl-CoA desaturase 1. The ChREBP/Mlx complex also targets induction of the liver pyruvate kinase gene. In the fasting state, hepatic glycolysis and lipogenesis are suppressed, whereas gluconeogenesis and fatty acid oxidation are enhanced (see Chandel 2020d). This shift from anabolism to catabolism is regulated by hormones glucagon and epinephrine, which increase cAMP concentration and activate cAMP-activated protein kinase, which phosphorylates and inactivates ChREBP. Similarly, intracellular accumulation of AMP inhibits ChREBP through AMPK activation. The Mondo/Mlx complex is also detectable in most tissues, but it is strongly expressed in skeletal muscle. The Mondo/Mlx complex transcriptionally induces many glycolytic enzymes, including the rate-limiting enzymes. Interestingly, growth factor signaling promotes protein ChREBP expression. In proliferating cells, such as cancer cells, the ChREBP/Mlx complex promotes genes involved in de novo lipid and nucleotide metabolism. Interestingly, growth factor signaling promotes protein ChREBP expression. Thus, growth factor signaling coordinates two key aspects: (1) stimulation of glucose uptake and glycolysis to produce glucose 6-phosphate and (2) the expression of ChREBP.
INTRACELLULAR METABOLITES CONTROL SIGNALING
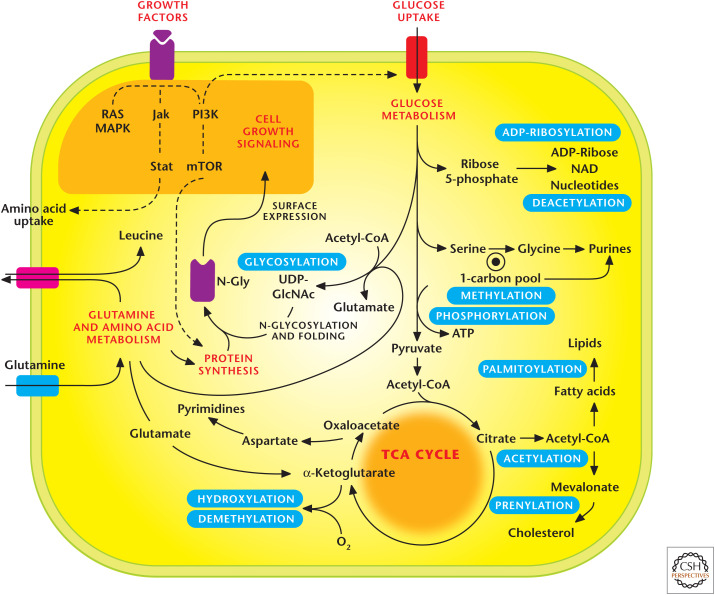
In addition to control of signaling by growth factor signaling and nutrients, intracellular metabolites can exert feedback control on signaling through PTMs of proteins, such as glycosylation, acetylation, methylation, and prenylation (Fig. 10). These covalent modifications by metabolites change activity, localization, or stability of target proteins. The metabolic fluxes through different pathways required to produce these PTM substrates fluctuate in response to intracellular metabolite availability, as well as different cellular states—differentiation versus proliferation.
Figure 10.
Metabolic pathways regulate signaling pathways. Metabolic pathways generate substrates that are used as posttranslational modifications (PTMs) to control signal transduction. Notable PTMs highlighted include glycosylation, prenylation, palmitoylation, hydroxylation, methylation/demethylation, phoshorylation, acetylation/deacyetylation, and ADP-ribosylation. (Adapted, with permission, from Metallo and Vander Heiden 2010.)
A key metabolite that governs many of these PTMs is acetyl-CoA. Acetyl-CoA is a precursor for fatty acid and cholesterol synthesis pathways, which provide substrates for palmitoylation, myristoylation, and prenylation (Chandel 2020e). Acetyl-CoA also is a substrate for protein acetylation, notably on lysine residues. Acetylation is controlled by the collective activity of acetyltransferases and deacetylases. Acetyl-CoA, which is produced in the mitochondria, condenses with oxaloacetate to generate citrate, which can be exported into the cytosol. Subsequently, the enzyme ATP citrate lyase (ACLY) converts citrate into oxaloacetate and acetyl-CoA. Thus, mitochondrial oxidative metabolism is a major source of acetyl-CoA used for protein acetylation. The other source is acetate produced by the bacteria in the gut. Acetate is converted into acetyl-CoA in the cytosol by ACECS1. Both ACL and ACECS1 are found in the nucleus and cytosol of mammalian cells; ACECS2 is the mitochondrial isoform. Not all cells have access to sufficient quantities of acetate; thus, ACLY-dependent reaction is the major source of acetyl-CoA in mammalian cells. One challenge in the field is to quantitatively measure acetyl-CoA levels under different cellular conditions in the nucleus, cytosol, and mitochondria.
The availability of acetyl-CoA in the cytosol from mitochondria increases in conditions of anabolic states, cellular proliferation, and differentiation. In contrast, most of the mitochondrial acetyl-CoA generated during the quiescent state is used to generate ATP and not exported into the cytosol. A consequence of this increase in acetyl-CoA levels is to acetylate histones at specific lysine residues, loosening the interaction between the negatively charged DNA and the histone and opening the chromatin structure to induce gene expression that promotes proliferation or differentiation. If signals for proliferation or differentiation exist, but metabolism is not induced to generate sufficient acetyl-CoA, then the failure to acetylate histones provides a fail-safe mechanism to halt the gene induction that promotes proliferation or differentiation. If the metabolic state of the cells were not linked to induction of genes, then cells would begin to undergo proliferation and differentiation without “realizing” whether they have enough biosynthetic and bioenergetic capacity to undertake a metabolically demanding process, such as proliferation or differentiation. Linking metabolism to gene induction is a conserved mechanism. When yeast cells enter a growth phase, transcription of cell growth genes is induced because of the increased histone acetylation that occurs as a result of increased acetyl-CoA production.
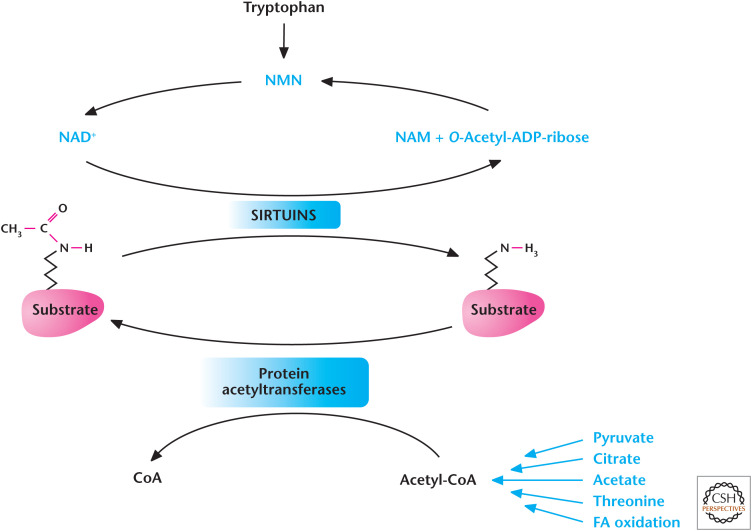
Acetylation also occurs extensively on lysine residues of many metabolic enzymes, including, but not limited to, those involved in glycolysis, fatty acid oxidation, and the TCA cycle. Typically, acetylation of these enzymes diminishes their activity and slows down metabolism. This is essentially a feedback of excess intracellular metabolite production readout by high levels of acetyl-CoA to not accelerate metabolism further because cells already are engaged in robust metabolism. In contrast, if metabolism is in a catabolic state, there is no need to further dampen metabolic enzymes by acetylation because energy generation is paramount under these conditions. Not all protein acetylation is sensitive to changes in acetyl-CoA concentration. For example, changes in acetyl-CoA levels that alter histone acetylation do not elicit changes in tubulin acetylation. Thus, acetyltransferases are likely to have different Km values for levels of acetyl-CoA (Fig. 11).
Figure 11.
Metabolism regulates acetylation and deacetylation. Acetyl-CoA provides the acetyl group for acetylation reactions catalyzed by protein acetyltransferases. The Sirtuin family of deacetylases uses NAD+ to remove acetyl group from proteins. (Adapted from Kaelin and McKnight 2013.)
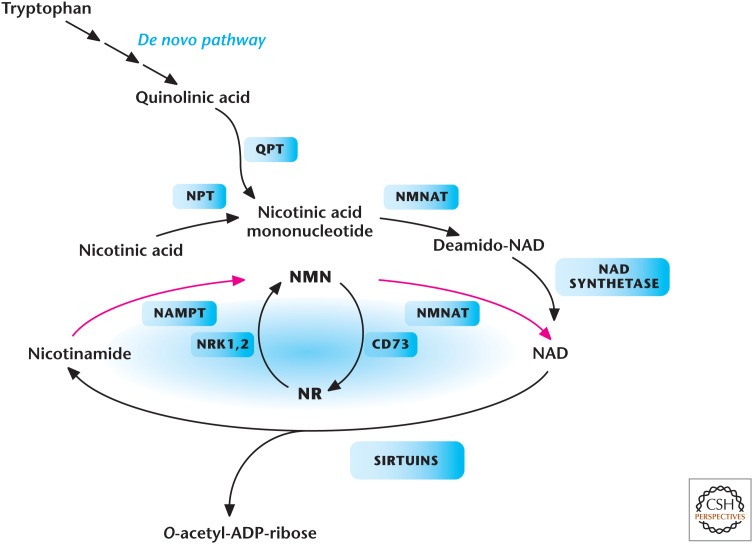
Deacetylase enzymes are another major input in controlling acetylation of proteins. These enzymes catalyze deacetylation in a NAD+-independent or -dependent manner. Of these enzymes, the family of NAD+-dependent deacetylases is the best characterized. These enzymes use NAD+ as a substrate to remove the acetyl group from the protein, yielding O-acetyl-ADP-ribose plus nicotinamide (NAM) as a product. The levels of NAD+ are tightly regulated through either the salvage or de novo pathway. In the salvage pathway, nicotinamide phosphoribosyltransferase (NAMPT) converts NAM to NMN (nicotinamide mononucleotide) and, subsequently, NMNAT (nicotinamide nucleotide adenylyltransferase 1) converts NMN to NAD+ (Fig. 12). In the de novo pathway, tryptophan is converted in multiple steps to produce nicotinic acid mononucleotide and, subsequently, NAD+.
Figure 12.
Metabolic pathways that generate NAD+ in mammals. Tryptophan, nicotinic acid, nicotinamide (NAM), or nicotinamide riboside (NR) are all NAD+ precursors. Enzymes in the pathways are quinolinate phosphoribosyltransferase (QPT), NMNAT, nicotinamide riboside kinase 1 and (NRK1,2), NAMPT, nicotinic acid phosphoribosyltransferase (NPT), and ecto-5′-nucleotidase (CD73). (Adapted from Imai and Guarente 2014, with permission from Elsevier.)
The seven members of the sirtuin (SIRT1–7) family are localized to different compartments of the cells and, thus, have different functions. Mitochondrial and cytoplasmic sirtuins control the acetylation status of metabolic enzymes, whereas nuclear sirtuins control acetylation of factors that control transcription of genes. Broadly, these deacetylases help organisms adapt to conditions when nutrient availability is diminished. Sirtuin's activity also declines with aging, which is linked to age-related pathologies. As discussed above, acetylation decreases activity of metabolic enzymes, but under nutrient-limiting conditions, cells deacetylate these enzymes to allow them to maximize their ability to generate glycolyltic and TCA-cycle metabolites necessary for energy generation. Also, under nutrient-limiting conditions, AMPK phosphorylates SIRT1 to increase its activity causing deacetylation of certain proteins in the nucleus, to allow activation of genes required for metabolic adaptation. Indeed, caloric restriction increases expression of genes that control NAD+ levels and sirtuins that collectively activate enzymes and genes for metabolic adaptation. Current efforts are examining mechanisms to boost sirtuin activity to ameliorate diseases. For example, the supplementation of NMN to boost NAD+ levels has been shown to prevent diet- and age-induced type II diabetes in mice.
Methylation of proteins (notably histones) and DNA is another PTM regulated by metabolism. Methylation is controlled by the collective activity of methyltransferases and demethylases (Fig. 13). S-adenosylmethionine (SAM) is the methyl donor used by most methyltransferases, including those that methylate histones and DNA. SAM is derived from methionine and becomes S-adenosylhomocysteine (SAH) on donating its methyl group. SAH is converted into homocysteine, which is then converted back to a vitamin B12-dependent reaction that uses carbons derived from folate or choline. Thus, methyltransferases are dependent on a supply of methionine or carbon flux into the folate pool.
Figure 13.
Metabolism regulates methylation. Methionine donates a methyl group to generate S-adenosylmethionine (SAM). Methyltransferases use SAM, resulting in the generation of S-adenosylhomocysteine (SAH), which is converted to homocysteine. Carbons derived from either choline- or folate-dependent reactions convert homocysteine back to methionine. DHF, dihydrofolate; THF, tetrahydrofolate; 5,10-MTHF, 5,10-methylene THF; CH3, methyl. (Adapted from Kaelin and McKnight 2013.)
An instructive example of metabolism driving epigenetic changes comes from the observation that the highly proliferative mouse embryonic stem cells (ESCs) require threonine as an amino acid to maintain their pluripotent state. Mouse ESCs express robust levels of the threonine dehydrogenase enzyme, which catabolizes threonine into 2-amino-3-ketobutyrate. Subsequently, 2-amino-3-ketobutyrate ligase using coenzyme A yields glycine and acetyl-CoA. Glycine, ultimately, can generate SAM required for methylation.
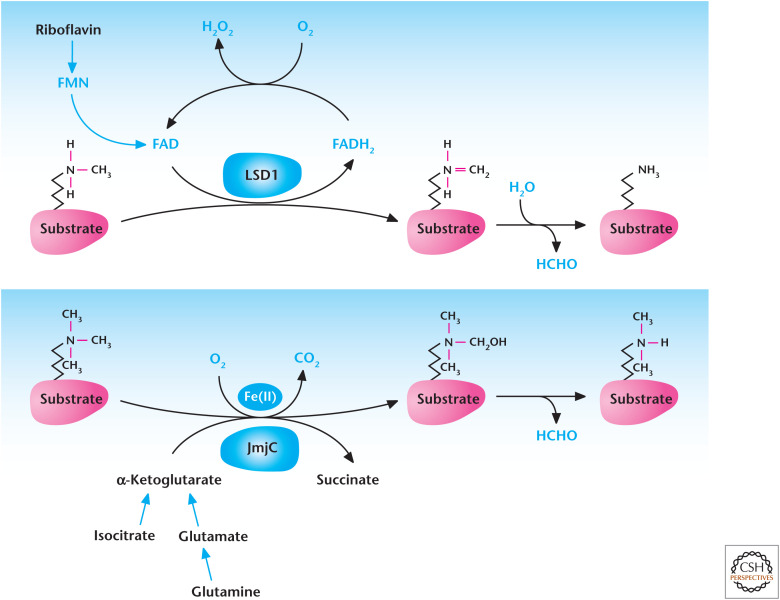
Metabolites also control demethylases. Lysine-specific demethylase 1 (LSD1) is dependent on FAD reduction to FADH2 (Fig. 14). FAD is produced in the mitochondria, and changes in FAD availability to LSD1 might regulate its activity. The family of demethylases that contain the Jumonji C (JmjC) domain are members of the α-ketoglutarate and Fe2+-dependent dioxygenase family. Similar to PHDs discussed above, these proteins consume oxygen, convert α-ketoglutrate to succinate, and require ascorbate to regenerate the Fe2+ cofactor as part of their enzymatic activity. It is conceivable that changes in any of these metabolites would affect JmjC demethylase activity. Going forward, it will be important to determine whether any metabolites are rate limiting for methylation or demethylation reactions under physiological or pathophysiological conditions. The exception is oxygen, which decreases under physiological conditions, such as ascending to altitude, or under pathophysiological conditions, such as ischemic diseases or lung diseases like chronic obstructive pulmonary disease. Indeed, there is burgeoning evidence that decreases in oxygen levels influence the epigenetic state of cells and organisms by regulating oxygen-dependent demethylases.
Figure 14.
Metabolism regulates demethylation. Lysine-specific demethylases (LSD) couple oxidation of methyl groups in histones to reduction of FAD to FADH2, which spontaneously causes demethylation of histone and produces formaldehyde (HCHO). JmjC demethylases use α-ketoglutarate, Fe(II), and oxygen to hydroxylate methylated histones resulting in their demethylation.
This review started with a discussion of the importance of growth factors in nutrient uptake through activation of signaling pathways. A consequence of nutrient uptake, in particular, glucose and glutamine, is that glucose and glutamine allow glycosylation of growth factors, which is critical for the proper folding of the growth factor receptors and their localization to the cell surface. Glycosylation is dependent on the glucose metabolism through the hexosamine biosynthetic pathway, a subsidiary pathway of glycolysis, to generate UDP-N-acetylglucosamine (UDP-GlcNAc) (see Fig. 10 of Chandel 2020d). Glutamine serves as the nitrogen donor in the production of UDP-GlcNAc. Thus, glycosylation of growth factor receptors is an example of feedback of metabolism on growth factor signaling.
It is evident that the large signal transduction and metabolic pathway diagrams that many of us have plastered on our laboratory walls are interconnected. It is essential to appreciate the integration of signal transduction and metabolism because many of the current escalations in pathologies are induced by changes in our diet and habits (e.g., lack of exercise). Metabolism and signal transduction pathways are poised to detect changes in diet and habits, which ultimately modulate transcriptional networks to alter the organismal phenotype. The understanding of cross talk between metabolism and signal transduction will provide possible targets of therapies. An example is the current effort to make drugs that inhibit PHDs to activate HIFs to stimulate erythropoiesis in patients suffering from anemia. Currently, we are at the inception of integrating metabolism and signal transduction.
Footnotes
From the recent volume Navigating Metabolism by Navdeep S. Chandel
Additional Perspectives on Metabolism available at www.cshperspectives.org
SUGGESTED READING
*Reference is also in this collection.
- Balligand JL, Feron O, Dessy C. 2009. eNOS activation by physical forces: from short-term regulation of contraction to chronic remodeling of cardiovascular tissues. Physiol Rev 89: 481–534. 10.1152/physrev.00042.2007 [DOI] [PubMed] [Google Scholar]
- Cai L, Tu BP. 2012. Driving the cell cycle through metabolism. Annu Rev Cell Dev Biol 28: 59–87. 10.1146/annurev-cellbio-092910-154010 [DOI] [PubMed] [Google Scholar]
- *.Chandel NS. 2020a. Basics of metabolic reactions. Cold Spring Harb Perspect Biol 10.1101/cshperspect.a040527. [DOI] [PMC free article] [PubMed] [Google Scholar]
- *.Chandel NS. 2020b. Glycolysis. Cold Spring Harb Perspect Biol 10.1101/cshperspect.a040535 [DOI] [PMC free article] [PubMed] [Google Scholar]
- *.Chandel NS. 2020c. Mitochondria. Cold Spring Harb Perspect Biol 10.1101/cshperspect.a040543 [DOI] [PMC free article] [PubMed] [Google Scholar]
- *.Chandel NS. 2020d. Carbohydrate metabolism. Cold Spring Harb Perspect Biol 10.1101/cshperspect.a040568 [DOI] [PMC free article] [PubMed] [Google Scholar]
- *.Chandel NS. 2020e. Lipid metabolism. Cold Spring Harb Perspect Biol 10.1101/cshperspect.a040576 [DOI] [PMC free article] [PubMed] [Google Scholar]
- Choi AM, Ryter SW, Levine B. 2013. Autophagy in human health and disease. N Engl J Med 368: 651–662. 10.1056/NEJMra1205406 [DOI] [PubMed] [Google Scholar]
- Gowans GJ, Hardie DG. 2014. AMPK: a cellular energy sensor primarily regulated by AMP. Biochem Soc Trans 42: 71–75. 10.1042/BST20130244 [DOI] [PMC free article] [PubMed] [Google Scholar]
- Hardie DG, Alessi DR. 2013. LKB1 and AMPK and the cancer-metabolism link—ten years after. BMC Biol 11: 36 10.1186/1741-7007-11-36 [DOI] [PMC free article] [PubMed] [Google Scholar]
- Havula E, Hietakangas V. 2012. Glucose sensing by ChREBP/MondoA–Mlx transcription factors. Semin Cell Dev Biol 23: 640–647. 10.1016/j.semcdb.2012.02.007 [DOI] [PubMed] [Google Scholar]
- Imai SI, Guarente L. 2014. NAD+ and sirtuins in aging and disease. Trends Cell Biol pii: S0962–8924(14)000634 10.1016/j.tcb.2014.04.002 [DOI] [PMC free article] [PubMed] [Google Scholar]
- Kaelin WG, Knight SL. 2013. Influence of metabolism on epigenetics and disease. Cell 153: 56–69. 10.1016/j.cell.2013.03.004 [DOI] [PMC free article] [PubMed] [Google Scholar]
- Kaelin WG, Ratcliffe PJ. 2008. Oxygen sensing by metazoans: the central role of the HIF hydroxylase pathway. Mol Cell 30: 393–402. 10.1016/j.molcel.2008.04.009 [DOI] [PubMed] [Google Scholar]
- Laplante M, Sabatini DM. 2012. mTOR signaling in growth control and disease. Cell 149: 274–293. 10.1016/j.cell.2012.03.017 [DOI] [PMC free article] [PubMed] [Google Scholar]
- Manning BD, Cantley LC. 2007. AKT/PKB signaling: navigating downstream. Cell 129: 1261–1274. 10.1016/j.cell.2007.06.009 [DOI] [PMC free article] [PubMed] [Google Scholar]
- Metallo CM, Vander Heiden MG. 2010. Metabolism strikes back: metabolic flux regulates cell signaling. Genes Dev 24: 2717–2722. 10.1101/gad.2010510 [DOI] [PMC free article] [PubMed] [Google Scholar]
- Mihaylova MM, Shaw RJ. 2011. The AMPK signalling pathway coordinates cell growth, autophagy and metabolism. Nat Cell Biol 13: 1016–1023. 10.1038/ncb2329 [DOI] [PMC free article] [PubMed] [Google Scholar]
- Sehgal SN. 2003. Sirolimus: its discovery, biological properties, and mechanism of action. Transplant Proc 35: Suppl 3: 7S–14S. 10.1016/s0041-1345(03)00211-2 [DOI] [PubMed] [Google Scholar]
- Semenza GL. 2012. Hypoxia-inducible factors in physiology and medicine. Cell 148: 399–408. 10.1016/j.cell.2012.01.021 [DOI] [PMC free article] [PubMed] [Google Scholar]
- Thompson CB. 2011. Rethinking the regulation of cellular metabolism. Cold Spring Harb Symp Quant Biol 76: 23–29. 10.1101/sqb.2012.76.010496 [DOI] [PubMed] [Google Scholar]
- Ward PS, Thompson CB. 2012. Signaling in control of cell growth and metabolism. Cold Spring Harb Perspect Biol 4: a006783 10.1101/cshperspect.a006783 [DOI] [PMC free article] [PubMed] [Google Scholar]
- Wellen KE, Thompson CB. 2012. A two-way street: reciprocal regulation of metabolism and signalling. Nat Rev Mol Cell Biol 13: 270–276. 10.1038/nrm3305 [DOI] [PubMed] [Google Scholar]
- Xiong Y, Guan KL. 2012. Mechanistic insights into the regulation of metabolic enzymes by acetylation. J Cell Biol 198: 155–164. 10.1083/jcb.201202056 [DOI] [PMC free article] [PubMed] [Google Scholar]


