

Abstract
Background:
Patient access to their medical records, through patient portals, facilitates information exchange and provision of quality healthcare. Understanding factors that characterize patients with limited access to and use of patient portals is needed.
Methods:
Data were from the 2017-18 Health Information National Trends Survey 5, cycles 1 and 2, a nationally representative survey of US adults ≥18 years old (N=6,789). Weighted multivariate logistic regressions modeled the associations between patient characteristics and access to, facilitators of use, and use of patient portals and their functions.
Results:
Individuals without (vs. with) a regular doctor (AOR 0.4, CI 0.3-0.5) or health insurance (AOR 0.4, CI 0.2-0.7), those with high school (AOR 0.4, CI 0.3-0.5) or with vocational/some college (AOR 0.5, CI 04.-0.7) education (vs. college/ postgraduate), or those with limited English proficiency (vs. those who speak English very well) (AOR 0.7, CI 0.5-0.9) were less likely to report accessing their personal medical records. Women (vs. men) were more likely to report accessing their medical records (AOR 1.5, CI 1.2-1.8). Similar patterns were found for patient portals access and facilitators of use. Less consistent associations emerged between patient characteristics and use of patient portal functionalities.
Conclusions:
Patient portals access and use are low. Having a primary care clinician, patient’s educational attainment, and being a woman were factors associated with patient portal access and use, but not race/ethnicity. Once access was achieved, use of patient portal functionalities was generally uniform across demographic segments. Facilitating patient portal access and use among all patient populations is warranted.
Keywords: electronic health records, health disparities, ehealth, health information technology, patient portals
Introduction
Patient engagement is a top priority for US healthcare systems.1 The adoption of electronic health records (EHRs) is a system-level strategy to involve patients in their healthcare and increase their ability to make informed decisions.2,3 EHRs have tethered patient portals (PPs) where healthcare providers provide patients around-the-clock access to their health information (cf: personal health records that are patient owned/controlled).4 When activated, PPs facilitate the exchange of protected health information electronically between patients and clinicians and allow patients to message their doctor, schedule appointments, and refill medications.5 Although use of PPs has been linked to better medication adherence and higher patient satisfaction,6,7 less is known about patients’ use and access of PPs, a key determinant of EHRs wide adoption and impact.2,8
Through the 2009 Health Information Technology for Economic and Clinical Health (HITECH) Act, federal policies incentivized the adoption and meaningful use of EHRs to leverage health information technology to improve healthcare.1,9–11 This shift toward a digital ecosystem reflects an emphasis on person-centered care and an overhaul of healthcare systems to increase efficiency, achieve health equity, and reduce cost.12 Indeed, on a systems level, EHRs are associated with improved healthcare quality and efficiency.13 These federal policies resulted in an increase in adoption of basic EHRs from 9.4% to 83.8% and of comprehensive EHRs 1.6% to 40% between 2008 and 2015 in non-federal acute care hospitals.14
The Promoting Interoperability Program incentivized healthcare providers to demonstrate meaningful use of EHRs through progressive demonstration of core objectives. Specifically, eligible professionals and hospitals must give patients the ability to “view online, download, and transmit their health information and hospital admission information” to meet meaningful use objectives for adoption and use of EHRs.15,16 However, literature has largely focused on the architecture of EHRs, facilitators of and barriers to adoption by hospitals and clinicians, and privacy and security concerns.8 Patient studies have focused on perceptions of the utility and adoption of PPs,17 PPs access and use in specific settings,18,19 and/or among specific patient populations.19–23
The dearth of national studies on disparities in patient access and use of PPs exclude patients, an important stakeholder in PPs adoption and impact.24 Furthermore, inequitable access to and use of PPs raises concerns for their potential to exacerbate health disparities.2 For example, Lin et al. showed that of 95% of patients who had access to their electronic information, only 10% had actually used their information where low rates of access and use of electronic medical information were observed among patients in hospitals located in counties with high proportions of residents eligible for both Medicare and Medicaid, with high proportions of Hispanics, or with low computer ownership and internet access.25 Among insured individuals who had visited their clinicians in the past year, racial and ethnic groups and individuals on Medicaid were less likely to be offered PPs access.23 Indeed, studies identified significant barriers to PPs access and use such as limited internet access, limited technical skills, potential security breaches and, for limited health literacy individuals, challenges with reading and writing.24,26,27 Because many of these barriers are more prevalent among racial and ethnic minority groups and persons of less privileged socioeconomic status,28 identifying factors associated with PPs access and use is important. In a national sample of US adults, we examined the extent to which patient characteristics, particularly race/ethnicity and socioeconomic status, were associated with (a) levels of access to and use of patient portals and factors facilitating such use, and (b) use of patient portals functionalities.
Methods
Data were from the 2017-18 Health Information National Trends Survey 5, cycles 1 and 2 [H5C1, H5C2]. H5C1 and H5C2 were nationally representative, self-administered, mail surveys of US adults ≥18 years that evaluated public perceptions and use of PPs. Participants (N= 6,789) were sampled from a random selection of non-vacant residential addresses stratified by minority concentration (stage 1) and a selection of an adult within the household using Next Birthday Method (stage 2). High minority concentration areas had ≥34% Latinos or Blacks and constituted 63.8% and 69.4% of sample addresses in H5C1 and H5C2, respectively. All other addresses constituted low minority concentration areas and comprised 36.2% and 31.6%. Census tract level characteristics were based on the 2011-2015 American Community Survey (ACS) for H5C1 and 2012-2016 ACS for H5C2. The overall household response rate was 32.3% and 32.8% for H5C1 and H5C2.
Measures
Access to PPs was assessed with: “Do any of your doctors/healthcare providers maintain your medical records in a computerized system?” and “Have you ever been offered online access to your medical records by your healthcare provider?” [1=yes, 0= no/don’t know]. Facilitators of using PPs included: “Have your healthcare provider/doctors/nurses/office staff ever encouraged you to use an online medical record?” [1=yes, 0=no] and “How confident are you that safeguards are in place to protect your medical records?” [1=very confident, 0=somewhat confident/not confident]. Use of PPs was assessed with: “How many times did you access your online medical record in the last 12 months?” and “How many times did you access a family member’s online medical record through a secure website/ app?” [1=one or more times and 0=0 times].
Those who have accessed their PPs at least once in the past year (n=2,151) were asked questions about their knowledge and use of PPs functionalities. The stem question for PPs content knowledge was: “Do any of your online medical records include (1) laboratory test results, (2) current list of medications, (3) a list of health/medical problems, (4) an allergy list, (5) summaries of your office visits, (6) clinical notes, and (7) an immunization or vaccination history” [1=yes, 0=no/don’t know]. The stem question for PPs function use was: “In the past 12 months, have you used your online medical record to (1) make appointments with a healthcare provider, (2) request refill of medications, (3) fill out forms or paperwork related to your healthcare, (4) request correction of inaccurate information, (5) securely message healthcare provider and staff (e.g., email), (6) look up test results, (7) monitor your health, (8) download your health information to your computer or mobile device such as a cell phone or tablet, (9) add health information to share with your healthcare provider such as health concerns, symptoms, and side effects, and (10) help you made a decision about how to treat an illness or condition” [1=yes, 0=no].
Data on gender, age, race/ethnicity, income, education, employment, marital status, place of birth, English language proficiency, having health insurance and a regular provider, and general health were collected. Internet use, means to access the internet, and mobile device ownership were collected. Census region and rural-urban classification were provided.
Analyses
Weighted missing percentage for demographic characteristics was highest for income (9.7%) and race/ethnicity (8%). Missingness on all other variables, including outcome variables, was <4%. Little’s test showed that missingness on variables collected at both waves was not completely at random (Chi square= 16505.72, df= 14235, p<.001).29 Outcome variables between participants with observed and missing values differed on key demographic characteristics (data not shown). We imputed data using hot-deck method with a weighted donor selection method (n=20 donors).30 All bivariate comparisons and models were based on imputed data.
Using SAS 9.4,31 weighted multivariate logistic regression modeled the associations between patient characteristics and PPs access and use. We excluded variables with a correlation of 0.40 or higher to avoid over-adjusting for patient characteristics. These variables were income, employment, and place of birth, and cellphone ownership, which were correlated with education (r=0.44), age (r=0.50), language proficiency (r=0.43), and smartphone ownership (r=−0.64), respectively, at p<.0001 level. All analyses incorporated the final sample weight to calculate population estimates and 100 replicate weights to calculate standard error of estimates using jackknife replication method.
Results
Sample characteristics appear in Table 1.
Table 1.
Weighted sample characteristics of 6,789 participants in the 2017-2018 Health Information National Trends Survey 5, cycles 1 and 2, U.S.
| n | % weighted | LL | UL | |
|---|---|---|---|---|
| Gender | ||||
| Men | 2759 | 48.9 | 48.7 | 49.1 |
| Women | 4030 | 51.1 | 50.9 | 51.3 |
| Age (years) | ||||
| 18-39 | 1248 | 30.6 | 28.7 | 32.4 |
| 40-59 | 2391 | 42.3 | 40.5 | 44.1 |
| ≥60 | 3150 | 27.1 | 26.9 | 27.4 |
| Race/ethnicity | ||||
| Latino | 995 | 15.8 | 15.5 | 16.2 |
| White | 4297 | 65.2 | 64.7 | 65.7 |
| Black | 923 | 10.5 | 10.0 | 11.0 |
| Other* | 574 | 8.4 | 8.2 | 8.7 |
| Annual household income | ||||
| <$20,000 | 1254 | 17.3 | 15.9 | 18.8 |
| $20,000 to $49,999 | 1829 | 26.1 | 24.5 | 27.7 |
| $50,000 to $74,999 | 1237 | 18.5 | 17.0 | 20.0 |
| ≥$75,000 | 2470 | 38.1 | 36.2 | 39.9 |
| Education | ||||
| <High school | 504 | 8.8 | 7.6 | 10.0 |
| High school graduate | 1279 | 22.6 | 21.4 | 23.8 |
| Vocational school, some college | 2040 | 36.4 | 35.3 | 37.6 |
| College graduate, postgraduate | 2967 | 32.2 | 31.9 | 32.4 |
| Employment | ||||
| Employed | 3423 | 57.9 | 55.8 | 59.9 |
| Unemployed | 3366 | 42.1 | 40.1 | 44.2 |
| Marital status | ||||
| Single | 1169 | 30.2 | 30.0 | 30.5 |
| Married, living as married | 3595 | 53.9 | 53.1 | 54.7 |
| Separated, widowed | 2024 | 15.9 | 15.1 | 16.6 |
| Place of birth | ||||
| USA | 5826 | 85.5 | 84.4 | 86.5 |
| Foreign-born | 963 | 14.5 | 13.5 | 15.6 |
| Speak English | ||||
| Very well | 6042 | 88.3 | 87.2 | 89.3 |
| Well, not well, not at all | 747 | 11.7 | 10.7 | 12.8 |
| Regular provider | ||||
| Yes | 4848 | 65.4 | 63.6 | 67.3 |
| No | 1941 | 34.6 | 32.7 | 36.4 |
| Health insurance | ||||
| Yes | 6441 | 91.6 | 91.5 | 91.7 |
| No | 348 | 8.4 | 8.3 | 8.5 |
| General Health | ||||
| Excellent/good | 5638 | 84.1 | 82.6 | 85.6 |
| Fair/poor | 1151 | 15.9 | 14.4 | 17.4 |
| Census region | ||||
| Northeast census region | 1065 | 17.9 | 17.9 | 17.9 |
| Midwest census region | 1249 | 21.0 | 21.0 | 21.0 |
| South census region | 2893 | 37.6 | 37.6 | 37.6 |
| West census region | 1582 | 23.5 | 23.5 | 23.5 |
| Rural/ Urban designation | ||||
| Metro | 5863 | 86.1 | 84.8 | 87.3 |
| Urban | 834 | 12.4 | 11.2 | 13.7 |
| Rural | 92 | 1.5 | 1.0 | 2.0 |
N = 6789; Imputed subjects have 20 records, thus imputed n is 1/20th of a subject rounded to the nearest integer.
Asians, Pacific Islanders, and multiple races.
LL = Lower limit, UL = Upper limit
Associations between patient characteristics and PPs access and use
Roughly three quarters of participants (76.9%) reported their provider maintained electronic medical records but only 47.2% reported being offered access to them, 39.2% reported their provider encouraged their use, 27.2% were confident electronic medical records were safe, and 29.3% and 9.3% reported accessing their own or their families’ medical records in the past year.
Gender, education, marital status, and having a regular clinician were factors associated with access, facilitators of use, and use of PPs (Table 2). Age, language proficiency, and having health insurance were also associated with PPs access and use but not race and ethnicity. We highlight some findings and refer the reader to the tables for a complete overview of significant associations.
Table 2:
Multivariate logistic regression models of associations between patient characteristics and patient portals access and use in the Health Information National Trends Survey 5, cycles 1 and 2, U.S.
| Access | Facilitators of use | Use behavior | ||||
|---|---|---|---|---|---|---|
| Provider maintains medical records | Provider offers medical records access | Provider encourages medical record use± | Confident medical records safe | Access own medical record | Access family medical record± | |
| aOR (95% CI) | aOR (95% CI) | aOR (95% CI) | aOR (95% CI) | aOR (95% CI) | aOR (95% CI) | |
| Gender (ref: men) | ||||||
| Women | 1.7 (1.4-2.0) | 1.7 (1.5-2.0) | 1.6 (1.3-2.0) | 1.2 (0.9-1.4) | 1.5 (1.2-1.8) | 1.6 (1.0-2.3) |
| Age (ref: 18-39 years) | ||||||
| 40-59 years | 1.2 (0.9-1.6) | 0.9 (0.8-1.2) | 0.9 (0.7-1.3) | 0.9 (0.7-1.1) | 1.1 (0.9-1.4) | 0.9 (0.6-1.3) |
| ≥60 years | 1.4 (1.0-1.8) | 0.8 (0.7-1.0) | 0.8 (0.6-1.0) | 1.0 (0.8-1.3) | 0.8 (0.6-0.9) | 0.7 (0.4-1.2) |
| Race/ethnicity (ref: White) | ||||||
| Latino | 1.2 (0.9-1.5) | 0.9 (0.7-1.1) | 0.8 (0.6-1.2) | 1.3 (0.9-1.8) | 0.9 (0.7-1.2) | 1.1 (0.7-1.8) |
| Black | 1.2 (0.8-1.7) | 0.8 (0.7-1.0) | 1.0 (0.8-1.5) | 1.0 (0.8-1.4) | 0.9 (0.7-1.2) | 0.8 (0.4-1.6) |
| Other* | 0.9 (0.5-1.4) | 0.8 (0.6-1.0) | 0.8 (0.6-1.2) | 0.9 (0.7-1.3) | 1.2 (0.9-1.7) | 1.2 (0.7-2.1) |
| Education (ref: college/post grad) | ||||||
| <High school | 0.5 (0.3-0.8) | 0.4 (0.3-0.7) | 0.5 (0.2-1.0) | 1.4 (0.9-2.1) | 0.3 (0.2-0.5) | 0.7 (0.3-1.7) |
| High school grad | 0.6 (0.4-0.7) | 0.6 (0.4-0.7) | 0.4 (0.3-0.6) | 1.0 (0.8-1.4) | 0.4 (0.3-0.5) | 0.3 (0.1-0.5) |
| Vocational, some college | 0.6 (0.5-0.8) | 0.6 (0.5-0.8) | 0.6 (0.5-0.8) | 1.2 (0.9-1.5) | 0.5 (0.4-0.7) | 0.5 (0.4-0.8) |
| Marital status (ref: married, living as married) | ||||||
| Single | 0.6 (0.4-0.8) | 0.5 (0.4-0.6) | 0.4 (0.3-0.6) | 1.0 (0.8-1.3) | 0.6 (0.5-0.8) | 0.2 (0.1-0.6) |
| Separated, widowed | 0.7 (0.5-0.9) | 0.6 (0.5-0.7) | 0.6 (0.5-0.8) | 1.0 (0.9-1.3) | 0.6 (0.5-0.7) | 0.4 (0.2-0.8) |
| Speak English (ref: very well) | ||||||
| Well, not well, not at all | 0.7 (0.5-0.9) | 0.6 (0.4-0.8) | 0.8 (0.5-1.2) | 0.8 (0.6-1.1) | 0.7 (0.5-0.9) | 1.2 (0.7-2.2) |
| Health insurance (ref: yes) | ||||||
| No | 0.5 (0.3-0.9) | 0.5 (0.3-0.8) | 0.7 (0.3-1.5) | 0.9 (0.5-1.4) | 0.4 (0.2-0.7) | 0.8 (0.3-2.3) |
| Regular provider (ref: yes) | ||||||
| No | 0.3 (0.2-0.4) | 0.4 (0.4-0.5) | 0.5 (0.4-0.6) | 0.7 (0.6-0.9) | 0.4 (0.3-0.5) | 0.6 (0.4-0.9) |
| General health (ref: excellent/good) | ||||||
| Fair/poor | 0.9 (0.7-1.1) | 0.9 (0.8-1.2) | 1.0 (0.8-1.4) | 0.7 (0.5-0.9) | 0.9 (0.7-1.1) | 1.0 (0.6-1.6) |
| Census region (ref: Northeast) | ||||||
| Midwest | 0.8 (0.6-1.2) | 0.9 (0.7-1.3) | 1.0 (0.7-1.7) | 1.2 (0.9-1.6) | 1.2 (0.9-1.7) | 1.1 (0.6-2.1) |
| South | 0.7 (0.5-0.9) | 0.8 (0.6-1.0) | 0.9 (0.7-1.5) | 1.1 (0.9-1.4) | 1.0 (0.8-1.4) | 1.2 (0.7-2.1) |
| West | 0.8 (0.6-1.1) | 0.9 (0.6-1.1) | 1.1 (0.8-1.7) | 0.9 (0.7-1.2) | 1.3 (0.9-1.7) | 1.5 (0.9-2.6) |
| Rural/ Urban designation (ref: metro) | ||||||
| Urban | 1.0 (0.7-1.5) | 0.7 (0.5-0.9) | 0.6 (0.4-0.9) | 1.0 (0.8-1.4) | 0.6 (0.4-0.8) | 0.9 (0.5-1.9) |
| Rural | 0.7 (0.3-1.5) | 0.6 (0.3-1.2) | 0.6 (0.2-1.6) | 0.9 (0.4-2.1) | 0.7 (0.4-1.4) | 0.5 (0.01-30.3) |
N = 6789
Asians, Pacific Islanders, and multiple races.
Question was omitted in 2018 H5C2, so n = 3285 based on H5C1 only.
Cells represent adjusted odds ratio (aOR) and 95% confidence intervals (CI).
Bolded cells are statistically meaningful.
Participants in H5C2 were asked the number of times that they accessed their own medical records only if they responded “yes” to whether they have been offered online access to medical records. Participants then reported who offered them access (i.e., healthcare provider, health insurer, someone else). To harmonize the data, we coded participants who said “no/ don’t know” to “have you been offered online access to your medical records?” as “no” and those who selected “healthcare provider” to “who offered you online access to your medical records?” as “yes.”
Logistic regression analysis modeled the probability of 1 (e.g., provider maintained electronic medical records, provider offered access to electronic medical records).
Access.
Women (vs. men) were more likely to report providers offered them access to electronic records (48.4% vs. 36.5%, aOR 1.7). Compared to those with college education or higher (58.9%), persons with less than high school education (27.9%, aOR 0.4), high school graduates (37.8%, aOR 0.6), and persons with vocational/some college degree (40.4%, aOR 0.6) were less likely to report their providers offered them access to electronic records. Patients without (vs. with) a regular clinician (31.6% vs. 49.2%, aOR 0.3) or health insurance (17.7% vs. 45.0%, aOR 0.5) were less likely to report their providers offered them access to electronic records.
Facilitators of use.
Women (vs. men) were more likely to report providers encouraged use of electronic records (39.4% vs. 29.5%, aOR 1.6). Compared to those with college education or higher (49.1%), high school graduates (31.2%, aOR 0.4) and persons with vocational/some college degree (31.1%, aOR 0.6) were less likely to report their providers encouraged use of electronic records. Patients without (vs. with) a regular clinician were less likely to report their providers encouraged their use (20.0% vs. 43.2%, aOR 0.5). Individuals without (vs. with) a regular doctor (22.9% vs. 28.0%, aOR 0.7) or who reported fair or poor (vs. excellent/good) health (22.3% vs. 27.1%, aOR 0.7) had less confidence in the safety of electronic records.
Use.
Women (vs. men) were more likely to report past year access to their own electronic records (30.2% vs. 23.0%, aOR 1.5). Compared to those with college education or higher, high school graduates were less likely to report that they accessed their personal (44.2% vs. 17.8%, aOR 0.4) or family’s (15.5% vs. 3.8%, aOR 0.3) electronic records. Similarly, individuals with vocational/some college education were less likely to report that they access their personal (44.2% vs. 25.7%, aOR 0.5) or their family’s (15.5% vs. 7.8%, aOR 0.5) electronic records. Patients without (vs. with) a regular clinician were less likely to report that they accessed their personal (17.7% vs. 32.0%, aOR 0.4) or family (5.4% vs. 10.8%, aOR 0.6) electronic records. Individuals with limited English proficiency (20.9% vs. 27.8%, aOR 0.7) or those without health insurance (11.9% vs. 28.1%, aOR 0.4) were less likely to report having accessed their personal records in the past year compared to those who speak English very well and those with health insurance.
Although 82% (n= 5280, 95%CI 80.6-83.3) reported having internet access and any device ownership was at 98% (n= 6656, 95%CI: 97.5-98.4), notable differences still exist in internet access and mobile device ownership especially by age, race and ethnicity, education, and language proficiency (data not shown). Therefore, we added these factors to the models for accessing personal and family electronic records (Supplementary Table 1). We found that internet access and device ownership were independently associated with accessing personal electronic records in the past year. Individuals not having (vs. having) broadband (31.2% vs. 37.7%, aOR 0.7) or wifi (24.3% vs. 37.2%, aOR 0.7) access or not owning (vs. owning) a tablet (15.2% vs. 37.6%, aOR 0.6) or a smartphone (11.0% vs. 33.5%, aOR 0.5) were less likely to report accessing their personal records.
Associations between patient characteristics and use of PPs functionalities
Knowledge of PPs functions varied, with laboratory test results (91.5%) being the most known function and clinical notes (50.6%) being the least (Figure 1). Use of PPs functions varied, with viewing test results (84.3%) being the most used function and requesting corrections (7.1%) being the least. All other functions were reportedly used by 50% or less of participants.
Figure 1:
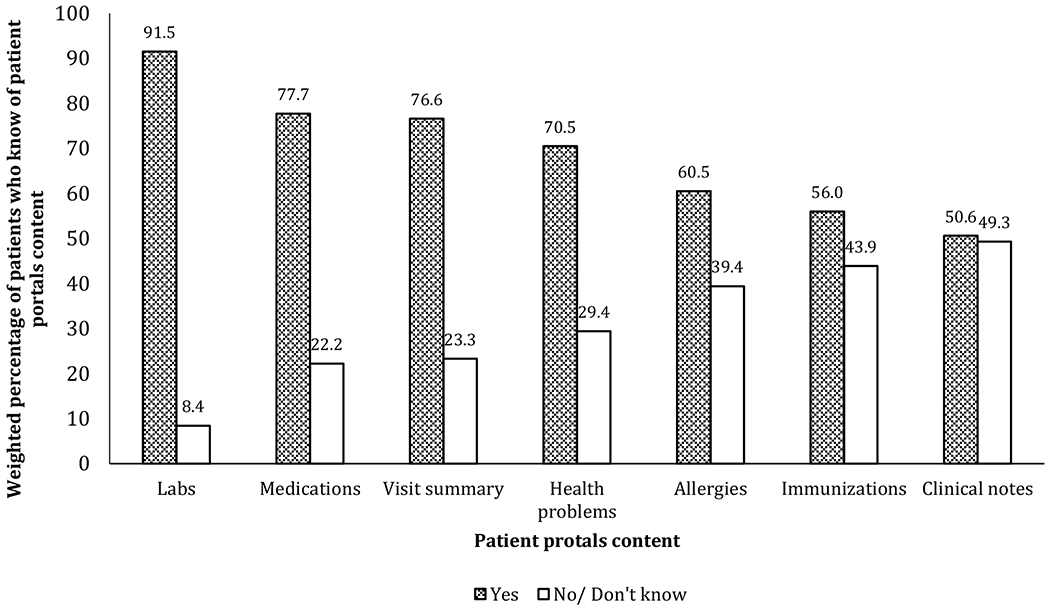
Knowledge of patient portals content among 6,789 participants in the 2017-2018 Health Information National Trends Survey 5, cycles 1 and 2, U.S.
N = 2,151 (those who accessed their own medical records one or more times in the past 12 months)
For labs and medications, results are based on H5C1 only (n = 1,033)
Few patient characteristics were associated with PPs functions use (Table 3). Individuals aged ≥60 years (vs. 18-39 years old) were more likely to use PPs to refill medications (41.2% vs. 40.3%, aOR 1.7) but less likely to message their healthcare provider (45.4% vs. 54.6%, aOR 0.7), make decisions (14.5% vs. 32.1%, aOR 0.5), or download health information (18.2% vs. 17.2%, aOR 0.6). Compared to college/postgraduates (42.7%), individuals with vocational/some college education (36.5%, aOR 0.7), high school graduates (39.1%, aOR 0.6), and those with less than high school education (23.3%, aOR 0.3) were less likely to report using PPs to complete forms. Persons with less than high school education (vs. college and postgraduates) were also less likely to use PPs to make decisions (17.0% vs. 24.6%, aOR 0.4) or download information (20.3% vs. 22.6%, aOR 0.3). Individuals who do not have (vs. have) a regular provider were less likely to report using PPs to message healthcare provider (39.6% vs. 49.5%, aOR 0.7). Reported use of PPs to refill medications was less likely among individuals with limited English proficiency (37.6% vs. 39.4%, aOR 0.5) but more likely among those with fair or poor health (53.0% vs. 37.2%, aOR 1.6) compared those who are language proficient and those with excellent/good health.
Table 3a:
Multivariate logistic regression models of associations between patient characteristics and use of patient portals functionalities in the 2017-2018 Health Information National Trends Survey 5, cycles 1 and 2, U.S.
| View results± | Message healthcare provider | Make appointment± | Refill medication | Complete forms | |
|---|---|---|---|---|---|
| aOR (95% CI) | aOR (95% CI) | aOR (95% CI) | aOR (95% CI) | aOR (95% CI) | |
| Gender (ref: men) | |||||
| Women | 1.1 (0.6-2.0) | 0.9 (0.7-1.2) | 0.8 (0.5-1.2) | 0.9 (0.7-1.2) | 1.0 (0.8-1.4) |
| Age (ref: 18-39 years) | |||||
| 40-59 years | 1.3 (0.7-2.3) | 0.8 (0.5-1.1) | 0.9 (0.5-1.5) | 1.1 (0.7-1.7) | 1.0 (0.7-1.6) |
| ≥60 years | 0.7 (0.4-1.4) | 0.7 (0.5-0.9) | 0.8 (0.4-1.3) | 1.7 (1.1-2.5) | 0.8 (0.5-1.0) |
| Race/ethnicity (ref: White) | |||||
| Latino | 0.5 (0.3-1.0) | 0.8 (0.5-1.2) | 1.0 (0.5-2.1) | 0.9 (0.7-1.4) | 0.9 (0.6-1.5) |
| Black | 0.8 (0.4-1.8) | 1.0 (0.7-1.6) | 1.6 (0.8-3.0) | 1.0 (0.7-1.7) | 0.7 (0.4-1.0) |
| Other* | 0.8 (0.3-1.9) | 0.7 (0.4-1.3) | 1.5 (0.8-2.5) | 1.2 (0.7-1.9) | 0.7 (0.4-1.0) |
| Education (ref: college/post grad) | |||||
| <High school | 1.7 (0.4-6.5) | 1.0 (0.3-2.9) | 0.2 (0.04-1.0) | 1.7 (0.6-5.0) | 0.3 (0.1-0.9) |
| High school grad | 0.9 (0.3-2.7) | 1.0 (0.7-1.5) | 1.1 (0.6-2.1) | 0.9 (0.7-1.4) | 0.6 (0.4-0.8) |
| Vocational, some college | 1.1 (0.6-2.1) | 1.0 (0.8-1.4) | 0.9 (0.6-1.4) | 1.0 (0.7-1.4) | 0.7 (0.5-0.9) |
| Marital status (ref: married) | |||||
| Single | 0.8 (0.4-1.7) | 1.3 (0.9-2.0) | 1.4 (0.8-2.5) | 1.3 (0.9-1.9) | 1.3 (0.9-1.9) |
| Separated, widowed | 0.9 (0.4-1.8) | 0.9 (0.6-1.3) | 0.9 (0.6-1.6) | 0.9 (0.7-1.3) | 0.9 (0.7-1.3) |
| Speak English (ref: very well) | |||||
| Well, not well, not at all | 0.8 (0.3-1.8) | 0.8 (0.4-1.3) | 1.4 (0.6-3.3) | 0.5 (0.3-0.9) | 0.7 (0.3-1.3) |
| Health insurance (ref: yes) | |||||
| No | 0.6 (0.1-5.7) | 0.9 (0.4-2.5) | 0.9 (0.2-4.5) | 0.6 (0.2-1.9) | 0.6 (0.1-2.2) |
| Regular provider (ref: yes) | |||||
| No | 0.8 (0.4-1.6) | 0.7 (0.5-0.9) | 1.0 (0.6-1.9) | 0.8 (0.5-1.2) | 0.8 (0.6-1.1) |
| General health (ref: excellent/good) | |||||
| Fair/poor | 1.1 (0.5-2.7) | 1.3 (0.8-1.9) | 1.1 (0.7-1.9) | 1.6 (1.1-2.3) | 1.4 (0.9-2.1) |
| Census region (ref: Northeast) | |||||
| Midwest | 0.7 (0.3-1.7) | 1.0 (0.7-1.6) | 0.9 (0.5-1.8) | 0.7 (0.5-1.1) | 1.2 (0.7-2.1) |
| South | 1.2 (0.6-2.3) | 1.0 (0.8-1.5) | 1.5 (0.8-2.9) | 0.9 (0.7-1.4) | 1.8 (1.2-2.7) |
| West | 2.8 (1.3-6.3) | 2.5 (1.7-3.9) | 3.5 (1.8-6.8) | 1.5 (0.9-2.2) | 1.6 (1.0-2.5) |
| Rural/ Urban designation (ref: metro) | |||||
| Urban | 1.0 (0.4-2.6) | 0.9 (0.6-1.7) | 1.3 (0.7-2.5) | 1.0 (0.7-1.6) | 0.7 (0.4-1.2) |
| Rural | 1.9 (0.1-54.8) | 0.8 (0.3-2.6) | 2.4 (0.5-12.4) | 1.8 (0.5-6.4) | 1.4 (0.4-4.6) |
West census region (vs. Northeast) residents were more likely to report using PPs to view test results (88.1% vs. 70.5%, aOR 2.8), message their provider (59.5% vs. 37.7%, aOR 2.5), make appointments (52.4% vs. 26.2%, aOR 3.5), and add information (30.5% vs. 14.1%, aOR 2.4).
Discussion
This analysis of a nationally representative US sample showed low levels of PPs access and use and identified disparities in access and use by patient’s educational level but not by race and ethnic minority status. Furthermore, respondents with a primary care clinician were more likely to report PPs access and use. Concerns about the security of electronic medical data was magnified among persons without a regular clinician and those who reported fair or poor health. Given the health benefits of having a regular primary care clinician32–35 and improved health outcomes of PPs use,6,7 identifying ways to address low levels of access to and use of PPs in general and disparities by socioeconomic factors and race/ethnicity in specific should be a priority of medical systems. Assuring that all patients, regardless of system or setting, have an identified “regular” clinician who coordinates comprehensive primary care is one step to address PPs access and use disparities and attenuate concerns about data security.
Rates of PPs use are low. Consistent with previous research,25 under a half reported that they were offered access to their electronic records, with only a third reported accessing their own medical data. This suggests that access does not necessarily translate to use. Policy initiatives could promote the accessibility and use of electronic medical data to patient populations especially in resource-constrained healthcare settings. One such initiative is raising the thresholds for demonstrating meaningful use under the Centers for Medicare and Medicaid Services’ Promoting Interoperability Program. Current levels are set to at least one unique patient,36 primarily to accommodate concerns from professionals and hospitals around patient-related factors that are beyond their control (e.g., internet access). Raising these thresholds could promote structural changes (e.g., improved portals usability) to improve patient access and use of electronic medical data above and beyond individual-level factors.25,37
Having a regular healthcare provider was the only factor consistently associated with PPs access, facilitators of use, and use. Having a regular doctor represents an environment conducive of PPs use where factors such as physician encouragement and endorsement incentivize patients’ adoption of PPs.24,38 Research should examine the mediating effect of provider encouragement on the relationship between PPs access and use and how this may affect the educational disparities and heightened privacy concerns observed. Lack of health insurance was also associated with decreased access to and use of PPs. This is consistent with previous literature that shows that having a regular provider and health insurance status independently affect access to healthcare.39,40
Our findings are consistent with previous studies on PPs access and use by educational attainment.20,21,41 Aggressive efforts must be directed to increase registration of underserved patients (e.g., onsite registration) beyond those suggested for the general population (e.g., promotional activities).26,42,43 Emphasis on PPs access must be coupled with efforts to make information understandable to all patients, particularly those less educated who have difficulties comprehending their records.6,44 Disparities still exist in internet access and mobile device ownership, which negatively impacted PPs use in our study.45 We argue that federal46 and private47 programs that provide cellphones and internet access to underserved communities should be advertised and supported, particularly because internet access and mobile device ownership might offset age and language proficiency-driven disparities in PPs access and use as observed in our study.
We did not identify differences in PPs access and use by race and ethnicity.20,21,41 It might be that the variance in PPs access and use was explained by more dominant sociodemographic characteristics (e.g., educational attainment) in our study. In a systematic review of facilitators of patient-portal use, racial and ethnic disparities were found in only 6 out of 16 studies.38 These findings imply that PPs use is not limited by race/ethnicity but driven by other modifiable factors such as educational attainment and having insurance and a primary care clinician . Studies should examine whether there was an improvement over time in providing access to minorities and the conditions under which minorities are likely to access and use PPs.
Findings on language proficiency underline the need for health literate systems where PPs should accommodate persons with limited literacy and potentially other languages for limited English proficient patients.48 Patients with limited English proficiency may be more likely to be seen in safety-net community clinics that have not fully activated their portals. The responsibility of using PPs fell predominantly on women. This gender difference is consistent with literature showing that women are the main health decision makers for their families.19,49 Less use of PPs reported by single and separated/widowed individuals is another manifestation of the effects of social relationships on health.50
Consistent with previous studies,18,19,41 viewing laboratory results, messaging healthcare providers, completing forms, making appointments, and refilling medications were the top used functions, which mapped onto the top known functions. Indeed, a study of Veterans Affairs’ MyHealtheVet showed that the main reason for nonuse was lack of awareness (61.3%).18 Efforts to increase awareness of PPs functionalities are a necessary precursor to use, particularly because certain function are linked to positive outcomes (e.g., refill medication, medication adherence).51,52 There are lessons to be learned from the high PPs function use in the West Census region. For example, California’s healthy PPs adoption rate may be attributable to state investments especially in rural areas.53
Lack of confidence in security of electronic records and the less frequent use of some PPs functions (e.g., monitor health) highlight the necessity of examining PPs utility to patients in enhancing communication with clinicians and promoting trust, managing chronic disease related decisions, and facilitating lifestyle behavioral change among patients with the highest needs.2 Research should gauge patients’ preferences for procedural factors in using PPs,54,55 their perceptions of PPs usability, and track their actual PPs use online by socioeconomic status, race/ethnicity, and health literacy.56,57
Limitations
Limitations include the absence of factors that were associated with patients’ access and use of PPs in the literature (e.g., health literacy).21 Some associations could be attributed to confounders: e.g., the association between having a regular provider and PPs access and use could be attributed to patients’ underlying chronic conditions.42 Beyond patient-level characteristics, organizational and contextual factors are key determinants in EHRs adoption (e.g., practice size and ownership structure,58,59 location,14 eligibility for HITECH financial incentives60,61), which dictate the PPs functionalities available to patients. For example, one study showed that private for-profit hospitals were more likely to adopt basic EHRs, which involve a limited set of functionalities implemented in a limited number of clinical units, whereas large hospitals with ≥400 beds were more likely to adopt comprehensive EHRs, which involve expanded functionalities implemented in most clinical units.37 Thus, place-based analyses and data linkages to contextualize patients’ PPs access and use are warranted.
Conclusion
Using a nationally representative sample of US patients, we identified disparities in PPs access and use, driven primarily by patients’ educational attainment and whether they have a regular doctor, but not by race and ethnicity. EHRs represent a natural migration to electronic platforms in healthcare, stimulated by federal policies and incentive programs. Despite the mantra that PPs facilitate access to and provision of quality care, actual use of PPs remains low and concerns about data security persist. A wide adoption of PPs rests on patient awareness; perceived utility, usability, and quality; and demand.24 Critical to this goal is closing the disparity gap in PPs access and use, especially among individuals of low socioeconomic status, particularly through policy initiatives. Current EHRs are far from being patient-centered, but until then, PPs should at least be accessible to all, especially those most in need.44,62
Supplementary Material
Table 3b:
Multivariate logistic regression models of associations between patient characteristics and use of patient portals functionalities in the 2017-2018 Health Information National Trends Survey 5, cycles 1 and 2, U.S., continued
| Monitor health± | Make decisions | Add information | Download information | Request correction | |
|---|---|---|---|---|---|
| aOR (95% CI) | aOR (95% CI) | aOR (95% CI) | aOR (95% CI) | aOR (95% CI) | |
| Gender (ref: men) | |||||
| Women | 0.7 (0.5-1.1) | 0.8 (0.6-1.2) | 1.0 (0.8-1.4) | 0.8 (0.5-1.1) | 1.4 (0.8-2.3) |
| Age (ref: 18-39 years) | |||||
| 40-59 years | 0.9 (0.6-1.7) | 0.7 (0.5-1.0) | 1.1 (0.8-1.7) | 0.8 (0.5-1.0) | 0.8 (0.4-1.6) |
| ≥60 years | 0.7 (0.4-1.2) | 0.5 (0.3-0.8) | 0.9 (0.6-1.4) | 0.6 (0.4-0.9) | 0.7 (0.3-1.7) |
| Race/ethnicity (ref: White) | |||||
| Latino | 0.9 (0.4-2.1) | 1.0 (0.6-1.8) | 1.0 (0.7-1.8) | 1.0 (0.7-1.7) | 1.2 (0.6-2.6) |
| Black | 1.6 (0.8-3.2) | 1.7 (1.0-2.9) | 1.0 (0.7-1.8) | 1.1 (0.7-1.9) | 1.6 (0.8-3.0) |
| Other* | 1.2 (0.6-2.4) | 1.0 (0.6-1.9) | 0.7 (0.4-1.4) | 0.9 (0.6-1.7) | 0.9 (0.4-2.1) |
| Education (ref: college/post grad) | |||||
| <High school | 0.7 (0.1-4.4) | 0.4 (0.2-0.9) | 0.5 (0.2-1.2) | 0.3 (0.1-0.8) | 1.2 (0.3-4.6) |
| High school grad | 0.9 (0.4-1.7) | 0.9 (0.5-1.5) | 0.9 (0.6-1.5) | 0.5 (0.2-1.0) | 0.6 (0.3-1.5) |
| Vocational, some college | 0.8 (0.5-1.2) | 0.8 (0.6-1.2) | 0.8 (0.6-1.2) | 0.9 (0.6-1.3) | 0.9 (0.6-1.6) |
| Marital status (ref: married) | |||||
| Single | 0.9 (0.5-1.8) | 0.9 (0.6-1.4) | 1.5 (0.9-2.2) | 0.9 (0.5-1.6) | 1.2 (0.6-2.4) |
| Separated, widowed | 0.7 (0.4-1.3) | 0.8 (0.5-1.2) | 0.9 (0.7-1.3) | 1.3 (0.8-1.9) | 1.6 (0.8-3.2) |
| Speak English (ref: very well) | |||||
| Well, not well, not at all | 1.2 (0.4-3.5) | 1.1 (0.6-2.2) | 0.9 (0.4-1.7) | 1.6 (0.8-3.2) | 2.2 (0.9-5.2) |
| Health insurance (ref: yes) | |||||
| No | 0.5 (0.05-4.3) | 1.1 (0.3-4.6) | 0.8 (0.2-4.0) | 0.7 (0.2-3.0) | 0.7 (0.02-22.2) |
| Regular provider (ref: yes) | |||||
| No | 0.6 (0.4-1.2) | 0.7 (0.5-1.1) | 0.7 (0.5-1.0) | 1.0 (0.7-1.5) | 0.9 (0.5-1.7) |
| General health (ref: excellent/good) | |||||
| Fair/poor | 0.9 (0.5-1.7) | 1.5 (0.8-2.7) | 1.3 (0.9-2.0) | 1.2 (0.7-2.1) | 1.7 (0.9-3.2) |
| Census region (ref: Northeast) | |||||
| Midwest | 1.9 (0.9-3.5) | 1.0 (0.6-1.9) | 1.6 (0.9-2.6) | 0.9 (0.5-1.9) | 1.3 (0.6-3.0) |
| South | 1.5 (0.9-2.6) | 0.9 (0.6-1.5) | 1.8 (1.0-3.1) | 1.3 (0.8-2.1) | 1.3 (0.7-2.7) |
| West | 1.8 (0.9-3.4) | 1.5 (0.9-2.5) | 2.4 (1.4-4.2) | 1.1 (0.7-1.9) | 1.9 (0.9-3.9) |
| Rural/ Urban designation (ref: metro) | |||||
| Urban | 1.6 (0.9-3.0) | 0.9 (0.5-1.7) | 1.1 (0.7-2.0) | 1.7 (0.9-2.8) | 1.1 (0.4-2.8) |
| Rural | 2.0 (0.3-10.9) | 1.2 (0.2-7.7) | 2.2 (0.6-8.7) | 3.9 (1.2-12.8) | 3.0 (0.1-70.1) |
N = 2,151 reflects those who accessed their own medical records one or more times in the past 12 months.
Non-Latino Asians, Pacific Islanders, and multiple races.
Question was omitted in 2018 H5C2, so n = 1033 (those who accessed their own medical records one or more times in the past 12 months based on H5C1 only).
Cells represent adjusted odds ratio (aOR) and 95% confidence intervals (CI).
Bolded cells are statistically meaningful.
Logistic regression analysis modeled the probability of 1 (e.g., patient viewed results, patient messaged healthcare provider).
Acknowledgments:
Funding: This research was supported in part by the Intramural Research Program of the NIH, the National Institute on Minority Health and Health Disparities and the National Heart, Lung, and Blood Institute. The effort of Drs. Sherine El-Toukhy and Eliseo J. Pérez-Stable and of Alejandra Méndez was supported by the Intramural Research Program, National Institute on Minority Health and Health Disparities and the Intramural Research Program, National Heart, Lung, and Blood Institute, National Institutes of Health. The effort of Shavonne Collins has been funded by the Medical Research Scholars Program, National Institutes of Health and contributions to the Foundation for the NIH from the Doris Duke Charitable Foundation (DDCF Grant # 2014194), Genentech, Elsevier, and other private donors.
Abbreviations
- aOR
Adjusted odds ratio
- CI
Confidence interval
- EHRs
Electronic health records
- HITECH
Health Information Technology for Economic and Clinical Health Act
- PPs
Patient portals
Footnotes
Human Subjects Statement: This project only involved the use of de-identified data, which is considered “not human subjects research.” “Not human subjects research” requires no IRB review or approval per NIH policy and 45 CFR 46.
Conflicts of Interest: None declared.
Data availability: The dataset analyzed during the current study is publicly available from Health Information National Trends Survey https://hints.cancer.gov/default.aspx
Notes: This study was initiated while Alejandra Méndez and Shavonne Collins were at the National Institutes of Health.
The published version of this manuscript is available for free access at: https://www.jabfm.org/content/33/6/953
REFERENCES
- 1.The Office of the National Coordinator for Health Information Technology. Federal health IT strategic plan: 2015-2020. https://dashboard.healthit.gov/strategic-plan/federal-health-it-strategic-plan-2015-2020.php. Accessed October 15, 2018.
- 2.Detmer D, Bloomrosen M, Raymond B, Tang P. Integrated personal health records: Transformative tools for consumer-centric care. BMC Medical Informatics and Decision Making. 2008;8(1):45. [DOI] [PMC free article] [PubMed] [Google Scholar]
- 3.Maurer M, Dardess P, Carman KL, Frazier K, Smeeding L. Guide to patient and family engagement: Environmental scan report. Rockville, MD: Prepared by American Institutes for Research under contract HHSA;2012. [Google Scholar]
- 4.Roehrs A, da Costa CA, da Rosa Righi R, de Oliveira KSF. Personal health records: A systematic literature review. Journal of medical Internet research. 2017;19(1):e13. [DOI] [PMC free article] [PubMed] [Google Scholar]
- 5.The Office of the National Coordinator for Health Information Technology. What is a patient portal? https://www.healthit.gov/faq/what-patient-portal. Accessed June 2, 2018.
- 6.Ross SE, Lin C-T. The effects of promoting patient access to medical records: A review. Journal of the American Medical Informatics Association. 2003;10(2):129–138. [DOI] [PMC free article] [PubMed] [Google Scholar]
- 7.Ammenwerth E, Schnell-Inderst P, Hoerbst A. The impact of electronic patient portals on patient care: A systematic review of controlled trials. Journal of Medical Internet Research. 2012;14(6):e162. [DOI] [PMC free article] [PubMed] [Google Scholar]
- 8.Kaelber DC, Jha AK, Johnston D, Middleton B, Bates DW. A research agenda for personal health records (PHRs). Journal of the American Medical Informatics Association. 2008;15(6):729–736. [DOI] [PMC free article] [PubMed] [Google Scholar]
- 9.111th Congress American Recovery and Reinvestment Act. In. Pub.L. 111–52009. [Google Scholar]
- 10.111th Congress Health Information Technology for Economic and Clinical Health. In. TITLE XIII2009. [Google Scholar]
- 11.104th Congress Health Insurace Portability and Accountability Act. In. Public Law; 104–1911996. [PubMed] [Google Scholar]
- 12.Committee on Quality of Health Care in America, Institute of Medicine Staff. Crossing the quality chasm: A new health system for the 21st century. National Academies Press; 2001. [PubMed] [Google Scholar]
- 13.Chaudhry B, Wang J, Wu S, et al. Systematic review: Impact of health information technology on quality, efficiency, and costs of medical care. Annals of Internal Medicine. 2006;144(10):742–752. [DOI] [PubMed] [Google Scholar]
- 14.Henry J, Pylypchuk Y, Searcy T, Patel V. Adoption of electronic health record systems among US non-federal acute care hospitals: 2008–2015. 2016. [Google Scholar]
- 15.Blumenthal D, Tavenner M. The “meaningful use” regulation for electronic health records. New England Journal of Medicine. 2010;363(6):501–504. [DOI] [PubMed] [Google Scholar]
- 16.Centers for Medicare and Medicaid Services. Medicare and Medicaid programs; Electronic health record incentive program - stage 2. Federal Register. https://www.federalregister.gov/documents/2012/09/04/2012-21050/medicare-and-medicaid-programs-electronic-health-record-incentive-program-stage-2. Published September/04/2012. Accessed June 2, 2018. [PubMed]
- 17.Westin A, Lemieux J, Subias S. Americans overwhelmingly believe electronic personal health records could improve their health. Markle Foundation;2008. [Google Scholar]
- 18.Turvey C, Klein D, Fix G, et al. Blue Button use by patients to access and share health record information using the Department of Veterans Affairs’ online patient portal. Journal of the American Medical Informatics Association. 2014;21(4):657–663. [DOI] [PMC free article] [PubMed] [Google Scholar]
- 19.Jones JB, Weiner JP, Shah NR, Stewart WF. The wired patient: Patterns of electronic patient portal use among patients with cardiac disease or diabetes. Journal of Medical Internet Research. 2015;17(2):e42. [DOI] [PMC free article] [PubMed] [Google Scholar]
- 20.Ancker JS, Barrón Y, Rockoff ML, et al. Use of an electronic patient portal among disadvantaged populations. Journal of General Internal Medicine. 2011;26(10):1117–1123. [DOI] [PMC free article] [PubMed] [Google Scholar]
- 21.Sarkar U, Karter AJ, Liu JY, et al. The literacy divide: Health literacy and the use of an internet-based patient portal in an integrated health system—results from the Diabetes Study of Northern California (DISTANCE). Journal of Health Communication. 2010;15(S2):183–196. [DOI] [PMC free article] [PubMed] [Google Scholar]
- 22.Smith SG, O’conor R, Aitken W, Curtis LM, Wolf MS, Goel MS. Disparities in registration and use of an online patient portal among older adults: Findings from the LitCog cohort. Journal of the American Medical Informatics Association. 2015;22(4):888–895. [DOI] [PMC free article] [PubMed] [Google Scholar]
- 23.Anthony DL, Campos-Castillo C, Lim PS. Who isn’t using patient portals and why? Evidence and implications from a national sample of US adults. Health Affairs. 2018;37(12):1948–1954. [DOI] [PubMed] [Google Scholar]
- 24.Irizarry T, Dabbs AD, Curran CR. Patient portals and patient engagement: A state of the science review. Journal of medical Internet research. 2015;17(6):e148. [DOI] [PMC free article] [PubMed] [Google Scholar]
- 25.Lin SC, Lyles CR, Sarkar U, Adler-Milstein J. Are Patients Electronically Accessing Their Medical Records? Evidence From National Hospital Data. Health Affairs. 2019;38(11):1850–1857. [DOI] [PubMed] [Google Scholar]
- 26.Tieu L, Sarkar U, Schillinger D, et al. Barriers and facilitators to online portal use among patients and caregivers in a safety net health care system: A qualitative study. Journal of Medical Internet Research. 2015;17(12):e275. [DOI] [PMC free article] [PubMed] [Google Scholar]
- 27.Mishuris RG, Stewart M, Fix GM, et al. Barriers to patient portal access among veterans receiving home-based primary care: A qualitative study. Health Expectations. 2015;18(6):2296–2305. [DOI] [PMC free article] [PubMed] [Google Scholar]
- 28.Pérez-Stable EJ, El-Toukhy S. Communicating with diverse patients: How patient and clinician factors affect disparities. Patient Education and Counseling. 2018;101(12):2186–2194. [DOI] [PMC free article] [PubMed] [Google Scholar]
- 29.Little RJ. A test of missing completely at random for multivariate data with missing values. Journal of the American statistical Association. 1988;83(404):1198–1202. [Google Scholar]
- 30.PK M Survey Data Imputation with PROC SURVEYIMPUTE. https://support.sas.com/resources/papers/proceedings16/SAS3520-2016.pdf. Published 2016. Accessed Oct. 19, 2018.
- 31.SAS 9.4 [computer program]. Cary, NC: SAS Institute Inc. [Google Scholar]
- 32.Ettner SL. The timing of preventive services for women and children: The effect of having a usual source of care. American Journal of Public Health. 1996;86(12):1748–1754. [DOI] [PMC free article] [PubMed] [Google Scholar]
- 33.Fung CS, Wong CK, Fong DY, Lee A, Lam CL. Having a family doctor was associated with lower utilization of hospital-based health services. BMC Health Services Research. 2015;15:42. [DOI] [PMC free article] [PubMed] [Google Scholar]
- 34.Lambrew JM, Defriese GH, Carey TS, Ricketts TC, Biddle AK. The effects of having a regular doctor on access to primary care. Medical care. 1996;34(2):138–151. [DOI] [PubMed] [Google Scholar]
- 35.Petersen LA, Burstin HR, O’neil AC, Orav EJ, Brennan TA. Nonurgent emergency department visits: The effect of having a regular doctor. Medical Care. 1998;36(8):1249–1255. [DOI] [PubMed] [Google Scholar]
- 36.Centers for Medicare and Medicaid Services. Promoting interoperability programs. https://www.cms.gov/Regulations-and-Guidance/Legislation/EHRIncentivePrograms/index. Accessed May 30, 2020.
- 37.Adler-Milstein J, Holmgren AJ, Kralovec P, Worzala C, Searcy T, Patel V. Electronic health record adoption in US hospitals: The emergence of a digital “advanced use” divide. Journal of the American Medical Informatics Association. 2017;24(6):1142–1148. [DOI] [PMC free article] [PubMed] [Google Scholar]
- 38.Powell KR. Patient-perceived facilitators of and barriers to electronic portal use: A systematic review. CIN: Computers, Informatics, Nursing. 2017;35(11):565–573. [DOI] [PubMed] [Google Scholar]
- 39.Sox CM, Swartz K, Burstin HR, Brennan TA. Insurance or a regular physician: Which is the most powerful predictor of health care? American Journal of Public Health. 1998;88(3):364–370. [DOI] [PMC free article] [PubMed] [Google Scholar]
- 40.Freeman JD, Kadiyala S, Bell JF, Martin DP. The causal effect of health insurance on utilization and outcomes in adults: A systematic review of US studies. Medical care. 2008;46(10):1023–1032. [DOI] [PubMed] [Google Scholar]
- 41.Sarkar U, Karter AJ, Liu JY, et al. Social disparities in internet patient portal use in diabetes: Evidence that the digital divide extends beyond access. Journal of the American Medical Informatics Association. 2011;18(3):318–321. [DOI] [PMC free article] [PubMed] [Google Scholar]
- 42.Yamin CK, Emani S, Williams DH, et al. The digital divide in adoption and use of a personal health record. Archives of Internal Medicine. 2011;171(6):568–574. [DOI] [PubMed] [Google Scholar]
- 43.North F, Hanna BK, Crane SJ, Smith SA, Tulledge-Scheitel SM, Stroebel RJ. Patient portal doldrums: Does an exam room promotional video during an office visit increase patient portal registrations and portal use? Journal of the American Medical Informatics Association. 2011;18(Suppl1):i24–i27. [DOI] [PMC free article] [PubMed] [Google Scholar]
- 44.Krist AH, Woolf SH. A vision for patient-centered health information systems. JAMA. 2011;305(3):300–301. [DOI] [PMC free article] [PubMed] [Google Scholar]
- 45.Mahmood A, Mosalpuria K, Wyant DK, Bhuyan SS. Association between having a regular health provider and access to services linked to electronic health records. Hospital Topics. 2019;97(1):1–10. [DOI] [PubMed] [Google Scholar]
- 46.Lifeline Program for Low-Income Consumers. https://www.fcc.gov/general/lifeline-program-low-income-consumers. Accessed Feb. 4, 2019.
- 47.Mobile for All. https://mobileforall.org/. Accessed Feb. 4, 2019. [Google Scholar]
- 48.Gibbons MC, Fleisher L, Slamon RE, Bass S, Kandadai V, Beck JR. Exploring the potential of Web 2.0 to address health disparities. Journal of Health Communication. 2011;16(Suppl1):77–89. [DOI] [PubMed] [Google Scholar]
- 49.Matoff-Stepp S, Applebaum B, Pooler J, Kavanagh E. Women as health care decision-makers: Implications for health care coverage in the United States. Journal of Health Care for the Poor and Underserved. 2014;25(4):1507–1513. [DOI] [PubMed] [Google Scholar]
- 50.Umberson D, Karas Montez J. Social relationships and health: A flashpoint for health policy. Journal of Health and Social Behavior. 2010;51(1_Suppl):S54–S66. [DOI] [PMC free article] [PubMed] [Google Scholar]
- 51.Sarkar U, Lyles CR, Parker MM, et al. Use of the refill function through an online patient portal is associated with improved adherence to statins in an integrated health system. Medical Care. 2014;52(3):194–201. [DOI] [PMC free article] [PubMed] [Google Scholar]
- 52.Lin C-T, Wittevrongel L, Moore L, Beaty BL, Ross SE. An Internet-based patient-provider communication system: Randomized controlled trial. Journal of Medical Internet Research. 2005;7(4):e47. [DOI] [PMC free article] [PubMed] [Google Scholar]
- 53.Kim KK, Rudin RS, Wilson MD. Health information technology adoption in California community health centers. The American Journal of Managed Care. 2015;21(12):e677–e683. [PMC free article] [PubMed] [Google Scholar]
- 54.Henshaw D, Okawa G, Ching K, Garrido T, Qian H, Tsai J. Access to radiology reports via an online patient portal: Experiences of referring physicians and patients. Journal of the American College of Radiology. 2015;12(6):582–586. e581. [DOI] [PubMed] [Google Scholar]
- 55.Johnson AJ, Easterling D, Nelson R, Chen MY, Frankel RM. Access to radiologic reports via a patient portal: Clinical simulations to investigate patient preferences. Journal of the American College of Radiology. 2012;9(4):256–263. [DOI] [PubMed] [Google Scholar]
- 56.Czaja SJ, Zarcadoolas C, Vaughon WL, Lee CC, Rockoff ML, Levy J. The usability of electronic personal health record systems for an underserved adult population. Human Factors. 2015;57(3):491–506. [DOI] [PMC free article] [PubMed] [Google Scholar]
- 57.Middleton B, Bloomrosen M, Dente MA, et al. Enhancing patient safety and quality of care by improving the usability of electronic health record systems: Recommendations from AMIA. Journal of the American Medical Informatics Association. 2013;20(e1):e2–e8. [DOI] [PMC free article] [PubMed] [Google Scholar]
- 58.Furukawa MF, King J, Patel V, Hsiao C-J, Adler-Milstein J, Jha AK. Despite substantial progress in EHR adoption, health information exchange and patient engagement remain low in office settings. Health Affairs. 2014;33(9):1672–1679. [DOI] [PubMed] [Google Scholar]
- 59.Rao SR, DesRoches CM, Donelan K, Campbell EG, Miralles PD, Jha AK. Electronic health records in small physician practices: Availability, use, and perceived benefits. Journal of the American Medical Informatics Association. 2011;18(3):271–275. [DOI] [PMC free article] [PubMed] [Google Scholar]
- 60.Adler-Milstein J, Jha AK. HITECH Act drove large gains in hospital electronic health record adoption. Health Affairs. 2017;36(8):1416–1422. [DOI] [PubMed] [Google Scholar]
- 61.Centers for Medicare and Medicaid Services. Medicare and Medicaid Promoting Interoperability Program Basics. https://www.cms.gov/Regulations-and-Guidance/Legislation/EHRIncentivePrograms/Basics.html. Accessed Jan. 13, 2019.
- 62.Fiscella K, Shin P. The inverse care law: Implications for healthcare of vulnerable populations. The Journal of Ambulatory Care Management. 2005;28(4):304–312. [DOI] [PubMed] [Google Scholar]
Associated Data
This section collects any data citations, data availability statements, or supplementary materials included in this article.