

ABSTRACT
This study explored the role of MEG3 in the cartilage differentiation of bone marrow mesenchymal stem cells (BMSCs). We investigated the effects of over-expression and knockdown of MEG3 on cell viability, cell differentiation, and the expressions of MEG3, miR-129-5p, COL2, chondrocyte differentiation-related genes (sry-type high-mobility-group box 9 (SOX9), SOX5, Aggrecan, silent information regulator 1 (SIRT1), and Cartilage oligomeric matrix protein (COMP)). The targeting relationship between MEG3 and miR-129-5p and the target gene of miR-129-5p was confirmed through Starbase, TargetScan and luciferase experiments. Finally, a series of rescue experiments were conducted to study the regulatory effects of MEG3 and miR-129-5p. BMSCs were identified as CD29+ and CD44+ positive, and their differentiation was time-dependent. As BMSCs differentiated, MEG3 expression was up-regulated, but miR-129-5p was down-regulated. Over-expressed MEG3 promoted the viability and differentiation of BMSCs, up-regulated the expressions of COL2 and chondrocyte differentiation-related genes, and inhibited miR-129-5p. Runt-related transcription factor 1 (RUNX1) was negatively regulated as a target gene of miR-129-5p. Results of rescue experiments showed that the inhibitory effect of miR-129-5p mimic on BMSCs could be partially reversed by MEG3. Over-expression of MEG3 regulated the miR-129-5p/RUNX1 axis to promote the differentiation of BMSCs into chondrocytes. This study provides a reliable basis for the application of lncRNA in articular cartilage injury.
KEYWORDS: Articular cartilage repair, bone marrow mesenchymal stem cells, lncRNA-MEG3, miR-129-5p, runt-related transcription factor
Introduction
Articular cartilage is a kind of cartilage tissue composed of chondrocytes and matrix covering joint surface. It plays an important role in buffering stress, absorbing shocks, lubricating joint surface, and reducing wear [1]. However, articular cartilage tissue lacks blood supply, and once damaged, it is difficult to heal. Violent squeezing or tearing, long-term high-load exercise, and joint degeneration may cause cartilage defects [2]. With the multidisciplinary development of biology in recent years, great progress has been made in repairing articular cartilage defects by treatment methods including mechanics and materials science, closed treatment, surgical treatment, transplantation [3,4]. However, the development of the treatment has been severely limited due to insufficient supply of autologous chondrocytes, damage at donor site, and immunogenicity, and so far, an effective treatment for patients has not been achieved yet [5,6].
Bone marrow mesenchymal stem cells (BMSCs) have the self-proliferation ability and the potential of multi-directional differentiation [7]. They are easy to obtain from sufficient sources. They can be differentiated into chondrocytes under specific conditions, and can be fused with the subchondral bone plate better after transplantation [8]. Ground fusion is an ideal seed cell for tissue engineering cartilage [9,10]. Chondrocytes in vivo are differentiated from mesenchymal stem cells, while in vitro differentiation further needs the induction of factors. Common growth factors that can induce BMSCs to differentiate into chondrocyte cell lines are BMPs, IGF1, FGFs, and TGF-β [11–13]. However, with limited inducing effects, they cannot effectively synthesize cartilage matrix and maintain chondrocyte phenotype. At the same time, there is increasing evidence that non-coding RNAs are involved in regulating the chondrocyte differentiation of BMSCs [14,15].
Long noncoding RNA (lncRNA, length > 200 nucleotides) is a type of noncoding RNA that has strong tissue (cell) expression specificity and regulates the growth and development of various cells such as single-cell eukaryotes, embryonic stem cells, and adult stem cells [16]. Studies have shown that abnormal expression or function of lncRNA is closely related to cartilage development and articular cartilage diseases [17]. LncRNA ROCR promotes human cartilage formation by up-regulating the expression of SOX9 [18]; DANCR has been shown to promote the proliferation and differentiation of chondrocytes in patients with osteoarthritis by regulating miR-577 and its downstream targeting gene SphK2 [19]; LncRNA PVT1 regulates chondrocyte apoptosis in osteoarthritis by acting as a sponge for miR-488-3p [19]. MicroRNAs (miRNAs), which are also non-coding RNAs, have also been found to play an important regulatory role in chondrocyte regeneration and the pathogenesis of osteoarthritis. LncRNA, mainly as a competitive factor of miRNA, plays a significant regulatory role in chondrocyte proliferation and apoptosis through multiple signaling pathways [20]. Thus, we focused on the functional interactions between lncRNA and miRNA in BMSCs.
Maternally Expressed Gene 3 (MEG3) is located at human chromosome 14q32.3 and encodes an lncRNA with a length of about 1.6 kb [21]. Much literature has reported that lncRNA MEG3 is a typical tumor suppressor gene, which can inhibit the proliferation ability of cancer cells, and may play a role through the tumor suppressor p53 [22–24]. In addition, MEG3 is found to be involved in angiogenesis and myocardial fibrosis [25,26]. Studies have shown that MEG3 may be vital in bone and joint diseases. As a competitive endogenous RNA (ceRNA) of miR-93, MEG3 relieves the inhibitory expression of TGFβ-R2 in chondrocytes and then activates the TGF-β signal pathway, and regulates IL-1β-induced degradation of chondrocyte ECM in chondrocytes [27]. It also regulates cartilage differentiation by inhibiting methyltransferase EZH2-regulated H3K27me3 and down-regulating TRIB2 expression [28]. It was suggested that MEG3 promoted osteogenic differentiation of MSCs in patients with multiple myeloma [29]; One recent study also reported similar osteogenic effects of MEG3 on human adipose stem cells (hASCs) by regulating the balance between adipogenesis and osteogenic differentiation of hASCs [30]; However, another study revealed that MEG3 inhibited osteogenic differentiation of BMSCs by regulating miR-133a-3p [31]. In this study, we searched the Starbase database and found that miR-129-5p has a targeting relationship with MEG3, yet the role of MEG3 in cartilage differentiation of BMSCs has not been reported. Therefore, we explored the effect and mechanism of MEG3 on chondrocyte differentiation under the induction of BMSCs.
Materials and methods
Experimental rat feeding
Ten 6-week-old male SPF Sprague-Dawley (SD) rats (200 ± 10 g) were purchased from Beijing Charles River Co., Ltd. All experimental animals were kept in Shanghai Changzheng Hospital SPF-level experimental animal centers (temperature 22 ± 1 °C, humidity 55 ± 5%). The experimental rats had free access to water and food. All animal experiments have been approved by the Shanghai Changzheng Hospital Animal Ethics Committee (approval number: 201809018GK).
Extraction of BMSCs
After acclimatization for three days, the SD rats were injected with normal saline containing 1% sodium pentobarbital (P3761-25 G, Sigma, USA) at a dose of 50 mg/kg. After limb muscle reaction disappeared, the rats were fixed on the operating table in the supine position. The lower limbs of the rats were thoroughly disinfected with iodophor after the hair of the limbs were removed as much as possible. Then the bilateral femurs of the rats were removed surgically. Next, the dried red bone marrow was collected with a syringe and quickly transferred to a clean bench under aseptic conditions. After that, the bone marrow was added with IMDM medium (IMP05, CAISSON, USA) containing 20 μ/ml heparin (H104201, Aladdin, China), and then fully resuspended and placed in a centrifuge tube. After centrifugation at 1000 xg for 10 minutes, differentiated BMSCs (CM group) were added to the cartilage differentiation medium (CM, 7551, ScienCell, USA) and pipetted, while undifferentiated (Undiff) BMSCs were treated with DMEM (C11995500BT, Gibco, USA). The concentration of the obtained cell suspension was adjusted to 8 × 10⁵/ml. The cells were inoculated in a culture flask and cultured in a 5% CO2, 37°C incubator. The medium was renewed every two days. One hundred μl of the cells were fixed with 4% paraformaldehyde for 30 minutes on day 0, 14 and 21 of culture, and cell morphology was observed using a CKX53 OLYMPUS inverted microscope (Japan).
Identification of BMSCs by fluorescence activating cell sorter (FACS)
Second generation BMSCs were first digested with 0.25% trypsin-EDTA (25200–072, Gibco, USA) to make a single cell suspension. After being washed and centrifuged, the cells were added with PBS and adjusted to a concentration of 1 × 10⁶/ml. Then, 100 μl of cells were transferred to three EP tubes. Next, FITC-labeled CD29 (Catalog No. 561796, BD Biosciences, USA), CD44 (Catalog No. 550974, BD Biosciences, USA), and CD34 (PA5-85917, Invitrogen, USA) antibodies were added to label the cells. After incubation for 1.5 hours at room temperature in the dark, the cells were transferred to a FACSCalibur cytometer (Catalog No. 342975, BD Biosciences, USA) and analyzed using CellQuest software (BD Biosciences, USA).
Assessment of cell differentiation by Alcian blue staining
Alcian Blue staining is mostly used for cartilage or chondrocyte-like staining because it can bind to proteoglycans in chondrocytes. Usually, the nucleus is stained blue, and light blue secretory granules are distributed in the cytoplasm. We evaluated the degree of cell differentiation on day 0, 14, and 21 by Alcian blue staining. In brief, the cells were washed with PBS, and then fixed with 4% paraformaldehyde at room temperature for 30 minutes. After rinsing the cells with PBS, 0.1% concentrated hydrochloric acid (M055795, MREDA, China) was added to the cells for 5 minutes (room temperature). Then the cells were added with 1% Alcian blue stain (CA1431, Coolaber, China) and incubated at room temperature overnight. The next day, the cells were rinsed 3 times (5 minutes/time) with 0.1% concentrated hydrochloric acid. Finally, the degree of chondrocyte differentiation was observed and recorded using a microscope.
Total RNA extraction and quantitative real time-polymerase chain reaction (qRT-PCR)
After the BMSCs to be detected were washed with PBS, total RNA was extracted from the cells with 1 ml of Trizol reagent (15596–018, Invitrogen, USA) and centrifuged thoroughly. Afterward, the supernatant was transferred to an EP tube without RNase. Then, total RNA extraction was continued by adding chloroform, isopropanol, and ethanol into the cells. The RNA precipitate was finally dissolved in DEPC water, and its concentration was measured using a UV spectrophotometer (YQ1633128263, Thermo, USA). Next, the total RNA was reverse transcribed into cDNA that could be used for qRT-PCR. Reverse transcription was performed using a k1622 Revert Aid First Strand cDNA Synthesis Kit (ThermoFisher, USA), an All-in-One™ miRNA First-Strand cDNA Synthesis Kit (QP014, GeneCopoeia, USA), and TaqMan® Universal PCR Master Mix (4304438, ABI, USA), given that different mRNAs were to be detected. The qRT-PCR reaction system was set as follows: 2 μl of cDNA (10-fold dilution), 2 μl of primers, 6 μl of DEPC water, and 10 μl of SYBR reagent (04913914001, Roche, Switzerland), and the system was added to a 96-well plate in the dark. The detection conditions of Veriti™ 96-Well Fast Thermal Cycler (4375305, ThermoFisher, USA) were set as follows: pre-denaturation at 95°C for 10 minutes, denaturation at 95°C for 15 seconds, annealing at 60°C for 1 minute, for a total of 40 cycles. The mRNA level of the detected gene was expressed as 2−ΔΔCT [32]. The primers used in this study were provided by Shanghai Sangon Biotech Company and their sequences were listed as follows: LncRNA MEG3-F, 5'-TTGCAACCCTCCTGGAATAG-3', and LncRNA MEG3-R, 5'-AGTCTTGGGTCCAGCATGTC-3'; miR-129-5p-F, 5'-TGCGTCGTATCCAGTGCAAT-3', and miR-129-5p-R, 5'-GTCGTATCCAGTGCGTGTCG-3'; Runt-related Transcription Factor 1 (RUNX1)-F, 5'-GGCAGGACGAATCACACTGA-3', and RUNX1-R, 5'-TGGCATTTCGGGGTTCTCG-3'; Type II collagen (COL2)-F, 5'-CTCCCAGAACATCACCTACCAC-3', and COL2-R, 5'-CCATCCTTCAGGGCAGTGTA-3'; SRY-related high-mobility-group box 9 (SOX9)-F, 5';-TCTACTCCACCTTCACCTACAT-3', and SOX9-R, 5'-CTGTGTGTAGACGGGTTGTT-3', SRY-related high-mobility-group box 5 (SOX5)-F, 5'-GGGGAGACAGATGGAGAGGT-3', and SOX5-R, 5'-GTGGGCTGTTTGTGCTCTTG-3'; Aggrecan-F, 5'-GTTGTATTCCACTACCGCCCG-3', and Aggrecan-R, 5'-TCACACTGCTCATAGCCTGCC-3'; silent information regulatory factor 1 (SIRT1)-F, 5'-CAAAGGAGCAGATTAGTAGGCG-3', and SIRT1-R, 5'-CTCTGGCATGTCCCACTATCAC-3'; cartilage oligomer matrix protein (COMP) -F, 5'-TCCCTGTGCCTACACACACTA-3', and COMP-R, 5'-CCCCTACGGCACCACAATAG-3'; Glyceraldehyde-3-phosphate dehydrogenase (GAPDH)-F, 5'-GATGCTGGTGCTGAGTATGRCG-3', and GAPDH-R, 5'-GTGGTGCAGGATGCATTGCTCTGA-3'; β-actin -F, 5'-CTCCATCCTGGCCTCGCTGT’, andβ-actin -R, 5'- GCTGTCACCTTCACCGTTCC −3'; RNU48-F, 5'- TGATGATGACCCCAGGTAACTCTGAGTG −3', and RNU48-R, 5'- GTCAGAGCGCTGCGGTGATGGCATCAGC −3'; U6-F, 5'-TCTGCTCCTATCCCAATTACCTG-3', and U6-R, 5'-ACTCCCGGATCTCTTCTAAGTTG-3'. GAPDH, β-actin, RUN48 and U6 were applied as internal controls for mRNA and miRNA, respectively [33,34].
Adenovirus plasmid construction
In order to prepare adenoviral plasmids for over-expressed MEG3 and knockdown MEG3 (shMEG3), we first prepared E. coli supercompetent cells DH5α and DB3.1 (preserved in our laboratory). Then we used competent cells DB3.1 to transform Gateway™ pENTR™ 2B Dual Selection Vector (pENTR2B, A10463, Invitrogen, USA) and pAd/CMV/V5-DEST vector (V49320, Invitrogen, USA) for DNA amplification. KpnI (1068A, TaKaRa, Japan) and XhoI (1094A, TaKaRa, Japan) were used to double digest the initial cloned pENTR2B recombinant plasmid. A 2% agarose gel (S14003, Yuanye, China) was used to recover and purify the vector fragments. T4 DNA ligase (15224017, Invitrogen, USA) was used to ligate the insert and vector fragments. The extracted pENTR2B recombinant plasmid was subjected to an LR reaction (25°C, 18 hours) with the target vector pAd/CMV/V5-DEST, and the LR recombination reaction was transformed into competent cells DH5α. Selectivity screening of monoclonal antibodies was performed using LB agar containing ampicillin plate. Next, we proliferated the target bacteria and extracted the over-expressed MEG3 and shMEG3 recombinant adenovirus plasmids. Finally, the recombinant adenovirus plasmid was linearized with the restriction enzyme Pac I, and the linearized product was transfected into 293A cells using a LipofectamineTM3000 kit to package the adenovirus (specific steps in Cell Transfection).
Cell transfection
The over-expressed MEG3 and shMEG3 recombinant adenovirus plasmids were first transfected into 293A cells using a LipofectamineTM 3000 kit (L3000008, ThermoFisher, USA). We replaced the culture medium of 293A cells with 1.5 ml of Opti-MEM™ reagent (31985070, Gibco, USA), and diluted 250 μl of Opti-MEM™ reagent with the recombinant adenovirus plasmids and 3 μl of LipofectamineTM 3000 reagent separately. The two diluted solutions were mixed at room temperature for 15 minutes, and then added to 293A cells. After 24 hours of incubation, the cell culture medium was replaced by DMEM medium. The cells and the culture medium of the recombinant adenovirus plasmids were collected as a recombinant adenovirus plasmid stock solution 48 hours after transfection. Next, we continued to transfect BMSCs with the recombinant adenovirus plasmid stock solution. The medium of the extracted BMSCs was replaced by a fresh medium one day before transfection. The cells were thoroughly mixed and incubated in a 37°C cell incubator overnight. The medium was replaced with another fresh medium the next day, and 24 hours later, the fluorescence of the Ad-GFP group was observed by fluorescence microscopy. MiR-129-5p mimic (Catalog 4464066, ThermoFisher, USA) was also transfected into BMSCs using the LipofectamineTM 3000 kit. The mature sequence of miR-129-5p was 5'-CUUUUUGCGGUCUGGGCUUGC-3'.
Target gene prediction and validation
The Starbase database (http://starbase.sysu.edu.cn/) was used to study the targeting relationship between lncRNA and miRNA. We retrieved data from the Starbase database and found that the wild-type sequence of lncRNA MEG3 had a targeting relationship with the miR-129-5p sequence. We then screened the target genes of miR-129-5p through the TargetScan database (http://www.targetscan.org). Verification of the target genes was performed by luciferase experiments. We used pmirGLO plasmid (CL414-01, Biomed, China) to construct wild-type MEG3 (MEG3-WT), mutant MEG3 (MEG3-mut), RUNX1-WT and RUNX1-mut reporter plasmids. BMSCs digested with 0.25% trypsin-EDTA were added with fresh medium to make a 5 × 10⁵/ml cell suspension, and then the cells were added to a 6-well plate and incubated for 24 hours (37°C). The next day, 50 ng/well of reporter plasmids and 100 pmol of miR-129-5p mimic (or miR-129-5p mimic negative control) were added to the cells. After 48 hours, the cells were washed with PBS, and then added with 500 μl/well of PLB (Invitrogen, 1168–019, USA), and incubated at room temperature for 15 minutes. After that, 20 μl of sample lysate and 100 μl of LARII reagent were added to the cells, and then the firefly luciferase activity in the cells was measured by Promega GLOMAX 20/20 (USA). Afterward, the cells were added with 100 μl of Stop & Glo reagent, and then Renilla luciferase activity in the cells was detected. The final result was expressed by the ratio of firefly/Renilla.
Cell Couting Kit-8 (CCK-8) assay
Firstly, pre-digested BMSCs were prepared into a cell suspension at a concentration of 5 × 10³/ml. Then 100 μl of the cell suspension was added to a 96-well plate and incubated in a 37°C, 5% CO2 cell incubator for 48 hours. Next, 10 μl of CCK-8 reagent (C0037, Beyotime, China) was added to each well to further incubate the cells. Finally, Absorbance at 450 nm was measured using a iMark microplate reader (BIO-RAD, USA) on day 0, 14, and 21.
Western blot
One hundred μl of cell lysate (EPX060-15823-901, Invitrogen, USA) was added to each group of pre-digested cells and mixed thoroughly. Then the lysate mixture was centrifuged, afterward, the protein stock solution (supernatant) was separated [35]. The concentration of the protein stock solution was measured using the BCA kit (23227, ThermoFisher, USA). Next, the protein stock solution was added with a loading buffer (calculated by the concentration of the protein stock solution) and boiled in boiling water for 10 minutes. Then 100 μg of protein was transferred to a 0.45 uM PVDF membrane (IPVH00010, Millipore, USA) by sodium dodecyl sulfate–polyacrylamide gel electrophoresis (SDS–PAGE). The protein-loaded PVDF membrane was then blocked with a blocking solution containing 5% skimmed milk powder for 2 hours. After that, the membrane was washed and incubated with primary antibodies overnight (4°C). The next day, the membrane was washed with TBST, and incubated with secondary antibodies Anti-Rabbit IgG (ab6721, 1: 10000, Abcam, UK) and Anti-Mouse IgG (ab150113, 1: 10000, Abcam, UK) at room temperature for 1 hour. After incubation, the membrane was washed with TBST and then added with 1 ml of ECL Reagent (NCI5079, Thermo, USA) dropwise for color development. Finally, the membrane was tested in GelDoc XR Biorad (Bio-rad, USA). The followings are the primary antibodies used in this study: COL2 (ab34712, 1:1000, Abcam, UK); SOX9 (ab185966, 1:1000, Abcam, UK); SOX5 (ab94396, 1:1000, Abcam, UK); Aggrecan (ab3778, 1:100, Abcam, UK); SIRT1 (ab32441, 1:20000, Abcam, UK); COMP (ab74524, 1:1000, Abcam, UK); RUNX1(#4334, 1:1000, CST, USA); GAPDH (ab181602, 1: 10000, Abcam, UK)
Immunofluorescence (IF) staining
BMSCs of different groups were washed with PBS and fixed with 4% paraformaldehyde (4°C). After 20 minutes, 0.1% TritonX-100 (T8787, Sigma-Aldrich, USA) was added to each group of cells (4°C). The cells were then washed and incubated for 15 minutes. Next, 5% goat serum was used to block the cells (30 minutes). Afterward, Anti-Col2 antibody was added to the cells and incubated overnight (4°C). The next day, we used Goat Anti-Rabbit IgG antibody (ab6717, 1: 10000, Abcam, UK) for immunostaining (2 hours). Then 4ʹ, 6-diamidino-2-phenylindole (DAPI, 10236276001, Roche, Switzerland) was used to stain the nuclei of BMSCs in different treatment groups for 5 minutes. The cells were finally washed thoroughly with PBS. In the study, anti-fluorescence quenching mounts and neutral gum mounts were used. Fluorescence expression in the cells was observed and recorded using a fluorescence microscope at a magnification of 400 times.
Statistical analysis
Statistical Product and Service Solutions 22.0 (SPSS 22.0, USA) was used to analyze all the data in this study. Differences between two groups were compared by Student’s two-tailed t test; differences between more than two groups were compared by one-way ANOVA . P < 0.05 was considered as statistically significant.
Results
MEG3 and miR-129-5p are expressed differently in BMSCs with different degrees of differentiation
In order to analyze the expressions of MEG3 and miR-129-5p in BMSCs, we first extracted and identified BMSCs from rats. Using a microscope, we observed that on day 0 of extraction, the cells had good morphology with a typical triangle or oval shape (Figure 1(a)); on day 14, the cell density increased significantly (Figure 1(a)); on day 21, the shape of BMSCs changed significantly into spindle shape, similar to that of fibroblasts (Figure 1(a)). The results of FACS identification showed that the proportions of CD29, CD44 and CD34 in our extracted BMSCs on the 21st day were 96.82%, 93.18% and 1.59%, respectively (Figure 1(b)). Alcian blue was used to stain the cells because it could bind to proteoglycans in chondrocytes. The results showed that on day 0 of separation, only a few nuclei in the cells were stained blue with fewer light blue secretory granules in the cytoplasm (Figure 2(a)); while on the 21st day of isolation and culture, the stained nuclei and secretory granule vesicles in the CM group increased significantly, indicating that the BMSCs isolated and cultured in the CM group had largely differentiated into chondrocytes (Figure 2(a)). QRT-PCR results showed that MEG3 expression in BMSCs was gradually up-regulated over time (Figure 2(b), p < 0.01), while that of miR-129-5p was gradually suppressed (Figure 2(c), p < 0.01).
Figure 1.
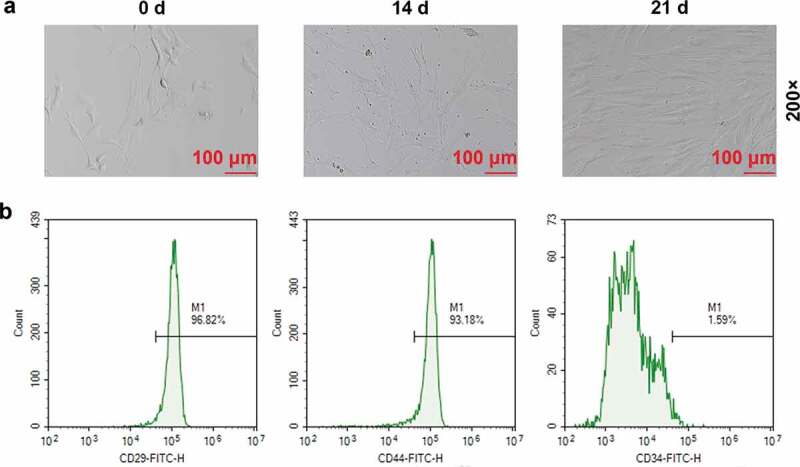
Extraction and identification of bone marrow mesenchymal stem cells (BMSCs). (a) Morphological observation of BMSCs on day 0, 14 and 21 (200×). (b) Fluorescence Activating Cell Sorter (FACS) was used to identify the contents of CD29, CD44, and CD34 in BMSCs on the 21st day
Figure 2.
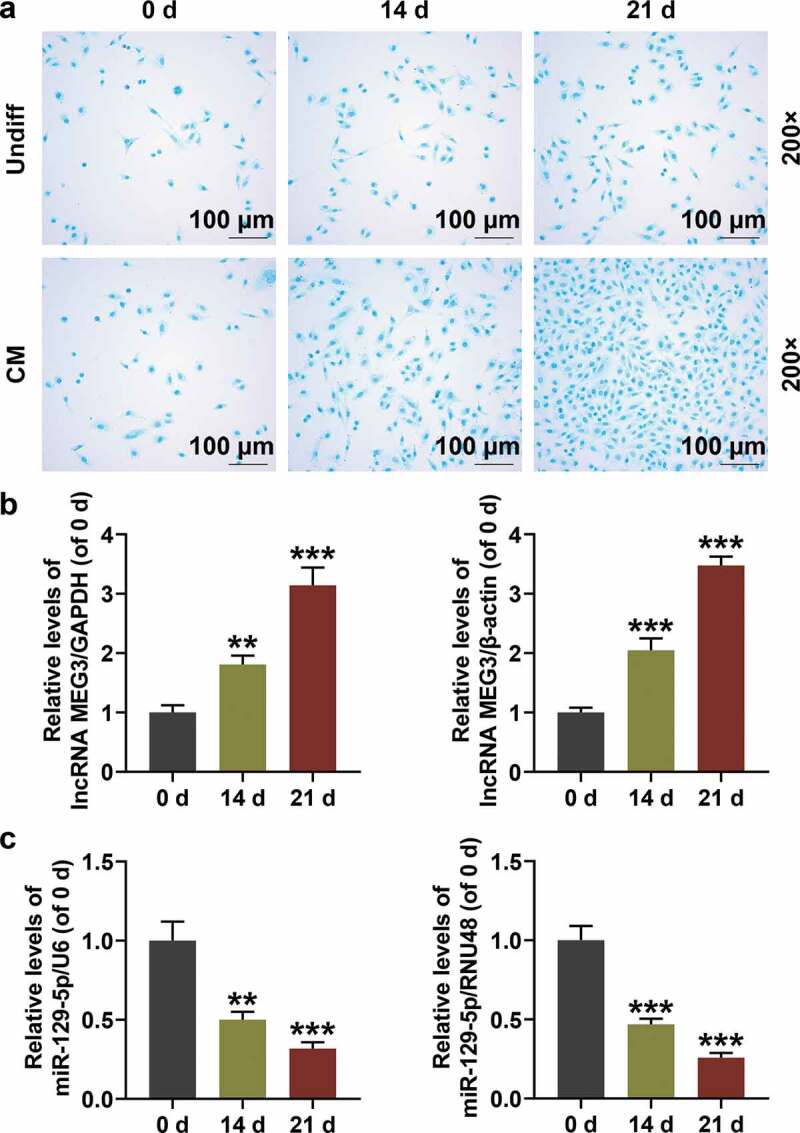
The expressions of maternally expressed 3 (MEG3) and miR-129-5p in BMSCs with different degrees of differentiation. (a) Alcian Blue staining was performed to identify the degree of BMSC differentiation into chondrocytes (200×). (b) MEG3 expression in BMSCs with different degrees of differentiation. Glyceraldehyde-3-phosphate dehydrogenase (GAPDH) was an internal reference. (c) Expression of miR-129-5p in BMSCs with different degrees of differentiation. U6 was an internal reference. All experiments were repeated for three times. **p < 0.01, ***p < 0.001 vs. 0 d. Undiff: Undifferentiated medium; CM: Cartilage differentiation medium
Effects of over-expressed or silenced MEG3 on the viability of BMSCs and the expression of COL2 and miR-129-5p are detected
We constructed over-expressed MEG3 and shMEG3 recombinant adenovirus plasmids and studied their effects on BMSCs. It was found that over-expressed MEG3 promoted the viability of BMSCs in a time-dependent manner, that is, as the culture time increased, the promoting effect was enhanced (Figure 3(a), p < 0.001). Meantime, over-expressed MEG3 up-regulated MEG3 expression (Figure 3(b), p < 0.05) and down-regulated the expression of miR-129-5p (Figure 3(c), p < 0.01). Changes in the expression of COL2 in BMSCs were detected by qRT-PCR, Western blot, and immunofluorescence (400×). The results obviously demonstrated that over-expressed MEG3 significantly up-regulated the protein expression and mRNA expression of COL2 (Figure 3(d–f), p < 0.01), while ShMEG3 had exactly the opposite effect (Figure 3(a–f)).
Figure 3.
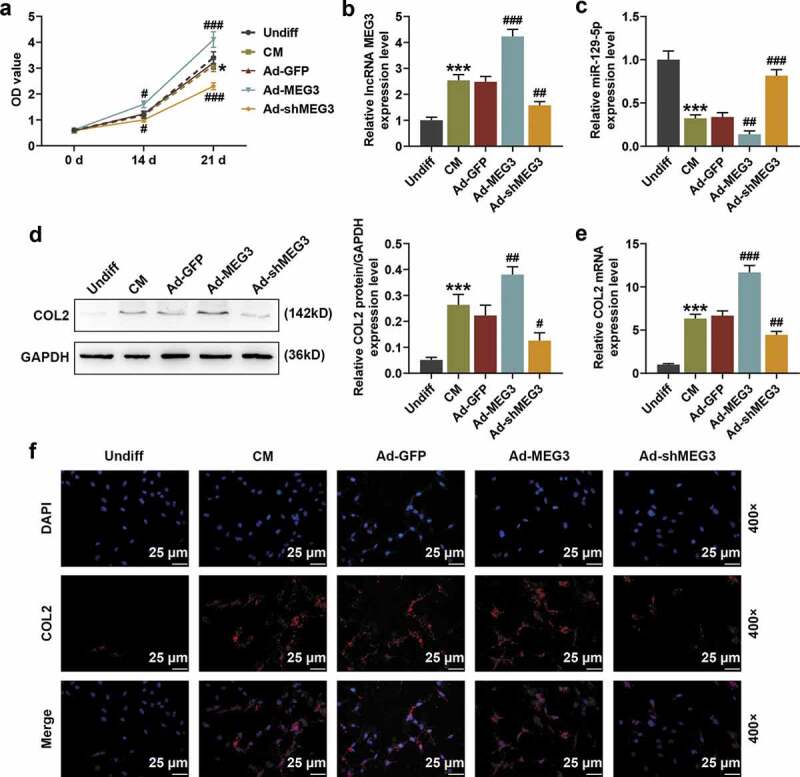
The effect of over-expressed or silenced MEG3 on the viability of BMSCs and the expressions of COL2 and miR-129-5p. (a) Cell Couting Kit-8 (CCK-8) experiments were conducted to detect the effects of over-expressed MEG3 and knockout MEG3 (shMEG3) on the viability of BMSCs. (b-c) The effects of over-expressed MEG3 and shMEG3 on the expressions of MEG3 and miR-129-5p were detected by quantitative real time-polymerase chain reaction (qRT-PCR). GAPDH and U6 were internal controls. (d) The effects of over-expressed-MEG3 and shMEG3 on the expression of collagen Ⅱ of cartilage (COL2) were detected by Western blot. GAPDH was an internal reference. (e) The effects of over-expressed MEG3 and shMEG3 on COL2 expression were detected by qRT-PCR. GAPDH was an internal reference. (f) The effects of over-expressed MEG3 and shMEG3 on COL2 expression were detected by immunofluorescence (IF) staining (400×). All experiments were repeated for three times. *p < 0.05, ***p < 0.001 vs. Undiff; ##p < 0.01, ###p < 0.001 vs. Ad-GFP. Undiff: undifferentiated medium; CM: cartilage differentiation medium; Ad-GFP: adenovirus carrying the green fluorescent protein gene; Ad-MEG3: adenovirus carrying the over-expressed-MEG3 gene; Ad-shMEG3: Adenovirus carrying the knockout-MEG3 gene; DAPI: 4ʹ, 6-diamidino-2-phenylindole
Effects of over-expressed or silenced MEG3 on the expressions of cartilage differentiation-related genes in BMSCs are detected
In order to further explore the mechanism by which MEG3 affected BMSCs, we analyzed the expressions of cartilage differentiation-related genes SOX9, SOX5, Aggrecan, SIRT1, and COMP in BMSCs by Western blot and qRT-PCR. The results showed that compared with the cells in the undifferentiated group, SOX9, SOX5, Aggrecan, SIRT1, and COMP were all up-regulated in the differentiated cells (Figure 4(a,b), p < 0.01). Over-expressed MEG3 also significantly up-regulated the protein and mRNA expressions of SOX9, SOX5, Aggrecan, SIRT1, and COMP in BMSCs (Figure 4(a,b), p < 0.05). In addition, over-expressed MEG3 significantly promoted the differentiation of BMSCs into chondrocytes (Figure 4(c), 200×), while silenced MEG3 showed the opposite effects (Figure 4(a,b,c)). The above evidence strongly suggested that over-expressed MEG3 promoted the differentiation of BMSCs into chondrocytes by up-regulating cartilage differentiation-related genes.
Figure 4.
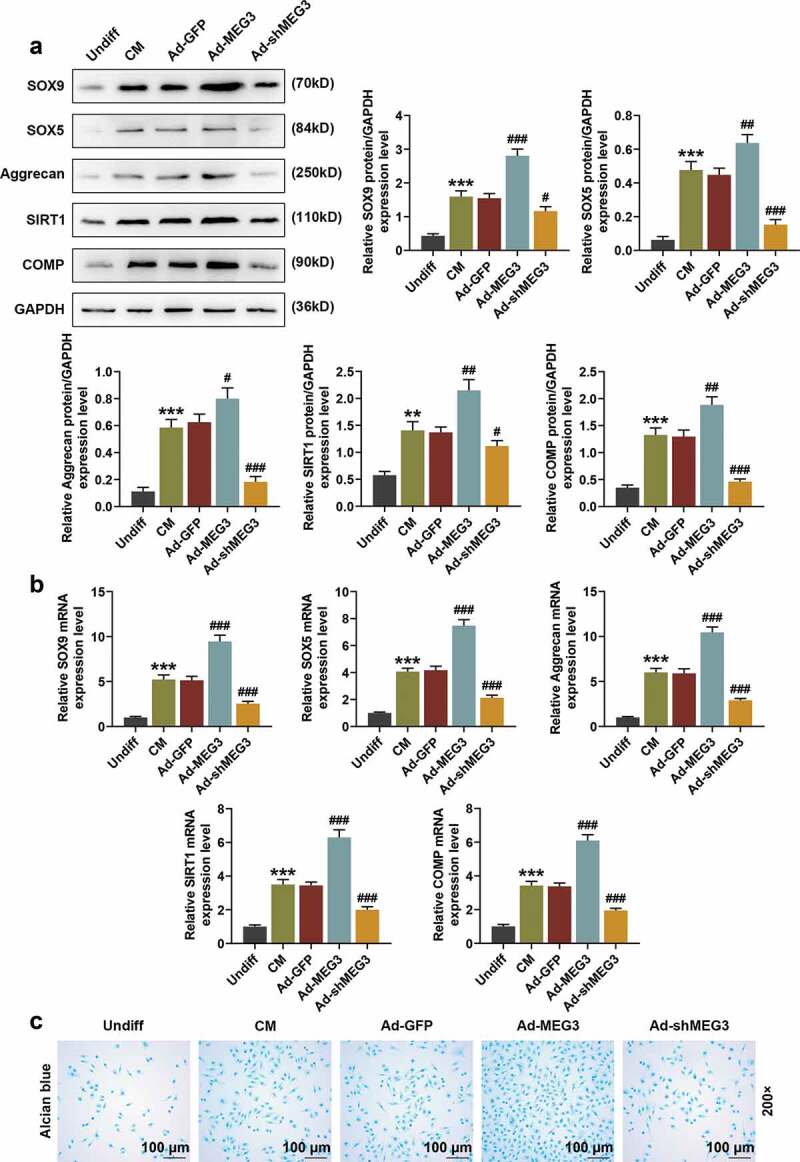
Over-expression or silencing of MEG3 regulated cartilage differentiation-related genes. (a) The expressions of SOX9, SOX5, Aggrecan, SIRT1, and COMP in BMSCs were detected by Western blot. GAPDH was an internal reference. (b) The expressions of SOX9, SOX5, Aggrecan, SIRT1, and COMP in BMSCs were detected by qRT-PCR. GAPDH was an internal reference. (c) The effects of over-expressed MEG3 and shMEG3 on BMSC differentiation were detected by Alcian Blue staining (200×). All experiments were repeated for three times. **p < 0.01, ***p < 0.001 vs. Undiff; #p < 0.05, ##p < 0.01, ###p < 0.001 vs. Ad-GFP. SOX9: SRY-related high-mobility-group box 9; SOX5: SRY-related high-mobility-group box 5; SIRT1: Silence information regulator 1; COMP: Cartilage oligomer matrix protein
MEG3 specifically targets miR-129-5p, and miR-129-5p specifically targets RUNX1
We searched the Starbase database and found that lncRNA MEG3 has a targeting relationship with the miR-129-5p sequence (Figure 5(a)), and we further identified that RUNX1 is a target gene of miR-129-5p (Figure 5(b)). Next, the target gene was verified by luciferase experiments. The experimental results showed that the fluorescence expressions of miR-129-5p mimic and MEG3-WT in co-transfected cells were significantly reduced (Figure 5(c), p < 0.01), and those of miR-129-5p mimic and RUNX1-WT in co-transfected cells were also significantly reduced (Figure 5(d), p < 0.01). Meantime, the above expressions were significantly lower than those in the control group (Figure 5(d), p < 0.01), indicating that there was a targeting relationship between MEG3 and miR-129-5p, and between miR-129-5p and RUNX1.
Figure 5.
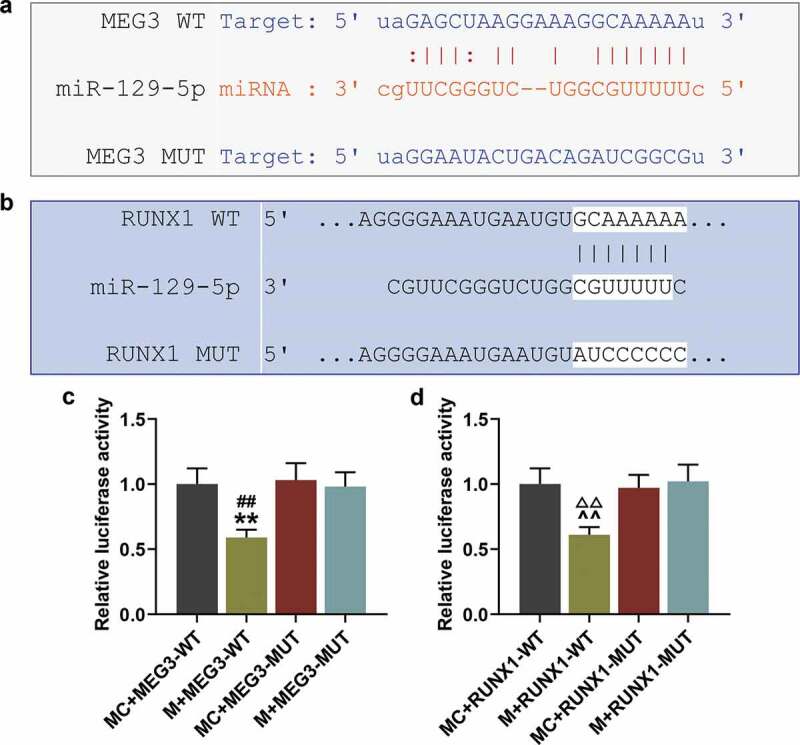
MEG3 specifically targeted miR-129-5p and miR-129-5p specifically targeted RUNX1. (a) Starbase database was used to identify the targeting relationship between lncRNA MEG3 and miR-129-5p. (b) TargetScan database was used to screen out the target genes of miR-129-5p. (c) Luciferase assay was used to verify the targeting relationship between MEG3 and miR-129-5p. (d) Luciferase assay was used to verify the targeting relationship between miR-129-5p and RUNX1. All experiments were repeated for three times. **p < 0.01 vs. MC + MEG3-WT; ##p < 0.01 vs. M + MEG3-MUT; ^^p < 0.01 vs. MC + RUNX1-WT; ΔΔp<0.01 vs. M + RUNX1-MUT. M: miR-129-5p mimic; MC: miR-129-5p mimic control; WT: wild type; MUT: mutant; RUNX1: Runt-related Transcription Factor 1
Over-expressed MEG3 partially reverses the down-regulating effect of miR-129-5p on RUNX1 and COL2
From the results of qRT-PCR, we found that over-expressed MEG3 partially reversed the up-regulating effect of miR-129-5p mimic on miR-129-5p (Figure 6(a), p < 0.01). MiR-129-5p mimic down-regulated the protein and mRNA expressions of RUNX1 in cells (Figure 6(b,c), p < 0.01), but this effect was partially reversed by over-expressed MEG3 (Figure 6(b,c), p < 0.05). QRT-PCR, Western blot, and IF (400×) were used to detect the effects of miR-129-5p mimic on COL2 in BMSCs. The results showed that miR-129-5p mimic significantly inhibited the protein expression and mRNA expression of COL2 (Figure 6(d–f), p < 0.001). Similarly, this inhibitory effect of miR-129-5p mimic was also partially reversed by over-expressed MEG3 (Figure 6(d–f), p < 0.01).
Figure 6.
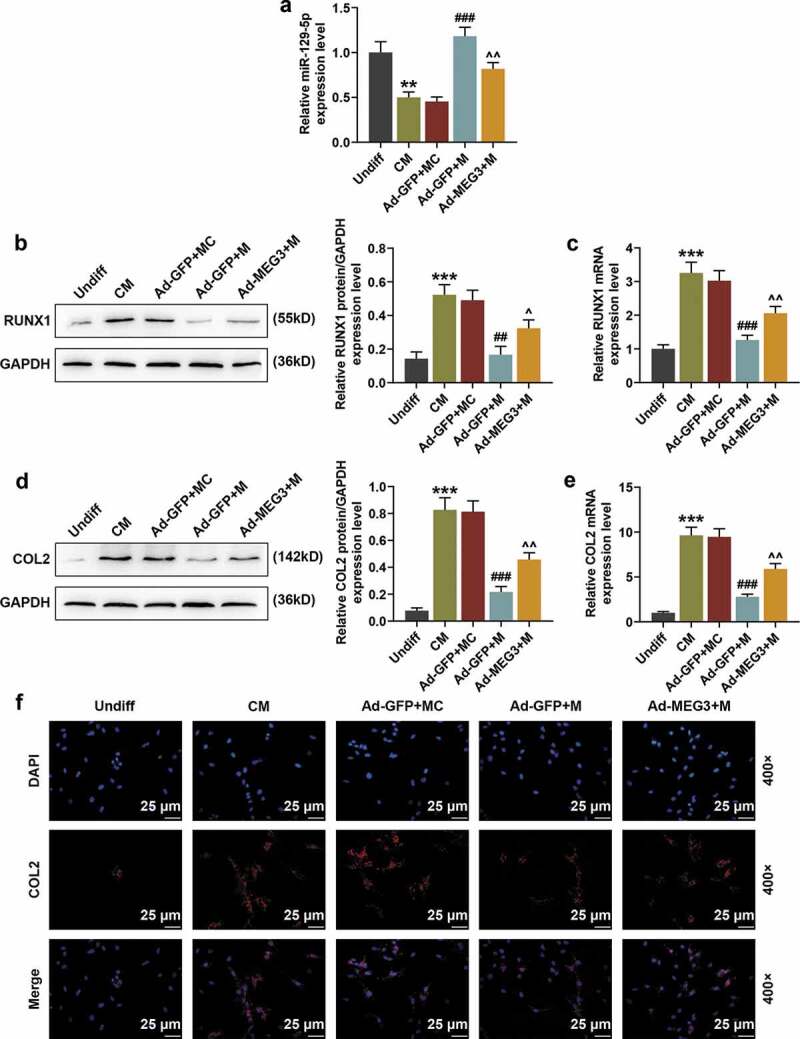
Over-expressed MEG3 partially reversed the down-regulating effects of miR-129-5p mimic on RUNX1 and COL2. (a) The effects of miR-129-5p mimic and over-expressed MEG3 on miR-129-5p expression were detected by qRT-PCR. U6 was an internal reference. (b) The effects of miR-129-5p mimic and over-expressed MEG3 on the expression of RUNX1 protein were detected by Western blot. GAPDH was an internal reference. (c) The effects of miR-129-5p mimic and over-expressed MEG3 on the mRNA levels of RUNX1 were detected by qRT-PCR. GAPDH was an internal reference. (d) The effects of miR-129-5p mimic and over-expressed MEG3 on the protein expression of COL2 were detected by Western blot. GAPDH was an internal reference. (e) The effects of miR-129-5p mimic and over-expressed MEG3 on the mRNA levels of COL2 were detected by qRT-PCR. GAPDH was an internal reference. (f) The effects of miR-129-5p mimic and over-expressed MEG3 on COL2 expression were detected by immunofluorescence (IF) staining (400×). All experiments were repeated for three times. **p < 0.01, ***p < 0.001 vs. Undiff; ##p < 0.01, ###p < 0.001 vs. Ad-GFP + MC; ^p < 0.05, ^^p < 0.01 vs. Ad-GFP + M
Over-expressed MEG3 partially reverses the inhibitory effect of miR-129-5p on cartilage differentiation-related genes and BMSC differentiation
We also investigated the effects of miR-129-5p mimic on the expressions of cartilage differentiation-related genes and BMSC differentiation. We found that miR-129-5p mimic significantly down-regulated the protein expressions and mRNA expressions of SOX9, SOX5, Aggrecan, SIRT1, and COMP (Figure 7(a,b), p < 0.05). Besides, miR-129-5p mimic also inhibited the differentiation of BMSCs into chondrocytes (Figure 7(c)). However, the inhibitory effects of miR-129-5p mimic were partially reversed by over-expressed MEG3 (Figure 7(a–c), p < 0.05).
Figure 7.
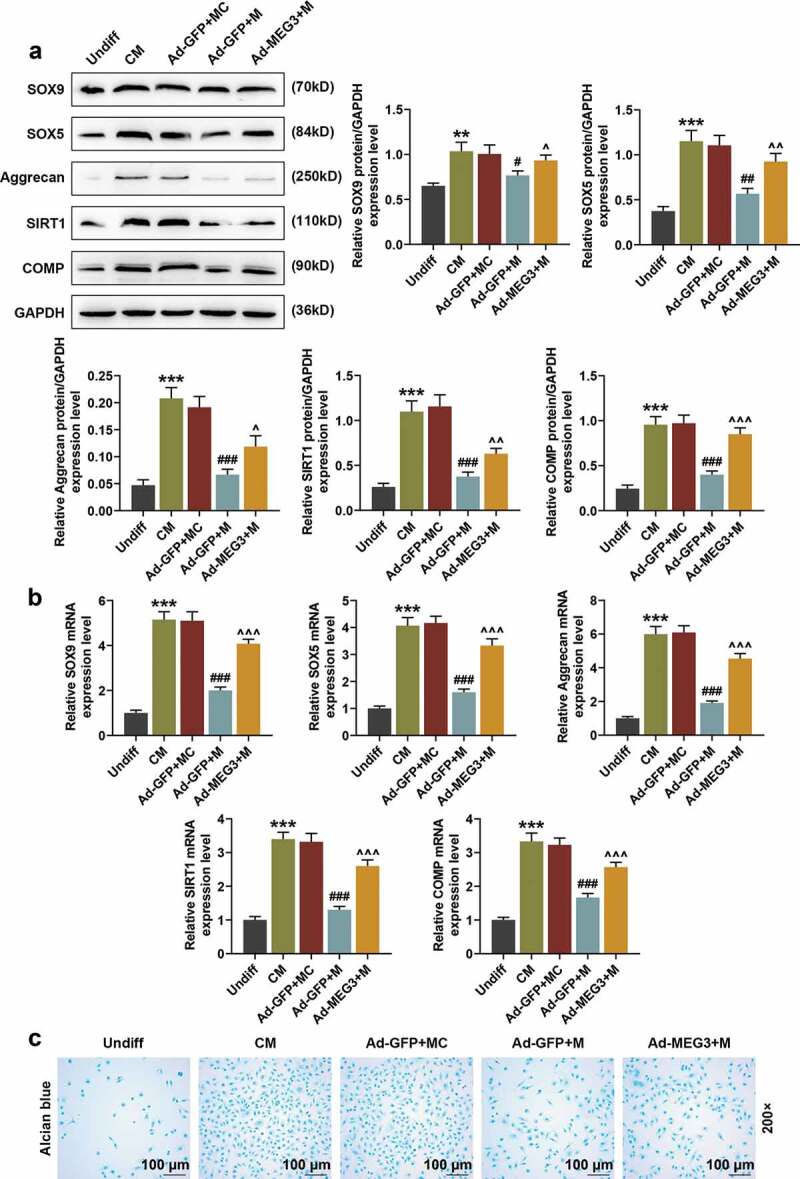
Over-expressed MEG3 partially reversed the inhibitory effect of miR-129-5p on cartilage differentiation-related genes and BMSC differentiation. (a) The effects of miR-129-5p mimic and over-expressed MEG3 on the expressions of SOX9, SOX5, Aggrecan, SIRT1, and COMP were detected by Western blot. GAPDH was an internal reference. (b) The effects of miR-129-5p mimic and over-expressed MEG3 on the expressions of SOX9, SOX5, Aggrecan, SIRT1, and COMP were detected by qRT-PCR. GAPDH was an internal reference. (c) The effects of miR-129-5p mimic and over-expressed MEG3 on BMSC differentiation were detected by Alcian Blue staining (200×). All experiments were repeated for three times. **p < 0.01, ***p < 0.001 vs. Undiff; #p < 0.05, ##p < 0.01, ###p < 0.001 vs. Ad-GFP + MC; ^p < 0.05, ^^p < 0.01, ^^^p < 0.001 vs. Ad-GFP + M
Discussion
Our experimental results showed that the expression of lncRNA MEG3 was gradually increased with the cartilage differentiation of BMSCs. Over-expression of MEG3 could promote BMSC vitality, up-regulate the expressions of COL2, SOX9, SOX5, Aggrecan, SIRT1, and COMP in cells, and promote BMSCs to differentiate into chondrocytes. COL2 and Aggrecan are the main components of extracellular matrix. Studies have shown that the glycosaminoglycan branches of Aggrecan can absorb water molecules and maintain the water content and hydrostatic pressure of nucleus pulposus, which is beneficial to uniformly dispersing the load and avoiding stress concentration [36].
COL2 is the main structure that maintains the normal physicochemical properties and mechanical properties of articular cartilage. Lack of COL2 or COL2 mutation results in a variety of cartilage hypoplasia diseases [37]. Belonging to the type D subfamily of the SOX gene family, SOX9 and SOX5 play an important role in the process of cartilage formation in animals and in the generation and development of articular hoses and synovium, and they can coordinately regulate the expression of COL2 to control cartilage remodeling [38]. SOX9 plays a key role in chondrocyte differentiation and participates in the regulation of multiple differentiation stages of cartilage. SOX9 heterozygote-deficient mice not only have abnormal bone development but also die shortly after birth, and this is also true of patients with the same mutation [39]. SIRT1, as a key regulatory gene of cell senescence, can promote its expression to up-regulate COL2A1, Aggrecan and SOX9 in osteoarthritis cells. Tong et al. found that MEG3 can promote SIRT1 expression by targeting miR-34a [40], which is consistent with our findings. Another study reported that a mutation in the COMP gene triggers premature death of chondrocytes and pseudochondral hypoplasia [41]. These studies more strongly illustrated the importance of our detection of the expressions of COL2, SOX9, SOX5, Aggrecan, SIRT1 and COMP.
This study also found that miR-129-5p is a target gene of MEG3, and discussed the mutual regulation of miR-129-5p and MEG3. MiR-129-5p is a mature miRNA formed by cutting the precursor miRNA of MiR-129 at the 5ʹ end [42]. Current research on miR-129-5p is mainly focused on tumor diseases: miR-129-5p expression is down-regulated in glioma tissues and glioma cells, and over-expressed miR-129-5p inhibits TGIF2 expression and tumor growth [43]; miR-129-5p can inhibit the proliferation, migration and invasion of gastric cancer cells by selectively inhibiting COL1A1 [44]; Xiao et al. found that over-expressed miR-129-5p could promote the process in which human bone marrow mesenchymal stem cells (hBMSCs) were induced to differentiate into osteoblasts in vitro [45]. Our study demonstrated that over-expressed miR-129-5p inhibited the differentiation of BMSCs into chondrocytes and down-regulated the expressions of cartilage differentiation-related genes in cells. As an upstream targeting gene of miR-129-5p, MEG3 could not only down-regulate the expression of miR-129-5p, but also partially reverse the inhibitory effect of miR-129-5p on BMSC differentiation. In our study, miR-129-5p mimic significantly inhibited COL2, SOX9, SOX5, COMP, Aggrecan and SIRT1, while the effect was partially reversed by MEG3.
RUNX1 plays an important regulatory role in various cell differentiation processes such as hematopoietic stem cell differentiation, skeletal development, and neural development. Studies have shown that RUNX1 knockout mice die early in development due to hematopoietic stem cells and neurodevelopmental defects [46]; over-expression of RUNX1 in mesenchymal stem cells will promote chondrocyte differentiation, while knocking down RUNX1 will inhibit RUNX2 expression and the differentiation of chondrocytes and osteoblasts [47]. We discovered for the first time that RUNX1 is a target gene of miR-129-5p and can be inhibited by miR-129-5p. LncRNA, MEG3 might upregulatie differentiation-regulated genes by downregulating miR-129-5p via site-binding, and the mechanism needed further research.
The limitation of this study was that RNA-seq experiment was not conducted to acquire characteristic gene expression signatures of chondrocytes on a genome-wide scale, or in vivo experiments were not conducted either, which would be the future research direction and could be conducted in future.
In summary, this study found that over-expressed lncRNA MEG3 can promote the differentiation of BMSCs into chondrocytes by up-regulating the expressions of cartilage differentiation-related genes (COL2, SOX9, SOX5, Aggrecan, SIRT1, and COMP) and inhibiting the effect of miR-129-5p. This study provides a reliable basis for the application of lncRNA in articular cartilage injury.
Disclosure of interest
The authors report no conflict of interest.
References
- [1].Decker RS, Koyama E, Pacifici M.. Articular cartilage: structural and developmental intricacies and questions. Curr Osteoporos Rep. 2015. December;13(6):407–414. [DOI] [PMC free article] [PubMed] [Google Scholar]
- [2].Simon TM, Jackson DW. Articular cartilage: injury pathways and treatment options. Sports Med Arthrosc Rev. 2018. March;26(1):31–39. [DOI] [PubMed] [Google Scholar]
- [3].Armiento AR, Stoddart MJ, Alini M, et al. Biomaterials for articular cartilage tissue engineering: learning from biology. Acta Biomater. 2018. January;65:1–20. [DOI] [PubMed] [Google Scholar]
- [4].Makris EA, Gomoll AH, Malizos KN, et al. Repair and tissue engineering techniques for articular cartilage. Nat Rev Rheumatol. 2015. January;11(1):21–34. [DOI] [PMC free article] [PubMed] [Google Scholar]
- [5].Hunziker EB. Articular cartilage repair: basic science and clinical progress. A review of the current status and prospects. Osteoarthritis Cartilage. 2002. June;10(6):432–463. [DOI] [PubMed] [Google Scholar]
- [6].Jahr H, Matta C, Mobasheri A. Physicochemical and biomechanical stimuli in cell-based articular cartilage repair. Curr Rheumatol Rep. 2015. March;17(3):22. [DOI] [PMC free article] [PubMed] [Google Scholar]
- [7].Derubeis AR, Cancedda R. Bone marrow stromal cells (BMSCs) in bone engineering: limitations and recent advances. Ann Biomed Eng. 2004. January;32(1):160–165. [DOI] [PubMed] [Google Scholar]
- [8].Fu X, Liu G, Halim A, et al. Mesenchymal stem cell migration and tissue repair. Cells. 2019. July 28;8(8):784. [DOI] [PMC free article] [PubMed] [Google Scholar]
- [9].Reissis D, Tang QO, Cooper NC, et al. Current clinical evidence for the use of mesenchymal stem cells in articular cartilage repair. Expert Opin Biol Ther. 2016;16(4):535–557. [DOI] [PubMed] [Google Scholar]
- [10].Chang YH, Liu HW, Wu KC, et al. Mesenchymal stem cells and their clinical applications in osteoarthritis. Cell Transplant. 2016;25(5):937–950. [DOI] [PubMed] [Google Scholar]
- [11].Wu M, Chen G, Li YP. TGF-beta and BMP signaling in osteoblast, skeletal development, and bone formation, homeostasis and disease. Bone Res. 2016;4:16009. [DOI] [PMC free article] [PubMed] [Google Scholar]
- [12].Witt R, Weigand A, Boos AM, et al. Mesenchymal stem cells and myoblast differentiation under HGF and IGF-1 stimulation for 3D skeletal muscle tissue engineering. BMC Cell Biol. 2017. February 28;18(1):15. [DOI] [PMC free article] [PubMed] [Google Scholar]
- [13].Ling L, Camilleri ET, Helledie T, et al. Effect of heparin on the biological properties and molecular signature of human mesenchymal stem cells. Gene. 2016. January 15;576(1 Pt 2):292–303. [DOI] [PMC free article] [PubMed] [Google Scholar]
- [14].Swingler TE, Niu L, Smith P, et al. The function of microRNAs in cartilage and osteoarthritis. Clin Exp Rheumatol. 2019. Sep-Oct;37 Suppl 120(5):40–47. [PubMed] [Google Scholar]
- [15].Steinbusch MMF, Caron MMJ, Surtel DAM, et al. Expression of RMRP RNA is regulated in chondrocyte hypertrophy and determines chondrogenic differentiation. Sci Rep. 2017. July 25;7(1):6440. [DOI] [PMC free article] [PubMed] [Google Scholar]
- [16].Jathar S, Kumar V, Srivastava J, et al. Technological developments in lncRNA biology. Adv Exp Med Biol. 2017;1008:283–323. [DOI] [PubMed] [Google Scholar]
- [17].Ajekigbe B, Cheung K, Xu Y, et al. Identification of long non-coding RNAs expressed in knee and hip osteoarthritic cartilage. Osteoarthritis Cartilage. 2019. April;27(4):694–702. [DOI] [PMC free article] [PubMed] [Google Scholar]
- [18].Barter MJ, Gomez R, Hyatt S, et al. The long non-coding RNA ROCR contributes to SOX9 expression and chondrogenic differentiation of human mesenchymal stem cells. Development. 2017. December 15;144(24):4510–4521. [DOI] [PMC free article] [PubMed] [Google Scholar]
- [19].Fan X, Yuan J, Xie J, et al. Long non-protein coding RNA DANCR functions as a competing endogenous RNA to regulate osteoarthritis progression via miR-577/SphK2 axis. Biochem Biophys Res Commun. 2018. June 7;500(3):658–664. [DOI] [PubMed] [Google Scholar]
- [20].Razmara E, Bitaraf A, Yousefi H, et al. Non-coding rnas in cartilage development: an updated review. Int J Mol Sci. 2019. September 11;20(18):4475. [DOI] [PMC free article] [PubMed] [Google Scholar]
- [21].Miyoshi N, Wagatsuma H, Wakana S, et al. Identification of an imprinted gene, Meg3/Gtl2 and its human homologue MEG3, first mapped on mouse distal chromosome 12 and human chromosome 14q. Genes Cells. 2000. March;5(3):211–220. [DOI] [PubMed] [Google Scholar]
- [22].He Y, Luo Y, Liang B, et al. Potential applications of MEG3 in cancer diagnosis and prognosis. Oncotarget. 2017. September 22;8(42):73282–73295. [DOI] [PMC free article] [PubMed] [Google Scholar]
- [23].Wei GH, Wang X. lncRNA MEG3 inhibit proliferation and metastasis of gastric cancer via p53 signaling pathway. Eur Rev Med Pharmacol Sci. 2017. October;21(17):3850–3856. [PubMed] [Google Scholar]
- [24].Lyu Y, Lou J, Yang Y, et al. Dysfunction of the WT1-MEG3 signaling promotes AML leukemogenesis via p53-dependent and -independent pathways. Leukemia. 2017. December;31(12):2543–2551. [DOI] [PMC free article] [PubMed] [Google Scholar]
- [25].Boon RA, Hofmann P, Michalik KM, et al. Long noncoding RNA Meg3 controls endothelial cell aging and function: implications for regenerative angiogenesis. J Am Coll Cardiol. 2016. December 13;68(23):2589–2591. [DOI] [PubMed] [Google Scholar]
- [26].Piccoli MT, Gupta SK, Viereck J, et al. Inhibition of the cardiac fibroblast-enriched lncRNA Meg3 prevents cardiac fibrosis and diastolic dysfunction. Circ Res. 2017. August 18;121(5):575–583. [DOI] [PubMed] [Google Scholar]
- [27].Chen K, Zhu H, Zheng MQ, et al. LncRNA MEG3 inhibits the degradation of the extracellular matrix of chondrocytes in osteoarthritis via targeting miR-93/TGFBR2 axis. Cartilage. 2019;28:1947603519855759. [DOI] [PMC free article] [PubMed] [Google Scholar]
- [28].You D, Yang C, Huang J, et al. Long non-coding RNA MEG3 inhibits chondrogenic differentiation of synovium-derived mesenchymal stem cells by epigenetically inhibiting TRIB2 via methyltransferase EZH2. Cell Signal. 2019. November;63:109379. [DOI] [PubMed] [Google Scholar]
- [29].Catena V, Bruno T, De Nicola F, et al. Deptor transcriptionally regulates endoplasmic reticulum homeostasis in multiple myeloma cells. Oncotarget. 2016. October 25;7(43):70546–70558. [DOI] [PMC free article] [PubMed] [Google Scholar]
- [30].Li Z, Jin C, Chen S, et al. Long non-coding RNA MEG3 inhibits adipogenesis and promotes osteogenesis of human adipose-derived mesenchymal stem cells via miR-140-5p. Mol Cell Biochem. 2017. September;433(1–2):51–60. [DOI] [PubMed] [Google Scholar]
- [31].Wang Q, Li Y, Zhang Y, et al. LncRNA MEG3 inhibited osteogenic differentiation of bone marrow mesenchymal stem cells from postmenopausal osteoporosis by targeting miR-133a-3p. Biomed Pharmacothe. 2017. May;89:1178–1186. [DOI] [PubMed] [Google Scholar]
- [32].Giallombardo M, Chacartegui Borras J, Castiglia M, et al. Exosomal miRNA analysis in non-small cell lung cancer (NSCLC) patients’ plasma through qPCR: a feasible liquid biopsy tool. J Vis Exp. 2016;27(111):53900. [DOI] [PMC free article] [PubMed] [Google Scholar]
- [33].Ning S, Liu H, Gao B, et al. miR-155, miR-96 and miR-99a as potential diagnostic and prognostic tools for the clinical management of hepatocellular carcinoma. Oncol Lett. 2019. September;18(3):3381–3387. [DOI] [PMC free article] [PubMed] [Google Scholar]
- [34].Li N, Cui T, Guo W, et al. MiR-155-5p accelerates the metastasis of cervical cancer cell via targeting TP53INP1. Onco Targets Ther. 2019;12:3181–3196. [DOI] [PMC free article] [PubMed] [Google Scholar]
- [35].Hnasko TS, Hnasko RM. The western blot. Methods Mol Biol. 2015;1318:87–96. [DOI] [PubMed] [Google Scholar]
- [36].Watanabe H, Yamada Y, Kimata K. Roles of aggrecan, a large chondroitin sulfate proteoglycan, in cartilage structure and function. J Biochem. 1998. October;124(4):687–693. [DOI] [PubMed] [Google Scholar]
- [37].Grant TD, Cho J, Ariail KS, et al. Col2-GFP reporter marks chondrocyte lineage and chondrogenesis during mouse skeletal development. Dev Dyn. 2000. June;218(2):394–400. [DOI] [PubMed] [Google Scholar]
- [38].Renard E, Poree B, Chadjichristos C, et al. Sox9/Sox6 and Sp1 are involved in the insulin-like growth factor-I-mediated upregulation of human type II collagen gene expression in articular chondrocytes. J Mol Med (Berl). 2012. June;90(6):649–666. [DOI] [PubMed] [Google Scholar]
- [39].Lefebvre V. Roles and regulation of SOX transcription factors in skeletogenesis. Curr Top Dev Biol. 2019;133:171–193. [DOI] [PMC free article] [PubMed] [Google Scholar]
- [40].Fujita N, Matsushita T, Ishida K, et al. Potential involvement of SIRT1 in the pathogenesis of osteoarthritis through the modulation of chondrocyte gene expressions. J Orthop Res. 2011. April;29(4):511–515. [DOI] [PubMed] [Google Scholar]
- [41].Tong P, Peng QH, Gu LM, et al. LncRNA-MEG3 alleviates high glucose induced inflammation and apoptosis of retina epithelial cells via regulating miR-34a/SIRT1 axis. Exp Mol Pathol. 2019. April;107:102–109. [DOI] [PubMed] [Google Scholar]
- [42].Lagos-Quintana M, Rauhut R, Yalcin A, et al. Identification of tissue-specific microRNAs from mouse. Curr Biol. 2002. April 30;12(9):735–739. [DOI] [PubMed] [Google Scholar]
- [43].Diao Y, Jin B, Huang L, et al. MiR-129-5p inhibits glioma cell progression in vitro and in vivo by targeting TGIF2. J Cell Mol Med. 2018. April;22(4):2357–2367. [DOI] [PMC free article] [PubMed] [Google Scholar] [Retracted]
- [44].Wang Q, Yu J. MiR-129-5p suppresses gastric cancer cell invasion and proliferation by inhibiting COL1A1. Biochem Cell Biol. 2018. February;96(1):19–25. [DOI] [PubMed] [Google Scholar]
- [45].Xiao WZ, Gu XC, Hu B, et al. Role of microRNA-129-5p in osteoblast differentiation from bone marrow mesenchymal stem cells. Cell Mol Biol (Noisy-le-grand). 2016. March 31;62(3):95–99. [PubMed] [Google Scholar]
- [46].Okuda T, van Deursen J, Hiebert SW, et al. AML1, the target of multiple chromosomal translocations in human leukemia, is essential for normal fetal liver hematopoiesis. Cell. 1996. January 26;84(2):321–330. [DOI] [PubMed] [Google Scholar]
- [47].Wang Y, Belflower RM, Dong YF, et al. Runx1/AML1/Cbfa2 mediates onset of mesenchymal cell differentiation toward chondrogenesis. J Bone Miner Res. 2005. September;20(9):1624–1636. [DOI] [PubMed] [Google Scholar]