

ABSTRACT
Background
Selenium (Se) is a trace element that has been linked to many health conditions. Genome-wide association studies (GWAS) have identified variants for blood and toenail Se levels, but no GWAS has been conducted to date on responses to Se supplementation.
Objectives
A GWAS was performed to identify the single nucleotide polymorphisms (SNPs) associated with changes in Se concentrations after 1 year of supplementation. A GWAS of basal plasma Se concentrations at study entry was conducted to evaluate whether SNPs for Se responses overlap with SNPs for basal Se levels.
Methods
A total of 428 participants aged 40–80 years of European descent from the Selenium and Celecoxib Trial (Sel/Cel Trial) who received daily supplementation with 200 µg of selenized yeast were included for the GWAS of responses to supplementation. Plasma Se concentrations were measured from blood samples collected at the time of recruitment and after 1 year of supplementation. Linear regression analyses were performed to assess the relationship between each SNP and changes in Se concentrations. We further examined whether the identified SNPs overlapped with those related to basal Se concentrations.
Results
No SNP was significantly associated with changes in Se concentration at a genome-wide significance level. However, rs56856693, located upstream of the NEK6, was nominally associated with changes in Se concentrations after supplementation (P = 4.41 × 10⁻⁷), as were 2 additional SNPs, rs11960388 and rs6887869, located in the dimethylglycine dehydrogenase (DMGDH)/betaine-homocysteine S-methyltransferase (BHMT) region (P = 0.01). Alleles of 2 SNPs in the DMGDH/BHMT region associated with greater increases in Se concentrations after supplementation were also strongly associated with higher basal Se concentrations (P = 8.67 × 10⁻⁸).
Conclusions
This first GWAS of responses to Se supplementation in participants of European descent from the Sel/Cel Trial suggests that SNPs in the NEK6 and DMGDH/BHMT regions influence responses to supplementation.
Keywords: selenium supplementation, plasma selenium concentration, GWAS, chemoprevention trial, Single Nucleotide Polymorphisms
Introduction
Selenium (Se) is a trace element that has been investigated in several large clinical trials for anticarcinogenic effects. The Nutritional Prevention of Cancer Trial reported a statistically significant 58% lower risk for colorectal cancer and 63% reduced odds for prostate cancer among those who received 200 µg/d Se compared to placebo (1). These findings prompted the Selenium and Vitamin E Cancer Prevention Trial, which found no effect of Se supplementation (200 µg/d), either with or without vitamin E supplementation, on the prostate cancer incidence when compared to use of a placebo (2, 3). Next, the Selenium and Celecoxib (Sel/Cel) Trial led by our research group reported no significant effect of Se on the risk of developing a new colorectal adenoma; however, the results suggested that participants had differential responses to Se supplementation (4). Although effect modification by baseline Se concentrations was not observed in the Sel/Cel Trial, the observation of heterogeneity of the treatment effect is similar to findings of other studies regarding antioxidant nutrients, which have led to controversy regarding cancer prevention strategies based on micronutrient supplementation (5, 6).
In completed trials to date, 1 potential difference between study participants that may affect their response to Se is genetic background. An individual's ability to metabolize and excrete Se after consumption likely depends, at least in part, on variations in key regulatory genes for these processes. Genome-wide association studies (GWAS) of blood or toenail Se levels have identified variants mapping to genes involved in glycoprotein catabolism, the development of visceral obesity, and amino acid metabolism (7−9). Whether the same variants also relate to responses to Se supplementation is unknown.
In the present study, we conducted GWAS for 2 endpoints: changes in Se concentrations after 1 year of supplementation and basal Se concentrations in the Sel/Cel Trial (4). We further assessed whether SNPs that had previously been shown in the literature to be related to blood or toenail Se concentrations were also related to Se responses. This is the first GWAS of responses to Se supplementation.
Methods
Study population
Of 1621 study participants in the Sel/Cel Trial, 1211 participants who self-reported European decent and passed GWAS quality controls (QC) with plasma Se measurements were included (Figure 1). Of these, 428 were in the Se-supplemented group and had second measurements of plasma Se concentrations available from after 1 year of supplementation. These second blood samples were obtained at a median of 382 days (range, 343−571 days) after the first blood draw to assess baseline Se concentrations. These 428 individuals were included for the GWAS of responses to Se supplementation. All 1211 participants were included in the GWAS of basal Se concentrations. The Sel/Cel Trial has been described in detail elsewhere (4, 10). Briefly, this was a randomized, double-blind, placebo-controlled trial conducted at the University of Arizona Cancer Center with the objective of determining whether daily intake of 200 µg/d of Se as a supplement (SelenoExcell High Selenium Yeast capsules) could reduce the risk for developing metachronous—that is, recurrent—colorectal adenomas. Male and female participants were eligible for the Sel/Cel Trial. They were between 40 and 80 years of age, and they had a total colonoscopy with removal of at least 1 adenoma with a minimum diameter of ≥3 mm within the 6 months prior to study entry (4). The exclusion criteria included the presence of familial adenomatous polyposis or hereditary nonpolyposis colorectal cancer; reported uncontrolled hypertension or heart disease; uncontrolled diabetes; or renal insufficiency (4). Participants were recruited between 2001 and 2011 from endoscopy clinics located in Arizona, Colorado, Texas, and New York (10). The trial protocol was approved and overseen by the University of Arizona Institutional Review Board (IRB), and conduct of the trial was in accordance with requirements of the local IRB at each study site.
FIGURE 1.

Study participant flow diagram. Abbreviations: GWAS, genome-wide association study; Se, selenium; Sel/Cel Trial, Selenium and Celecoxib Trial.
Measurement of plasma Se concentrations
Blood samples were collected at study randomization and again after about 1 year of supplementation. Concentrations of Se in plasma were obtained using the AAnalyst 600 atomic absorption spectrometer (Perkin-Elmer), which was equipped with a transversely heated graphite furnace with Zeeman background correction and a Se electrodeless discharge lamp. Optimization of conditions for the furnace was conducted by ascertaining the sensitivity with the best signal-to-noise ratio and good linearity of the calibration curve. Prior to the analysis, each plasma sample was prepared with a dilution in matrix modifiers containing 0.01% nickelous nitrate hexahydrate and 0.0043% magnesium nitrate hexahydrate in 0.4% nitric acid and 0.2% triton X-100. The method of additions was used to prepare the calibration standards. The National Institute of Standards and Technology selenium standard (Standard Reference Material 3149) was used for calibration of the assay. For each batch of analyses, QC samples with known concentrations of Se were included within every 10 samples, and triplicate readings were collected for each sample.
Genome-wide scans and quality control
Genotyping was performed for 1331 samples from the Sel/Cel Trial. DNA was extracted from blood samples collected at the time of study entry using QIAamp DNA mini kits according to the manufacturer's instructions (Qiagen). Genotyping was performed at Gene by Gene on the Illumina Global Screening Array. Genotypes were called using the Illumina recommended protocol with Illumina GenomeStudio. All the samples had a genotyping rate ≥98%. Then, we excluded SNPs with a genotyping call rate <95%, a minor allele frequency (MAF) <1%, and Hardy-Weinberg Equilibrium (HWE) P values < 0.001. A total of 624 110 SNPs was available for 1331 participants after QC procedures.
Subsequently, we excluded 120 samples. We excluded participants who self-reported as being of non-European decent (n = 104), such as Hispanic Americans, African Americans, and Asians, as well as mixed-race individuals. We removed samples with inconsistent sex and race/ethnicity information between the genotype and clinical data (n = 3). Due to heterogenous genomic backgrounds existing in human populations, this study focused on European descent, the largest racial/ethnic group in the Sel/Cel Trial. A principal component (PC) analysis was performed to assess inconsistencies between self-reported race/ethnicity and genomic backgrounds using 1000 Genomes Project data as a reference panel. Individuals who self-identified as European descent and who clustered with the 1000 Genomes Project European population were included. An identity-by-descent analysis was performed to identify potentially duplicated samples or related individuals, and the pairs of potentially duplicated samples were removed (n = 9). Basal Se measurements were not available for 4 study participants, and they were omitted from the analysis. This resulted in a total of 1211 samples that were included in the study of basal Se concentrations.
Imputation was performed using Michigan Imputation Server (11). The phasing of genotype data was done using Eagle version 2.3 (12). Imputation was performed using Minimac3 algorithm and the Haplotype Reference Consortium panel (13). After the imputation, there were a total of 39 127 678 SNPs. We included 7 663 546 SNPs after removing 31 464 132 SNPs with poor imputation quality (Rsq <0.3), MAF <1%, and HWE P value < 0.001.
Statistical analysis
Characteristics of the study participants were summarized with means and standard deviations or by counts for categorical variables. Among participants in the trial who received the Se supplement (n = 428), 2 measurements of plasma Se concentrations were available for assessments of changes in Se levels: 1 at study entry (basal) and 1 following the first year of supplementation. This difference in Se concentrations was used to identify SNPs that were associated with responses to Se supplementation. Multiple linear regression analyses were performed to test association between each SNP and changes in Se concentrations, adjusting for age at enrollment, sex, BMI, basal plasma Se concentrations, and the first 3 PCs to control for underlying population structure. Additional analyses were performed, including on the average number of Se pills taken per day and history of polyps (prior to the qualifying colonoscopy for the Sel/Cel Trial) in the regression model.
Additionally, a GWAS of basal plasma Se concentrations was conducted to examine whether there was overlap with variants related to responses to supplementation. Basal plasma Se concentrations were log-transformed. Linear regression analyses were used to identify genetic variants associated with plasma Se concentrations, adjusting for age at enrollment, sex, and the first 3 PCs. A conditional analysis was performed to examine whether there are independently associated SNPs in the identified regions. No evidence of inflation for either GWAS was observed (λ = 1.0; Supplemental Figure 1). The statistical analysis was performed using PLINK 1.90 (14), and genome-wide significance was set at P = 5.0 × 10⁻⁸. We also reported SNPs with nominal significance (P < 1.00 × 10⁻⁵ for changes in Se concentrations and P < 1.0 × 10⁻⁶ for basal Se concentrations). We also assessed associations with variants that had been reported from previous GWAS, including SNPs in aspartylglucosaminidase (AGA), dimethylglycine dehydrogenase (DMGDH), betaine-homocysteine S-methyltransferase (BHMT), homer scaffold protein 1 (HOMER1), solute carrier family 39 member 11 (SLC39A11), and cystathionine beta-synthase (CBS) (9, 15, 16), as well as SNPs in candidate genes that are related to Se functions and metabolism, including iodothyronine deiodinase 3 (DIO3); glutathione peroxidase 1, 2, and 3 (GPX1, GPX2, and GPX3, respectively); selenoprotein P (SELENOP); and thioredoxin reductase 1 (TXNRD1) (9, 17, 18).
Results
Study participant characteristics
Table 1 presents the characteristics of the population at study randomization, as well as the same variables for a subcohort of participants who received the Se supplement during the parent trial. The mean age, BMI, and waist-hip ratio (WHR) were similar in the overall population and the subcohort. There were more male than female study participants in both the overall population (64.5%) and the Se-supplemented subcohort (66.8%). The basal plasma Se concentrations were 139 ± 25.9 ng/mL for all participants and 139 ± 27.0 ng/mL for the subcohort. In the Se-supplemented group, the Se concentration increased by a mean of 69.8 ± 44.0 ng/mL, resulting in an average concentration of 208 ng/mL after 1 year of Se supplementation. When the changes in Se concentrations were compared among study participants who had low basal Se concentrations (<135 ng/mL) and those who had high concentrations (≥135 ng/mL), the mean increase in Se concentrations was greater in the study participants who had low basal Se concentrations (mean 81.0 ng/mL; SD ± 40.4) than in those who had high concentrations (mean, 58.6 ng/mL; SD ± 44.6; P < 0.001).
TABLE 1.
Characteristics of study participants included in the current study from the Selenium and Celecoxib Trial
| Total population1 | Se-supplemented subcohort2 | |
|---|---|---|
| Characteristics | n = 1211 | n = 428 |
| Age at enrollment, y | 63.3 ± 8.8 | 63.6 ± 9.0 |
| Sex, n (%) | ||
| Male | 780 (64.5) | 286 (66.8) |
| Female | 430 (35.5) | 142 (33.2) |
| BMI, kg/m2 | 29.0 ± 5.0 | 28.7 ± 4.9 |
| WHR | 0.949 ± 0.095 | 0.950 ± 0.094 |
| History of colorectal polyps,3n (%) | ||
| Yes | 397 (32.8) | 144 (34.2) |
| No | 796 (65.7) | 277 (65.8) |
| Baseline plasma selenium concentrations, ng/mL | 139 ± 25.9 | 139 ± 27.0 |
| Average supplemental pills, n/day | 0.977 (0.937–0.994) | 0.977 (0.937–0.993) |
| Change in plasma selenium concentrations, ng/mL | 28.2 ± 50.1 | 69.8 ± 44.0 |
| Plasma selenium concentration at Year 1 follow-up, ng/mL | 176 ± 47.6 | 209 ± 41.8 |
Values are shown as either mean ± SD, median (IQR), or frequency (%). Abbreviations: GWAS, genome-wide association study; Se, selenium; Sel/Cel Trial, Selenium and Celecoxib Trial; WHR, waist-hip ratio.
Total population of study participants who were included for the GWAS of basal Se concentrations.
Study participants in selenium-supplemented groups in the Sel/Cel Trial who received daily supplementation with 200 µg of selenized yeast.
Participant report of having had polyps prior to the qualifying colonoscopy for the Sel/Cel Trial.
GWAS of changes in Se concentration and basal Se concentrations
In the GWAS of changes in Se concentrations after supplementation, no association met genome-wide significance at P < 5.0 × 10⁻⁸ (Table 2). A variant (rs56856693) located upstream of the NEK6 (NIMA-related kinase 6) gene at 9q33.3 was nominally associated with a change in Se concentration, and the minor allele, T, was associated with an increase in the plasma Se concentration after supplementation (P = 4.41 × 10⁻⁷; Figure 2). An additional statistical adjustment with variables for the average number of 200 µg/d Se pills taken per day and previous history of polyps attenuated this relationship (P = 1.24 × 10⁻⁶). Samples were also stratified based on low and high basal Se concentrations. The NEK6 SNP, rs56856693, was associated with changes in Se concentrations of similar strength in both groups (β = 18.2 [P = 4.37 × 10⁻⁴] in the group with low basal Se concentrations and β = 19.7 [P = 7.18 × 10⁻⁴] in the group with high basal Se concentrations).
TABLE 2.
Top single nucleotide polymorphism from 14 loci associated with changes in selenium concentrations
| Chromosome Position | Changes in Se Concentration2 | Baseline Se Concentrations3 | ||||||||
|---|---|---|---|---|---|---|---|---|---|---|
| SNP | Gene1 | Allele | MAF2 | β | SE | P | β | SE | P | |
| rs56856693 | 9:126 971 353 | NEK6: Upstream Variant | T/C | 0.156 | 18.500 | 3.606 | 4.41 × 10⁻⁷ | −0.007 | 0.004 | 0.09 |
| rs34918453 | 3:1 161 939 | CNTN6: Intron Variant | G/A | 0.306 | 12.700 | 2.568 | 2.67 × 10⁻⁶ | 0.0006 | 0.003 | 0.86 |
| rs79133495 | 1:90 047 900 | LRRC8B: Intron Variant | T/A | 0.052 | 28.200 | 5.928 | 2.71 × 10⁻⁶ | −0.002 | 0.007 | 0.81 |
| rs10417091 | 19:1 287 387 | EFNA2: Intron Variant | A/C | 0.089 | 22.830 | 4.814 | 2.91 × 10⁻⁶ | −0.007 | 0.006 | 0.19 |
| rs439667 | 11:8 259 358 | LMO1: Intron Variant | C/G | 0.276 | −13.190 | 2.809 | 3.62 × 10⁻⁶ | −0.0007 | 0.004 | 0.84 |
| rs2700036 | 12:30 415 409 | IPO8: Upstream Variant | C/G | 0.314 | −13.400 | 2.868 | 4.00 × 10⁻⁶ | −0.004 | 0.003 | 0.29 |
| rs916856 | 7:27 936 243 | JAZF1: Intron Variant | C/T | 0.408 | 11.620 | 2.552 | 6.96 × 10⁻⁶ | 0.003 | 0.003 | 0.42 |
| rs652187 | 7:17 525 702 | LOC101927630: Intron Variant | A/G | 0.426 | 11.680 | 2.566 | 6.96 × 10⁻⁶ | 0.003 | 0.003 | 0.42 |
| rs17411601 | 8:19 977 043 | SLC18A1: Upstream Variant | T/G | 0.389 | 11.950 | 2.642 | 7.95 × 10⁻⁶ | −0.005 | 0.003 | 0.17 |
| rs11953563 | 5:14 062 069 | TRIO: Upstream Variant | T/C | 0.440 | −11.690 | 2.596 | 8.73 × 10⁻⁶ | −0.002 | 0.003 | 0.49 |
| rs4840475 | 8:10 152 599 | MSRA: Intron Variant | T/C | 0.312 | 12.320 | 2.740 | 9.00 × 10⁻⁶ | −0.001 | 0.003 | 0.66 |
| rs73125921 | 3:83 841 917 | — | T/G | 0.084 | −22.980 | 5.116 | 9.13 × 10⁻⁶ | 0.009 | 0.006 | 0.13 |
| rs6498246 | 16:11 887 169 | ZC3H7A: Intron Variant | A/G | 0.156 | −15.230 | 3.391 | 9.14 × 10⁻⁶ | 0.001 | 0.004 | 0.88 |
| rs6438565 | 3:119 870 658 | GPR156: Intron Variant | T/C | 0.395 | 11.700 | 2.617 | 9.99 × 10⁻⁶ | −0.0001 | 0.003 | 0.99 |
Data are after 1 year of selenium supplementation in the selenium-supplemented group (n = 428). SNPs with P < 1.00 × 10⁻⁵ were ordered based on the strength of significance for changes in Se concentrations. Abbreviations: MAF, minor allele frequency; PC, principal component; Se, selenium; SNP, single nucleotide polymorphism.
Gene is closest to the identified variants.
Adjusting for age at enrollment, sex, BMI, basal plasma Se concentrations, and the first 3 PCs.
Adjusting for age at enrollment, sex, and the first 3 PCs.
FIGURE 2.

(A) Manhattan plot of 7 663 546 SNPs showing genome-wide association analysis results for changes in plasma selenium concentrations after 1 year of supplementation in the selenium-supplemented group. The x-axis represents chromosomal positions, and the y-axis shows P values on a logarithmic scale. A SNP, rs56856693, near NEK6 was nominally associated with changes in plasma Se concentrations after 1 year of Se supplementation (P = 4.41 × 10⁻⁷). (B) LocusZoom plot of a region near NEK6 showing rs56856693 is located upstream of NEK6. The horizontal line indicates the physical position on chromosome 9. Abbreviations: cM, centimorgan; Mb, megabase; Se, selenium; SNP, single nucleotide polymorphism.
In the GWAS of basal Se concentrations, no association met genome-wide significance (Figure 3; Supplemental Table 1). Three independent loci—mapping to 5q14.1 at the region around DMGDH and BHMT, 5q12.1 near importin 11 (IPO11), and 17q24.2 in phosphatidylinositol transfer protein cytoplasmic 1 (PITPNC1)—were nominally associated with basal Se concentrations (P < 1.0 × 10⁻⁶; Supplemental Figure 2). The presence of the minor allele of each of the index SNPs at 5q14.1 was positively associated with plasma Se concentrations. For rs11960388, mean plasma concentrations for the TT, TA, and AA genotypes were 136.8, 145.6, and 150.7 ng/ml, respectively. The NEK6 rs56856693 was not associated with the basal plasma Se concentrations (P > 0.05), nor were any of the other SNPs.
FIGURE 3.
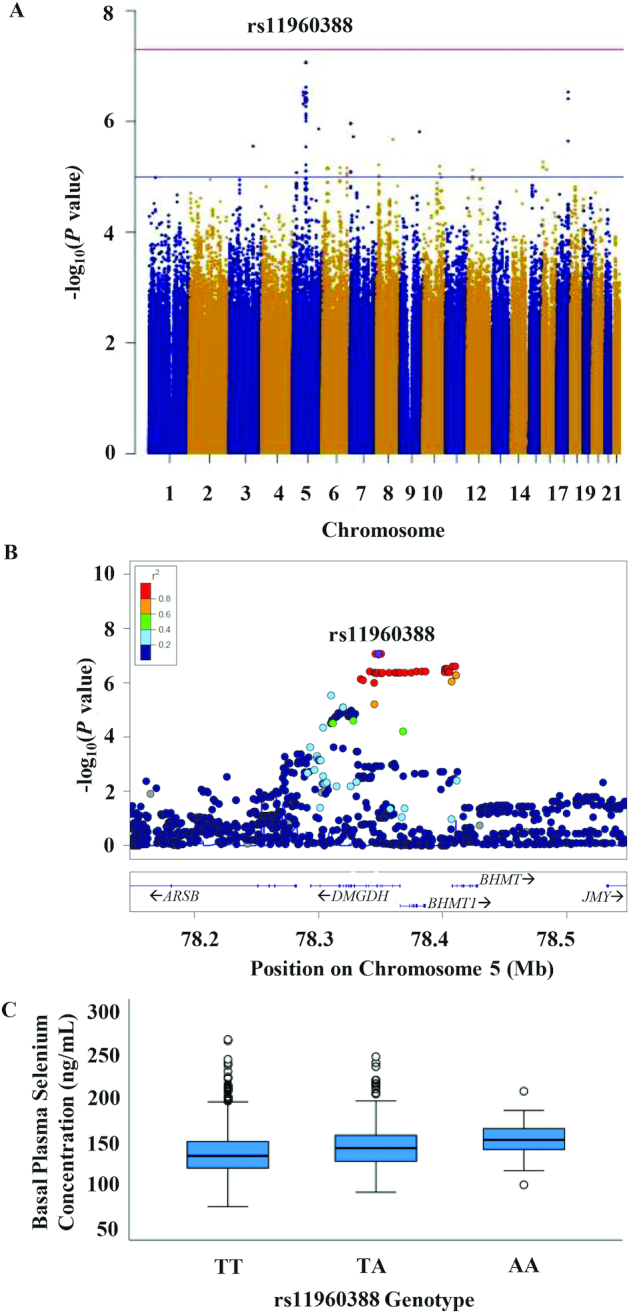
(A) Manhattan plot showing genome-wide association analysis results for basal plasma selenium concentrations in the total population. The x-axis represents chromosomal positions, and the y-axis shows P values on a logarithmic scale. A SNP, rs11960388, in DMGDH was nominally associated with the plasma Se concentration (P = 8.67 × 10⁻⁸). (B) LocusZoom plot showing association between DMGDH/BHMT SNPs and plasma Se concentrations. The horizontal line indicates the physical position on chromosome 5. (C) Mean Se concentrations (ng/mL) at baseline (y-axis) of rs11960388 genotypes (TT, TA, and AA on x-axis). Abbreviations: BHMT, betaine-homocysteine S-methyltransferase; DMGDH, dimethylglycine dehydrogenase; Mb, megabase; Se, selenium; SNP, single nucleotide polymorphism.
We sought to confirm our findings using those of a previously completed GWAS of toenail Se concentrations (9). The 2 top SNPs from the current work, rs11960388 and rs6887869 in DMGDH, were in complete linkage disequilibrium (r2 = 1.0; Supplemental Figure 3) and were moderately linked to rs17823744 (r2 = 0.7), identified in the GWAS of Se concentration in toenails. These 2 SNPs (rs11960388 and rs6887869) were also strongly associated with Se concentrations in toenails (P = 4.18 × 10⁻¹⁵ and P = 2.60 × 10⁻¹⁵, respectively), but the IPO11 SNP rs11745652 was not (P = 0.49). Because the SNP rs2916143 in PITPNC1 was not interrogated in the work of Cornelis et al. (9), associations of other SNPs in the PITPNC1 region were investigated, and none were found to be associated with Se concentrations.
Among SNPs associated with Se levels in previous GWAS, 2 DMGDH intronic SNPs, rs17823744 and rs921943, were associated with basal plasma Se concentrations in the current study (P = 6.05 × 10⁻⁶ and P = 1.29 × 10⁻⁵, respectively; Supplemental Table 2). We also replicated 2 SNPs, rs6859667 on HOMER1 and rs6586282 on CBS, that had reached genome-wide significance in a GWAS meta-analysis (9). Among the candidate gene variants, SNPs in GPX1 (rs1050450), SELENOP (rs3877899 and rs2329999), and GPX2 (rs7160073) were associated with basal plasma Se concentrations at P < 0.05.
SNPs associated with both basal Se concentrations and changes in Se concentrations
Next, we investigated whether those SNPs identified in current and previous studies of circulating and toenail Se concentrations were also associated with changes in Se concentrations. Among the SNPs that were associated with basal plasma Se concentrations in the current study, 3 SNPs in DMGDH and 1 in HOMER1 were also significantly associated with changes in Se concentrations at P < 0.05, but the associations between these SNPs and the changes in Se concentrations were weak (P ≥ 0.01; Table 3). The rs11960338 and rs6887869 alleles in DMGDH associated with higher basal Se concentrations were associated with greater increases in Se concentrations after supplementation (P = 0.01). The SNP rs17823744 from the previous GWAS was also associated with changes in Se concentrations (P = 0.02), and rs921943 showed a trend for a significant association (P = 0.07). The SNP rs6859667 in HOMER1 was significantly associated with the changes in Se concentrations (P = 0.04), but CBS SNP rs6586282 was not associated with the changes in Se concentrations. The IPO11 and PITPNC1 SNPs identified in the current study, as well as the candidate gene variants that were associated with basal Se concentrations, GPX1 (rs1050450), SELENOP (rs3877899 and rs2329999), and GPX2 (rs7160073), were not associated with changes in Se concentrations after supplementation (P > 0.05).
TABLE 3.
Associations between selenium-related single nucleotide polymorphisms and changes in plasma selenium concentrations
| SNP1 | Gene | Chromosome: Position | Allele | MAF | β | SE | P |
|---|---|---|---|---|---|---|---|
| GWAS | |||||||
| rs11960388 | DMGDH | 5:78 348 209 | A/T | 0.119 | 10.030 | 4.046 | 0.01 |
| rs6887869 | DMGDH | 5:78 345 885 | C/G | 0.119 | 10.030 | 4.046 | 0.01 |
| rs17823744 | DMGDH | 5:78 344 976 | G/A | 0.121 | 9.439 | 4.047 | 0.02 |
| rs921943 | DMGDH | 5:78 316 476 | T/C | 0.286 | 5.047 | 2.745 | 0.07 |
| rs11745652 | IPO11 | 5:62 038 924 | T/C | 0.161 | −1.520 | 3.557 | 0.67 |
| rs2916143 | PITPNC1 | 17:65 504 830 | G/C | 0.137 | 2.406 | 3.901 | 0.54 |
| rs6859667 | HOMER1 | 5:78 745 042 | C/T | 0.042 | 12.610 | 6.179 | 0.04 |
| rs6586282 | CBS | 21:44 478 497 | T/C | 0.186 | −0.590 | 3.559 | 0.87 |
| Candidate gene | |||||||
| rs1050450 | GPX1 | 3:49 394 834 | A/G | 0.305 | −0.314 | 2.781 | 0.91 |
| rs3877899 | SELENOP | 5:42 801 268 | T/C | 0.236 | −3.943 | 3.124 | 0.21 |
| rs2329999 | SELENOP | 5:42 849 236 | T/G | 0.299 | −4.202 | 2.863 | 0.14 |
| rs7160073 | GPX2 | 14:65 450 630 | T/G | 0.366 | 1.741 | 2.769 | 0.53 |
Data are after 1 year of supplementation in the selenium-supplemented group (n = 428). Abbreviations: CBS, cystathionine beta-synthase; DMGDH, dimethylglycine dehydrogenase; GPX, glutathione peroxidase; GWAS, genome-wide association study; HOMER1, homer scaffold protein 1; IPO11, importin 11; MAF, minor allele frequency; PC, principal component; PITPNC1, phosphatidylinositol transfer protein cytoplasmic 1; SELENOP, selenoprotein P; SNP, single nucleotide polymorphism.
Adjusting for age at enrollment, sex, and the first 3 PCs.
Discussion
In the present study, no variants exhibited genome-wide significance for changes in Se concentrations after supplementation; however, a locus upstream of the NEK6 gene was nominally associated with changes in Se concentrations, but not with basal Se concentrations. For basal concentrations, the DMGDH/BHMT variants rs11960388, rs6887869, and rs56880920 were more strongly associated with plasma Se concentrations than any other SNPs examined. These SNPs in DMGDH were also nominally associated with changes in plasma Se concentrations after Se supplementation for an average of 1 year.
The complex network of molecules involved in Se disposition has been described in detail (19). There are 25 genes in human genomes encoding selenoproteins (20). The selenoproteins exhibit a wide range of activity (19), and their characterization has substantially broadened the avenues for research focused on potential Se mechanisms of action. All selenoproteins have the common component of insertion of the amino acid selenocysteine, which differs from cysteine by the replacement of sulfur with Se (19). The genes encoding selenoproteins include the GPX1, GPX2, GPX3, SELENOP, selenoprotein F (SELENOF), TXNRD1, and thioredoxin reductase 2 (TXNRD2). To better understand Se metabolism, this study used a genome-wide approach to identify variants associated with changes in Se concentrations after supplementation and with circulating plasma Se concentrations.
A locus near NEK6 was nominally associated with changes in Se concentrations. This gene encodes an enzyme, serine/threonine-protein kinase Nek6. The role of this enzyme in Se disposition is not clear, but the current finding potentially opens a new research pathway for Se disposition. The NEK family of kinases has roles in cell cycle regulation and has been implicated in cancer (21, 22). A study showed Se supplementation lowered another family of serine/threonine protein kinase levels in the pig liver (23). However, this association requires replication in independent data sets. A previous candidate SNP study reported a significant association between a SELENOP SNP, rs3877899, and changes in serum Se concentrations in pregnant women after approximately 20 weeks of supplementation (17). In the present work, this SNP was associated with Se concentrations, but it was not related to changes in Se concentrations after supplementation, and there were no SNPs strongly associated with changes in Se concentrations in and around this gene. Differences in study designs and populations between the 2 studies, including the timing and duration of supplementation, may have contributed to the different findings.
It is possible that different sets of genes are involved in plasma Se concentrations and responses to supplementation. In this study, the SNPs associated with changes in Se concentrations after supplementation were not associated with basal Se concentrations. The SNPs associated with plasma Se concentrations showed modest associations with changes in Se concentrations. The present study, however, provides strong support for the variants in the DMGDH, BHMT, and BHMT2 regions on chromosome 5 that are involved in the Se metabolism and response to supplementation. To date, 3 GWAS have been conducted, mainly with individuals of European descent, in regard to the endpoint of blood or toenail concentrations of Se (9, 15, 16). In these investigations, novel findings were reported for associations with loci related to homocysteine metabolism and/or glycoprotein metabolism, including DMGDH, BHMT, and BHMT2 (9, 15). These 3 genes encode enzymes that have been demonstrated to have a role in homocysteine metabolism (24). Variants identified in prior GWAS and this study or nearby variants in these genes likely influence expression and activities of these genes in the homocysteine metabolism. Studies have identified variants in the DMGDH/BHMT region that are related to dimethylglycine or betaine metabolite concentrations in blood and/or urine (25−30). SNPs in this region are also associated with BHMT expression in the tibial nerve (27) and BHMT activity and protein levels in the liver (31).
The relationship of supplemental Se in this study to DMGDH, BHMT, and BHMT2 most likely is similar to relationship of selenomethionine (SeMet) found in plant-based foods to these genes. The amount of SeMet found in plant-based foods varies by region and food type (32). Although the selenium-enriched yeast used for supplementation is comprised of different forms of Se, SeMet is the most abundant species found in selenized yeast, estimated at 75%, and is easily absorbed (33, 34). In addition, a previous study demonstrated the selenized yeast (200 µg/d) was a safer option for Se supplementation compared to the same dose of SeMet in a healthy population of New Zealand males (35). It is also likely that the homocysteine metabolism plays an important role in Se metabolism. Studies have reported that the Se concentration was negatively associated with homocysteine concentrations in the blood (36, 37), supporting the associations between identified variants in these genes and changes in Se concentrations and basal Se concentrations. However, intervention with supplementation containing SeMet did not increase circulating homocysteine concentrations (36, 38). Se supplementation may be able to increase circulating homocysteine concentrations more effectively in populations with very low selenium statuses. In rats and mice fed with a Se-reduced diet, low homocysteine concentrations in plasma, heart, kidney, and liver, and reduced hepatic betaine-homocysteine methyltransferase activity were observed compared to rats and mice fed with a high-Se diet (39, 40). Higher circulating concentrations of homocysteine are also related to an increased risk of many health conditions, including cancer, diabetes, cardiovascular disease, autoimmune disease, and skeletal diseases (41, 42). Genetic variants in these 3 genes (for example, major alleles of identified SNPs associated with low Se concentrations) reduce the bioavailable Se concentration, and they may affect gene expression and activity of gene products and these health conditions. This relationship needs to be further explored in future studies.
This study has several limitations. First, the sample size was small for the GWAS of changes in Se concentrations, and it is possible that identified SNPs were false-positive signatures. Follow-up studies including larger samples or a meta-analysis are necessary to confirm the associations of identified variants and to identify additional loci associated with responses to Se supplementation. However, to our knowledge, this is the first GWAS of changes in Se concentrations after supplementation in a clinical trial. Second, the observed variation in changes in Se concentrations may be largely due to the variation in basal Se concentrations and/or compliance rather than genetic variation. The participants in the supplement group had consumed supplements for 1 year at the time of the follow-up blood draw employed for this analysis. Some participants may have reached an optimal plasma Se concentration regardless of their genetic background after 1 year of supplementation. Further, the study participants who had high basal Se concentrations may not have experienced a benefit from supplementation with more Se. The study participants self-reported the number of Se supplemental pills per day, which was confirmed by pill counts at study visits. However, it is possible that some of the participants did not adhere to treatment as well as anticipated. Moreover, BMI is a poor measurement of adiposity, and other measurements of adiposity, such as WHR, may capture the variation in changes in Se concentrations and basal Se concentrations better. However, including the WHR in the regression model instead of BMI yielded similar results, and we reported analysis results from the models including BMI.
In conclusion, this study supports associations between variants in the DMGDH/BHMT region and plasma Se concentrations. SNPs in DMGDH/BHMT were also associated with changes in plasma Se concentrations after 1 year of Se supplementation. These findings indicate that DMGDH and/or BHMT are major genes involved in Se metabolism or functions.
Supplementary Material
Acknowledgments
We thank Carole Kepler for her management of specimens and Mary Yagle for her preparation of DNA samples for genotyping.
The authors’ responsibilities were as follows – KB, MJT, YC, LNK, MCC, and C-HH: conducted the single nucleotide polymorphisms analysis, imputation, and statistical analysis; KB, MJT, MCC, and ETJ: wrote the manuscript; NAE: was responsible for DNA extraction and genotyping; PL, NAE, H-HSC, and ETJ: designed the research; KB and ETJ: have primary responsibility for the final content; and all authors: read and approved the final manuscript.
Notes
The research leading to these results received funding from The National Cancer Institute (NCI) Cancer Center (support grant P30 CA023074; NIH/NCI R01CA151708 to ETJ; and NIH/NCI P01 CA041108 and NIH/NCI R01CA151708 to PL).
Author disclosures: KB, MJT, YC, LNK, PL, NAE, MCC, H-HSC, C-HH, and ETJ, no conflicts of interest.
Supplemental Tables 1 and 2 and Supplemental Figures 1−3 are available from the “Supplementary data” link in the online posting of the article and from the same link in the online table of contents at https://academic.oup.com/jn/.
Abbreviations used: BHMT, betaine-homocysteine S-methyltransferase; CBS, cystathionine beta-synthase; DMGDH, dimethylglycine dehydrogenase; GPX, glutathione peroxidase; GWAS, genome-wide association study; HOMER1, homer scaffold protein 1; HWE, Hardy-Weinberg Equilibrium; IPO11, importin 11; IRB, Institutional Review Board; MAF, minor allele frequency; PC, principal component; PITPNC1, phosphatidylinositol transfer protein cytoplasmic 1; QC, quality control; Se, selenium; SELENOP, selenoprotein P; SeMet, selenomethionine; SNP, single nucleotide polymorphism; TXNRD, thioredoxin reductase; WHR, waist-hip ratio.
Contributor Information
Ken Batai, Department of Urology, University of Arizona, Tucson, AZ, USA.
Mario J Trejo, Department of Epidemiology and Biostatistics, University of Arizona, Tucson, AZ, USA.
Yuliang Chen, Department of Epidemiology and Biostatistics, University of Arizona, Tucson, AZ, USA.
Lindsay N Kohler, Department of Health Promotion Science, University of Arizona, Tucson, AZ, USA.
Peter Lance, University of Arizona Cancer Center, Tucson, AZ, USA; Department of Cellular and Molecular Medicine, University of Arizona, Tucson, AZ, USA.
Nathan A Ellis, Department of Cellular and Molecular Medicine, University of Arizona, Tucson, AZ, USA.
Marilyn C Cornelis, Department of Preventive Medicine, Northwestern University, Chicago, IL, USA.
H-H Sherry Chow, University of Arizona Cancer Center, Tucson, AZ, USA; Department of Medicine, College of Medicine, University of Arizona, Tucson, AZ, USA.
Chiu-Hsieh Hsu, Department of Epidemiology and Biostatistics, University of Arizona, Tucson, AZ, USA.
Elizabeth T Jacobs, Department of Epidemiology and Biostatistics, University of Arizona, Tucson, AZ, USA; University of Arizona Cancer Center, Tucson, AZ, USA.
Data Availability
The data described in the manuscript is availabe through dbGaP (accession number phs002283.v1.p1).
References
- 1. Clark LC, Combs GF Jr, Turnbull BW, Slate EH, Chalker DK, Chow J, Davis LS, Glover RA, Graham GF, Gross EGet al. Effects of selenium supplementation for cancer prevention in patients with carcinoma of the skin: a randomized controlled trial. JAMA. 1996;276:1957–63.. doi:10.1001/jama.1996.03540240035027. [PubMed] [Google Scholar]
- 2. Marshall JR, Sakr W, Wood D, Berry D, Tangen C, Parker F, Thompson I, Lippman SM, Lieberman R, Alberts Det al. Design and progress of a trial of selenium to prevent prostate cancer among men with high-grade prostatic intraepithelial neoplasia. Cancer Epidemiol Biomarkers Prev. 2006;15:1479–84.. doi:10.1158/1055-9965.Epi-05-0585. [DOI] [PubMed] [Google Scholar]
- 3. Lippman SM, Klein EA, Goodman PJ, Lucia MS, Thompson IM, Ford LG, Parnes HL, Minasian LM, Gaziano JM, Hartline JAet al. Effect of selenium and vitamin E on risk of prostate cancer and other cancers: The Selenium and Vitamin E Cancer Prevention Trial (SELECT). JAMA. 2009;301:39–51.. doi:10.1001/jama.2008.864. [DOI] [PMC free article] [PubMed] [Google Scholar]
- 4. Thompson PA, Ashbeck EL, Roe DJ, Fales L, Buckmeier J, Wang F, Bhattacharyya A, Hsu C-H, Chow HHS, Ahnen DJet al. Selenium supplementation for prevention of colorectal adenomas and risk of associated type 2 diabetes. J Natl Cancer Inst. 2016;108:djw152. doi:10.1093/jnci/djw152. [DOI] [PMC free article] [PubMed] [Google Scholar]
- 5. Mayne ST, Ferrucci LM, Cartmel B. Lessons learned from randomized clinical trials of micronutrient supplementation for cancer prevention. Annu Rev Nutr. 2012;32:369–90.. doi:10.1146/annurev-nutr-071811-150659. [DOI] [PubMed] [Google Scholar]
- 6. Martínez ME, Jacobs ET, Baron JA, Marshall JR, Byers T. Dietary supplements and cancer prevention: Balancing potential benefits against proven harms. J Natl Cancer Inst. 2012;104:732–9.. doi:10.1093/jnci/djs195. [DOI] [PMC free article] [PubMed] [Google Scholar]
- 7. Gong J, Hsu L, Harrison T, King IB, Sturup S, Song X, Duggan D, Liu Y, Hutter C, Chanock SJet al. Genome-wide association study of serum selenium concentrations. Nutrients. 2013;5:1706–18.. doi:10.3390/nu5051706. [DOI] [PMC free article] [PubMed] [Google Scholar]
- 8. Evans DM, Zhu G, Dy V, Heath AC, Madden PA, Kemp JP, McMahon G, St Pourcain B, Timpson NJ, Golding Jet al. Genome-wide association study identifies loci affecting blood copper, selenium and zinc. Hum Mol Genet. 2013;22:3998–4006.. doi:10.1093/hmg/ddt239. [DOI] [PMC free article] [PubMed] [Google Scholar]
- 9. Cornelis MC, Fornage M, Foy M, Xun P, Gladyshev VN, Morris S, Chasman DI, Hu FB, Rimm EB, Kraft Pet al. Genome-wide association study of selenium concentrations. Hum Mol Genet. 2015;24:1469–77.. doi:10.1093/hmg/ddu546. [DOI] [PMC free article] [PubMed] [Google Scholar]
- 10. Thompson P, Roe DJ, Fales L, Buckmeier J, Wang F, Hamilton SR, Bhattacharyya A, Green S, Hsu C-H, Chow HHSet al. Design and baseline characteristics of participants in a phase III randomized trial of celecoxib and selenium for colorectal adenoma prevention. Cancer Prev Res. 2012;5:1381–93.. doi:10.1158/1940-6207.CAPR-12-0204. [DOI] [PMC free article] [PubMed] [Google Scholar]
- 11. Das S, Forer L, Schonherr S, Sidore C, Locke AE, Kwong A, Vrieze SI, Chew EY, Levy S, McGue Met al. Next-generation genotype imputation service and methods. Nat Genet. 2016;48:1284–7.. doi:10.1038/ng.3656. [DOI] [PMC free article] [PubMed] [Google Scholar]
- 12. Loh P-R, Danecek P, Palamara PF, Fuchsberger C, Reshef Y, Finucane H, Schoenherr S, Forer L, McCarthy S, Abecasis GRet al. Reference-based phasing using the Haplotype Reference Consortium panel. Nat Genet. 2016;48:1443–8.. doi:10.1038/ng.3679. [DOI] [PMC free article] [PubMed] [Google Scholar]
- 13. McCarthy S, Das S, Kretzschmar W, Delaneau O, Wood AR, Teumer A, Kang HM, Fuchsberger C, Danecek P, Sharp Ket al. A reference panel of 64,976 haplotypes for genotype imputation. Nat Genet. 2016;48:1279–83.. doi:10.1038/ng.3643. [DOI] [PMC free article] [PubMed] [Google Scholar]
- 14. Chang CC, Chow CC, Tellier LC, Vattikuti S, Purcell SM, Lee JJ. Second-generation PLINK: rising to the challenge of larger and richer datasets. GigaSci. 2015;4:7 doi:10.1186/s13742-015-0047-8. [DOI] [PMC free article] [PubMed] [Google Scholar]
- 15. Evans DM, Zhu G, Dy V, Heath AC, Madden PAF, Kemp JP, McMahon G, St Pourcain B, Timpson NJ, Golding Jet al. Genome-wide association study identifies loci affecting blood copper, selenium and zinc. Hum Mol Genet. 2013;22:3998–4006.. doi:10.1093/hmg/ddt239. [DOI] [PMC free article] [PubMed] [Google Scholar]
- 16. Gong J, Hsu L, Harrison T, King IB, Stürup S, Song X, Duggan D, Liu Y, Hutter C, Chanock SJet al. Genome-wide association study of serum selenium concentrations. Nutrients. 2013;5:1706–18.. doi:10.3390/nu5051706. [DOI] [PMC free article] [PubMed] [Google Scholar]
- 17. Mao J, Vanderlelie JJ, Perkins AV, Redman CWG, Ahmadi KR, Rayman MP. Genetic polymorphisms that affect selenium status and response to selenium supplementation in United Kingdom pregnant women. Am J Clin Nutr. 2016;103:100–6.. doi:10.3945/ajcn.115.114231. [DOI] [PMC free article] [PubMed] [Google Scholar]
- 18. Combs GF, Jackson MI, Watts JC, Johnson LK, Zeng H, Idso J, Schomburg L, Hoeg A, Hoefig CS, Chiang ECet al. Differential responses to selenomethionine supplementation by sex and genotype in healthy adults. Br J Nutr. 2012;107:1514–25.. doi:10.1017/S0007114511004715. [DOI] [PubMed] [Google Scholar]
- 19. Davis CD, Tsuji PA, Milner JA. Selenoproteins and cancer prevention. Annu Rev Nutr. 2012;32:73–95.. doi:10.1146/annurev-nutr-071811-150740. [DOI] [PubMed] [Google Scholar]
- 20. Gladyshev VN, Arnér ES, Berry MJ, Brigelius-Flohé R, Bruford EA, Burk RF, Carlson BA, Castellano S, Chavatte L, Conrad Met al. Selenoprotein gene nomenclature. J Biol Chem. 2016;291:24036–40.. doi:10.1074/jbc.M116.756155. [DOI] [PMC free article] [PubMed] [Google Scholar]
- 21. Fry AM, O'Regan L, Sabir SR, Bayliss R. Cell cycle regulation by the NEK family of protein kinases. J Cell Sci. 2012;125:4423–33.. doi:10.1242/jcs.111195. [DOI] [PMC free article] [PubMed] [Google Scholar]
- 22. Capra M, Nuciforo PG, Confalonieri S, Quarto M, Bianchi M, Nebuloni M, Boldorini R, Pallotti F, Viale G, Gishizky MLet al. Frequent alterations in the expression of serine/threonine kinases in human cancers. Cancer Res. 2006;66:8147–54.. doi:10.1158/0008-5472.Can-05-3489. [DOI] [PubMed] [Google Scholar]
- 23. Liu Y, Zhao H, Zhang Q, Tang J, Li K, Xia XJ, Wang KN, Li K, Lei XG. Prolonged dietary selenium deficiency or excess does not globally affect selenoprotein gene expression and/or protein production in various tissues of pigs. J Nutr. 2012;142:1410–6.. doi:10.3945/jn.112.159020. [DOI] [PMC free article] [PubMed] [Google Scholar]
- 24. Selhub J Homocysteine metabolism. Annu Rev Nutr. 1999;19:217–46.. doi:10.1146/annurev.nutr.19.1.217. [DOI] [PubMed] [Google Scholar]
- 25. Rhee EP, Ho JE, Chen M-H, Shen D, Cheng S, Larson MG, Ghorbani A, Shi X, Helenius IT, O'Donnell CJet al. A genome-wide association study of the human metabolome in a community-based cohort. Cell Metab. 2013;18:130–43.. doi:10.1016/j.cmet.2013.06.013. [DOI] [PMC free article] [PubMed] [Google Scholar]
- 26. Magnusson M, Wang TJ, Clish C, Engström G, Nilsson P, Gerszten RE, Melander O. Dimethylglycine deficiency and the development of diabetes. Diabetes. 2015;64:3010–6.. doi:10.2337/db14-1863. [DOI] [PMC free article] [PubMed] [Google Scholar]
- 27. Demirkan A, Henneman P, Verhoeven A, Dharuri H, Amin N, van Klinken JB, Karssen LC, de Vries B, Meissner A, Göraler Set al. Insight in genome-wide association of metabolite quantitative traits by exome sequence analyses. PLOS Genet. 2015;11:e1004835–e.. doi:10.1371/journal.pgen.1004835. [DOI] [PMC free article] [PubMed] [Google Scholar]
- 28. Raffler J, Friedrich N, Arnold M, Kacprowski T, Rueedi R, Altmaier E, Bergmann S, Budde K, Gieger C, Homuth Get al. Genome-wide association study with targeted and non-targeted NMR metabolomics identifies 15 novel loci of urinary human metabolic individuality. PLoS Genet. 2015;11:e1005487 doi:10.1371/journal.pgen.1005487. [DOI] [PMC free article] [PubMed] [Google Scholar]
- 29. Xie W, Wood AR, Lyssenko V, Weedon MN, Knowles JW, Alkayyali S, Assimes TL, Quertermous T, Abbasi F, Paananen Jet al. Genetic variants associated with glycine metabolism and their role in insulin sensitivity and type 2 diabetes. Diabetes. 2013;62:2141–50.. doi:10.2337/db12-0876. [DOI] [PMC free article] [PubMed] [Google Scholar]
- 30. Shin S-Y, Fauman EB, Petersen A-K, Krumsiek J, Santos R, Huang J, Arnold M, Erte I, Forgetta V, Yang T-Pet al. An atlas of genetic influences on human blood metabolites. Nat Genet. 2014;46:543–50.. doi:10.1038/ng.2982. [DOI] [PMC free article] [PubMed] [Google Scholar]
- 31. Feng Q, Kalari K, Fridley BL, Jenkins G, Ji Y, Abo R, Hebbring S, Zhang J, Nye MD, Leeder JSet al. Betaine-homocysteine methyltransferase: Human liver genotype-phenotype correlation. Mol Genet Metab. 2011;102:126–33.. doi:10.1016/j.ymgme.2010.10.010. [DOI] [PMC free article] [PubMed] [Google Scholar]
- 32. Rayman MP Selenium and human health. Lancet North Am Ed. 2012;379:1256–68.. doi:10.1016/s0140-6736(11)61452-9. [DOI] [PubMed] [Google Scholar]
- 33. Constantinescu-Aruxandei D, Frîncu RM, Capră L, Oancea F. Selenium analysis and speciation in dietary supplements based on next-generation selenium ingredients. Nutrients. 2018;10:1466 doi:10.3390/nu10101466.10 [DOI] [PMC free article] [PubMed] [Google Scholar]
- 34. Burk RF, Norsworthy BK, Hill KE, Motley AK, Byrne DW. Effects of chemical form of selenium on plasma biomarkers in a high-dose human supplementation trial. Cancer Epidemiol Biomarkers Prev. 2006;15:804–10.. doi:10.1158/1055-9965.Epi-05-0950. [DOI] [PubMed] [Google Scholar]
- 35. Karunasinghe N, Han DY, Zhu S, Duan H, Ko YJ, Yu JF, Triggs CM, Ferguson LR. Effects of supplementation with selenium, as selenized yeast, in a healthy male population from New Zealand. Nutr Cancer. 2013;65:355–66.. doi:10.1080/01635581.2013.760743. [DOI] [PubMed] [Google Scholar]
- 36. Bekaert B, Cooper ML, Green FR, McNulty H, Pentieva K, Scott JM, Molloy AM, Rayman MP. Effect of selenium status and supplementation with high-selenium yeast on plasma homocysteine and B vitamin concentrations in the UK elderly. Mol Nutr Food Res. 2008;52:1324–33.. doi:10.1002/mnfr.200700353. [DOI] [PubMed] [Google Scholar]
- 37. González S, Huerta JM, Álvarez-Uría J, Fernández S, Patterson AM, Lasheras C. Serum selenium is associated with plasma homocysteine concentrations in elderly humans. J Nutr. 2004;134:1736–40.. doi:10.1093/jn/134.7.1736. [DOI] [PubMed] [Google Scholar]
- 38. Venn BJ, Grant AM, Thomson CD, Green TJ. Selenium supplements do not increase plasma total homocysteine concentrations in men and women. J Nutr. 2003;133:418–20.. doi:10.1093/jn/133.2.418. [DOI] [PubMed] [Google Scholar]
- 39. Uthus EO, Yokoi K, Davis CD. Selenium deficiency in Fisher-344 rats decreases plasma and tissue homocysteine concentrations and alters plasma homocysteine and cysteine redox status. J Nutr. 2002;132:1122–8.. doi:10.1093/jn/132.6.1122. [DOI] [PubMed] [Google Scholar]
- 40. Uthus EO, Ross SA. Dietary selenium affects homocysteine metabolism differently in Fisher-344 rats and CD-1 mice. J Nutr. 2007;137:1132–6.. doi:10.1093/jn/137.5.1132. [DOI] [PubMed] [Google Scholar]
- 41. Schalinske KL, Smazal AL. Homocysteine imbalance: A pathological metabolic marker. Adv Nutr. 2012;3:755–62.. doi:10.3945/an.112.002758. [DOI] [PMC free article] [PubMed] [Google Scholar]
- 42. Kumar A, Palfrey HA, Pathak R, Kadowitz PJ, Gettys TW, Murthy SN. The metabolism and significance of homocysteine in nutrition and health. Nutr Metab (Lond). 2017;14:78 doi:10.1186/s12986-017-0233-z. [DOI] [PMC free article] [PubMed] [Google Scholar]
Associated Data
This section collects any data citations, data availability statements, or supplementary materials included in this article.
Supplementary Materials
Data Availability Statement
The data described in the manuscript is availabe through dbGaP (accession number phs002283.v1.p1).