

ABSTRACT
Strongyloides stercoralis is a neglected soil-transmitted helminth affects approximately 100-370 million people globally. The life cycle is unusual as only larvae can be found in stool specimens. Thecurrent review and meta-analysis represented the distribution of strongyloidiasis in general population of the world based on published papers. Five English databases (Science Direct, Scopus, PubMed, Web of Science, and Google Scholar(were explored for literature published before October 2019.Altogether 235 studies (862243 participants) was eligible. Regarding diagnostic method, the overall prevalence for studies performed microscopic, culture, immunological and molecular method was 1.47% (95% CI = 1.56%), 10.08% (95% CI = 8.99% - 11.16%), 23.88% (95% CI = 20.82% - 26.94%) and 9.3% (95% CI = 7.2% - 11.3%), respectively. Based on microscopic methods, the highest prevalence was related to the Western Pacific region [9.47% (95% CI = 8.55% - 10.39%)]. According to the culture method, Western Pacific region [21.36% (95% CI = 16.32% - 26.39%)] had the highest estimated pooled prevalence. In immunological studies, Eastern Mediterranean Region [40.72% (95% CI = 36.74% - 44.70%)] had the highest seroprevalence.Also in molecular surveys, the highest prevalence was related to the African region [19.72% (95% CI = 16.71% - 22.73%)]. The current study indicated that strongyloidiasis is still considered a health problem in many parts of the world. Thus a comprehensive control program and improvement of public health sectors are required.
KEYWORDS: Prevalence, strongyloides stercoralis, Worldwide, Soil transmitted helminths (STHs), General population, Neglected tropical disease (NTD)
Introduction
Soil-transmitted helminths (STHs) are a major health problem in tropical and subtropical regions. According to the World Health Organization (WHO) reports, almost 1.5 billion people are exposed to these parasites [1]. The most important STHs are Ascaris lumbricoides, hookworms, and Trichuris trichiura [2]. Strongyloides stercoralis is a STH which affects approximately 100–370 million people around the world and is considered as a cause of the neglected tropical disease (NTD) [3,4]. Strongyloidiasis symptoms are often mild to severe diarrhea in immunocompetent persons and it is accompanied by eosinophilia in 60% of the cases [5]. In heavy infections due to the high burden of parasites, it leads to hyperinfection syndrome with different signs such as serpiginous urticarial rash, Loeffler’s syndrome, and gastrointestinal complications (2% of the cases especially in immunocompromised patients), as well as corticosteroid consumers, diabetes mellitus, alcoholism, and chronic renal failure [6–8]. During hyperinfection, some intestinal commensal bacteria increase the severity of the syndrome up to 60% [9]. Disseminated strongyloidiasis often happens after hyperinfection syndrome in immunodeficient persons, such as Human T lymphotropic virus type 1 (HTLV-1) positive patients. In malignant cases, it becomes ectopic in various parts of the body such as lymph nodes, central nervous system, pancreas, kidneys, ovaries, and skeletal muscles. In ectopic infection, the mortality rate is 100% without treatment [10–13]. The life cycle of S. stercoralis is unusual as rhabditiform larvae can be found in stool specimens. In direct development, first-stage larvae (rhabditiform) develop to the infective stage larvae (filariform) in soil. In the free-living cycle, after mating, females produce eggs from which first-stage larvae (rhabditiform) hatch and change to the infective stage larvae (filariform) after two molts [14,15]. The diagnostic tests consist of fecal-based or alternative methods such as immunological and molecular techniques. Most of the cases of strongyloidiasis are asymptomatic and under-diagnosed and the microscopic diagnostic methods have low sensitivity (in the case of chronic infection with low numbers of larvae). Some of them, such as Baermann or Agar plate culture (APC), are time-consuming. Immunological methods are helpful especially for seroepidemiological research or diagnosis of specific individual records [16]. The first line of treatment in S. stercoralis is ivermectin, which is more effective than other drugs [17]. Regarding the distribution of this parasitic infection and according to the reports worldwide, the present review and meta-analysis aim to determine the prevalence of this infection in the general population across the world.
Materials and methods
Search strategy
Five databases in English (Science Direct, Scopus, PubMed, Web of Science, and Google Scholar) were explored for articles with regard to the prevalence of S. stercoralis in the global general population without time limitation before October 2019. The search terms were ‘Prevalence,’ ‘Strongyloides stercoralis,’ Strongyloidiasis,’ ‘Human,’ ‘General population,’ ‘Soil-transmitted helminths,’ ‘Intestinal parasites,’ and ‘Worldwide’ alone or in combination using OR and AND operators.
Exclusion and inclusion criteria
A comprehensive systematic search was conducted and two independent reviewers evaluated the papers and separate eligible articles according to their titles and abstracts. Those studies that met the following inclusion criteria were selected: (a) studies estimated the prevalence of strongyloidiasis in the general population of the world, and (b) peer-reviewed original observational articles with cross-sectional, cohort, prospective, and retrospective design. The exclusion criteria include: (a) review or systematic reviews, case series, case report, letter to editor, fact sheet, opinion, preprint, and (b) studies without full-text accessibility. In order to prevent missing data, all references of full-text-published literature were checked precisely. We used discussion and consensus to resolve any disagreements. For each included paper, two authors extracted the following specified variables in an excel spreadsheet: year of publication, study area (country and related continent), WHO regions (Western Pacific region, Eastern Mediterranean region, South-East Asia region, African region, Region of the Americas and the European region), latitude and longitude, Human Development Index (HDI), Gini index, study design (cross-sectional), sample type (feces or serum), patients group (hospital patients, refugees, and immigrants), patient position (rural or urban), educational level, number of examined individuals, diagnostic technique (microscopic, culture, immunological, molecular), and number of infected individuals. The PRISMA protocol (Preferred reporting items for systematic reviews and meta-analysis) was used to report the data.
The level of HDI for each country was obtained from the United Nations Development Program (UNDP) [18]. The Gini index was taken from the World Bank Data with the purpose of measuring of the distribution of income in a population [19].
Statistical approach and meta-analyses
The prevalence and the 95% confidence intervals (CI) of strongyloidiasis were estimated for all of the eligible studies using random effects model for each method. Also, data adjusted by Freeman-Tukey double arcsine transformation and Clopper-Pearson method was used to estimate their 95% CIs [20]. The meta-analysis provided a forest plot representing the pooled prevalence and related 95% CIs of each study along with summary measures. Cochran’s Q and I2 statistics (I2 values of 25%, 50%, and 75% were regarded as low, moderate and high heterogeneity, accordingly) were used to evaluate the heterogeneity. Meta-regression was used to examine the association between publication year of studies, sample size, HDI, Gini, latitude and longitude of studies with the prevalence of each method. Sensitivity analysis was applied to assess the impact of each study on the overall prevalence for each method. Additionally, the funnel plot based on Egger’s regression asymmetry test was used to investigate small study effects and publication bias. All analyses were performed using Stata software version 14. Also, the significance level was considered 0.05 for all analyses.
Results
In total 35,652 records were identified in our systematic search, 1238 studies were assessed for eligibility and finally, 235 of them (862,243 individuals) were included in the meta-analysis (Figure 1). We showed the searched literature, as well as the characteristics of all included studies, regarding the global prevalence of S. stercoralis in Table 1. The weighted prevalence rate for microscopic, culture, immunological, and molecular was 1.47% (95% CI = 1.38%–1.56%), 10.08 (95% CI = 8.99%–11.16%), 23.88% (95% CI = 20.82%–26.94%) and 9.3% (95% CI = 7.2%–11.3%), respectively (Figures 2 and 3). In total, 60 of 195 countries had documented human strongyloidiasis. The largest number of studies was done in Thailand (25 studies). Bar graph was designed to show the distribution of countries for all eligible studies in this systematic review and meta-analysis (Supplementary Fig. 1).
Figure 1.
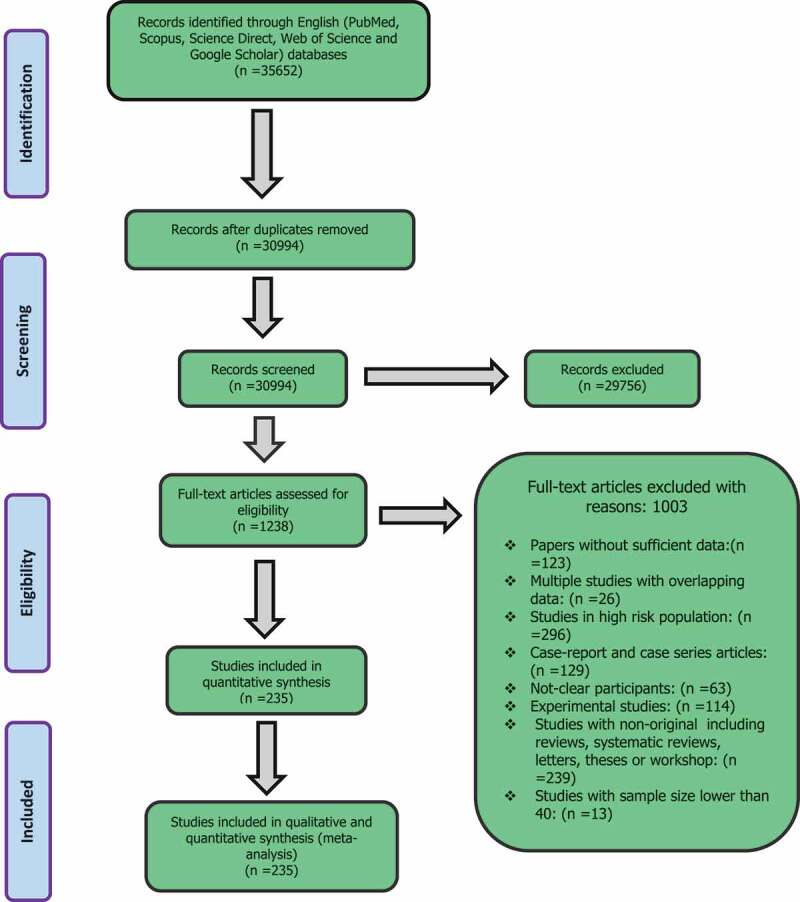
Flow diagram of the study design process
Table 1.
Main characteristics of the eligible studied reporting the prevalence of strongyloidiasis
| No. | First author | Public year | Country | WHO regions | Continent | Total sample | Positive |
|---|---|---|---|---|---|---|---|
| 1 | F. Lorincz | 1930 | Hungary | European region | Europe | 1567 | 9 |
| 2 | I.Hakki | 1931 | Turkey | European region | Europe | 800 | 20 |
| 3 | K. Deneche | 1954 | Iraq | Eastern Mediterranean | Asia | 800 | 59 |
| 4 | G.R. Winsberg | 1975 | United states | Region of the americas | North America | 358 | 6 |
| 5 | W. Jelitowy | 1976 | Poland | European region | Europe | 9300 | 35 |
| 6 | F. Arfaa | 1977 | Iran | Eastern Mediterranean | Asia | 1240 | 5 |
| 7 | N.D. Kuliev | 1979 | Azerbaijan | European region | Europe | 3484 | 143 |
| 8 | E.M. Proctor | 1985 | Canada | Region of the americas | North America | 694 | 4 |
| 9 | W. Alakija | 1986 | Nigeria | African region | Africa | 1166 | 7 |
| 10 | H. Carstensen | 1987 | Guinea-Bissau | African region | Africa | 270 | 15 |
| 11 | I. Ilard | 1987 | Somali | African region | Africa | 237 | 23 |
| 12 | R.W. Douce | 1987 | Thailand | South – east Asian region | Asia | 206 | 18 |
| 13 | T. Arakaki | 1988 | Japan | South – east Asian region | Asia | 1017 | 46 |
| 14 | R.M. Genta | 1988 | Italy | European region | Europe | 4203 | 118 |
| 15 | C.V. Holland | 1989 | Nigeria | African region | Africa | 766 | 23 |
| 16 | Y. Sato | 1990 | Japan | South – east Asian region | Asia | 2906 | 577 |
| 17 | T.W. Gyorkos | 1990 | Canada | Region of the americas | North America | 232 | 150 |
| 18 | Pitisuttithum | 1990 | Thailand | South – east Asian region | Asia | 189 | 18 |
| 19 | Egger | 1990 | Thailand | South – east Asian region | Asia | 343 | 87 |
| 20 | Koga | 1991 | Thailand | South – east Asian region | Asia | 137 | 31 |
| 21 | Boyajian | 1992 | Thailand | South – east Asian region | Asia | 958 | 9 |
| 22 | J.F. Lindo | 1994 | Jamaica | Region of the americas | South America | 244 | 59 |
| 23 | J.F. Lindo | 1994 | Jamaica | Region of the americas | South America | 244 | 9 |
| 24 | A. Hall | 1994 | Bangladesh | South – east Asian region | Asia | 880 | 102 |
| 25 | J. Kobayashi | 1995 | Brazil | Region of the americas | South America | 222 | 23 |
| 26 | M.J. Bangs | 1996 | Indonesia | South – east Asian region | Asia | 478 | 4 |
| 27 | T. Joyce | 1996 | Kenya | African region | Africa | 70 | 3 |
| 28 | M. Rezaeian | 1996 | Iran | Eastern Mediterranean | Asia | 2368 | 244 |
| 29 | G. Dreyer | 1996 | Brazil | Region of the americas | South America | 972 | 311 |
| 30 | C.E. Borda | 1996 | Argentina | Region of the americas | South America | 207 | 4 |
| 31 | T. Wodimagegnehu | 1997 | Ethiopia | African region | Africa | 1787 | 3 |
| 32 | G. Kang | 1998 | India | South – east Asian region | Asia | 78 | 12 |
| 33 | E.R. Machado | 1998 | Brazil | Region of the americas | South America | 300 | 23 |
| 34 | S. Jongwutiwes | 1999 | Thailand | South – east Asian region | Asia | 1085 | 241 |
| 35 | F.A. Núñez | 1999 | Cuba | Region of the americas | South America | 401 | 1 |
| 36 | A.K. Mohammed | 1999 | Iraq | Eastern Mediterranean | Asia | 1681 | 25 |
| 37 | C.C. Appleton | 1999 | South Africa | African region | Africa | 1561 | 71 |
| 38 | Toma | 1999 | Indonesia | South – east Asian region | Asia | 654 | 7 |
| 39 | Widjana | 2000 | Indonesia | South – east Asian region | Asia | 2394 | 39 |
| 40 | Anantaphruti | 2000 | Thailand | South – east Asian region | Asia | 945 | 14 |
| 41 | A. Farahnak | 2001 | Iran | Eastern Mediterranean | Asia | 984 | 68 |
| 42 | A.K. Shrestha | 2001 | Nepal | South – east Asian region | Asia | 341 | 1 |
| 43 | Y.A. Raja’a | 2001 | Yemen | African region | Africa | 897 | 2 |
| 44 | P.R. Sanchez | 2001 | Spain | European region | Europe | 16,607 | 152 |
| 45 | A. Al-Hindi | 2002 | Palestine | Eastern Mediterranean | Asia | 650 | 4 |
| 46 | J. Waikagul | 2002 | Thailand | South – east Asian region | Asia | 2171 | 9 |
| 47 | O.A. Adeyeba | 2002 | Nigeria | African region | Africa | 248 | 1 |
| 48 | S.de Silva | 2002 | Australia | Western Pacific Region | Australia | 95 | 22 |
| 49 | S. Nuchprayoon | 2002 | Thailand | South – east Asian region | Asia | 6231 | 186 |
| 50 | W. Saksirisampant | 2002 | Thailand | South – east Asian region | Asia | 2213 | 26 |
| 51 | Sithithaworn | 2003 | Thailand | South – east Asian region | Asia | 332 | 41 |
| 52 | Sithithaworn | 2003 | Thailand | South – east Asian region | Asia | 332 | 40 |
| 53 | W. Saksirisampant | 2003 | Thailand | South – east Asian region | Asia | 106 | 1 |
| 54 | N. Tang | 2003 | China | Western Pacific region | Asia | 2558 | 1 |
| 55 | P. Jongsuksuntigul | 2003 | Thailand | South – east Asian region | Asia | 1233 | 290 |
| 56 | N.J. Taranto | 2003 | Argentina | Region of the americas | South America | 95 | 48 |
| 57 | S.A. Miller | 2003 | Venezuela | Region of the americas | South America | 45 | 1 |
| 58 | P.R. Sanchez | 2003 | Spain | European region | Europe | 250 | 31 |
| 59 | F.B. Morrone | 2004 | Brazil | Region of the americas | South America | 96 | 3 |
| 60 | B.R. Saab | 2004 | Lebanon | Eastern Mediterranean | Asia | 2634 | 2 |
| 61 | J.C. Anosike | 2004 | Nigeria | African region | Africa | 231 | 4 |
| 62 | K. Koga-Kita | 2004 | Cambodia | South – east Asian region | Asia | 3574 | 521 |
| 63 | P.K. Garg | 2005 | United states | Region of the americas | North America | 534 | 7 |
| 64 | T.S. Chandrashekhar | 2005 | Nepal | South – east Asian region | Asia | 2091 | 2 |
| 65 | T.R. Ghimire | 2005 | Nepal | South – east Asian region | Asia | 400 | 10 |
| 66 | R. Yaicharoen | 2005 | Thailand | South – east Asian region | Asia | 2230 | 2 |
| 67 | N. Wongjindanon | 2005 | Thailand | South – east Asian region | Asia | 4014 | 20 |
| 68 | L. Yelifaria | 2005 | Ghana | African region | Africa | 20,250 | 2146 |
| 69 | K.E. Mote | 2005 | Uganda | African region | Africa | 94 | 23 |
| 70 | T. Chhakda | 2006 | Cambodia | Western Pacific region | Asia | 188 | 38 |
| 71 | P. Sithithaworn | 2006 | Laos | Western Pacific region | Asia | 434 | 47 |
| 72 | S.R.Caruana | 2006 | Australia | Western Pacific Region | Australia | 204 | 10 |
| 73 | J.C. Anosike | 2006 | Nigeria | African region | Africa | 700 | 52 |
| 74 | S.R. Caruana | 2006 | Australia | Western Pacific Region | Australia | 230 | 97 |
| 75 | S. Peruzzi | 2006 | Italy | European region | Europe | 1117 | 3 |
| 76 | M. Pirisi | 2006 | Italy | European region | Europe | 100 | 28 |
| 77 | S. L. Choubisa | 2006 | India | South – east Asian region | Asia | 870 | 19 |
| 78 | P.P. Yori | 2006 | Peru | Region of the americas | South America | 792 | 69 |
| 79 | P.P. Yori | 2006 | Peru | Region of the americas | South America | 492 | 44 |
| 80 | A.J. Rodr´guez-Morales | 2006 | Venezuela | Region of the americas | South America | 1038 | 25 |
| 81 | P.K. Patel | 2006 | Oman | Eastern Mediterranean | Asia | 436 | 2 |
| 82 | M.H. Wakid | 2006 | SaudiArabia | Eastern Mediterranean | Asia | 1009 | 19 |
| 83 | B.F. Alzain | 2006 | Palestine | Eastern Mediterranean | Asia | 1600 | 90 |
| 84 | D.L. Posey | 2007 | United states | Region of the americas | North America | 562 | 237 |
| 85 | M.R. Nilforoushan | 2007 | Iran | Eastern Mediterranean | Asia | 1500 | 50 |
| 86 | E.B. Kia | 2007 | Iran | Eastern Mediterranean | Asia | 900 | 59 |
| 87 | F.H. Abu-Elamreen | 2007 | Palestine | Eastern Mediterranean | Asia | 150 | 1 |
| 88 | D.L. Posey | 2007 | Sudan | Eastern Mediterranean | Africa | 462 | 213 |
| 89 | D. L. Posey | 2007 | Somali | Eastern Mediterranean | Africa | 100 | 23 |
| 90 | E.R. Machado | 2007 | Brazil | Region of the americas | South America | 92 | 17 |
| 91 | K.H. Jacobsen | 2007 | Equador | Region of the americas | South America | 293 | 2 |
| 92 | T. Hirata | 2007 | Japan | South – east Asian region | Asia | 2406 | 112 |
| 93 | G.T.A. Jombo | 2007 | Nigeria | African region | Africa | 150 | 1 |
| 94 | O.M. Agbolade | 2007 | Nigeria | African region | Africa | 1059 | 7 |
| 95 | P. Steinmann | 2007 | China | Western Pacific region | Asia | 180 | 22 |
| 96 | P. Steinmann | 2007 | China | Western Pacific region | Asia | 180 | 40 |
| 97 | A. Tungtrongchitr | 2007 | Thailand | South – east Asian region | Asia | 479 | 10 |
| 98 | S. Kitvatanachai | 2008 | Thailand | South – east Asian region | Asia | 214 | 13 |
| 99 | T.E. Erlanger | 2008 | Laos | Western Pacific region | Asia | 5107 | 71 |
| 100 | C.A. Ibidapo | 2008 | Nigeria | African region | Africa | 300 | 54 |
| 101 | S. Knopp | 2008 | Tanzania | African region | Africa | 336 | 7 |
| 102 | B.F. AL-Zain | 2008 | Palestine | Eastern Mediterranean | Asia | 256 | 5 |
| 103 | S. Rasti | 2008 | Iran | Eastern Mediterranean | Asia | 297 | 1 |
| 104 | G.R. Mowlavi | 2008 | Iran | Eastern Mediterranean | Asia | 1494 | 9 |
| 105 | B.F. Al-Zain | 2009 | Palestine | Eastern Mediterranean | Asia | 256 | 5 |
| 106 | S. Leelayoova | 2009 | Thailand | South – east Asian region | Asia | 317 | 8 |
| 107 | V. Nasiri | 2009 | Iran | Eastern Mediterranean | Asia | 13,915 | 5 |
| 108 | L. Akhlaghi | 2009 | Iran | Eastern Mediterranean | Asia | 1000 | 1 |
| 109 | M.H. Wakid | 2009 | SaudiArabia | Eastern Mediterranean | Asia | 504 | 5 |
| 110 | M.A. Babiker | 2009 | Sudan | Eastern Mediterranean | Africa | 1500 | 2 |
| 111 | S. Sayasone | 2009 | Laos | Western Pacific region | Asia | 232 | 24 |
| 112 | Z. Dabrowiecki | 2009 | Poland | European region | Europe | 426 | 29 |
| 113 | J.J. Verweij | 2009 | Ghana | African region | Africa | 212 | 45 |
| 114 | J.J. Verweij | 2009 | Ghana | African region | Africa | 212 | 22 |
| 115 | R. Houmsou | 2009 | Nigeria | African region | Africa | 1000 | 17 |
| 116 | O.A. Morenikeji | 2009 | Nigeria | African region | Africa | 123 | 7 |
| 117 | S. Foday | 2009 | Liberia | African region | Africa | 646 | 2 |
| 118 | B. Shakya | 2009 | Nepal | South – east Asian region | Asia | 2221 | 6 |
| 119 | F. Cheikhrouhou | 2009 | Tunisia | Eastern Mediterranean | Africa | 30,573 | 92 |
| 120 | N. Dash | 2010 | United Arab Emirates | Eastern Mediterranean | Asia | 10,514 | 3 |
| 121 | S.P. Sherchand | 2010 | Nepal | South – east Asian region | Asia | 187 | 3 |
| 122 | K. Ashrafi | 2010 | Iran | Eastern Mediterranean | Asia | 150 | 63 |
| 123 | S. Bdir | 2010 | Palestine | Eastern Mediterranean | Asia | 123,290 | 112 |
| 124 | A.J. Krolewiecki | 2010 | United states | Region of the americas | South America | 228 | 59 |
| 125 | A.J. Krolewiecki | 2010 | Argentina | Region of the americas | North America | 228 | 67 |
| 126 | B. Bon | 2010 | France | European region | Europe | 195 | 57 |
| 127 | D. Glinz | 2010 | Cote d’Ivoire | African region | Africa | 251 | 82 |
| 128 | C. Sarfati | 2010 | Cameroon | African region | Africa | 420 | 4 |
| 129 | F. Koksal | 2010 | Turkey | European region | Europe | 27,664 | 2 |
| 130 | A.A. Umar | 2010 | Nigeria | African region | Africa | 280 | 104 |
| 131 | J.C. Sousa-Figueiredo | 2011 | Uganda | African region | Africa | 352 | 41 |
| 132 | G.K. Singh | 2011 | Nepal | South – east Asian region | Asia | 5524 | 40 |
| 133 | Z. Dakić | 2011 | Serbia | European region | Europe | 2440 | 1 |
| 134 | M. Żukiewicz | 2011 | Poland | European region | Europe | 120 | 7 |
| 135 | L.S. Peterson | 2011 | Kenya | African region | Africa | 211 | 6 |
| 136 | E.DJ. Inês | 2011 | Brazil | Region of the americas | South America | 634 | 40 |
| 137 | H.Z. Rayan | 2011 | Egypt | Eastern Mediterranean | Africa | 115 | 81 |
| 138 | B.F. Al-zain | 2011 | Palestine | Eastern Mediterranean | Asia | 1600 | 217 |
| 139 | H. Moghaddassani | 2011 | Iran | Eastern Mediterranean | Asia | 782 | 32 |
| 140 | Z. Daki | 2011 | Serbia | European region | Europe | 2440 | 1 |
| 141 | E.DJ.Inês | 2011 | Brazil | Region of the americas | South America | 634 | 29 |
| 142 | J.R. Dib | 2012 | Argentina | Region of the americas | South America | 149 | 4 |
| 143 | J.D. Machicado | 2012 | Peru | Region of the americas | South America | 73 | 39 |
| 144 | A. Daryani | 2012 | Iran | Eastern Mediterranean | Asia | 1100 | 13 |
| 145 | H. Sadeghi | 2012 | Iran | Eastern Mediterranean | Asia | 133 | 1 |
| 146 | Y. Sultana | 2012 | Bangladesh | South – east Asian region | Asia | 1004 | 222 |
| 147 | C.E. Moore | 2012 | Cambodia | Western Pacific region | Asia | 16,372 | 429 |
| 148 | Y. Sultana | 2012 | Bangladesh | South – east Asian region | Asia | 147 | 34 |
| 149 | Y. Sultana | 2012 | Bangladesh | South – east Asian region | Asia | 147 | 90 |
| 150 | A.Vitta | 2012 | Thailand | South – east Asian region | Asia | 124 | 3 |
| 151 | S.J. Kaewpitoon | 2012 | Thailand | South – east Asian region | Asia | 333 | 16 |
| 152 | R. Canete | 2012 | Cuba | Region of the americas | South America | 104 | 1 |
| 153 | J.V. Conlan | 2012 | Laos | Western Pacific region | Asia | 1358 | 121 |
| 154 | V. Khieu | 2013 | Cambodia | Western Pacific region | Asia | 458 | 183 |
| 155 | A.F. Ahmad | 2013 | Malaysia | Western Pacific region | Asia | 54 | 17 |
| 156 | A.F. Ahmad | 2013 | Malaysia | Western Pacific region | Asia | 54 | 3 |
| 157 | C. Silvestri | 2013 | Italy | European region | Europe | 5323 | 7 |
| 158 | W. Anamnart | 2013 | Thailand | South – east Asian region | Asia | 600 | 198 |
| 159 | M. Asmar | 2013 | Iran | Eastern Mediterranean | Asia | 700 | 7 |
| 160 | H.A. Taha | 2013 | SaudiArabia | Eastern Mediterranean | Asia | 2732 | 16 |
| 161 | S. Boonjaraspinyo | 2013 | Thailand | South – east Asian region | Asia | 253 | 15 |
| 162 | W. Anamnart | 2013 | Thailand | South – east Asian region | Asia | 600 | 200 |
| 163 | S. Tandukar | 2013 | Nepal | South – east Asian region | Asia | 1392 | 3 |
| 164 | R. Shrestha | 2013 | Nepal | South – east Asian region | Asia | 495 | 9 |
| 165 | Y. Sultana | 2013 | Bangladesh | South – east Asian region | Asia | 160 | 56 |
| 166 | Schär | 2013 | Cambodia | Western Pacific region | Asia | 218 | 131 |
| 167 | N.M.S. Azira | 2013 | Malaysia | Western Pacific region | Asia | 15,155 | 12 |
| 168 | S. Davis | 2013 | United states | Region of the americas | North America | 102 | 5 |
| 169 | M.M. Naves | 2013 | Brazil | Region of the americas | South America | 200 | 10 |
| 170 | P. Naidu | 2013 | Canada | Region of the americas | North America | 350 | 16 |
| 171 | E.S. Russell | 2014 | United states | Region of the americas | North America | 378 | 7 |
| 172 | A.F. Malheiros | 2014 | Brazil | Region of the americas | South America | 542 | 24 |
| 173 | K. Ikegami | 2014 | Bolivia | Region of the americas | South America | 274 | 41 |
| 174 | E. Badparva | 2014 | Iran | Eastern Mediterranean | Asia | 2839 | 2 |
| 175 | M.TC. Fernández | 2014 | Spain | European region | Europe | 1384 | 320 |
| 176 | A.P. Santos | 2014 | Cuba | Region of the americas | South America | 300 | 2 |
| 177 | V. Khieu | 2014 | Cambodia | Western Pacific region | Asia | 2861 | 875 |
| 178 | Schär | 2014 | Cambodia | Western Pacific region | Asia | 218 | 81 |
| 179 | V. Khieu | 2014 | Cambodia | Western Pacific region | Asia | 3560 | 1700 |
| 180 | A.A. Hama | 2014 | Iraq | Eastern Mediterranean | Asia | 1028 | 2 |
| 181 | M.J.O. Rivero | 2014 | Colombia | Region of the americas | South America | 262 | 2 |
| 182 | M.J.O. Rivero | 2014 | Colombia | Region of the americas | South America | 262 | 2 |
| 183 | A.E. Abah | 2015 | Nigeria | African region | Africa | 3826 | 273 |
| 184 | H. Sadeghi | 2015 | Iran | Eastern Mediterranean | Asia | 5739 | 1 |
| 185 | M. Tork | 2015 | Iran | Eastern Mediterranean | Asia | 880 | 5 |
| 186 | M. Sharifdini | 2015 | Iran | Eastern Mediterranean | Asia | 466 | 261 |
| 187 | A.B. Rapoport | 2015 | United states | Region of the americas | North America | 189 | 11 |
| 188 | A. Asundi | 2015 | Canada | Region of the americas | North America | 570 | 176 |
| 189 | J.R. Dib | 2015 | Argentina | Region of the americas | South America | 90 | 12 |
| 190 | A. Aksoy Gökmen | 2015 | Turkey | European region | Europe | 281 | 1 |
| 191 | K. Korzeniewski | 2015 | Afghanistan | Eastern Mediterranean | Asia | 1369 | 3 |
| 192 | V. Krcmery | 2015 | Slovakia | European region | Europe | 7640 | 92 |
| 193 | S.L. Becker | 2015 | Cote d’Ivoire | African region | Africa | 256 | 76 |
| 194 | Y. Vonghachack | 2015 | Laos | Western Pacific region | Asia | 729 | 299 |
| 195 | S.J. Kaewpitoon | 2015 | Thailand | South – east Asian region | Asia | 209 | 3 |
| 196 | H.S. Supram | 2015 | Nepal | South – east Asian region | Asia | 9470 | 7 |
| 197 | K.Yadav | 2016 | Nepal | South – east Asian region | Asia | 161 | 6 |
| 198 | A. Kumar | 2016 | India | South – east Asian region | Asia | 1638 | 2 |
| 199 | S. Mohan | 2016 | India | South – east Asian region | Asia | 372 | 14 |
| 200 | J.W. Priest | 2016 | Cambodia | Western Pacific region | Asia | 2150 | 935 |
| 201 | S. Laymanivong | 2016 | Laos | Western Pacific region | Asia | 327 | 134 |
| 202 | R. Ngui | 2016 | Malaysia | Western Pacific region | Asia | 236 | 5 |
| 203 | T.Nguyen | 2016 | Vietnam | Western Pacific region | Asia | 42,920 | 3174 |
| 204 | K. Takaoka | 2016 | United Kingdom | European region | Europe | 3306 | 31 |
| 205 | D. Buonfrate | 2016 | Italy | European region | Europe | 1351 | 153 |
| 206 | A.S.R. Alsubaie | 2016 | Yemen | African region | Africa | 258 | 2 |
| 207 | R. Ngui | 2016 | Malaysia | Western Pacific region | Asia | 236 | 26 |
| 208 | H.El-din. I.El-Nemr | 2016 | SaudiArabia | Eastern Mediterranean | Asia | 160 | 1 |
| 209 | M.F. Karami | 2017 | Iran | Eastern Mediterranean | Asia | 12,155 | 7 |
| 210 | K.S. Randhir | 2017 | Nepal | South – east Asian region | Asia | 2423 | 2 |
| 211 | M. Tork | 2017 | Iran | Eastern Mediterranean | Asia | 1120 | 6 |
| 212 | R. Ghasemikhah | 2017 | Iran | Eastern Mediterranean | Asia | 1800 | 12 |
| 213 | G. Štrkolcová | 2017 | Slovakia | European region | Europe | 81 | 20 |
| 214 | M.R. de Alegra | 2017 | Angola | African region | Africa | 230 | 33 |
| 215 | I. Praharaj | 2017 | India | South – east Asian region | Asia | 257,588 | 2306 |
| 216 | C.W. Liao | 2017 | Cambodia | Western Pacific region | Asia | 308 | 1 |
| 217 | A.Forrer | 2018 | Cambodia | Western Pacific region | Asia | 2576 | 1251 |
| 218 | S. Nagpal | 2018 | India | South – east Asian region | Asia | 318 | 16 |
| 219 | E. Daca | 2018 | Angola | African region | Africa | 351 | 75 |
| 220 | Y. Paran | 2018 | Israel | European region | Europe | 106 | 1 |
| 221 | B. Monge-Maillo | 2018 | Spain | European region | Europe | 752 | 76 |
| 222 | P.V.da Silva | 2018 | Brazil | Region of the americas | South America | 196 | 13 |
| 223 | J.B. Nunes | 2018 | Brazil | Region of the americas | South America | 258 | 139 |
| 224 | R.A. Errea | 2018 | Peru | Region of the americas | South America | 124 | 13 |
| 225 | A.S. Pagheh | 2018 | Iran | Eastern Mediterranean | Asia | 4788 | 18 |
| 226 | M. Sharifdini | 2018 | Iran | Eastern Mediterranean | Asia | 155 | 21 |
| 227 | H. Kristanti | 2018 | Indonesia | South – east Asian region | Asia | 80 | 60 |
| 228 | H. Kristanti | 2018 | Indonesia | South – east Asian region | Asia | 80 | 45 |
| 229 | A. Gashout | 2019 | Libya | Eastern Mediterranean | Africa | 18,000 | 2 |
| 230 | S. Zhou | 2019 | China | Western Pacific region | Asia | 98 | 7 |
| 231 | N. Sahimin | 2019 | Malaysia | Western Pacific region | Asia | 388 | 3 |
| 232 | H.M. Al-Mekhlafi | 2019 | Malaysia | Western Pacific region | Asia | 1142 | 180 |
| 233 | H.M. Al-Mekhlafi | 2019 | Malaysia | Western Pacific region | Asia | 1142 | 157 |
| 234 | T. Menjetta | 2019 | Ethiopia | African region | Africa | 13,679 | 41 |
| 235 | N. Sahimin | 2019 | Malaysia | Western Pacific region | Asia | 483 | 236 |
Figure 2.
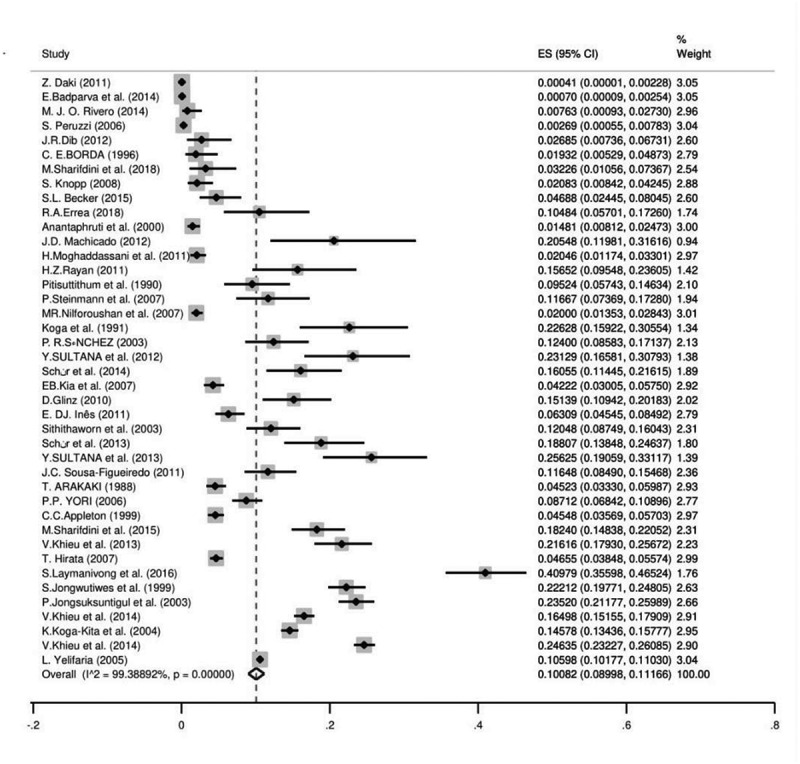
The pooled prevalence of S. stercoralis based on culture method
Figure 3.
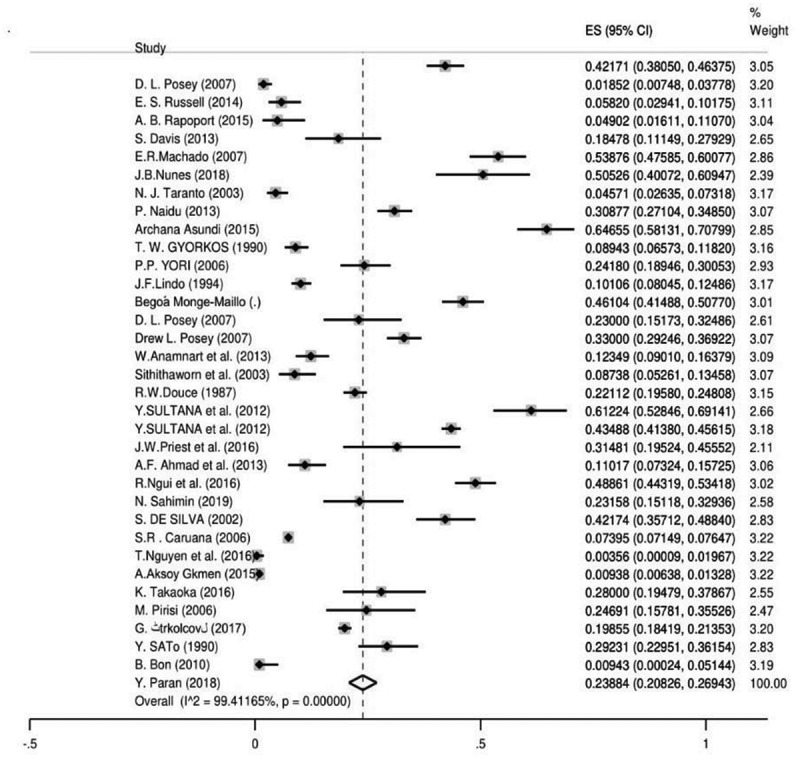
The pooled prevalence of S. stercoralis based on immunological method
Parasitology methods (microscopic and culture methods)
In the current survey, 164 records from 53 countries included data with microscopic methods (751,421 individuals). The calculated total prevalence was 1.47% (95% CI = 1.38%–1.56%). Egypt had the highest prevalence with 34.78% (95% CI = 26.14%–44.22%) followed by Peru with 32.87% (95% CI = 22.32%–44.86%), whereas the lowest was in Libya with 0.01% (95% CI = 0.001%–0.04%). According to the continent, the highest level of infection was in South America with 7.42% (95% CI = 5.28%–9.56%) and Africa with 1.60% (95% CI = 1.31%–1.89%) was the continent with the lowest prevalence. Among WHO regions, the Western Pacific region had the highest infection rate with 9.47% (95% CI = 8.55%–10.39%) while the Eastern Mediterranean region had the lowest prevalence with 0.4% (95% CI = 0.3%–0.5%). Our results showed that the majority of infected people were immigrants, with a prevalence of 23.12% (95% CI = 20.92%–25.43%) but a small number was hospital patients with 0.01% (95% CI = 0.004%–0.03%). In accordance with the patient position, group one (rural) with 4.66% (95% CI = 3.94%–5.39%) was the most infected group unlike group two (urban) with the lowest infection rate of 0.19% (95% CI = 0.1%–0.2%).
The publication bias using Egger’s regression test was statistically significant (p<0.0001) (Supplementary Fig. 2). Meta-regression results showed no statistically significant relationship between prevalence of the parasitology method and sample size (P =0.175), year of publication (P =0.310), HDI (P =0.456), Gini (P =0.439), latitude (P = 0.121), and longitude (P = 0.390) (Supplementary Fig. 3&4).
The culture method was used in 41 surveys from 20 countries (54,858 individuals) and the overall prevalence was 10.08% (95% CI = 08.99%–11.16%). Laos had the highest prevalence with 40.97% (95% CI = 35.59%–46.52%) and Serbia [0.041% (95% CI = 0.001%–0.22%)] was the least prevalent country. The culture method showed the highest frequency in Asia [13.92% (95% CI = 10.94%–16.91%)] and the lowest in Europe [0.7% (95% CI = 0.2%–1.0%)]. Based on WHO Region, the Western Pacific region with the pooled prevalence of 21.36% (95% CI = 16.32%–26.39%) had the highest prevalence while the lowest was in the European region 0.7% (95% CI = 0.2%–1.63%). Farm workers [12.40% (95% CI = 8.58%–17.37%)] were amongst the most infected patients and travelers had the least infection rate with 0.041% (95% CI = 0.001%–0.2%). The results of Egger’s test indicated that there was statistically significant publication bias (p<0.0001) (Supplementary Fig. 5). There was a significant correlation between frequency of the parasitology methods and HDI (P = 0.004), Gini (P = 0.008), latitude (P = 0.023) and longitude (P = 0.013) (Figures 4 and 5; Supplementary Fig. 6 and 7). No significant relation was detected between prevalence of the culture method and sample size (P = 0.812), year of publication (P = 0.362), HDI (P = 0.456), Gini (P = 0.439), latitude (P = 0.121) and longitude (P = 0.390). Bar graphs of the distribution of year of publication and the included countries for the parasitology method were presented in Supplementary Figures 8 and 9.
Figure 4.
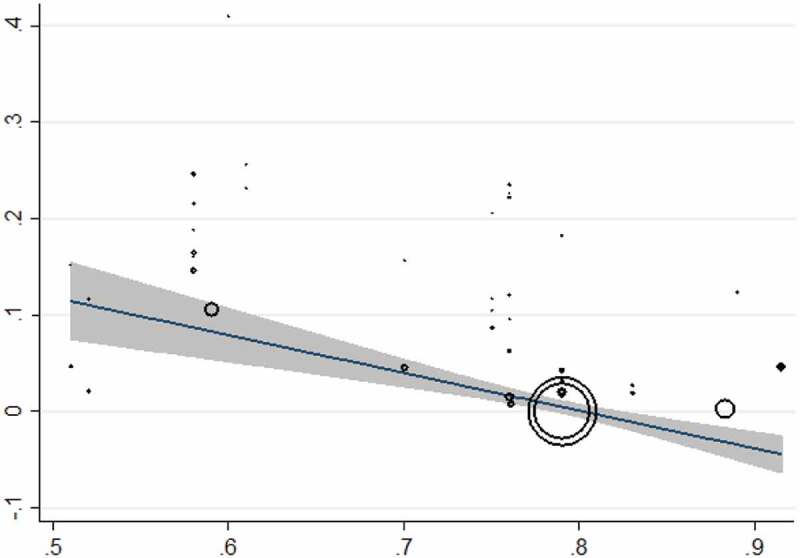
Meta-regression plot for the culture method based on HDI
Figure 5.
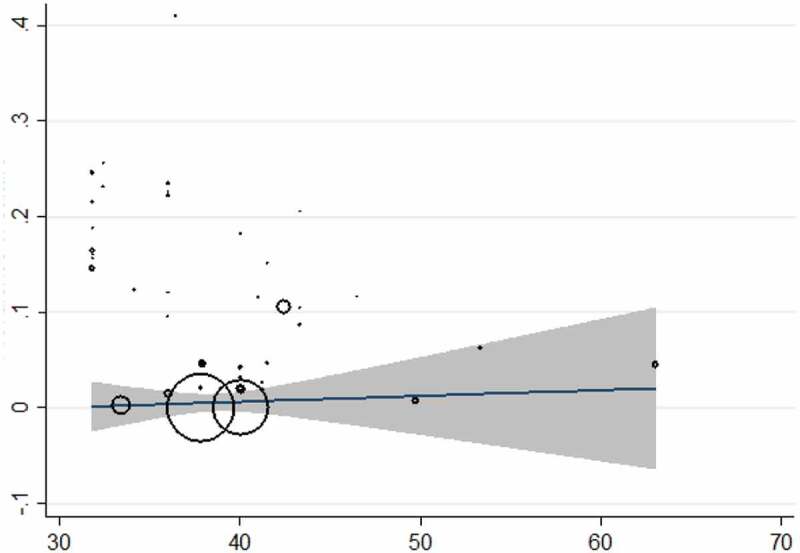
Meta-regression plot for the culture method based on Gini
Immunological methods
Thirty-four seroprevalence studies from 22 countries were carried out on (60,310 individuals). The total prevalence was 23.88% (95% CI = 20.82%–26.94%) with the immunological method. Based on the immunological method, the highest and the lowest pooled prevalence was related to Argentina and Turkey with 50.52% (95% CI = 40.07%–60.94%) and 0.35% (95% CI = 0.009%–1.96%), accordingly. Among the continents, Africa showed the highest pooled seroprevalence with 40.72% (95% CI = 36.74%–44.70%) but the lowest was in Europe with 9.06% (95% CI = 6.02%–12.09%). The Eastern Mediterranean Region with 40.72% (95% CI = 36.74%–44.70%) had the most seroprevalence among WHO Regions while the European Region had the lowest pooled prevalence of 9.06% (95% CI = 6.02%–12.09%). Also, our results showed that refugees were the most infected patients with 30.96% (95% CI = 14.62%–47.30%) versus the lowest pooled prevalence of 0.3% (95% CI = 0.009%–1.96%) in farmers. Furthermore, group three (patient position), showed the highest pooled prevalence of 24.18% (95% CI = 18.94%–30.05%) and group two had been the least infected group with 20.66% (95% CI = 14.86%–26.45%). In addition, the publication bias was very significant (P<0.0001) (Supplementary Fig. 10). Based on results of the meta-regression test, there was a statistical significant relationship between frequency of the immunological methods and sample size (P =0.324), year of publication (P =0.419), HDI (P =0.103), Gini (P =0.663), latitude (P = 0.502) and longitude (P = 0.428). Bar graphs of the distribution of year of publication and the included countries for the immunological method are shown in Supplementary Figures 11 and 12.
Molecular methods
We found that 16 reports from nine countries used the molecular method (among 7985 participants). The total molecular prevalence of strongyloidiasis was 9.3% (95% CI = 7.2%–11.3%). Angola with 21.36% (95% CI = 17.19%–26.03%) and Ghana with 21.22% (95% CI = 15. 92%–27.35%) had the maximum molecular-pooled prevalence, but the minimum was detected in Palestine with 0.6% (95% CI = 0.01%–3.65%). Based on continent, Africa was the most prevalent [19.75% (95% CI = 17.20%–22.30%)] and Asia was the least prevalent with 6.35% (95% CI = 4.41%–8.28%). Among WHO Regions, the highest total prevalence was in the African region with 19.72% (95% CI = 16.71%–22.73%) while the Eastern Mediterranean Region had the lowest prevalence of 5.89% (95% CI = 3.96%–8.08%). Our results showed that schoolchildren with 13.74% (95% CI = 11.80%–15.88%) were the most infected patients but the least prevalent group was related to the children admitted to the pediatric hospital [0.6% (95% CI = 0.01%–3.65%)]. As shown in Supplementary Figure 13, publication bias was statistically significant based on asymmetry Egger regression test (P <0.0001). Based on the results of meta-regression test, there was a significant relationship between prevalence of the molecular method and HDI (p=0.020). However, it didn’t show a significant relation between prevalence of the molecular method and sample size (P =0.172), year of publication (P =0.661), Gini (P =0.592), latitude (P =0.522) and longitude (P =0.143). Regarding the prevalence of human strongyloidiasis in different geographical regions of the world, four GIS maps were designed based on the microscopic, culture, immunological, and molecular studies (Figures 6–9). Bar graphs of the distribution of year of publication and included countries for the molecular method are shown in Supplementary Figures 14 and 15. Sensitivity analysis for culture, immunological and molecular methods showed that none of the studies alone had the significant impact on the pooled prevalence of each methods (Supplementary Fig. 16, 17 &18).
Figure 6.
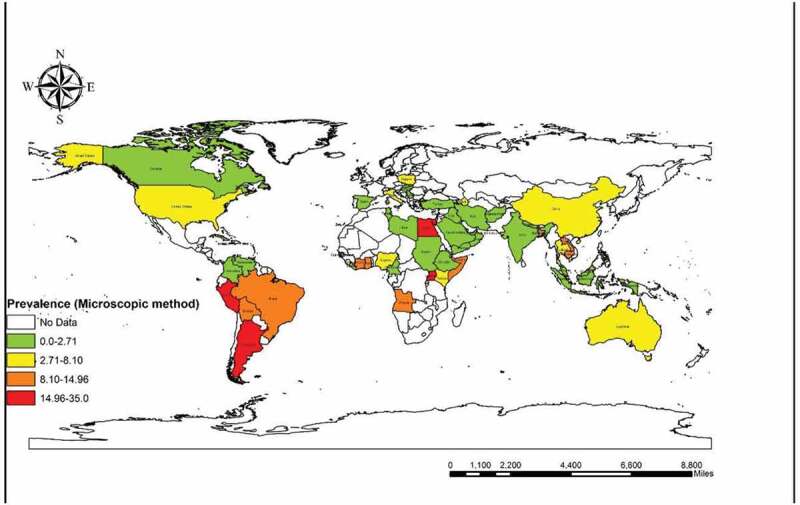
Prevalence of Strongyloidiasis in different geographical regions of the world based on microscopic method
Figure 7.
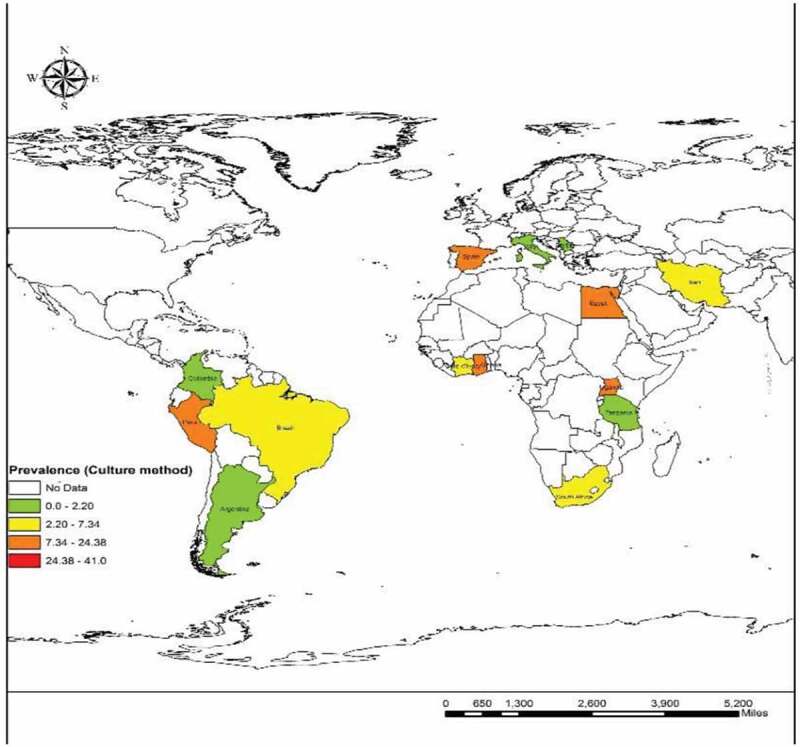
Prevalence of Strongyloidiasis in different geographical regions of the world based on Culture method
Figure 8.
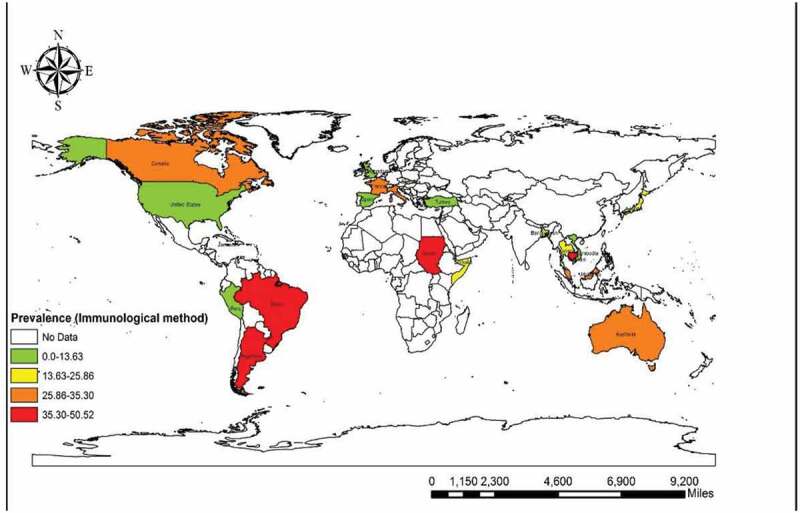
Prevalence of Strongyloidiasis in different geographical regions of the world based on Immunological method
Figure 9.
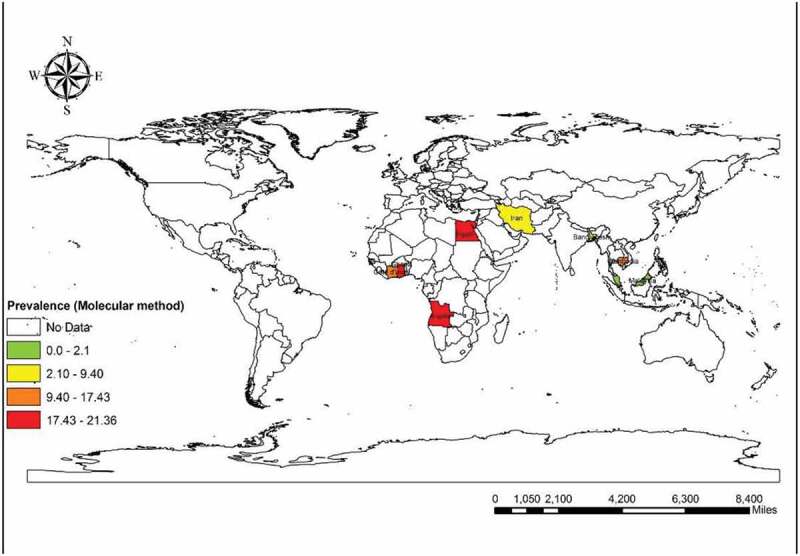
Prevalence of Strongyloidiasis in different geographical regions of the world based on Molecular method
The number of molecular studies was assessed according to the year of publication and countries (Supplementary Fig. 14 and 15). Sensitivity estimate analysis for all mentioned methods (microscopic, culture, immunological, and molecular) showed that the studies had no impact on the pooled prevalence individually (Supplementary Fig. 16, 17, and 18).
Discussion
Strongyloidiasis is one of the most widespread chronic infections caused by the neglected soil-transmitted helminth, S. stercoralis with a homogonic (host-dependent) and heterogonic (free-living) life cycle [20]. Previous reports have shown that the infection is not exclusively limited to tropical and subtropical regions, as there are some cases from non-tropical urban areas [21]. According to these surveys, S. stercoralis is a predominant specie in humans but it can also infect other mammals including dogs or cats and even primates [22,23]. Our systematic review and meta-analysis represented the overall frequency of strongyloidiasis in the general population across the world with the purpose of establishing prophylactic approaches to eradicating these parasites in the future. Published epidemiological records from five English databases (Science Direct, Scopus, PubMed, Web of Science, and Google Scholar) were explored according to the related keywords without time limitation before October 2019. We estimated the pooled prevalence and its correlation with various types of criteria according to the different diagnostic techniques such as parasitology (microscopy and culture), immunology, and molecular methods [16]. Two hundred and thirty-five entries on the subject of human strongyloidiasis were found to be eligible for inclusion in the review. Sixty out of 195 countries had reported human strongyloidiasis and the majority of studies were related to Thailand (25 records). The worldwide prevalence of human strongyloidiasis was 1.47% (95% CI = 1.38%–1.56%) by microscopy, 10.08 (95% CI = 8.99%–11.16%) by culture, 23.88% (95% CI = 20.82%–26.94%) by serology and 9.3% (95% CI = 7.2%–11.3%) by molecular techniques. In our study, many of the studies used microscopy procedure as a diagnostic method (166 studies). Based on microscopic techniques, Egypt (34.78%) and Peru (32.87%) had the highest pooled prevalence among countries. The studies were limited in both Egypt and Peru, as there was just one eligible record for each country that can be used as evidence for the high rate of pooled prevalence. Immigrants were the largest group of infected people (23.12%) in our microscopy results.
It can be inferred from a former survey that strongyloidiasis has a high prevalence rate in Latin America, sub-Saharan Africa, and South–East Asia. Also, it showed that the main risk groups are refugees and immigrants as they had infection rates of more than 75% [24]. According to our results of microscopy investigations, rural populations (4.66%) were the most infected group. This can indicate that the infection rate and clinical symptoms of strongyloides can be high in socio-economically and environmentally poor regions where people live with low sanitary standards and no access to diagnostic and treatment procedures.
This situation was similar to the results of studies in individuals with a high rate of S. stercoralis infection in rural communities in Cambodia. Another investigation with regard to helminth infection among schoolchildren in Ethiopia showed that the infection was higher in rural than in urban areas, which could indicate the direct impact of bare feet on the prevalence of intestinal helminths in those settings [25,26]. Our findings from surveys with the culture method showed that Laos had the largest number of cases (40.97%). This country is located in the Western Pacific Region of Asia and as one of the least developed countries, it has a high mortality rate due to the lack of appropriate nutrition and high prevalence of intestinal parasites as well as S. stercoralis. Previous evidence has suggested that helminthic infections are endemic in this area where walking barefoot outdoors is a common habit. Additionally, it must be stated that socioeconomic factors such as sanitary level, agricultural conditions, rate of environmental contamination by human feces may also have an impact on the level of strongyloidiasis in this country [27,28].
Asia has a large population with favorable conditions of climate, ecology, and socio-economy for the transmission and persistence of S. stercoralis. However, the reports on its occurrence are still limited in this region. Nowadays, the application of stool cultures including the Koga Agar plate culture, Baermann method, and also vermiculite stool culture seems to be reliable for detection of S. stercoralis in fecal samples [29]. Strongyloidiasis is one of the NTDs that is associated with health and economic losses especially in the countries of the WHO Western Pacific Region [30]. According to our results, this WHO region had the highest infection rate from both microscopy (9.47%) and culture methods (21.36%). Those studies that used an immunological assay confirmed that Argentina (50.52%) had the most infected cases of seroprevalence. Prior reports from Argentina showed that in this region the disease is endemic (prevalence rates of 30%–50%) since socioeconomic and environmental circumstances are compatible for transmission and persistence of the infection [31,32]. Likewise, the WHO Eastern Mediterranean Region (40.72%) had a maximum rate of seroprevalence. Since Somalia and Sudan are located in the Eastern Mediterranean WHO Region of the African continent, the highest seropositive cases were detected in these areas. The European region, with a high level of sanitary conditions and health care, had the least seropositive cases and most of the infected individuals were refugees and immigrants [33]. The total molecular prevalence of strongyloidiasis derived from our results showed that Angola (21.36%) and Ghana (21.22%) were the most prevalent countries in the WHO African region with a total prevalence of 19.72%. The molecular overall prevalence was the highest in the African continent and African WHO region. The molecular pooled prevalence of strongyloidiasis obtained in our study was comparable to those studies performed in Angola (21.4%) and Ethiopia (20.7%), where there are wet and dry seasons with tropical grasslands [34]. Our results showed a direct relation between publication bias and the pooled prevalence in all assessed studies. There are probable differences in sensitivity and specificity of the various diagnostic methods that affected the estimated pooled prevalence described here. A common worldwide diagnostic test for intestinal parasites is a direct wet mount which has low sensitivity, especially as a low burden of infection may increase the misdiagnosis. There is no gold standard method for the diagnosis of strongyloidiasis. However, parasitological and serological techniques are two common and useful tests. There are different types of parasitological procedures in order to detect the larval stage in fecal samples, containing microscopy (Direct smear, formalin-ethyl acetate, and Baermann method) and culture (Harada-Mori culture and Agar Plate Culture). Even though the low burden of parasites and disordered larval elimination can lead to the low sensitivity of mentioned techniques, collecting several fecal samples during different days is necessary. Applying culture methods is useful for the differentiation of filariform larvae from rhabditoid larvae [35]. Kato-Katz and Mini-FLOTAC method are two alternative procedures with reliable accuracy. The immunological methods (enzyme-linked immunosorbent assay (ELISA), western blot, indirect agglutination, and indirect immunofluorescence) detecting larval antigens in serum, stool, and urine samples have different sensitivity and specificity [36–40]. Former investigations showed that the sensitivity of immunological assays are superior to parasitological methods but still there is an issue regarding their specificity, including antibody cross-reactivity with antigens from other helminthic infections and false-positive cases as a result of the persistence antibody [41,42]. The relevant diagnostic molecular methods are consisted of conventional polymerase chain reaction (PCR), nested-PCR, real-time-PCR (qPCR), and Loop-mediated isothermal amplification (LAMP) using ITS-1, ITS-2, COX-1, SSU rRNA, 18S rRNA [36,43–45]. These molecular procedures have higher sensitivity than parasitological or immunological tests; however, accuracy depends on extraction procedures [46,47]. Consideration of an adequate diagnostic method with high sensitivity and specificity is needed to avoid a lack of diagnosis and to perform appropriate management of infection in future surveys.
Conclusion
The current systematic review and meta-analysis shows the global distribution and epidemiological features of human strongyloidiasis. Several investigations imply that gender, age, walking barefoot, using corticosteroids, being an immunocompromised patients, living in high-density populations with a low level of sanitary settings (latrines and sewage system), geographical conditions of the living area, being at a poor socio-economic level and having malnutrition are the main risk factors for strongyloidiasis. We found significant differences in prevalence between rural and urban areas, as has been reported in many studies. This infection is probably more prevalent than that reported in the published literature as the sensitivity and specificity of diagnostic methods vary. Comprehensive research using reliable assays along with advanced screening plans, particularly for at-risk groups and population in endemic areas, are very helpful. The higher frequency in the Western Pacific and Eastern Mediterranean regions highlights the importance of geographical situation which has a direct impact on the infection rate. We recommend health-care administrators to implement effective health surveillance, especially in regions with high infection levels, along with methods to improve public awareness.
Supplementary Material
Funding Statement
This work was supported by the Urmia University [IR.UMSU.REC.1398.384].
Disclosure statement
No potential conflict of interest was reported by the authors.
Supplementary material
Supplemental data for this article can be accessed here.
References
- [1].Palmeirim MS, Hürlimann E, Knopp S, et al. Efficacy and safety of co-administered ivermectin plus albendazole for treating soil-transmitted helminths: A systematic review meta-analysis and individual patient data analysis. PLoS Negl Trop Dis. 2018;12(4):e0006458. [DOI] [PMC free article] [PubMed] [Google Scholar]
- [2].Zibaei M, Nosrati MRC, Shadnoosh F, et al. Insights into hookworm prevalence in Asia: a systematic review and meta-analysis. Trans R Soc Trop Med Hyg. 2020;114(3):141–154. [DOI] [PubMed] [Google Scholar]
- [3].Buonfrate D, Formenti F, Perandin F, et al. Novel approaches to the diagnosis of Strongyloides stercoralis infection. Clin Microbiol Infect. 2015;21(6):543–552. [DOI] [PubMed] [Google Scholar]
- [4].Garrard TA, Ross KE, Taylor MJ.. Biocontrol for environmental control of the human parasite, Strongyloides stercoralis: A necessary next step. Biol Control. 2016;100:25–28. [Google Scholar]
- [5].Gonzalez-Ibarra F, Chevli P, Schachter L, et al. Strongyloidiasis and diffuse alveolar hemorrhage in a patient with systemic lupus erythematosus. Case Rep Med. 2014;2014. [DOI] [PMC free article] [PubMed] [Google Scholar]
- [6].Geri G, Rabbat A, Mayaux J, et al. Strongyloides stercoralis hyperinfection syndrome: a case series and a review of the literature. Infection. 2015;43(6):691–698. [DOI] [PubMed] [Google Scholar]
- [7].Imperatore K, Basra P, Herring N, et al. Fatal disseminated strongyloidiasis secondary to corticosteroid use: a report of two cases; 2017;
- [8].Azira NMS, Zeehaida M.. Strongyloides stercoralis hyperinfection in a diabetic patient: case report. Trop Biomed. 2010. 27(1):115-119. [PubMed] [Google Scholar]
- [9].Dahal S, Lederman J, Berman J, et al. Case of bacteremia and meningitis associated with piperacillin-tazobactam nonsusceptible, ceftriaxone susceptible escherichia coli during strongyloides hyperinfection in an immunocompromised host. Case Rep Infect Dis. 2017. DOI: 10.1155/2017/8634717 [DOI] [PMC free article] [PubMed] [Google Scholar]
- [10].Dekumyoy P, Chantawat N, Naaglor T, et al. Comparative diagnosis of strongyloidiasis in immunocompromised patients. Am J Trop Med Hyg. 2016;95(2):401–404. [DOI] [PMC free article] [PubMed] [Google Scholar]
- [11].Beknazarova M, Whiley H, Ross K. Strongyloidiasis: A disease of socioeconomic disadvantage. Int J Environ Res Public Health. 2016;13(5):517. [DOI] [PMC free article] [PubMed] [Google Scholar]
- [12].Mejia R, Nutman TB. Screening, prevention, and treatment for hyperinfection syndrome and disseminated infections caused by strongyloides stercoralis. Curr Opin Infect Dis. 2012;25(4):458–463. [DOI] [PMC free article] [PubMed] [Google Scholar]
- [13].Teixeira MCA, Pacheco FTF, Souza JN, et al. Strongyloides stercoralis infection in alcoholic patients. Biomed Res. Int. 2016;2016:1–11. [DOI] [PMC free article] [PubMed] [Google Scholar]
- [14].Iriemenam NC, Sanyaolu AO, Oyibo WA, et al. Strongyloides stercoralis and the immune response. Parasitol. Int. 2010;59(1):9–14. [DOI] [PubMed] [Google Scholar]
- [15].Siddiqui AA, Berk SL. Diagnosis of strongyloides stercoralis infection. Clin. Infect. Dis. 2001;33(7):1040–1047. [DOI] [PubMed] [Google Scholar]
- [16].Requena-Méndez A, Chiodini P, Bisoffi Z, et al. The laboratory diagnosis and follow up of strongyloidiasis: a systematic review. PLoS Negl Trop Dis. 2013;7(1):e2002. [DOI] [PMC free article] [PubMed] [Google Scholar]
- [17].Repetto SA, Ruybal P, Batalla E, et al. Strongyloidiasis outside endemic areas: long-term parasitological and clinical follow-up after ivermectin treatment. Clin Infect Dis. 2018;66(10):1558–1565. [DOI] [PubMed] [Google Scholar]
- [18].United Nations Development Program . [cited March 2020]. Available from: http://hdr.undp.org/en/%0Acomposite/HDI
- [19].World Bank Group database . [cited March 2020]. Available from: https://datahelpdesk.worldbank.org/knowledgebase/articles/906519-world-bank-country-and-lending-groups
- [20].Ly MN, Bethel SL, Usmani AS, et al. Cutaneous Strongyloides stercoralis infection: an unusual presentation. J. Am. Acad. Dermatol. 2003;49(2):157–160. [DOI] [PubMed] [Google Scholar]
- [21].Amir-Ahmadi H, Braun P, Neva FA, et al. Strongyloidiasis at the boston city hospital - Emphasis on gastrointestinal pathophysiology and successful therapy with thiabendazole. Am J Dig Dis. 1968. DOI: 10.1007/BF02232919 [DOI] [PubMed] [Google Scholar]
- [22].Mendes T, Minori K, Ueta M, et al. Strongyloidiasis current status with emphasis in diagnosis and drug research. J Parasitol Res. 2017;2017:1–13. [DOI] [PMC free article] [PubMed] [Google Scholar]
- [23].Mati VLT, Raso P, De Melo AL. Strongyloides stercoralis infection in marmosets: replication of complicated and uncomplicated human disease and parasite biology. Parasites Vectors. 2014;7(1). DOI: 10.1186/s13071-014-0579-2 [DOI] [PMC free article] [PubMed] [Google Scholar]
- [24].Schär F, Trostdorf U, Giardina F, et al. Strongyloides stercoralis: global distribution and risk factors. PLoS Negl Trop Dis. 2013. DOI: 10.1371/journal.pntd.0002288 [DOI] [PMC free article] [PubMed] [Google Scholar]
- [25].Khieu V, Srey S, Schär F, et al. Strongyloides stercoralis is a cause of abdominal pain, diarrhea and urticaria in rural Cambodia. BMC Res Notes. 2013;6(1):200. [DOI] [PMC free article] [PubMed] [Google Scholar]
- [26].Abera B, Alem G, Yimer M, et al. Epidemiology of soil-transmitted helminths, Schistosoma mansoni, and haematocrit values among schoolchildren in Ethiopia. J Infect Dev Ctries. 2013;7(3):253–260. [DOI] [PubMed] [Google Scholar]
- [27].Phongluxa K, Xayaseng V, Vonghachack Y, et al. Helminth infection in southern Laos: high prevalence and low awareness. Parasites Vectors. 2013;6(1):328. [DOI] [PMC free article] [PubMed] [Google Scholar]
- [28].Rim HJ, Chai JY, Min DY, et al. Prevalence of intestinal parasite infections on a national scale among primary schoolchildren in Laos. Parasitol. Res. 2003;91(4):267–272. [DOI] [PubMed] [Google Scholar]
- [29].Schär F, Giardina F, Khieu V, et al. Occurrence of and risk factors for Strongyloides stercoralis infection in South-East Asia. Acta Trop. 2016;159:227–238. [DOI] [PubMed] [Google Scholar]
- [30].Nakagawa J, Ehrenberg JP, Nealon J, et al. Towards effective prevention and control of helminth neglected tropical diseases in the western pacific region through multi-disease and multi-sectoral interventions. Acta Tropica. 2015;141:407–418. [DOI] [PubMed] [Google Scholar]
- [31].Cimino RO, Krolewiecki AJ, Echazú A, et al. Serologic monitoring of public health interventions against strongyloides stercoralis. Am J Trop Med Hyg. 2017;97(1):166–172. [DOI] [PMC free article] [PubMed] [Google Scholar]
- [32].Krolewiecki AJ, Ramanathan R, Fink V, et al. Improved diagnosis of strongyloides stercoralis using recombinant antigen-based serologies in a community-wide study in northern Argentina. Clin. Vaccine Immunol. 2010;17(10):1624–1630. [DOI] [PMC free article] [PubMed] [Google Scholar]
- [33].Requena-Méndez A, Buonfrate D, Gomez-Junyent J, et al. Evidence-based guidelines for screening and management of strongyloidiasis in non-endemic countries. Am J Trop Med Hyg. 2017. DOI: 10.4269/ajtmh.16-0923 [DOI] [PMC free article] [PubMed] [Google Scholar]
- [34].Bocanegra C, Gallego S, Mendioroz J, et al. Epidemiology of schistosomiasis and usefulness of indirect diagnostic tests in school-age children in cubal, central angola. PLoS Negl Trop Dis. 2015;9(10):e0004055. [DOI] [PMC free article] [PubMed] [Google Scholar]
- [35].Shiroma Y, Toma H, Toma H, et al. Efficacy of stool examination for detection of Strongyloides infection. Am. J. Trop. Med. Hyg. 1995;53(3):248–250. [DOI] [PubMed] [Google Scholar]
- [36].Fernández-Soto P, Sánchez-Hernández A, Gandasegui J, et al. Assay for strongyloides spp. detection in stool and urine samples. towards the diagnosis of human strongyloidiasis starting from a rodent model. PLoS Negl Trop Dis. 2016;10(7):e0004836. [DOI] [PMC free article] [PubMed] [Google Scholar]
- [37].Sykes AM, McCarthy JS. A coproantigen diagnostic test for Strongyloides infection. PLoS Negl Trop Dis. 2011;5(2):e955. [DOI] [PMC free article] [PubMed] [Google Scholar]
- [38].Page WA, Dempsey K, McCarthy JS. Utility of serological follow-up of chronic strongyloidiasis after anthelminthic chemotherapy. Trans R Soc Trop Med Hyg. 2006;100(11):1056–1062. [DOI] [PubMed] [Google Scholar]
- [39].Levenhagen MA, Costa-Cruz JM. Update on immunologic and molecular diagnosis of human strongyloidiasis. Acta Trop. 2014;135:33–43. [DOI] [PubMed] [Google Scholar]
- [40].Ahmed SA, El-Moselhy A, El-Moammaly A, et al. Strongyloides stercoralis in patients on corticosteroids therapy using enzyme-linked immunosorbent assay and gelatin particles indirect agglutination tests: a diagnostic approach. Acta Parasitol. 2019. DOI: 10.2478/s11686-019-00060-w [DOI] [PubMed] [Google Scholar]
- [41].Boscolo M, Gobbo M, Mantovani W, et al. Evaluation of an indirect immunofluorescence assay for strongyloidiasis as a tool for diagnosis and follow-up. Clin Vaccine Immunol. 2007;14(2):129–133. [DOI] [PMC free article] [PubMed] [Google Scholar]
- [42].Bisoffi Z, Buonfrate D, Sequi M, et al. Diagnostic accuracy of five serologic tests for strongyloides stercoralis infection. PLoS Negl Trop Dis. 2014;8(1):e2640. [DOI] [PMC free article] [PubMed] [Google Scholar]
- [43].O’Connell EM, Nutman TB. Molecular diagnostics for soil-transmitted helminths. Am J Trop Med Hyg. 2016;95:508–513. [DOI] [PMC free article] [PubMed] [Google Scholar]
- [44].Dorris M, Blaxter M. The small subunit ribosomal RNA sequence of Strongyloides stercoralis. Int. J. Parasitol. 2000;30(8):939–941. [DOI] [PubMed] [Google Scholar]
- [45].Sitta RB, Malta FM, Pinho JR, et al. Conventional PCR for molecular diagnosis of human strongyloidiasis. Parasitology. 2014;141(5):716–721. [DOI] [PubMed] [Google Scholar]
- [46].de Paula FM, Malta FM, de Marques PD, et al. Molecular diagnosis of strongyloidiasis in tropical areas: A comparison of conventional and real-time polymerase chain reaction with parasitological methods. Mem Inst Oswaldo Cruz. 2015. DOI: 10.1590/0074-02760140371 [DOI] [PMC free article] [PubMed] [Google Scholar]
- [47].Buonfrate D, Requena-Mendez A, Angheben A, et al. Accuracy of molecular biology techniques for the diagnosis of Strongyloides stercoralis infection—A systematic review and meta-analysis. PLoS Negl Trop Dis. 2018;12(2):e0006229. [DOI] [PMC free article] [PubMed] [Google Scholar]
Associated Data
This section collects any data citations, data availability statements, or supplementary materials included in this article.