Abstract
Background:
Ewing sarcoma (ES), the second most prevalent bone malignant tumor has no widely known prognostic biomarker. Earlier studies have suggested that chaperonin containing TCP1 complex 6A (CCT6A), which encodes a molecular protein chaperone, is involved in the pathogenesis of many cancers. However, there are no known reports providing clear evidence of its role in ES pathogenesis.
Methods:
We performed a bioinformatic analysis of 32 ES specimens from the GSE17618 dataset concentrating on the differences in gene expression, OS, event-free survival (EFS) in the different subgroups. Immunohistochemical studies were also performed to identify the expression levels of selected genes in ES and immediate paracancerous tissues.
Results:
After 3 screenings, CCT6A was identified to be highly correlated with ES prognosis. Our survival analysis revealed a low overall survival (OS) for high CCT6A expression (P-value = .024). Our Cox regression analysis identified CCT6A expression, lEFS, and age were strongly associated with prognosis of ES. Our multivariate Cox regression analysis shows that CCT6A (P-value = .015), age (P-value = .026), and EFS (P-value = .002) were independent poor prognostic biomarkers. Our immunohistochemical analysis showed that the expression levels of CCT6A were significantly higher in ES tissues compared to the paracancerous tissues.
Conclusion:
From the results of our study, we identified the expression levels of CCT6A to be strongly associated with prognosis of ES. Thus, the expression levels of the CCT6A gene could serve as a biomarker for the prediction of ES prognosis.
Keywords: biomarker, champeronin containing TCP1 complex 6A gene, event-free survival, Ewing sarcoma, overall survival, prognosis
1. Introduction
Ewing sarcoma (ES) is a primary, highly malignant bone tumor originating in the bone marrow, most often occurring in children and adolescents, and is second only to osteosarcoma in its incidence in the adolescent population. It has been reported to have an annual incidence rate of less than 1% among patients diagnosed with cancer.[6] ES has a characteristically poor prognosis, with a 5-year survival rate of only 65% to 75%, which further reduces to <30% in patients with metastatic tumors.[8] Recent studies have demonstrated the predictive values of biomarkers, especially for tumor prognosis,[21,22] However, there are still many possible prognosis-related biomarker that require further research into.
The chaperonin containing TCP1 complex 6A (CCT6A) gene encodes a protein which is a member of the chaperone containing TCP1 complex. It has been previously reported that the expression levels of CCT6A encoded proteins are elevated in hepatocellular carcinoma tumor tissues, and that the overall survival (OS) )of these patients are relatively low.[34] Previous studies have confirmed that a number of mutant peptides have potential prognostic value, and that somatic variants with increased expressions of CCT6A have clinical significance.[17] Other studies have reported that CCT6A is both expression-inducible and amplification-inducible in glioblastomas, and was negatively correlation with survival.[10] Additionally, CCT6A has been reported to play an important role in breast cancer progression.[13] Thus, CCT6A may be involved in the pathogenesis and progression of several cancers. However, its expression level and prognostic role in ES remains largely unknown.
The search for reliable biomarkers to aid the prediction of tumor prognosis via bioinformatic analysis is a proven, widely accepted and recognized by many scholars. Biomarkers have excellent clinical relevance and value in guiding prognosis, and have been used to identify patients at increased risk of nonalcoholic steatohepatitis and advanced fibrosis, and also to predict potential adverse clinical outcomes in high risk patients.[31] This study therefore applies the principles of bioinformatics to investigate potential biomarkers for ES, with the aim of guiding future clinical diagnosis, treatment, and overall prognosis prediction.
2. Materials and methods
2.1. Data download and preliminary filtering
Gene expression data and clinical information data of ES patients were downloaded from the publicly available database Gene Expression Omnibus (http://www.ncbi.nlm.nih.gov/geo/). The gene expression data and clinical information data from the dataset GSE17618 were collected for our analysis.[24] The gene expression data of GSE17618 data set belonging to platform GPL570, were then generated using Affymetrix Human Genome U133 Plus 2.0 Array on a microarray platform. The dataset consisted of 43 ES patient samples and 11 ES cell lines. Samples were excluded when:
-
1)
Diagnosed as non-ES;
-
2)
From ES cell lines,
-
3)
With incomplete clinical information.
Data extracted for analyses include the following: gender, age, tumor status, OS time, event-free survival (EFS), and survival status. The study principles adhere to the Helsinki declaration, and the tissue sections for immunohistochemical analysis have been approved by the Ethical Review Committee of the first clinical affiliated hospital of Guangxi medical university.
2.2. Data filtering and genetic screening
All statistical analysis operations were performed using R software version 4.0.0.[18] We used R package (Impute) to fill in and correct the data for the expression matrix, and Limma package to standardize the gene expression data.[20] The gene expression matrix data were transformed into log2-scale. We then used the R package (survival package) to perform a survival analysis via Kaplan–Meier method for all the genes in the expression data. The survival analysis of patient's survival status and survival time were also performed using Cox regression analysis via the R package (survival package). Genes that met the following conditions were then selected for the next round of filtering:
-
1)
P-value < .05 obtained using the Kaplan–Meier method;
-
2)
P-value < .05 obtained using the Cox regression method;
-
3)
genes with a >10% difference in the 5-year survival of patients.
In the second step, the independent prognostic analysis was filtered. We then used univariate Cox regression analysis and multivariate Cox regression analysis to compare the genes obtained in the first step with survival time and survival status, respectively, and the genes with P-value < .05 via both methods were saved for the subsequent filtering. For the clinical relevance filtering. we grouped the patients according to gender, age, tumor status, and EFS. Each group (age, sex, and EFS) were further divided into 2 subgroups, and Wilcox method used to analyze them in relation to survival status and survival time. A P-value <.05 was considered statistically significant. The tumor status was divided into 3 subgroups, for survival status and survival time analysis using Kruskal–Wallis method, and a P-value < .05 considered statistically significant. Genes that satisfied P-value < .05 in both methods were eventually preserved for further analysis.
2.3. Data analysis and visualization
We used the Limma R package for the differential analysis of gene expression data for all samples. The cut off value set to: adjusted P-value<.05, |logFC|>0.5. The R package (pheatmap) was used to highlight the regions where the differential genes were mainly concentrated via a heat map and Volcano map. Subsequently, genome ontology (GO) enrichment analysis[9] and KEGG pathway enrichment analysis[14] and visualization of the differential genes were performed based on the R package (clusterProfile,[33] rg.Hs.eg.db, enrichplot, and ggplot2[32] respectively), and the cut off value set to P-value<.05. We then imported the differentially expressed genes (DEGs) into the STRING database (https://string-db.org/)[27] for the protein interaction networksanalysis, which were then imported into cytoscape (version 3.8.0)[25] for visualization. We then plotted the correlation coefficient heat map between the gene based on the R package (corrplot).
2.4. Immunohistochemistry
ES and paracancerous tissue samples fixed in formalin and embedded in paraffin were used for the immunohistochemical staining. The CCT6A antibodies used for the immunohistochemical staining were purchased from the ABclonal (Catalog No.: A3589). Following the paraffin removal, hydration and sealing, the specimens were mixed with anti-CCT6A (Recombinant fusion protein containing a sequence corresponding to amino acids. 80 to 250 of human CCT6A (NP_001753.1)) then incubated overnight at 4°C (dilution ratio 1:100). The samples were then sectioned for evaluation under the microscope via the comparison of the staining differences between the tissue samples.
3. Results
3.1. The relationship between high expression levels of CCT6A and survival in ES patients
After the initial screening, 32 samples from the GSE17618 dataset met our inclusion criteria. The expression matrix of GSE17618 contains 21655 genes, however, after the initial survival filtering, 607 genes met our screening criteria. After our second filtering step via univariate Cox regression analysis and multivariate Cox regression analysis, 233 genes remained. After our subgroup analysis via Wilcox and Kruskal–Wallis methods, only CCT6A was left to meet our criteria. Using the median value of CCT6A expression as a reference, the patients were divided into 2 groups for Kaplan–Meier survival analysis. Patients with CCT6A expression expression greater than the median were classified as high expression group; whiles those with expression levels lower than or equal to the median were classified as low expression group. Survival times of the patients in the low and high expression groups were used for plotting survival curves (Fig. 1). From the results of the survival curves, the probability of survival of patients in the high expression group were significantly lower than those in the low expression group, and the difference was statistically significant (P = .024).
Figure 1.
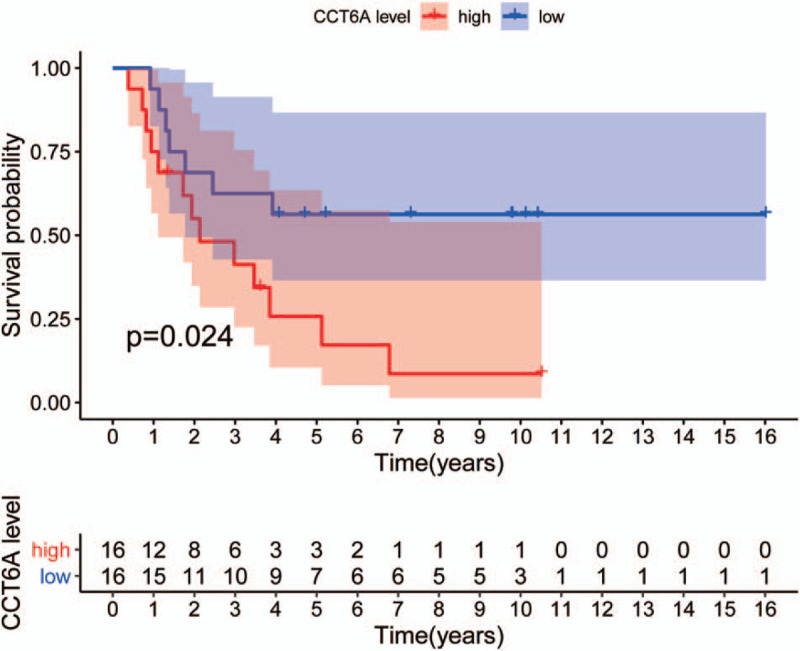
chaperonin containing TCP1 complex 6A (CCT6A) gene high and low expression group survival curves. Survival curves of patients in the CCT6A high expression group (red curves) and patients’ survival curves in the CCT6A low expression group (blue curves). The x-axis indicates survival time (years), and the y-axis indicates survival probability. Kaplan–Meier survival curves showed that patients in the CCT6A high expression group had worse endpoints for predicting overall survival. In contrast, patients in the CCT6A low expression group had better outcomes for predicting OS than high expression, and the difference was statistically significant (P = .024).
3.2. Univariate and multivariate Cox regression analysis for CCT6A
We further performed univariate and multivariate Cox regression analyses of the interactions between CCT6A and survival status/survival. From the results of out univariate analysis plot (Fig. 2A) and Table 1, CCT6A was found to be significantly associated with survival status and survival time (P-value < .001, HR = 7.953). The high HR value (HR>1) identified CCT6A as a high-risk factor, and the higher the CCT6A expression value, the poorer the prognosis. It also demonstrates that CCT6A could be considered an independent prognostic biomaker for the prediction of patient's prognosis. It can also seen that there is a strong association between EFS and survival status/survival time (P-value = .003, HR = 0.227). However, the low HR value of EFS (HR<1) indicates that it is a low-risk factor. The results of our forest plot from the multivariate Cox analysis (Fig. 2B) and Table 2, revealed that CCT6A was significantly associated with survival (P-value = .015, HR = 4.902) as well as a high-risk factor for ES prognosis. The results of our multivariate analysis also identified age to be strongly associated with survival, (P-value = .026, HR = 0.295), and a low-risk factor for ES prognosis. EFS was also found to be strongly associated with survival, and a low-risk factor for ES prognosis (P = .002, HR = 0.200).
Figure 2.
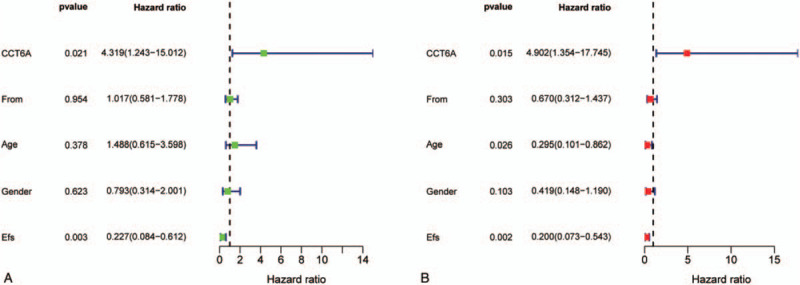
Survival-related Cox regression analysis plots. A and B plots show univariate Cox regression analysis and multivariate Cox regression analysis, respectively. The horizontal coordinates of both graphs represent hazard ratio (HR), and the vertical coordinates are different variables. HR > 1 indicates a high-risk factor, and HR < 1 indicates a low-risk factor. In the univariate Cox regression analysis in Figure A, chaperonin containing TCP1 complex 6A and event-free survival are statistically significant (P-value < .05). The multifactorial Cox regression analysis in Figure B, chaperonin containing TCP1 complex 6A, Age, and event-free survival has statistically significant (P-value < .05).
Table 1.
univariate Cox regression analysis table.
| Variables | HR | HR.95L | HR.95H | P-value |
| CCT6A | 4.319148 | 1.242716 | 15.01151 | .021344 |
| From | 1.016609 | 0.581309 | 1.777874 | .953937 |
| Age | 1.487818 | 0.61522 | 3.598066 | .377879 |
| Gender | 0.79254 | 0.313968 | 2.000583 | .622606 |
| EFS | 0.22656 | 0.083856 | 0.612111 | .003413 |
HR. 95L represents the lower limit of the 95% confidence interval, and HR. 95H represents the upper limit of the 95% confidence interval.
CCT6A = chaperonin containing TCP1 complex, EFS = event-free survival, HR = Hazard ratio.
Table 2.
Multivariate Cox regression analysis table.
| Variables | HR | HR.95L | HR.95H | P-value |
| CCT6A | 4.901907 | 1.354073 | 17.74549 | .015446 |
| From | 0.669709 | 0.31221 | 1.436567 | .303189 |
| Age | 0.294578 | 0.100638 | 0.862259 | .02572 |
| Gender | 0.419259 | 0.147659 | 1.190434 | .102558 |
| EFS | 0.19969 | 0.073384 | 0.54339 | .00161 |
HR. 95L represents the lower limit of the 95% confidence interval, and HR. 95H represents the upper limit of the 95% confidence interval.
CCT6A= chaperonin containing TCP1 complex, EFS = event-free survival, HR = Hazard ratio.
3.3. Expression of CCT6A in different subgroups
We analyzed the gene expression of CCT6A in the different groups and found substantial differences. Gene expression of CCT6A in both age groups: the median value of gene expression in the >20-year-old group was higher than the median value of gene expression in the < = 20-year-old group; the difference is statistically significant (P-value = .044), see Figure 3A for details. From the expression of the CCT6A gene in different gender (Fig. 3B), we observed that the median value of CCT6A expression in males was significantly higher than that in females. The difference has not statistically significant (P-value >.05). The median value of CCT6A expression was significantly different in the group of patients with EFS< = 5 years compared to the group of patients with EFS>5 years (P-value = .019), and gene expression was higher in the EFS<=5 group compared to the EFS>5 group, as detailed in Figure 3C. From this subgroup of tumor status, it can be seen that the median value of CCT6A gene expression was highest in the metastatic group, followed by patients in the relapsed group, and finally, patients in the primary group. Among them, there was a significant difference in expression between the primary group and the recurrent swelling group (P-value = .042), and a significant difference in expression between the primary group and the metastatic group (P-value = .029), see Figure 3D for details.
Figure 3.
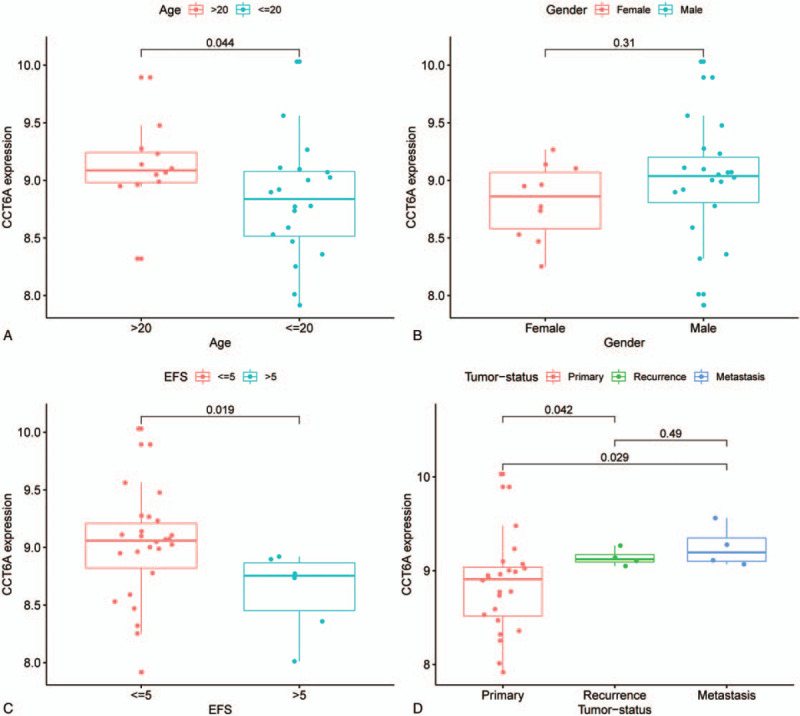
chaperonin containing TCP1 complex 6A (CCT6A) gene expression in different subgroups. X-axis all indicate different groupings, and Y-axis all indicates the gene expression level of CCT6A. Figure A shows the expression levels of CCT6A in different age groups. The median value of the gene expression of CCT6A in the >20-year-old patient group was lower than in the <=20-year-old patient group, and the difference was statistically significant (P-value = .044). Figure B shows the gene expression of CCT6A in different genders. The median CCT6A gene expression was more significant in the male group than in the female group, and the difference was not statistically significant (P-value > .05). Figure C shows the expression of CCT6A in different event-free survival groupings. The median gene expression value of CCT6A was much higher in the event-free survival<= 5-year group than in the >5-year group, and the difference was statistically significant (P-value = .019). Figure D shows the gene expression levels of CCT6A in different tumor sources. The difference between the Primary and Recurrence groups was statistically significant (P-value = .042), and the difference between the primary and metastasis groups was statistically significant (P-value = .029).
3.4. Screening of DEGs, enrichment analysis, and visualization, and construction of protein interaction networks.
We analyzed DEGs and performed GO and KEGG enrichment analysis and visualization of DEGs, and finally constructed protein reciprocal networks of the databases. The screening of the DEGs yielded 188 genes, of which 106 were upregulated and 82 were downregulated. This is shown in the Heat and volcanic maps of the in Figure 4A and Figure 4B. A total of 106 genes were positively correlated with CCT6A, whiles 82 were negatively correlated, Figure 5. Subsequently, the GO enrichment analysis and the visualization of the DEGs (Fig. 6A), revealed that biological process (BP), cell component (CC), and molecular function (MF) were in the top 10, respectively. The DEGs were also analyzed and visualized for KEGG enrichment as shown in Figure 6B. Finally, the the DEGs were imported into the STRING database for the analysis of the protein interaction network, which was then imported into Cytoscape for visualization (Fig. 7).
Figure 4.
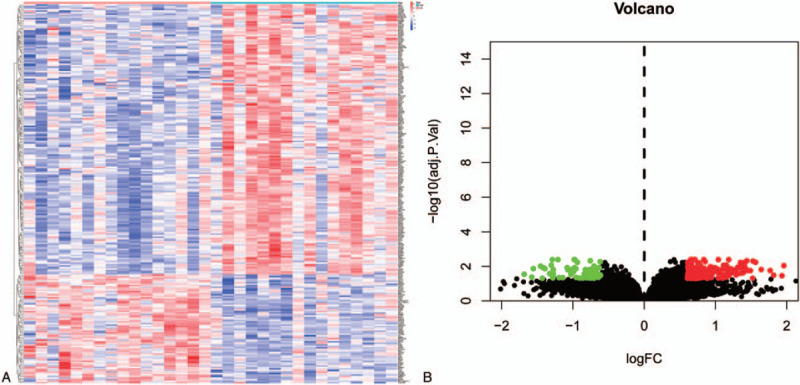
Heat map and volcano diagram of differential genes. Figure A shows the heat map of differential genes. Red represents high expression, blue represents low expression, and white represents intermediate expression. There are 178 genes with high expression values in the high expression group and 72 genes with decreased expression in the low expression group. Figure B shows the volcano of differential genes. X-axis indicates logFC value, y-axis indicates -log10P-value. Red dots indicate up-regulated genes, green dots indicate down-regulated genes, and black dots indicate genes with insignificant differences.
Figure 5.
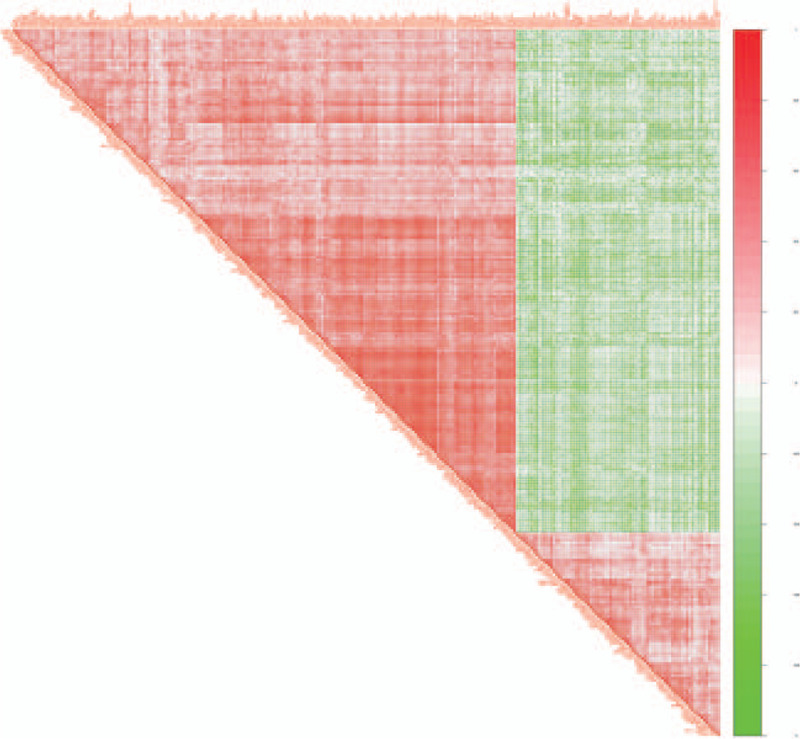
Correlation coefficient heat map. Correlation coefficient heat map. Both the right and diagonal sides of the triangle represent genes. The darker the red between 2 genes, the stronger the positive correlation between the 2 genes; the darker the green between the 2 genes, the stronger the negative correlation between the 2 genes.
Figure 6.
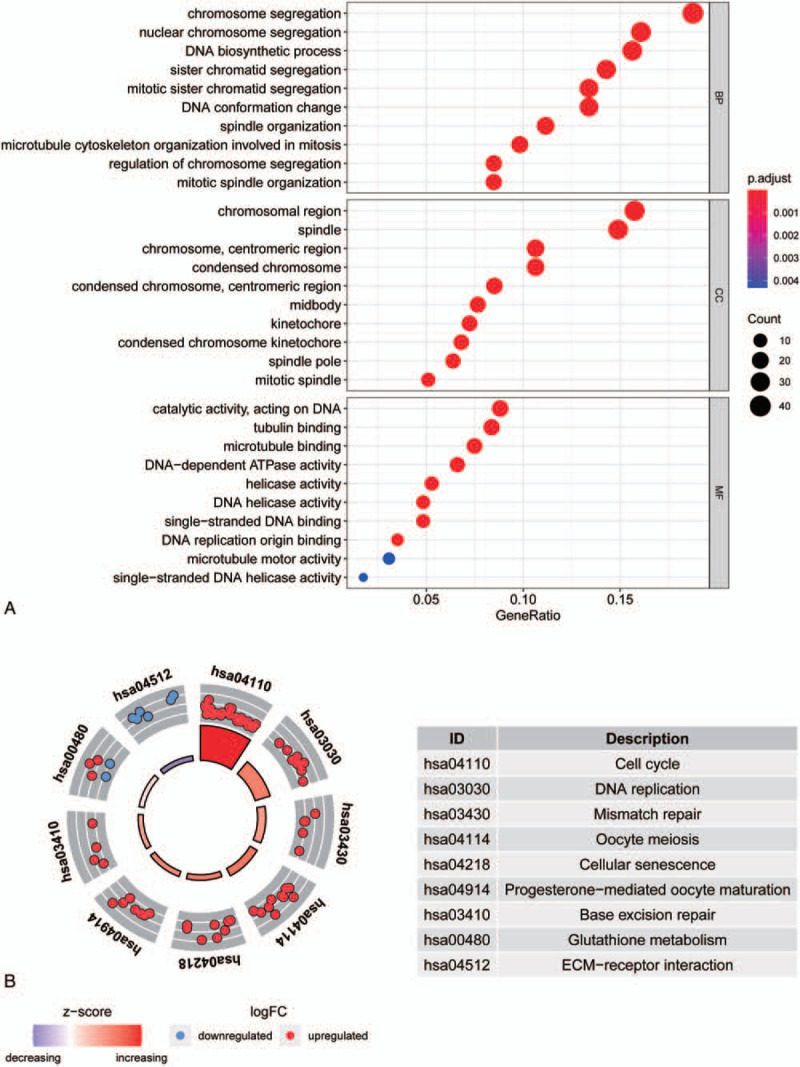
genome ontology (GO) enrichment analysis of differentially expressed genes and KEGG enrichment analysis. Figure A shows the top 30 entries of BP, CC, and MF for GO enrichment analysis of differentially expressed genes. The X-axis shows the gene ratio of each entry; Y-axis shows the GO entries. Figure B shows the enrichment pathway of KEGG. Inner circles indicate z-scores, outer circles indicate gene enrichment pathways, red dots indicate up-regulated genes, and blue dots indicate down-regulated genes.
Figure 7.
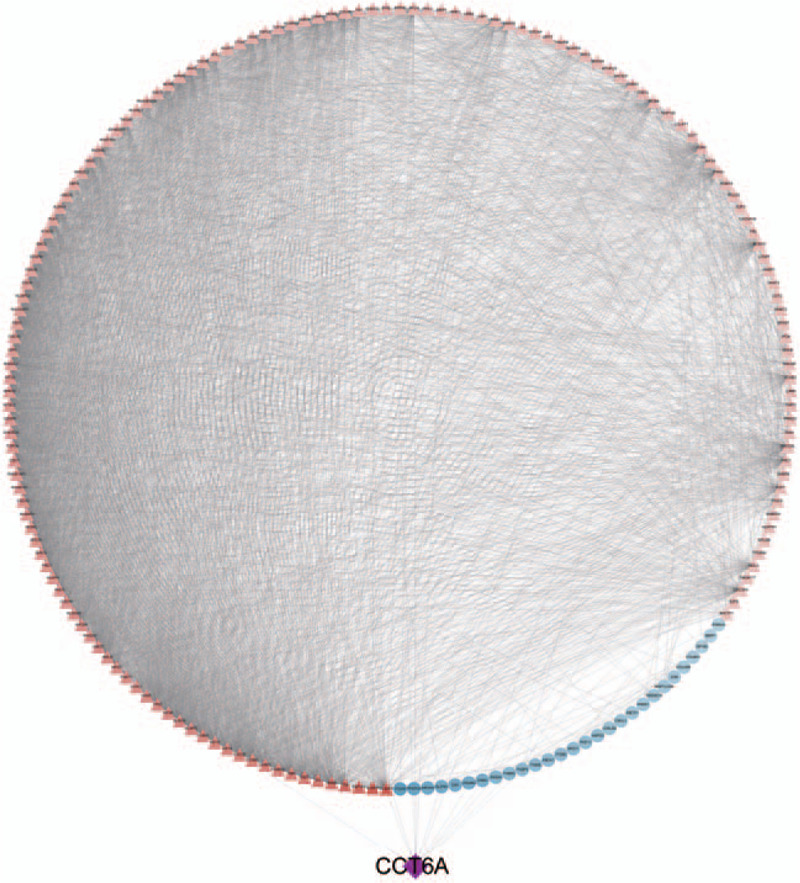
Protein interaction network diagram. Red triangles indicate up-regulated genes, blue circles indicate down-regulated genes, and purple diamonds indicate chaperonin containing TCP1 complex 6A genes.
3.5. Immunohistochemistry
To test the validity of our analysis, we performed immunohistochemical staining of ES and paracancerous tissue specimens. As shown in Figure 8B1, B2 and B3, CCT6A were detected in smaller quantities in the paracancerous tissues. Interestingly, they were abundantly expressed in ES tissue specimens as shown in Figure 8A1, A2, and A3.
Figure 8.
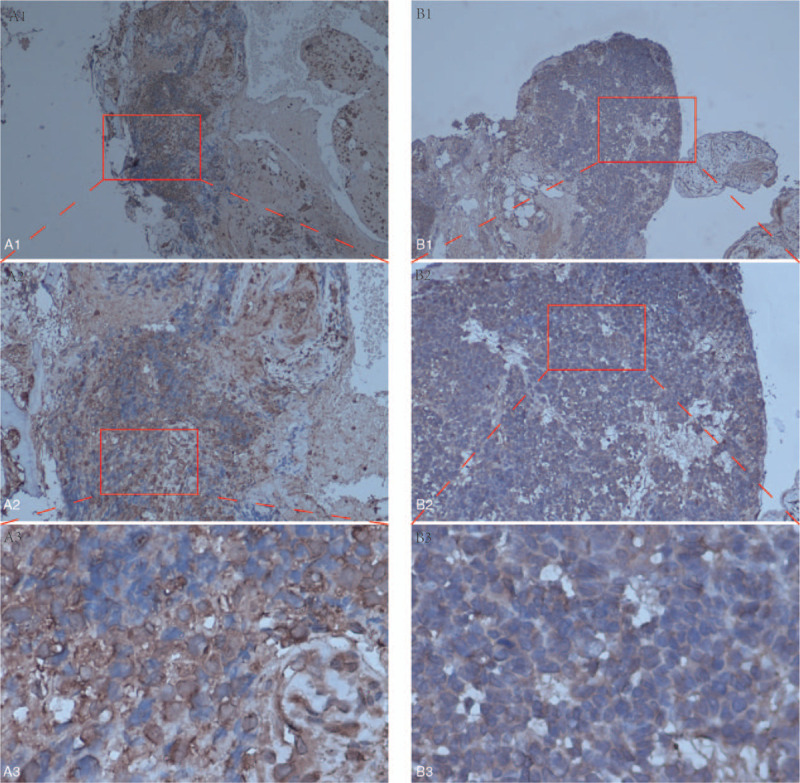
Immunohistochemical analysis of chaperonin containing TCP1 complex 6A (CCT6A) in Ewing sarcoma and paracancerous tissues. A1, A2, and A3 on the left show the protein expression of CCT6A in Ewing sarcoma. B1, B2, and B3 on the right show the protein expression of CCT6A in paracancerous tissues.
4. Discussion
As early as 2006, CCT6A was reported to play an important regulatory role in cancers.[29] Meng Zhu et al in 2017 reported that low-frequency missense variants of the chaperone protein accompanying CCT6A were significantly associated with survival in patients with non-small cell lung cancer.[35] Using the TCGA database, Klimczak M et al on the other hand reported that the overexpression of CCT6A in breast cancer was a significant contributor to poor prognosis.[16] In a study on colon adenocarcinoma, it was also reported that high expression of the CCT6A promoted tumor cell growth, and was also associated with low survival rate of such patients.[12] CCT6A has also reported to be strongly association with survival and prognosis in renal cancer, with patients with altered CCT6A mRNA (stage I-IV) having significantly shorter OS compared to healthy controls.[4] Thus, the CCT6A gene plays a key role in the development and prognosis prediction of many tumors. These reports are consistent with our research. Notably, patients in the high CCT6A expression group had lower survival probability compared with the low CCT6A expression group. Additionally, most patients with EFS ≤ 5 years had high expression levels of the CCT6A gene. These results therefore suggest that ES patients with elevated CCT6A gene expression may have low survival probability and an EFS ≤ 5 years. Another noteworthy point from our results is that the median CCT6A gene expression in patients from the metastatic group was much higher than that of patients from the primary tumor group and tumor recurrence group. Thus, suggesting there is a relationship between the high expression of CCT6A gene and tumor metastasis. Tumor metastasis has been well documented to be a vital factor in patient mortality.[19] The high expression of CCT6A could be accompanied by tumor metastasis and reduction of EFS ≤ 5 years. In other words, high expression of the CCT6A gene could serve as an important biomarker for the prediction of ES prognosis. The detection of elevated expression levels of CCT6A gene in a given ES patient, could predict lower survivability and high probability of an EFS ≤ 5 years than those without elevated expression. In addition, our immunohistochemical staining of ES and and paracancerous tissue samples revealed that ES tissue samples showed abundant expression CCT6A proteins confirming the accuracy of our analysis.
Our KEGG and GO enrichment analysis further corroborated our results. The KEGG enrichment analysis revealed that the differentially expressed genes were mainly distributed in cell cycle, DNA replication, mismatch repair, cellular senescence and other pathways. In 2001, it was reported that the dysregulation of cellular proliferation and a number of other factors involved in cell cycle constitute the minimum requirement for tumor pathogeneis.[5] Recent progress in DNA replication research has revealed relationships between it and cancer development. The dysregulation of DNA replication could result in genomic instability, an important feature of cancer formation.[15] Tumors often develop due to errors in DNA replication and a combination of other factors such as environmental factors and genetic mutations.[30] The mismatch repair pathway has been reported to plays an important role in the development of many tumors,[1,2,7] cellular senescence, which refers to a permanent state of cell cycle arrest, can lead to a decrease in the regenerative potential and tissue function of an aging organism, leading to tumorigenesis.[11] Another way in which aging could promotes cancer progression is via the promotion of pathological cell proliferation.[3] Our aforementioned KEGG pathway enrichment results revealed that the pathways of the differential genes in this study were strongly associated with tumor initiation, development, and progression. Our GO enrichment analysis on the other hand revealed CCT6A as the main enriched DNA biosynthetic pathway. We therefore conjectured that the CCT6A gene likely promoted ES development by regulating the DNA biosynthetic processes. A total of 13 genes in the protein reciprocal network are closely associated with CCT6A, and all 13 genes are also closely related to cancer development. Among them, high expression of CSE1L gene has been reported to be positively correlation with high cancer staging and poor prognosis.[28] Meanwhile, higher expression of CCT2 gene has also been reported to reduce the survival rate of colorectal cancer patients.[23] The elevated expression of CCNE2 gene is also correlated with shorter OS in hepatocellular carcinoma.[26] Thus, all these genes linked to CCT6A are significantly associated with tumor development.
The results of this study clearly reveal that the expression level of CCT6A is higher in ES patients, and that high expression of CCT6A is associated with poor prognosis. The differentially expressed genes in the GO enrichment analysis were mainly involved in DNA biosynthesis, conformational changes, chromosomal regions, catalytic activity, as well as act on the DNA. Our KEGG pathway enrichment analysis revealed that the mainly expressed genes were involved in cell cycle, DNA replication, mismatch repair, and cellular senescence pathways. Our protein interaction network also suggested that all the genes linked to CCT6A were associated with cancer development. Our survival curve analysis revealed that patients with high expression of the CCT6A gene had a much lower survivability than those without. Also, patients with EFS ≤ 5 years had much higher expression levels of the CCT6A gene, and that the high expression levels of CCT6A were associated with tumor metastasis. The results of immunohistochemical analysis also clearly showed that CCT6A stained abundantly in ES specimens but not obviously in paracancerous tissue specimens, further corroborating the accuracy of our analysis. Thus, all these results suggest that CCT6A could act as a potential biomarker for the prediction of ES prognosis.
In this study, we analyzed gene table and clinical data from a bioinformatics perspective in order to identify a potential biomarkers for the prediction of ES prognosis. There is therefore the presence of limitation such as the lack of extensive experimentations and verification of the genes, and whether such an extensive testing would arrive at the same conclusion.
5. Conclusion
CCT6A could be used as an effective biomarker for the prediction of ES prognosis. The high expression levels of CCT6A could also predict a ≤ 5-year EFS rate.
Acknowledgments
We thank to the doctors and nurses of the department of orthopaedic surgery for their support and encouragement.
Author contributions
Study Design: Jie Jiang, Chong Liu, and Xinli Zhan. Data collection and analysis: Zhaojie Qin, Chaojie Yu, Tuo Liang, Shian Liao, Jiang Xue, Haopeng Zeng, Guoyong Xu, Zide Zhang, Zhaojun Lu, Zequn Wang, Jiarui Chen, Tianyou Chen and Hao Li. Manuscript writing and revision: Jie Jiang. Chong Liu and Xinli Zhan. All authors read and approved the final manuscript.
Conceptualization: Jie Jiang, Chong Liu, Chaojie Yu, Xinli Zhan.
Data curation: Jie Jiang, Chong Liu, Guoyong Xu, Tuo Liang, Zide Zhang, Jiarui Chen, Tianyou Chen, Hao Li, Xinli Zhan.
Formal analysis: Jie Jiang, Chong Liu, Guoyong Xu, Tuo Liang, Shian Liao, Zide Zhang, Zhaojun Lu, Jiarui Chen, Xinli Zhan.
Funding acquisition: Guoyong Xu, Tuo Liang, Chaojie Yu, Shian Liao.
Investigation: Jie Jiang, Chong Liu, Guoyong Xu, Tuo Liang, Zequn Wang, Xinli Zhan.
Methodology: Jie Jiang, Chong Liu, Hao Li, Xinli Zhan.
Project administration: Jie Jiang, Chong Liu, Tuo Liang, Xinli Zhan.
Resources: Jie Jiang, Chong Liu, Tuo Liang, Zequn Wang, Xinli Zhan.
Software: Jie Jiang, Chong Liu, Tuo Liang, Tianyou Chen, Xinli Zhan.
Supervision: Jie Jiang, Chong Liu, Xinli Zhan.
Validation: Jie Jiang, Chong Liu, Xinli Zhan.
Visualization: Jie Jiang, Chong Liu, Xinli Zhan.
Writing – original draft: Jie Jiang, Chong Liu, Xinli Zhan.
Writing – review & editing: Jie Jiang, Chong Liu, Xinli Zhan.
Glossary
Abbreviations: CCT6A = chaperonin containing TCP1 complex6A, DEGs = differentially expressed genes, EFS = event-free survival, ES = Ewing sarcoma, GO = genome ontology, OS = overall survival.
References
- [1].Arend RC, Jones BA, Martinez A, et al. Endometrial cancer: molecular markers and management of advanced stage disease. Gynecol Oncol 2018;150:569–80. [DOI] [PubMed] [Google Scholar]
- [2].Baretti M, Le DT. DNA mismatch repair in cancer. Pharmacol Ther 2018;189:45–62. [DOI] [PubMed] [Google Scholar]
- [3].Campisi J. Aging, cellular senescence, and cancer. Annu Rev Physiol 2013;75:685–705. [DOI] [PMC free article] [PubMed] [Google Scholar]
- [4].Di Meo A, Batruch I, Brown MD, et al. Searching for prognostic biomarkers for small renal masses in the urinary proteome. Int J Cancer 2020;146:2315–25. [DOI] [PubMed] [Google Scholar]
- [5].Evan GI, Vousden KH. Proliferation, cell cycle and apoptosis in cancer. Nature 2001;411:342–8. [DOI] [PubMed] [Google Scholar]
- [6].Ferguson JL, Turner SP. Bone cancer: diagnosis and treatment principles. Am Fam Physician 2018;98:205–13. [PubMed] [Google Scholar]
- [7].Fishel R. Mismatch repair. J Biol Chem 2015;290:26395–403. [DOI] [PMC free article] [PubMed] [Google Scholar]
- [8].Gaspar N, Hawkins DS, Dirksen U, et al. Ewing sarcoma: current management and future approaches through collaboration. J Clin Oncol 2015;33:3036–46. [DOI] [PubMed] [Google Scholar]
- [9].Gaudet P, Dessimoz C. Gene ontology: pitfalls, biases, and remedies. Methods Mol Biol 2017;1446:189–205. [DOI] [PubMed] [Google Scholar]
- [10].Hallal S, Russell BP, Wei H, et al. Extracellular vesicles from neurosurgical aspirates identifies chaperonin containing TCP1 subunit 6A as a potential glioblastoma biomarker with prognostic significance. Proteomics 2019;19:e1800157. [DOI] [PubMed] [Google Scholar]
- [11].Hernandez-Segura A, Nehme J, Demaria M. Hallmarks of cellular senescence. Trends Cell Biol 2018;28:436–53. [DOI] [PubMed] [Google Scholar]
- [12].Hu M, Fu X, Si Z, et al. Identification of differently expressed genes associated with prognosis and growth in colon adenocarcinoma based on integrated bioinformatics analysis. Front Genet 2019;10:1245. [DOI] [PMC free article] [PubMed] [Google Scholar]
- [13].Huang K, Zeng Y, Xie Y, et al. Bioinformatics analysis of the prognostic value of CCT6A and associated signalling pathways in breast cancer. Mol Med Rep 2019;19:4344–52. [DOI] [PMC free article] [PubMed] [Google Scholar]
- [14].Kanehisa M, Furumichi M, Tanabe M, et al. KEGG: new perspectives on genomes, pathways, diseases and drugs. Nucleic Acids Res 2017;45:D353–61. [DOI] [PMC free article] [PubMed] [Google Scholar]
- [15].Kitao H, Iimori M, Kataoka Y, et al. DNA replication stress and cancer chemotherapy. Cancer Sci 2018;109:264–71. [DOI] [PMC free article] [PubMed] [Google Scholar]
- [16].Klimczak M, Biecek P, Zylicz A, et al. Heat shock proteins create a signature to predict the clinical outcome in breast cancer. Sci Rep 2019;9:7507. [DOI] [PMC free article] [PubMed] [Google Scholar]
- [17].Ma Y-S, Huang T, Zhong X-M, et al. Proteogenomic characterization and comprehensive integrative genomic analysis of human colorectal cancer liver metastasis. Mol Cancer 2018;17:139. [DOI] [PMC free article] [PubMed] [Google Scholar]
- [18].Mair P, Hofmann E, Gruber K, et al. Motivation, values, and work design as drivers of participation in the R open source project for statistical computing. Proc Natl Acad Sci U S A 2015;112:14788–92. [DOI] [PMC free article] [PubMed] [Google Scholar]
- [19].Massagué J, Obenauf AC. Metastatic colonization by circulating tumour cells. Nature 2016;529:298–306. [DOI] [PMC free article] [PubMed] [Google Scholar]
- [20].MER, BP, DW, YH, CWL, WS, et al. limma powers differential expression analyses for RNA-sequencing and microarray studies 2015;43:e47. [DOI] [PMC free article] [PubMed] [Google Scholar]
- [21].Montoya C, Rey L, Rodriguez J, et al. Epigenetic control of the EWSFLI1 promoter in Ewing sarcoma. Oncol Rep 2020;43:1199–207. [DOI] [PMC free article] [PubMed] [Google Scholar]
- [22].Orth MF, Holting TLB, Dallmayer M, et al. High specificity of BCL11B and GLG1 for EWSR1-FLI1 and EWSR1-ERG positive Ewing sarcoma. Cancers (Basel) 2020;12: [DOI] [PMC free article] [PubMed] [Google Scholar]
- [23].Park SH, Jeong S, Kim BR, et al. Activating CCT2 triggers Gli-1 activation during hypoxic condition in colorectal cancer. Oncogene 2020;39:136–50. [DOI] [PubMed] [Google Scholar]
- [24].Savola S, Klami A, Myllykangas S, et al. High expression of complement component 5 (C5) at tumor site associates with superior survival in Ewing sarcoma family of tumour patients. ISRN Oncol 2011;2011:168712. [DOI] [PMC free article] [PubMed] [Google Scholar]
- [25].Shannon P, Markiel A, Ozier O, et al. Cytoscape: a software environment for integrated models of biomolecular interaction networks. Genome Res 2003;13:2498–504. [DOI] [PMC free article] [PubMed] [Google Scholar]
- [26].Sonntag R, Giebeler N, Nevzorova YA, et al. Cyclin E1 and cyclin-dependent kinase 2 are critical for initiation, but not for progression of hepatocellular carcinoma. Proc Natl Acad Sci U S A 2018;115:9282–7. [DOI] [PMC free article] [PubMed] [Google Scholar]
- [27].Szklarczyk D, Morris JH, Cook H, et al. The STRING database in 2017: quality-controlled protein-protein association networks, made broadly accessible. Nucleic Acids Res 2017;45:D362–8. [DOI] [PMC free article] [PubMed] [Google Scholar]
- [28].Tai C-J, Hsu C-H, Shen S-C, et al. Cellular apoptosis susceptibility (CSE1L/CAS) protein in cancer metastasis and chemotherapeutic drug-induced apoptosis. J Exp Clin Cancer Res 2010;29:110. [DOI] [PMC free article] [PubMed] [Google Scholar]
- [29].Tanic N, Brkic G, Dimitrijevic B, et al. Identification of differentially expressed mRNA transcripts in drug-resistant versus parental human melanoma cell lines. Anticancer Res 2006;26:2137–42. [PubMed] [Google Scholar]
- [30].Tomasetti C, Li L, Vogelstein B. Stem cell divisions, somatic mutations, cancer etiology, and cancer prevention. Science 2017;355:1330–4. [DOI] [PMC free article] [PubMed] [Google Scholar]
- [31].Vilar-Gomez E, Chalasani N. Non-invasive assessment of non-alcoholic fatty liver disease: clinical prediction rules and blood-based biomarkers. J Hepatol 2018;68:305–15. [DOI] [PubMed] [Google Scholar]
- [32].Walter W, Sánchez-Cabo F, Ricote M. GOplot: an R package for visually combining expression data with functional analysis. Bioinformatics 2015;31:2912–4. [DOI] [PubMed] [Google Scholar]
- [33].Yu G, Wang L-G, Han Y, et al. clusterProfiler: an R package for comparing biological themes among gene clusters. OMICS 2012;16:284–7. [DOI] [PMC free article] [PubMed] [Google Scholar]
- [34].Zeng G, Wang J, Huang Y, et al. Overexpressing CCT6A contributes to cancer cell growth by affecting the G1-To-S phase transition and predicts a negative prognosis in hepatocellular carcinoma. Onco Targets Ther 2019;12:10427–39. [DOI] [PMC free article] [PubMed] [Google Scholar]
- [35].Zhu M, Geng L, Shen W, et al. Exome-wide association study identifies low-frequency coding variants in 2p23.2 and 7p112 associated with survival of non-small cell lung cancer patients. J Thorac Oncol 2017;12:644–56. [DOI] [PubMed] [Google Scholar]


