Fig. 5.
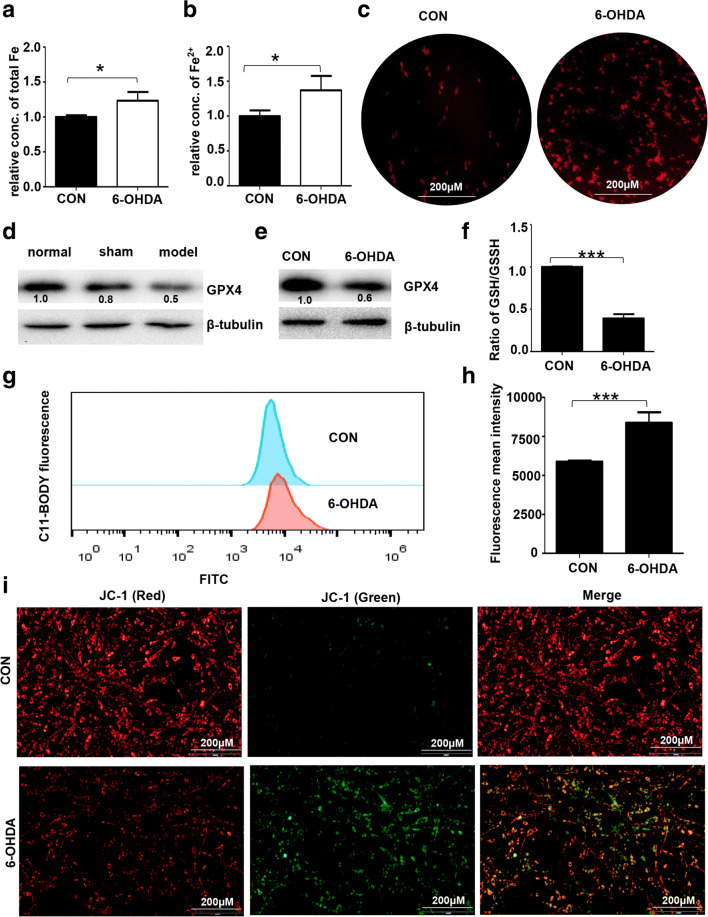
Induction of ferroptosis in the 6-OHDA model of PD. (A, B) PC-12 cells were treated with 40 μM 6-OHDA for 24 h. The levels of total iron and Fe2+ were measured by the Iron Assay Kit. (C) Iron staining (red) was performed using a FeRhoNox-1 fluorescent imaging probe as described in the “Materials and Methods” section. The expression of GPX4 in rat SN tissue (D) and PC-12 cells (E) treated with 6-OHDA was analyzed by Western blotting. The data were normalized to the control group values. (F) The ratio of GSH/GSSG in PC-12 cells was detected using the GSH/GSSG-Glo Assay (Promega). (G) Fluorescent BODIPY staining and FACS analysis (H) were used to evaluate the formation of lipid peroxides in PC-12 cells. (I) JC-1 staining was employed to assess mitochondrial damage by measuring the ratio of green to red fluorescence as described in the “Materials and Methods” section (n > 3 assays, t test, *p < 0.05, ***p < 0.001)

