Abstract
S100 binding protein A16 (S100A16) expression levels are closely associated with microRNA (miRNA) processing. Higher levels of S100A16 are reported during the progression of many cancers. Our study mainly explored the interaction between S100A16 and miR-6884-5p in gastric cancer (GC). Quantitative real-time polymerase chain reaction (qRT-PCR) was used to determine the level of S100A16 and miR-6884-5p in GC tissues and cell lines. The si-S100A16, pcDNA-S100A16, miR-6884-5p mimic or inhibitor was transfected into GC cells, and the effects of S100A16 and miR-6884-5p on the proliferation, invasion, and epithelial–mesenchymal transition (EMT) were explored by qRT-PCR and Western blot assays. Luciferase assays were performed to validate S100A16 as an miR-6884-5p target in GC cells. In our study, we found that the level of miR-6884-5p was significantly decreased and the expression of S100A16 was significantly increased in GC tissues and cell lines. There was a close association between these changes. Knockdown of S100A16 significantly inhibited the proliferation, invasion, and EMT of GC cells. The bioinformatics analysis predicted that S100A16 is a potential target gene of miR-6884-5p, and the luciferase reporter assay confirmed that miR-6884-5p could directly target S100A16. Introduction of miR-6884-5p to GC cells had similar effects to S100A16 silencing. Overexpression of S100A16 in GC cells partially reversed the inhibitory effects of the miR-6884-5p mimic. miR-6884-5p inhibited the proliferation, invasion, and EMT of GC cells by directly decreasing S100A16 expression.
Key words: Gastric cancer (GC), MicroRNA-6884-5p, S100 binding protein A16, Proliferation, Invasion, Epithelial–mesenchymal transition (EMT)
INTRODUCTION
Gastric cancer (GC) is one of the most common malignancies worldwide. Despite its declining incidence, GC remains as the second leading cause of cancer-related deaths1,2. Although the diagnosis and treatment for GC have made great progress, and basic and clinical studies have been conducted in recent years, its long-term outcome remains poor3. The etiology of GC is a complex process that involves the activation of oncogenes and the inactivation of tumor suppressor genes at different stages. However, its exact pathogenesis remains unclear4. Hence, there is still an urgent need to explore novel and special promising predictive factors to improve the prognosis of GC.
The S100 protein family consists of at least 25 distinct members and is composed of EF-hand-type calcium-binding proteins and plays roles in intra- and extracellular functions involved in the regulation of diverse cellular processes such as contraction, motility, cell growth, differentiation, cell cycle progression, and secretion5,6. Recently, the S100 protein family has been implicated in multiple stages of tumor progression such as cell proliferation, migration, invasion, and apoptosis. Moreover, expression of the S100 protein family is detected in many human cancers and has been correlated with a poorer prognosis7. High expression of S100A16 was found in several cancers such as breast cancer, oral squamous cell carcinoma, prostate cancer, colorectal cancer, lung adenocarcinoma, and cervical carcinoma8–13. However, the expression and its role of S100A16 in GC are still unknown.
Many studies have reported that microRNAs (miRNAs) can regulate cellular proliferation, differentiation, apoptosis, and invasion, as well as cancer initiation and progression14–16. Actually, a number of reports demonstrated that miRNAs were differentially expressed in GC17-19. miR-17-5p acted as an oncogene, and knockdown of miR-17-5p significantly inhibited proliferation, migration, invasion, and epithelial–mesenchymal transition (EMT) of GC cells through regulating phosphatase and tensin homolog (PTEN) signaling17. Overexpression of miR-448 suppressed the proliferation of GC cells by directly decreasing ADAM10 expression18. Introduction of miR-199a-5p significantly promoted migration and invasion of GC cells by directly targeting klotho expression19. In this study, we found that miR-6884-5p could directly regulate the expression of S100A16. However, the expression and the role of miR-6884-5p are still unknown in GC.
Therefore, our study aimed to elucidate the expression of S100A16 and its effects on the biological behavior of GC cells according to gain-of-function or loss-of function cell models by overexpression or silencing of S100A16. Combined with bioinformatics prediction and dual-luciferase assay, we verified whether miR-6884-5p directly targets S100A16, and investigated the effect of miR-6884-5p on the proliferation, invasion, and EMT of GC cells. The miR-6884-5p/S100A16 axis may provide theoretical basis for application in the diagnosis and treatment of GC.
MATERIALS AND METHODS
Human Tissue Samples
A total of 30 GC tissue samples and matched adjacent nontumor tissues were obtained from patients with histologically confirmed GC at the Department of Oncology, Henan Cancer Hospital between 2017 and 2019. The eligibility criteria for the present study were as follows: (1) patients with no history of gastrectomy or other malignancies, (2) patients with no distant metastasis or peritoneal dissemination, and (3) the number of dissected lymph nodes was not less than 15. The exclusion criteria were as follows: (1) patients who underwent palliative surgery, and (2) patients who received treatment such as chemotherapy, or radiation therapy, prior to radical surgery. The tissue samples were immediately frozen using liquid nitrogen. The study was performed with the approval of the Clinical Research Ethics Committee of Henan Cancer Hospital, and all patients gave written informed consent for the use of the tissue samples for research purposes.
Cell Lines and Transfection
Five human GC cell lines (AGS, MKN45, BGC-823, SGC-7901, and MGC-803) and an immortalized normal human fallopian tube epithelial cell line FTE187 cells were purchased from the American Type Culture Collection (ATCC; Manassas, VA, USA). They were cultured in Dulbecco’s modified Eagle’s medium (DMEM; Gibco, Waltham, MA, USA) supplemented with 10% fetal bovine serum (FBS; Gibco). All cell lines were incubated in a humidified chamber with 5% CO2 at 37°C.
The miR-6884-5p mimics, inhibitor, and corresponding negative controls were synthesized and purchased from RiboBio Company (Guangzhou, China). The specific small interfering RNA (siRNA) for S100A16 and corresponding negative control were synthesized and purchased from GenePharma Company (Shanghai, China). Transfection was performed by using Lipofectamine 3000 (Invitrogen, Carlsbad, CA, USA) according to the manufacturer’s instructions.
Cell Counting Kit-8 (CCK-8) Assay
Cell growth was measured using the cell proliferation reagent WST-8 (Roche Biochemicals, Indianapolis, IN, USA). Cells (1.0 × 10³/well) were plated in 96-well microtiter plates (Corning Costar, Corning, NY, USA), and then the CCK-8 agent (10 μl/well) was added to each well at the time of harvest according to the manufacturer’s protocols. One hour after adding the CCK-8, cellular viability was determined by measuring the absorbance of the converted dye at 450 nm.
In Vitro Invasion Assay
For invasion assays, 1 × 10⁵ cells in serum-free medium were placed into the upper chamber of an insert coated with Matrigel (Sigma-Aldrich, St. Louis, MO, USA). Medium containing 10% FBS was added to the lower chamber as a chemoattractant. After 24 h of incubation, cells remaining on the upper membrane were removed, whereas cells that had migrated or invaded to the lower membrane were stained with 0.1% crystal violet. The membranes were then rinsed with 30% glacial acetic acid. Finally, the washing solution was measured by a microplate reader (Bio-Rad, Hercules, CA, USA) at 540 nm for the counting of the number of GC cells.
Measurement of MMP-2, MMP-9, and TIMP-1 Levels by ELISA Assay
According to the protocol, the supernatants of MKN45 and SGC-7901 cells were collected after treatment, and the concentrations of matrix metalloproteinase-2 (MMP-2), MMP-9, and tissue inhibitor of metalloproteinase-1 (TIMP-1) were measured using a sandwich enzyme-linked immunosorbent assay (ELISA) kit (USCN Life Science, Wuhan, China) according to the manufacturer’s instruction. Briefly, the primary antibody was coated onto ELISA plates and incubated for 2 h at room temperature. Samples and standards were added to the wells and incubated for 1 h. The wells were then washed, and a biotinylated antibody was added for 1 h. The plates were washed again, and streptavidin conjugated to horseradish peroxidase (HRP) was added for 10 min. After washing, tetramethylbenzidine was added for color development, and the reaction was terminated with 1 mol/L H2SO4. Absorbance was measured at 490 nm. Values were expressed as ng/ml.
RNA Extraction and Quantitative Real-Time Polymerase Chain Reaction (PCR)
Total RNA was extracted from cervical cancer tissues and cell lines by TRIzol reagent (Invitrogen) according to the manufacturer’s protocol. Reverse transcription and quantitative real-time PCR (qRT-PCR) were performed by using the One Step PrimeScript miRNA cDNA Synthesis Kit (TaKaRa Biotechnology, Tokyo, Japan) according to the manufacturer’s protocol on the ABI 7500 Fast Real-Time PCR system (Applied Biosystems, Foster City, CA, USA). Glyceraldehyde-3-phosphate dehydrogenase (GAPDH) and U6 were used as internal controls for normalization and quantification, respectively, of S100A2, S100A4, S100A6, S100A7, S100A8, S100A14, S100A16, and miR-6884-5p expressions. The relative expression of genes was analyzed and calculated by using the 2−ΔΔCt method. Primer sequences are shown in Table 1.
Table 1.
Sequence of Primers for qRT-PCR
| Gene | Primer Sequence |
|---|---|
| S100A2 | F: 5′-TGCCAAGAGGGCGACAAGTTCA-3′ |
| R: 5′-AAGTCCACCTGCTGGTCACTGT-3′ | |
| S100A4 | F: 5′-CAGAACTAAAGGAGCTGCTGACC-3′ |
| R: 5′-CTTGGAAGTCCACCTCGTTGTC-3′ | |
| S100A6 | F: 5′-GTGACAAGCACACCCTGAGCAA-3′ |
| F: 5′-GGAAGTTCACCTCCTGGTCCTT-3′ | |
| S100A7 | F: 5′-AGAAGCCAAGCCTGCTGACGAT-3′ |
| R: 5′-GTCCTTTTTCTCAAAGACATCGGC-3′ | |
| S100A8 | F: 5′-ATGCCGTCTACAGGGATGACCT-3′ |
| R: 5′-AGAATGAGGAACTCCTGGAAGTTA-3′ | |
| S100A14 | F: 5′-CCTCATCAAGAACTTTCACCAGTA-3′ |
| R: 5′-GGTTGGCAATTTTCTCTTCCAGG-3′ | |
| S100A16 | F: 5′-GCTCCAGAAAGAGCTGAACCAC-3′ |
| R: 5′-ATGCCGCCTATCAAGGTCCAGT-3′ | |
| miR-6884-5p | F: 5′-AGAGGCTGAGAAGGTGATGT-3′ |
| R: 5′-GAACATGTCTGCGTATCTC-3′ | |
| U6 | F: 5′-CTCGCTTCGGCAGCACA-3′ |
| R: 5′-AACGCTTCACGAATTTGCGT-3′ | |
| GAPDH | F: 5′-GAGTCAACGGATTTGGTCGTATTG-3′ |
| R: 5′-CCTGGAAGATGGTGATGGGATT-3′ |
Luciferase Reporter Assay
The 3′-untranslated region (3′-UTR) of S100A16 containing the wild-type or mutant miR-6884-5p binding site was designed and cloned into the pGL3 plasmid (Invitrogen) according to the manufacturer’s protocol. Cells were seeded in 24-well plates and cotransfected with plasmid pGL3-S100A16-3′-UTR-WT or pGL3-S100A16-3′-UTR-MUT and miR-6884-5p mimics or negative control by using Lipofectamine 3000. Cells were collected 48 h after transfection, and relative luciferase activities were measured by a dual-luciferase reporter assay (Promega, Madison, WI, USA) according to the manufacturer’s instruction. Renilla luciferase was used for normalization.
Western Blot
Proteins were extracted by radioimmunoprecipitation assay (RIPA) lysis buffer, and the concentrations were detected by using BCA Protein Assay Kit (Beyotime, Shanghai, China). Equal amounts of protein samples were fractionated by using 10% sodium dodecyl sulfate polyacrylamide gel electrophoresis (SDS-PAGE), transferred onto polyvinylidene difluoride (PVDF) membranes, and blocked with 5% nonfat milk for 30 min at room temperature. Membranes were probed with primary antibodies against S100A16 (ab130419), proliferating cell nuclear antigen (PCNA) (ab92552), CDK2 (ab32147), cyclin E1 (ab33911), p21 (ab109520), and GAPDH (ab181602) (Abcam, Cambridge, MA, USA); E-cadherin (#14472), N-cadherin (#13116), and vimentin (#5741) (Cell Signaling Technology Inc., Danvers, MA, USA) at 4°C overnight, followed by incubation with HRP-conjugated secondary antibodies. GAPDH was used as an endogenous protein for normalization. Results were detected by using the Odyssey Scanning system (Li-Cor, Lincoln, NE, USA).
Statistical Analysis
The data are expressed as the mean ± standard error of the mean (SEM). The number of independent experiments is represented by “n.” Correlations between miR-6884-5p and S100A16 mRNA levels were analyzed using Pearson’s correlation coefficient. Multiple comparisons were performed using one-way analysis of variance (ANOVA) followed by Tukey’s multiple-comparison test. Other comparisons were analyzed using two-tailed Student’s t-test. A value of p < 0.05 was considered a statistically significant difference.
RESULTS
The Expression of S100A16 Was Upregulated in GC Tissues and Cell Lines
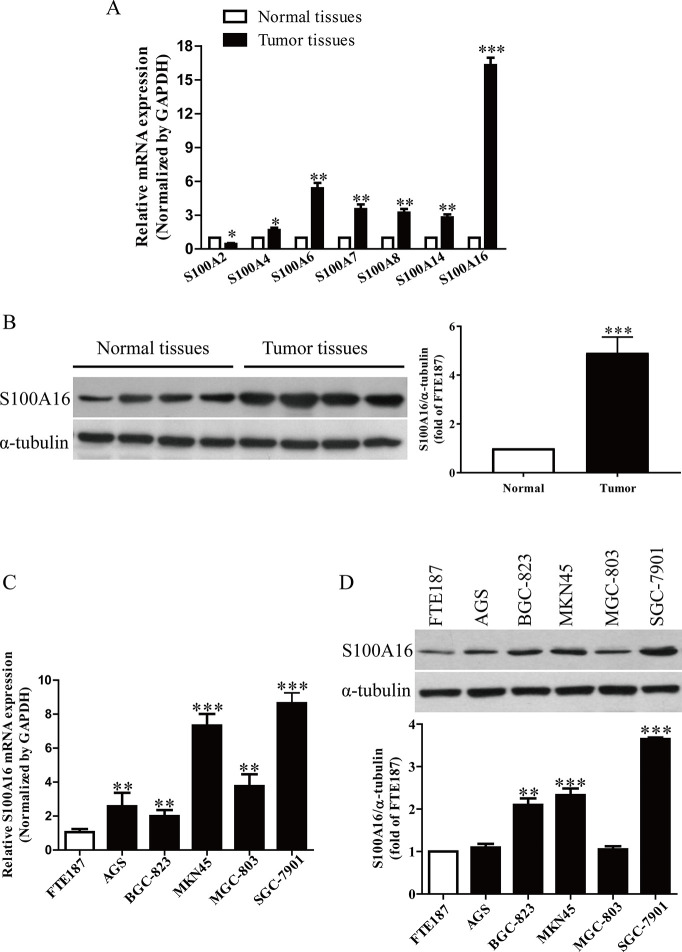
It has been reported that S100 proteins such as S100A2, S100A4, S100A6, S100A7, S100A8, S100A14, and S100A16 were closely associated with cancers7. In this study, we detected these seven S100 genes in GC tissues. The results showed that the mRNA level of S100A16 was the highest in GC tissues among these seven S100 genes compared with the adjacent tissues (Fig. 1A). We also found that the protein expression of S100A16 was significantly increased in tumor tissues compared with the adjacent tissues (Fig. 1B). Subsequently, we also determined the mRNA and protein levels of S100A16 in GC cell lines such as AGS, BGC-823, MKN45, MGC-803, SGC-7901, and in immortalized normal human fallopian tube epithelial cell line FTE187 cells. Compared with FTE187, the expressions of S100A16 in MKN45 and SGC-7901 cells were higher than those in the other three GC cell lines (Fig. 1C and D). Therefore, MKN45 and SGC-7901 cells were used in the following experiments.
Figure 1.
The levels of S100A16 in gastric cancer (GC) tissues and cell lines. (A) The mRNA levels of S100A2, S100A4, S100A6, S100A7, S100A8, S100A14, and S100A16 in GC tissues and their corresponding adjacent normal tissues. (B) The protein expressions of S100A16 in GC tissues and their corresponding adjacent normal tissues. The mRNA (C) and protein (D) expressions of S100A16 analyzed by real-time quantitative polymerase chain reaction (qRT-PCR) in GC cell lines (AGS, BGC-823, MKN45, MGC-803, and SGC-7901) and an immortalized normal human fallopian tube epithelial cell line FTE187 cells. All data are presented as mean ± standard error of the mean (SEM), n = 6. *p < 0.05, **p < 0.01, ***p < 0.001 versus normal tissues or FTE187.
Knockdown of S100A16 Inhibits Proliferation, Invasion, and EMT of GC Cells
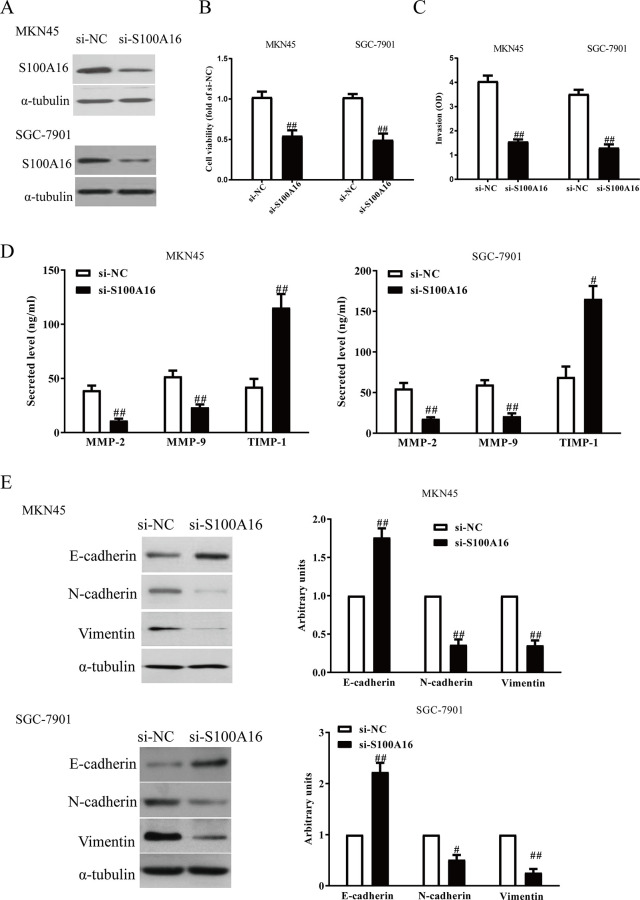
To explore the roles of S100A16 in GC cells, the MKN45 and SGC-7901 cells were transfected with si-NC or si-S100A16. The Western blot analysis showed that expression of S100A16 was significantly decreased at the mRNA and protein levels in MKN45 and SGC-7901 cells transfected with si-S100A16 (Fig. 2A). The results from the CCK-8 assay demonstrated that downregulation of S100A16 restrained proliferation of GC cells (Fig. 2B). The Transwell assay revealed that downregulation of S100A16 suppressed invasion of GC cells (Fig. 2C). Moreover, decreased S100A16 expression could significantly reduce total expressions of MMP-2 and MMP-9 and enhance expression of TIMP-1 in MKN45 and SGC-7901 cells (Fig. 2D). In addition, silencing of S100A16 contributed to the upregulation of E-cadherin and the downregulation of N-cadherin and vimentin (Fig. 2E).
Figure 2.
S100A16 silencing could inhibit the invasion and epithelial–mesenchymal transition (EMT) in GC cells. MKN45 and SGC-7901 cells were transfected with si-S100A16 or si-NC. (A) The protein levels of S100A16 were determined by Western blot. (B) Cell proliferation was detected by cell counting kit-8 (CCK-8). (C) The invasion of GC cells was assessed by Transwell assay. (D) Levels of total matrix metalloproteinase-2 (MMP-2), MMP-9, and tissue inhibitor of metalloproteinase-1 (TIMP-1) were detected in the culture supernatants of cultured GC cells by enzyme-linked immunosorbent assay (ELISA) assays. (E) The expressions of E-cadherin, N-cadherin, and vimentin were determined by qRT-PCR. All data are presented as mean ± SEM, n = 4. #p < 0.05, ##p < 0.01 versus si-NC.
miR-6884-5p Directly Targets S100A16 in GC Cells
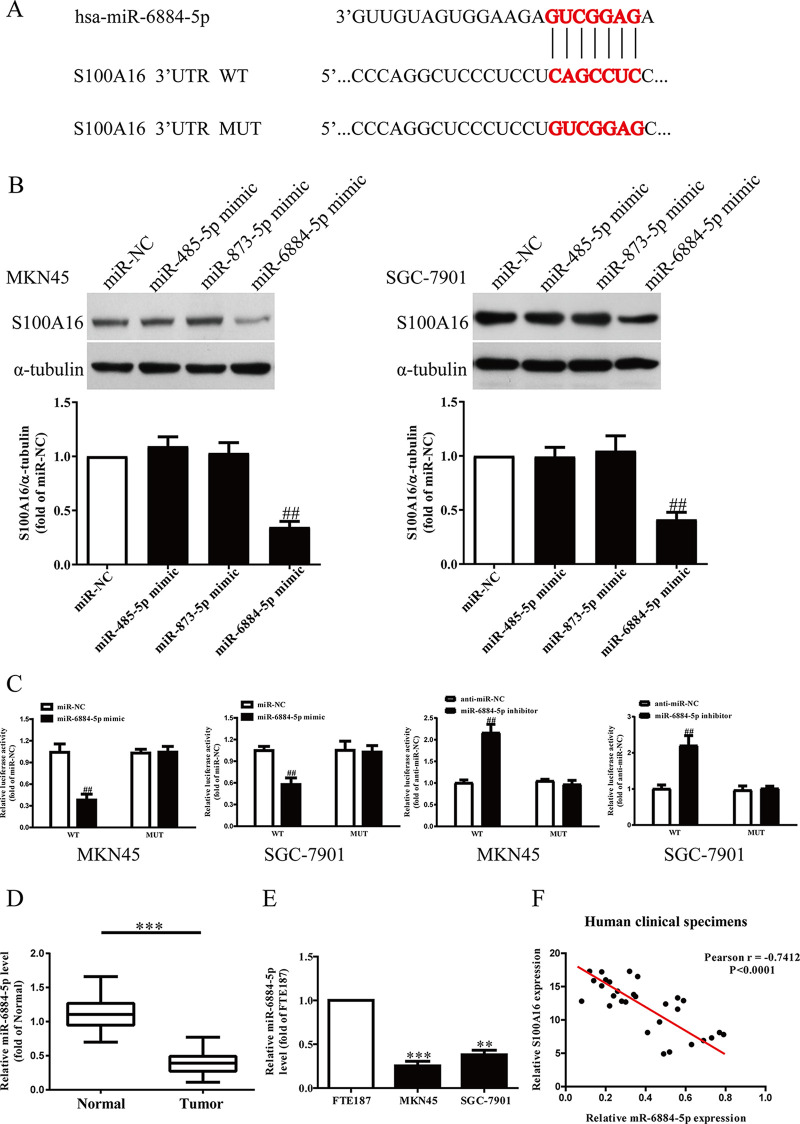
Based on the TargetScan 7.2 database, we predicted that miR-485-5p, miR-873-5p, and miR-6884-5p might directly target S100A16 (Fig. 3A). We found that only overexpression of miR-6884-5p could significantly decrease S100A16 expression in MKN45 and SGC-7901 cells after transfection with miR-485-5p, miR-873-5p, or miR-6884-5p mimic, respectively (Fig. 3B). Moreover, luciferase reporter assays also confirmed that miR-6884-5p directly targeted S100A16. S100A16 3′-UTR was cloned into a luciferase reporter vector, and the putative miR-6884-5p binding site in the S100A16 3′-UTR was mutated (Fig. 3A). Our data showed that upregulation of miR-6884-5p markedly inhibited the luciferase activity of pGL3-S100A16-3′-UTR-WT (Fig. 3C). Mutation of the miR-6884-5p-binding site in the S100A16 3′-UTR abolished the effect of miR-6884-5p (Fig. 3C), which indicated that miR-6884-5p directly and negatively regulated the expression of S100A16. Next, our results showed that the level of miR-6884-5p in the GC tissues was significantly lower in comparison to the adjacent tissues (Fig. 3D). We also demonstrated that miR-6884-5p expression was markedly downregulated in MKN45 and SGC-7901 cells compared to that in FTE187, as shown in Figure 3E. To determine whether the S100A16 expression was closely related to the miR-6884-5p level in GC tissues, the Pearson’s correlation analysis revealed a significant negative correlation between S100A16 and miR-6884-5p (Fig. 3F).
Figure 3.
S100A16 was a direct target of miR-6884-5p. (A) Schematic representation of S100A16 3′-untranslated regions (3′-UTRs) showing putative microRNA (miRNA) target site. (B) The protein levels of S100A16 were determined by Western blot in MKN45 and SGC-7901 cells transfected with miR-NC, miR-485-5p, miR-873-5p, or miR-6884-5p mimic, respectively. (C) The analysis of the relative luciferase activities of S100A16-WT and S100A16-MUT in GC cells. (D) Relative miR-6884-5p level in GC tissues and their corresponding adjacent normal tissues. (E) Relative miR-6884-5p levels analyzed by qRT-PCR in MKN45, SGC-7901, and FTE187 cells. (F) Pearson’s correlation analysis of the relative miR-6884-5p levels of and the relative S100A16 mRNA levels in GC tissues. All data are presented as mean ± SEM, n = 4. ##p < 0.01 versus miR-NC or anti-miR-NC. **p < 0.01, ***p < 0.001 versus normal tissues or FTE187.
Effects of miR-6884-5p on the Proliferation and Invasion of GC Cells
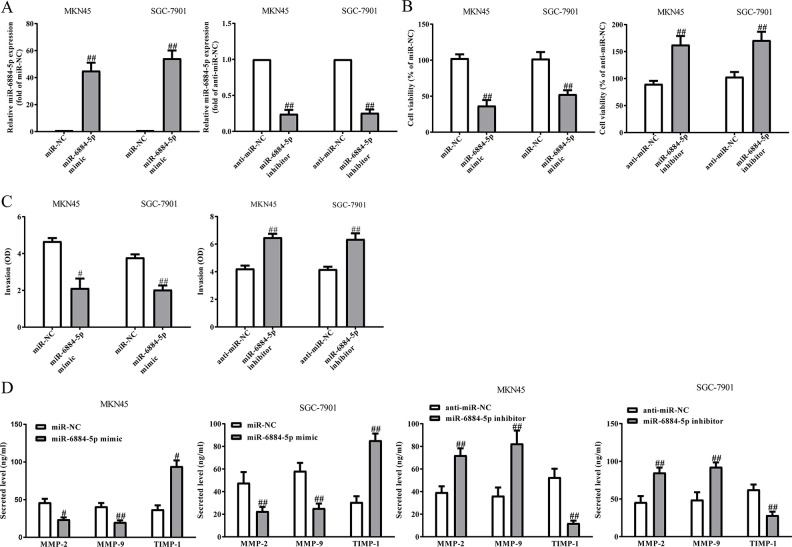
After transfection with miR-6884-5p mimic and inhibitor, the qRT-PCR analysis showed that the level of miR-6884-5p was significantly upregulated and downregulated, respectively (Fig. 4A). These data demonstrated that we efficiently enhanced and reduced miR-6884-5p expression in MKN45 and SGC-7901 cells. Next, overexpression of miR-6884-5p significantly inhibited the proliferation of GC cells, whereas knockdown of it could promote the proliferation of GC cells (Fig. 4B). To study the role of miR-6884-5p in the invasion of GC cells, we evaluated the invasive capacities of MKN45 and SGC-7901 cells transfected with miR-6884-5p mimic or inhibitor by Transwell invasion assays. Transwell assays illustrated that the invasion of MKN45 and SGC-7901 cells was remarkably suppressed in the miR-6884-5p mimic group compared to the miR-NC group, but was significantly promoted in the miR-6884-5p inhibitor group compared to the anti-miR-NC group (Fig. 4C). These findings showed that miR-6884-5p might play a critical role in the inhibition of GC cell invasion. The balance between MMPs and TIMP-1 is demonstrated to play an important role of invasion by stimulating degradation of the ECM in GC cells and is associated with enhanced tumor metastatic potential. Our ELISA and qRT-PCR assays indicated that total secretion of MMP-2 and MMP-9 in the culture supernatants and mRNA expressions of MMP-2 and MMP-9 were evidently decreased by overexpression of miR-6884-5p in MKN45 and SGC-7901 cells, and total secretion of TIMP-1 and mRNA expression of TIMP-1 were significantly increased (Fig. 4D). However, knockdown of miR-6884-5p could enhance the secretion and mRNA expressions of MMP-2 and MMP-9 and reduce the secretion and mRNA expression of TIMP-1 (Fig. 4D). Taken together, our findings suggested that downregulated MMP-2 and MMP-9 expressions and upregulated TIMP-1 expression might be the possible mechanisms that contributed to the inhibitory effect of miR-6884-5p mimic on the invasion of MKN45 and SGC-7901 cells.
Figure 4.
The effects of miR-6884-5p on the proliferation and invasion of GC cells. MKN45 and SGC-7901 cells were transfected with miR-6884-5p mimic or inhibitor. (A) The level of miR-6884-5p analyzed by qRT-PCR. (B) Cell proliferation was detected by CCK-8. (C) The invasion of GC cells was assessed by Transwell assay. (D) Levels of total MMP-2, MMP-9, and TIMP-1 were detected in the culture supernatants of cultured GC cells by ELISA assay. All data are presented as mean ± SEM, n = 4. #p < 0.05, ##p < 0.01 versus miR-NC or anti-miR-NC.
Effects of miR-6884-5p on EMT of GC Cells
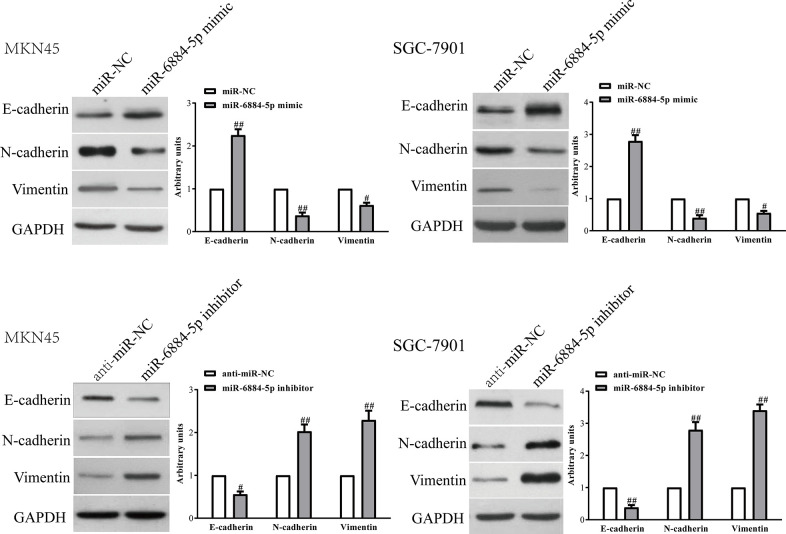
Next, we explored the effects of miR-6884-5p on the expressions of EMT markers in MKN45 and SGC-7901 cells using qRT-PCR and Western blot. Introduction of miR-6884-5p in MKN45 and SGC-7901 cells led to increasing the expression of the epithelial marker E-cadherin and to decreasing the expressions of the mesenchymal markers N-cadherin and vimentin at the mRNA and protein levels (Fig. 5). However, knockdown of miR-6884-5p had opposite effects of miR-6884-5p up-regulation on EMT of GC cells (Fig. 5). Altogether, our findings revealed that overexpression of miR-6884-5p could inhibit EMT of GC cells.
Figure 5.
The effects of miR-6884-5p on expressions of EMT-related molecules in GC cells. MKN45 and SGC-7901 cells were transfected with miR-6884-5p mimic or inhibitor. The protein levels of E-cadherin, N-cadherin, and vimentin were determined by Western blot. All data are presented as mean ± SEM, n = 4. #p < 0.05, ##p < 0.01 versus miR-NC or anti-miR-NC.
miR-6884-5p Suppressed the Proliferation, Invasion, and EMT of GC Cells Through Inhibition of S100A16
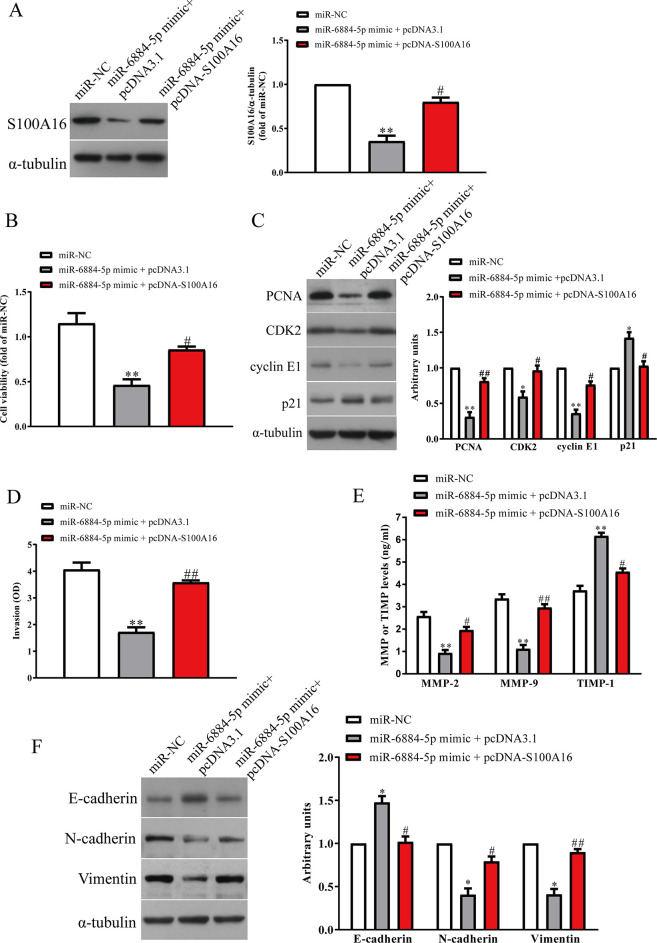
To confirm whether miR-6884-5p inhibited the proliferation, invasion, and EMT of GC cells through S100A16-dependent mechanism, we cotransfected MKN45 and SGC-7901 cells with miR-6884-5p mimic and pcDNA-S100A16 vector. Our data showed that the expressions of S100A16 were dramatically increased after transfection with miR-6884-5p mimic and pcDNA-S100A16 compared with miR-6884-5p mimic and pcDNA3.1 vector in MKN45 and SGC-7901 cells (Fig. 6A). S100A16 upregulation abrogated the inhibitory effect of miR-6884-5p mimic on cell proliferation (Fig. 6B). At the same time, expressions of PCNA, CDK2, and cyclin E1 were decreased and expression of p21 was increased in miR-6884-5p-overexpressing GC cells after exogenous upregulation of S100A16 (Fig. 6C). Our results showed that upregulation of S100A16 could reverse the inhibitory effect of miR-6884-5p overexpression on invasion of GC cells (Fig. 6D) by increasing expressions of MMP-2 and MMP-9 and decreasing the expression of TIMP-1 (Fig. 6E). Moreover, introduction of S100A16 decreased the expression of E-cadherin and increased the expressions of N-cadherin and vimentin in MKN45 and SGC-7901 cells after transfection with miR-6884-5p mimic (Fig. 6F). Therefore, our data clearly confirmed that upregulation of miR-6884-5p inhibited the proliferation, invasion, and EMT of GC cells by directly targeting S100A16, and knockdown of S100A16 was essential for the miR-6884-5p mimic-induced inhibition of the proliferation, invasion, and EMT in GC cells.
Figure 6.
Overexpression of S100A16 promoted miR-6884-5p-inhibited cell invasion and EMT in GC cells. MKN45 and SGC-7901 cells were transfected with miR-NC and miR-6884-5p mimic with pcDNA3.1 or pcDNA-S100A16 vector. (A) The protein levels of S100A16 were determined by Western blot. (B) Cell proliferation was detected by CCK-8. (C) The expressions of proliferating cell nuclear antigen (PCNA), CDK2, cyclin E1, and p21 were detected by Western blot. (D) The invasion of GC cells was assessed by Transwell assay. (E) Levels of total MMP-2, MMP-9, and TIMP-1 were detected in the culture supernatants of cultured GC cells by ELISA assay. (F) The expressions of E-cadherin, N-cadherin, and vimentin were determined by Western blot. All data are presented as mean ± SEM, n = 4. *p < 0.05, **p < 0.01 versus miR-NC; #p < 0.05, ##p < 0.01 versus miR-6884-5p mimic + pcDNA3.1.
DISCUSSION
GC is a heterogeneous disease, and there are many ways to treat it, including surgical resection and chemoradiotherapy, or both. However, survival is poor under the current therapeutic regimens. Therefore, there is a great need to find a more effective treatment to improve the therapeutic outcomes. A new biomarker, miR-6884-5p, comes to mind.
More and more studies report the critical roles of S100 proteins in tumorigenesis and cancer metastasis5,6. S100 proteins have been confirmed as key regulators of cell cycle progression, cell growth, cell migration, invasion, and so on7. Importantly, different expressions of these S100 proteins have been closely associated with multiple human cancers20. Recently, an increasing number of researchers have focused on the role of S100A16 in tumorigenesis and tumor progression. Up to now, the results showed that S100A16 acts as an oncogene in several cancers21–26. However, the role of S100A16 in GC remained unclear. Here, we show for the first time an important role of S100A16 in the tumorigenesis and progression of GC. Our PCR and Western blot results showed that S100A16 is overexpressed in human GC tissues and cell lines. Next, we directly evaluated the role of S100A16 in cell growth, cell cycle regulation, and invasion by overexpression and knockdown of S100A16 using a series of functional assays. Overexpression of S100A16 promotes cell growth and invasion. In contrast to S100A16 overexpression experiments, depletion of S100A16 inhibited cell growth and invasion. For further study, we determined the effect of S100A16 on cell proliferation and invasion at the molecular level. Taken together, all these findings highlight the importance of aberrant expression and biological function of S100A16 in cervical cancer.
Metastasis is a main cause of cancer-related death in patients, and EMT is essential for cancer metastasis, which includes local invasion, intravasation, extravasation, and proliferation at distant sites and is a complicated and currently uncontrolled process. A key feature of EMT is the switch from E-cadherin to N-cadherin. Cancer cells undergoing EMT decrease the expression of E-cadherin and increase expressions of N-cadherin and vimentin27. Notably, our results showed that introduction of S100A16 significantly decreased E-cadherin expression and increased N-cadherin and vimentin expressions in GC cell lines at the protein level, which suggested that S100A16 could induce EMT in GC cells. In contrast, knockdown of S100A16 exhibits adverse effect on the regulation of the main components of EMT including E-cadherin, N-cadherin, and vimentin. Our data suggest that S100A16 induces EMT and, therefore, is important in GC progression and metastasis. However, the detailed mechanism of regulation of EMT components by S100A16 needs to be further elucidated. A complete understanding of the role of S100A16 in controlling EMT in cancer is very important for the use of S100A16 as a potential therapeutic target in GC.
Anomaly expression of miRNAs is closely related to tumorigenesis, and different miRNA expression profiles have been sequentially reported in multiple cancers such as breast cancer, prostate cancer, and liver cancer28. Abnormal expression of miRNAs participates in many processes including malignant transformation, apoptosis, invasion, and metastasis of GC17–19. miRNAs widely participate in the regulation of different pathological processes of carcinogenesis according to downregulating target gene expression; they also can be modulated by upstream regulators, such as transcription factors or epigenetic growth factors. One kind of miRNA may target various genes and involve multiple distinctive signaling pathways. Moreover, various miRNAs can also target a certain gene. Different miRNAs and mRNAs interact at corresponding posttranscriptional levels and form an intricate regulatory network. Actually, we predicted three miRNAs targeting S100A16. Afterward, qRT-PCR, Western blotting, and luciferase reporter assay confirmed that miR-6884-5p directly targeted S100A16. However, the precise mechanism of miR-6884-5p in GC remained unclear. Therefore, we aimed to elucidate the biological functions and mechanism of miR-6884-5p in GC. Our findings confirmed that miR-6884-5p was found to be downregulated in GC cells and tissues. Furthermore, we found that miR-6884-5p overexpression also significantly inhibited the proliferation, invasion, and EMT of GC cells, mimicking the effects of S100A16 knockdown. Importantly, we also demonstrated that overexpression of S100A16 partly blocked the inhibitory effects of miR-6884-5p mimic on the proliferation, invasion, and EMT of GC cells. Therefore, we made a conclusion that miR-6884-5p played critical role in the inhibition of the proliferation, invasion, and EMT of GC cells by directly regulating S100A16 expression.
Taken together, we have identified S100A16 and miR-6884-5p as associated with metastasis in human GC. High expression of S100A16 and low level of miR-6884-5p might be valuable for the prediction of metastasis. We further showed that miR-6884-5p regulates cell cycle progression, cell proliferation, invasion, and EMT by directly regulating S100A16. Notably, we demonstrated that miR-6884-5p and S100A16 can act as a regulator of EMT. For the first time, this study implicates critical roles for miR-6884-5p and S100A16 in the metastatic process of human GC.
ACKNOWLEDGMENT
This study was funded by a research Grant from the National Natural Science Fund of China (No. 81472714). H.L. and X.C. conceived and designed the study. H.H., H.L., and L.B. acquired and analyzed the data. H.L. and C.N. interpreted the data and wrote the manuscript. B.C., L.B., L.H., and X.C. critically revised the manuscript. All authors have read and approved the final manuscript.
Footnotes
The authors declare no conflicts of interest.
REFERENCES
- 1. Jemal A, Siegel R, Ward E, Hao Y, Xu J, Thun MJ. Cancer statistics, 2009. CA Cancer J Clin. 2009;59(4):225–49. [DOI] [PubMed] [Google Scholar]
- 2. Yang L. Incidence and mortality of gastric cancer in China. World J Gastroenterol. 2006;12(1):17–20. [DOI] [PMC free article] [PubMed] [Google Scholar]
- 3. Park SR, Park YS, Ryu MH, Ryoo BY, Woo CG, Jung HY, Lee JH, Lee GH, Kang YK. Extra-gain of HER2-positive cases through HER2 reassessment in primary and metastatic sites in advanced gastric cancer with initially HER2-negative primary tumours: Results of gastric cancer HER2 reassessment study 1 (GAS-THER1). Eur J Cancer 2016;53:42–50. [DOI] [PubMed] [Google Scholar]
- 4. Liu H, Liu Y, Kong F, Xin W, Li X, Liang H, Jia Y. Elevated levels of SET and MYND domain-containing protein 3 are correlated with overexpression of transforming growth factor-β1 in NSCLC. J Am Coll Surg. 2015;221(2):579–90. [DOI] [PubMed] [Google Scholar]
- 5. Donato R. S100: A multigenic family of calcium-modulated proteins of the EF-hand type with intracellular and extracellular functional roles. Int J Biochem Cell Biol. 2001;33(7):637–68. [DOI] [PubMed] [Google Scholar]
- 6. Marenholz I, Heizmann CW, Fritz G. S100 proteins in mouse and man: From evolution to function and pathology (including an update of the nomenclature). Biochem Biophys Res Commun. 2004;322(4):1111–22. [DOI] [PubMed] [Google Scholar]
- 7. Chen H, Xu C, Jin Q, Liu Z. S100 protein family in human cancer. Am J Cancer Res. 2014;4(2):89–115. [PMC free article] [PubMed] [Google Scholar]
- 8. Zhou W, Pan H, Xia T, Xue J, Cheng L, Fan P, Zhang Y, Zhu W, Xue Y, Liu X, Ding Q, Liu Y, Wang S. Up-regulation of S100A16 expression promotes epithelial–mesenchymal transition via Notch1 pathway in breast cancer. J Biomed Sci. 2014;21:97. [DOI] [PMC free article] [PubMed] [Google Scholar]
- 9. Sapkota D, Bruland O, Parajuli H, Osman TA, Teh MT, Johannessen AC, Costea DE. S100A16 promotes differentiation and contributes to a less aggressive tumor phenotype in oral squamous cell carcinoma. BMC Cancer 2015;15:631. [DOI] [PMC free article] [PubMed] [Google Scholar]
- 10. Zhu W, Xue Y, Liang C, Zhang R, Zhang Z, Li H, Su D, Liang X, Zhang Y, Huang Q, Liu M, Li L, Li D, Zhao AZ, Liu Y. S100A16 promotes cell proliferation and metastasis via AKT and ERK cell signaling pathways in human prostate cancer. Tumour Biol. 2016;37(9):12241–50. [DOI] [PubMed] [Google Scholar]
- 11. Sun X, Wang T, Zhang C, Ning K, Guan ZR, Chen SX, Hong TT, Hua D. S100A16 is a prognostic marker for colorectal cancer. J Surg Oncol. 2018;117(2):275–83. [DOI] [PubMed] [Google Scholar]
- 12. Katono K, Sato Y, Kobayashi M, Nagashio R, Ryuge S, Igawa S, Ichinoe M, Murakumo Y, Saegusa M, Masuda N. S100A16, a promising candidate as a prognostic marker for platinum-based adjuvant chemotherapy in resected lung adenocarcinoma. Onco Targets Ther. 2017;10:5273–9. [DOI] [PMC free article] [PubMed] [Google Scholar]
- 13. Tomiyama N, Ikeda R, Nishizawa Y, Masuda S, Tajitsu Y, Takeda Y. S100A16 up-regulates Oct4 and Nanog expression in cancer stem-like cells of Yumoto human cervical carcinoma cells. Oncol Lett. 2018;15(6):9929–33. [DOI] [PMC free article] [PubMed] [Google Scholar]
- 14. Gartel AL. Found in transcription: FOXO1 up-regulates miRNAs on chromosome X. Cell Cycle 2013;12(16):2523. [DOI] [PMC free article] [PubMed] [Google Scholar]
- 15. Samimi H, Zaki Dizaji M, Ghadami M, Shahzadeh Fazeli A, Khashayar P, Soleimani M, Larijani B, Haghpanah V. MicroRNAs networks in thyroid cancers: Focus on miRNAs related to the fascin. J Diabetes Metab Disord. 2013;12(1):31. [DOI] [PMC free article] [PubMed] [Google Scholar]
- 16. Chen WB, Gao L, Weiland M, Zhao J, Liu M, Zhou L, Mi QS. Deletion of miRNAs in bone marrow prevents streptozotocin-induced murine autoimmune diabetes but deletion of miR-155 does not. Cell Cycle 2013;12(1):1151–2. [DOI] [PMC free article] [PubMed] [Google Scholar]
- 17. Wu Q, Luo G, Yang Z, Zhu F, An Y, Shi Y, Fan D. miR-17-5p promotes proliferation by targeting SOCS6 in gastric cancer cells. FEBS Lett. 2014;588(12):2055–62. [DOI] [PubMed] [Google Scholar]
- 18. Wu X, Tang H, Liu G, Wang H, Shu J, Sun F. miR-448 suppressed gastric cancer proliferation and invasion by regulating ADAM10. Tumour Biol. 2016;37(8):10545–51. [DOI] [PubMed] [Google Scholar]
- 19. He XJ, Ma YY, Yu S, Jiang XT, Lu YD, Tao L, Wang HP, Hu ZM, Tao HQ. Up-regulated miR-199a-5p in gastric cancer functions as an oncogene and targets klotho. BMC Cancer 2014;14:218. [DOI] [PMC free article] [PubMed] [Google Scholar] [Retracted]
- 20. Bresnick AR, Weber DJ, Zimmer DB. S100 proteins in cancer. Nat Rev Cancer 2015;15(2):96–109. [DOI] [PMC free article] [PubMed] [Google Scholar]
- 21. Wang C, Zhu X, Li A, Yang S, Qiao R, Zhang J. S100A16 regulated by Snail promotes the chemoresistance of nonmuscle invasive bladder cancer through the AKT/Bcl-2 pathway. Cancer Manag Res. 2019;11:2449–56. [DOI] [PMC free article] [PubMed] [Google Scholar]
- 22. Zhu W, Xue Y, Liang C, Zhang R, Zhang Z, Li H, Su D, Liang X, Zhang Y, Huang Q, Liu M, Li L, Li D, Zhao AZ, Liu Y. S100A16 promotes cell proliferation and metastasis via AKT and ERK cell signaling pathways in human prostate cancer. Tumour Biol. 2016;37(9):12241–50. [DOI] [PubMed] [Google Scholar]
- 23. Xu ZH, Miao ZW, Jiang QZ, Gan DX, Wei XG, Xue XZ, Li JQ, Zheng F, Qin XX, Fang WG, Chen YH, Li B. Brain microvascular endothelial cell exosome-mediated S100A16 up-regulation confers small-cell lung cancer cell survival in brain. FASEB J. 2019;33(2):1742–57. [DOI] [PubMed] [Google Scholar]
- 24. Sun X, Wang T, Zhang C, Ning K, Guan ZR, Chen SX, Hong TT, Hua D. S100A16 is a prognostic marker for colorectal cancer. J Surg Oncol. 2018;117(2):275–83. [DOI] [PubMed] [Google Scholar]
- 25. Sapkota D, Bruland O, Parajuli H, Osman TA, Teh MT, Johannessen AC, Costea DE. S100A16 promotes differentiation and contributes to a less aggressive tumor phenotype in oral squamous cell carcinoma. BMC Cancer 2015;15:631. [DOI] [PMC free article] [PubMed] [Google Scholar]
- 26. Zhou W, Pan H, Xia T, Xue J, Cheng L, Fan P, Zhang Y, Zhu W, Xue Y, Liu X, Ding Q, Liu Y, Wang S. Up-regulation of S100A16 expression promotes epithelial–mesenchymal transition via Notch1 pathway in breast cancer. J Biomed Sci. 2014;21:97. [DOI] [PMC free article] [PubMed] [Google Scholar]
- 27. Alderton GK. Metastasis: Epithelial to mesenchymal and back again. Nat Rev Cancer 2013;13(1):3. [DOI] [PubMed] [Google Scholar]
- 28. Qadir MI, Faheem A. miRNA: A diagnostic and therapeutic tool for pancreatic cancer. Crit Rev Eukaryot Gene Expr. 2017;27(3):197–204. [DOI] [PubMed] [Google Scholar]


