Abstract
This cohort study examines the rate of positive test results for severe acute respiratory syndrome coronavirus 2 in children without symptoms who were treated in US hospitals for other conditions.
During the coronavirus disease 2019 (COVID-19) pandemic, determination of prevalence of severe acute respiratory syndrome coronavirus 2 (SARS-CoV-2) infection among children without symptoms of COVID-19 is critical to guide infection control policy. While estimates have been reported in children undergoing emergency surgery1 and oncologic care,2 these small studies have limited generalizability to large populations of children without symptoms. When children's hospitals resumed elective medical and surgical care in April and May 2020, many implemented routine SARS-CoV-2 testing for children presenting for care not associated with suspicion of COVID-19. Here, we report the prevalence of positive SARS-CoV-2 test results in children without symptoms at 28 children's hospitals across the US.
Methods
The prevalence of SARS-CoV-2 infection in children who are asymptomatic was reported by pediatric otolaryngologists as part of a quality improvement project through May 29, 2020. Reverse transcription–polymerase chain reaction tests for SARS-CoV-2 RNA were performed before surgery, clinic visits, or hospital admissions. In some instances, children may have had symptoms associated with their primary condition that overlapped with symptoms of COVID-19, but testing was not done out of suspicion of SARS-CoV-2 as the primary causative mechanism of illness. Because this was an analysis of deidentified data only, the study was deemed exempt, with a waiver of consent, by the University of California, San Francisco institutional review board.
The mean weekly incidence of COVID-19 for the entire population of the combined statistical area (CSA) for each hospital was calculated from the Johns Hopkins University confirmed cases database for the indicated periods3,4 and compared with asymptomatic prevalence. All P values less than .05 were considered statistically significant. Statistical analyses were performed using Stata version 15.1 (StataCorp). Analyses are detailed in the eMethods in the Supplement.
Results
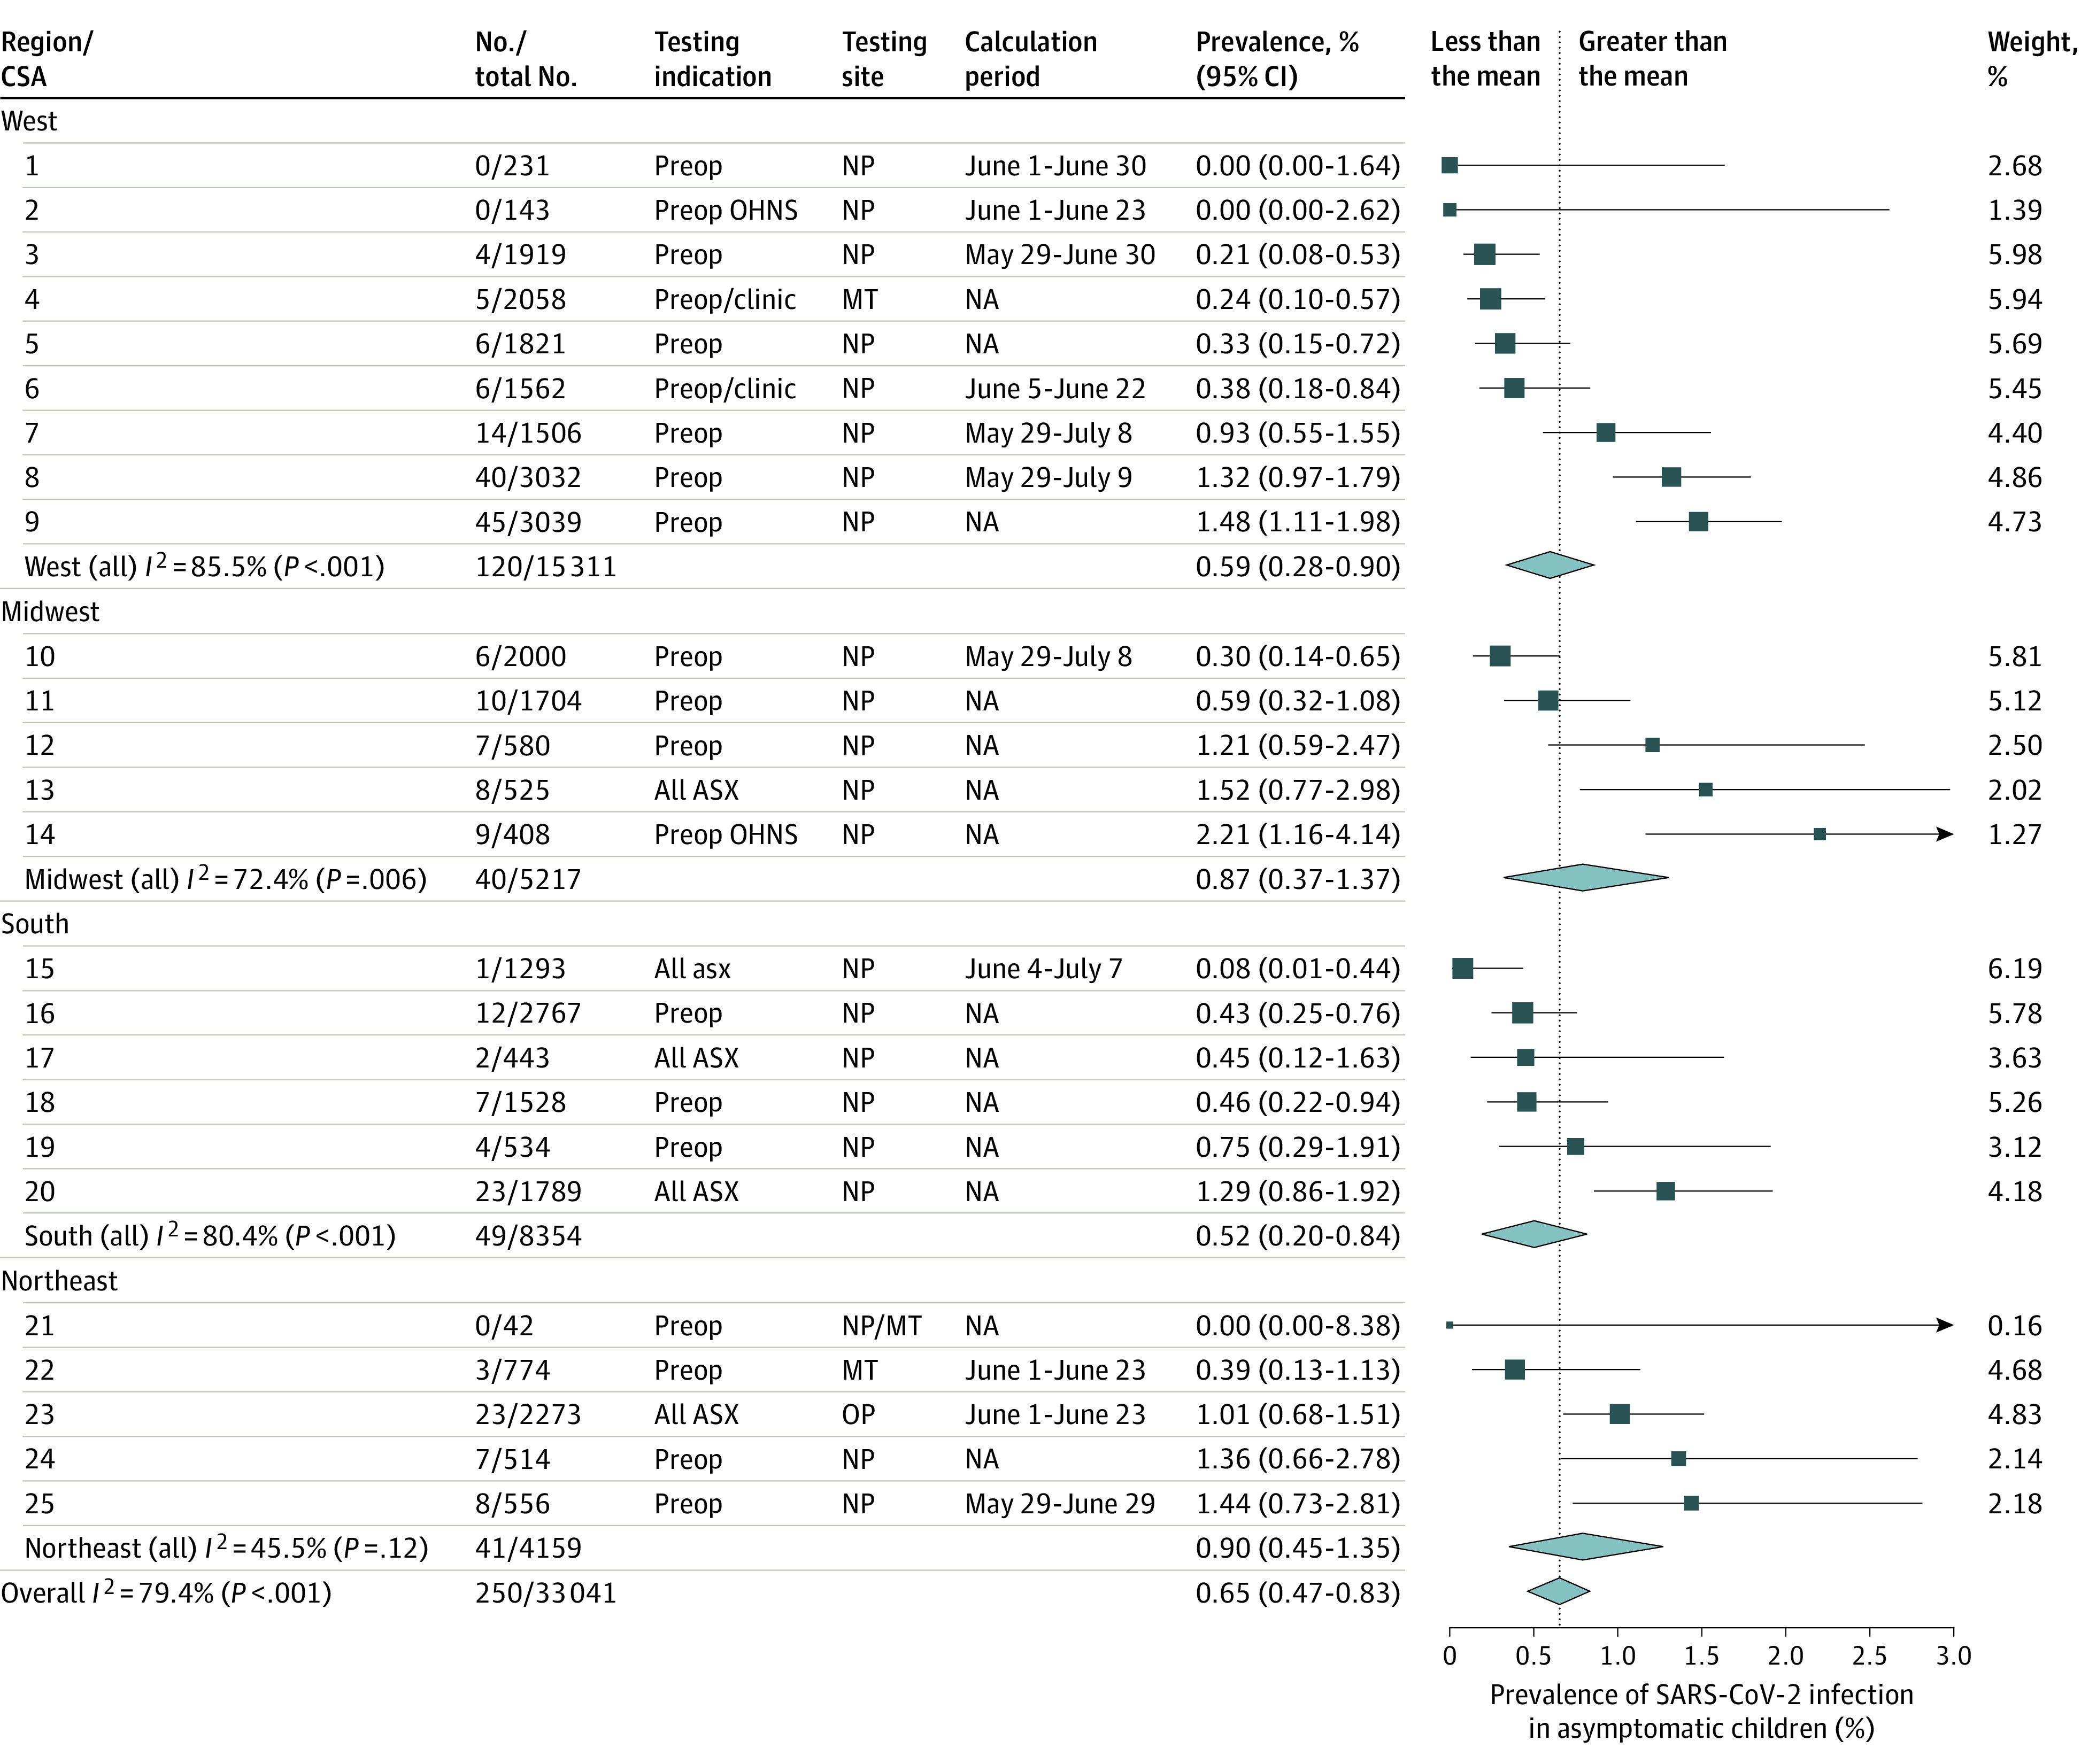
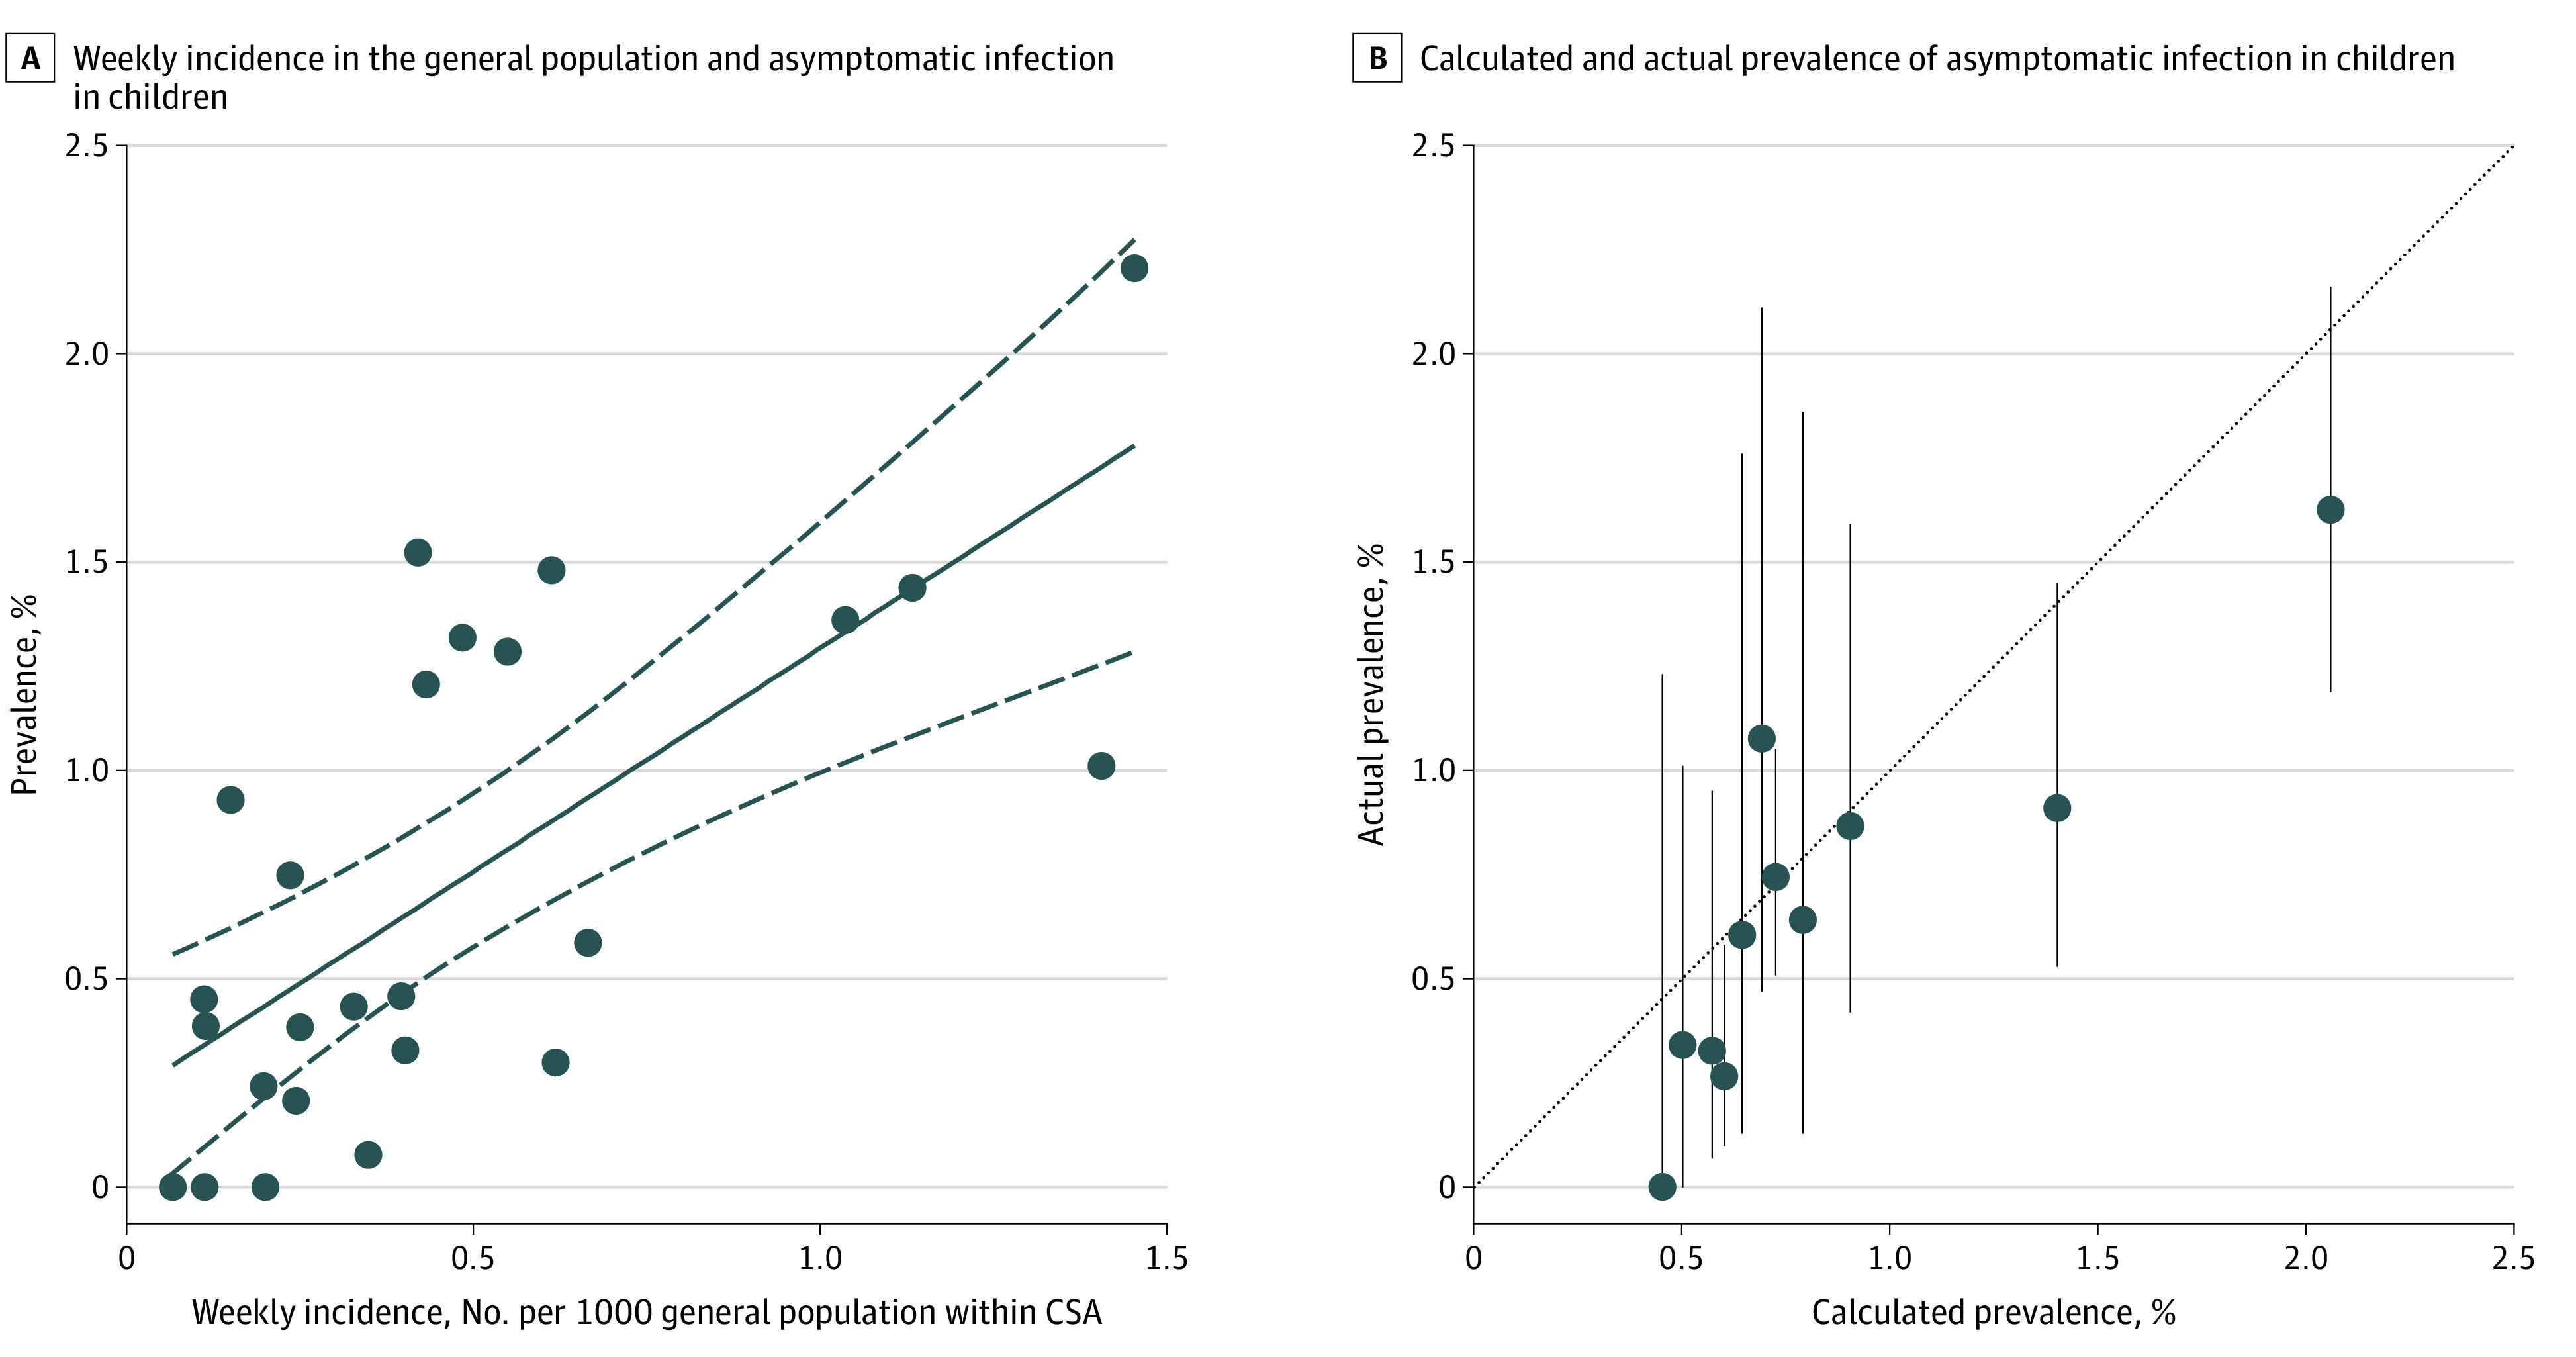
Overall, 250 of 33 041 children (age range, 0-18 years) without symptoms who were tested at 28 hospitals were positive for SARS-CoV-2 through May 29, 2020. Across the 25 CSAs represented by these children's hospitals, prevalence varied from 0% to 2.2%, with a pooled prevalence of 0.65% (95% CI, 0.47%-0.83%, with significant heterogeneity; Figure 1). Asymptomatic pediatric prevalence was significantly associated with weekly incidence of COVID-19 in the general population during the 6-week period over which most testing of individuals without symptoms occurred (unstandardized coefficient B = 1.07 [95% CI, 0.60-1.54]; P < .001; Figure 2A). No other factor (CSA population, number of tests performed, region, testing indication, or sample collection site) demonstrated a significant association with prevalence in individuals without symptoms. Later data from 15 612 children from 11 CSAs were compared with prevalence in an asymptomatic pediatric population calculated from contemporaneous Johns Hopkins University weekly incidence using the best-fit equation derived from this association, and this demonstrated that the association persisted at this later time (unstandardized coefficient B, 0.86 [95% CI, 0.60-1.54]; P = .001; Figure 2B).
Figure 1. Prevalence of Asymptomatic Severe Acute Respiratory Syndrome Coronavirus 2 (SARS-CoV-2) Infection in Children.

Forest plot of asymptomatic prevalence in 25 combined statistical area (CSAs) is shown. The size of each square is relative to its random-effects model weight, and 95% CIs are represented as horizontal lines. The width of each diamond represents the 95% CI of pooled prevalence estimates for regional subgroups and the entire US. Testing indications included hospital-wide preoperative or preclinic testing (preop/clinic), preoperative testing for pediatric patients in otolaryngology–head and neck surgery only (preop OHNS), or testing for all children who were asymptomatic (undifferentiated by testing indication; ASX). Testing sites for reverse transcription–polymerase chain reaction sample collection were nasopharynx (NP), middle turbinate or nasal cavity (MT), or oropharynx (OP). Calculation period: for 11 CSAs with additional later data, the periods over which calculated and actual prevalence rates in asymptomatic pediatric populations were compared in Figure 2B are shown. NA indicates not available.
Figure 2. Association of Severe Acute Respiratory Syndrome Coronavirus 2 Prevalence in Children Without Symptoms With Weekly Incidence of Coronavirus Disease 2019 in General Populations.

A, The weekly incidence of coronavirus disease 2019 infection in the general population and asymptomatic pediatric prevalence for 25 combined statistical areas (CSAs) is plotted here. The line of best fit (black solid line) and 95% CIs (dashed lines) are shown. Linear regression resulted in an unstandardized coefficient (B) of 1.07 (95% CI, 0.60-1.54; P < .001). Of the variation in the data, 49% was explained by the model. Equation of best-fit line: asymptomatic pediatric prevalence was equal to 1.07 × (Johns Hopkins University weekly incidence) + 0.23. B, For 11 CSAs (n = 15 612 children), prevalence values in asymptomatic pediatric populations were available for defined periods in June and July 2020 (as specified in Figure 1). Using the regression model generated in Figure 2A, we calculated prevalence values in asymptomatic pediatric populations from the Johns Hopkins University weekly incidence for each of the CSAs over those periods and compared them with the actual measured asymptomatic pediatric prevalence values. The gray dashed line indicates a perfect match between calculated and actual prevalence values. Error bars indicate the 95% CIs surrounding the actual measured prevalence values by binomial exact calculation.
Discussion
These findings suggest a low pooled prevalence of positive SARS-CoV-2 test results among children who were asymptomatic and presenting for surgical or medical care. Heterogeneity of the pooled prevalence estimates suggests that site-specific prevalence data have greater utility than regional pooled prevalence for local decision-making. However, sufficiently powered prevalence data on the local asymptomatic pediatric population are difficult to obtain for most individual institutions.
The strong association between prevalence of SARS-CoV-2 in children who are asymptomatic and contemporaneous weekly incidence of COVID-19 in the general population (quantified by the best-fit equation in Figure 2A) provides a simple means for institutions to estimate local pediatric asymptomatic prevalence from the publicly available Johns Hopkins University database.3 This prevalence can be used to guide policy on institutional settings for children within that community and estimate pretest probability for SARS-CoV-2 screening. Ongoing estimates of the prevalence of asymptomatic SARS-CoV-2 infection in children may be updated as the COVID-19 pandemic evolves (Figure 2B).
Limitations of this study exist. Children without symptoms presented for elective care at children's hospitals and may not represent the general pediatric population by age, health status, immunologic status, and demographic factors. Because of prolonged viral shedding,5 polymerase chain reaction test positivity in children without symptoms may not reflect contemporaneous community incidence. Variations in symptom screening and testing protocol existed between sites and over time, contributing to heterogeneity. We are confident, however, that the strong correlation with the general incidence data provides external validation that the asymptomatic testing outcomes are broadly reliable.
eMethods. Methods.
References
- 1.Boulad F, Kamboj M, Bouvier N, Mauguen A, Kung AL. COVID-19 in children with cancer in New York City. JAMA Oncol. Published online May 13, 2020. doi: 10.1001/jamaoncol.2020.2028 [DOI] [PMC free article] [PubMed] [Google Scholar]
- 2.Lin EE, Blumberg TJ, Adler AC, et al. . Incidence of COVID-19 in pediatric surgical patients among 3 US children’s hospitals. JAMA Surg. Published online June 4, 2020. doi: 10.1001/jamasurg.2020.2588 [DOI] [PMC free article] [PubMed] [Google Scholar]
- 3.Johns Hopkins CSSEGISandData/COVID-19. Accessed June 13, 2020. https://github.com/CSSEGISandData/COVID-19/tree/master/csse_covid_19_data/csse_covid_19_daily_reports
- 4.United States Census Bureau Combined statistical area population estimates and estimated components of change: April 1, 2010 to July 1, 2019. Published 2020. Accessed May 29, 2020. https://www.census.gov/data/tables/time-series/demo/popest/2010s-total-metro-and-micro-statistical-areas.html
- 5.Lu Y, Li Y, Deng W, et al. . Symptomatic infection is associated with prolonged duration of viral shedding in mild coronavirus disease 2019: a retrospective study of 110 children in Wuhan. Pediatr Infect Dis J. 2020;39(7):e95-e99. [DOI] [PMC free article] [PubMed] [Google Scholar]
Associated Data
This section collects any data citations, data availability statements, or supplementary materials included in this article.
Supplementary Materials
eMethods. Methods.


