Abstract
Accurate assessment of experienced pain is a well-known problem in the clinical practices. Therefore, a proper method for pain detection is highly desirable. Electrodermal activity (EDA) is known as a measure of the sympathetic nervous system activity, which changes during various mental stresses. As pain causes mental stress, EDA measures may reflect the felt pain. This study aims to evaluate changes in skin conductance responses (SCRs), skin potential responses (SPRs), and skin susceptance responses (SSRs) simultaneously as a result of sequences of electrical (painful) stimuli with different intensities. EDA responses as results of painful stimuli were recorded from 40 healthy volunteers. The stimuli with three different intensities were produced by using an electrical stimulator. EDA responses significantly changed (increased) with respect to the intensity of the stimuli. Both SCRs and SSRs showed linear relationship with the painful stimuli. It was found that the EDA responses, particularly SCRs (p < 0.001) and SSRs (p = 0.001) were linearly affected by the intensity of the painful stimuli. EDA responses, in particular SCRs, may be used as a useful indicator for assessment of experienced pain in clinical settings.
Keywords: Pain, stimuli, electrodermal activity, EDA, skin conductance, skin potential, skin susceptance
Introduction
Investigation of electrodermal activity (EAD) measurements has been done for more than 100 years with the pioneering studies of Fere in 1888 and Tarchanoff in1889 [1]. Later, EDA phenomena were further investigated and EDA measurements became a common tool within various fields. Skin conductance (SC) is used in the field of psychophysiology [2], it is utilized as a tool for stress assessment [3, 4], and also SC is used for sweating estimation [5]. Within anesthesia, it has been proposed as a tool for nerve blocking assessment [6, 7]. Skin potential (SP) is frequently used in the field of neurology for assessment of the autonomous nervous system functionality [7]. Skin susceptance (SS) is proposed as the electrical parameter for the skin hydration assessment [8].
Changes in the sympathetic nervous system (SNS) activities are reflected as responses in the EDA phenomenon. When the SNS is activated, the sweat glands are filled up with sweat electrolyte and as a result, the EDA responses rapidly change (increase), and then decrease to baseline when the sweat is removed (reabsorbed through the sweat duct wall). Thus, when sympathetic bursts occur, changes in EDA will follow [9]. Changes or increases in EDA responses due to arousal stimuli can therefore be interpreted as increased activity in this part of the SNS [9, 10, 11]. The different EDA parameters (SC, SP, and SS) are influenced by sweating [12], with different characteristics. SC increases with the filling of sweat ducts and recovers when sweat is reabsorbed. The same mechanisms govern the SP, but the waveform of SP is more complex [13], as it changes in both positive and negative directions and produces monophasic, biphasic or triphasic responses [1]. Finally SS is related to the moisture content of the stratum corneum, which is not directly influenced by sweat duct filling like SC and SP [8, 14].
In 2001, due to insufficient analgesia in hospitalized patients the Joint Commission on Accreditation of Healthcare Organizations (JCAHO) introduced standards for pain assessment as well, to avoid awareness from patients undergoing anesthesia [15]. Pain was added (defined) as the fifth vital sign [15, 16]. The pain is rated by asking the patient to rate her or his pain from 0 to 10 on a numerical rating scale (NRS) with the understanding that 0 is equal to no pain and 10 is equal to the worst pain imaginable [17]. Pain is a highly unpleasant physical sensation, which occurs because of the stimulation of pain receptors at the ends of nerves. The stimulation causes sodium to enter the nerve ending, which causes an electrical signal to build up in the nerve. When this electrical signal is large enough, it passes along the nerve to the brain, where the signal is interpreted as pain.
Accurate assessment of felt pain strength is a key factor for successful pain management during surgery and other clinical procedures. Presently, most of the pain scoring systems used in clinical practice rely on patient cooperation and attentiveness. However, in some cases, for example in unconscious, confused, uncooperative patients, or in the case for infants, questioning is impossible. As a result, pain is usually poorly evaluated and inadequately managed. Therefore, a more practical, patient-independent method for this purpose is highly desirable. As pain provokes a sympathetic response in the body, monitoring of parameters, which correlate with such responses could be a helpful tool for pain assessment. Previously SC, as one of the EDA parameter is proposed as a method for monitoring perioperative or postoperative stress [6, 18, 19, 20].
The aim of this study was to investigate the effects of painful stimuli on EDA measurements through evaluating changes in three (SC, SP, and SS) EDA parameters simultaneously, which has not been investigated previously.
Materials and methods
Skin admittance and potential measurement
A new computerized system was used for EDA recording by means of skin complex admittance (SY) and skin potential (SP) measurements simultaneously at the same electrode. It consisted of a small front-end electronic box connected by means of a National Instruments DAQ card-NI USB-6211 to a PC laptop running software written in LabVIEW, v. 14, similar to the system presented in [11, 21]. A three-electrode system was used, which consisted of one measuring electrode (M), one reference electrode (R), and a current-sink electrode (C). The current-sink electrode together with the reference electrode serves to provide a unipolar AC SC measurement below the measuring electrode. At the same time, the DC voltage between the measuring electrode and the reference electrode (placed at an electrodermally inactive skin site) is used for SP measurement. Also as in [21], a Howland current source was used. A 200 mV digital sine wave was generated by a PC, controlled through LabVIEW software, converted to analog, and then fed to the Howland circuit (front-end electronic box) by the DAQ card. The Howland circuit in turns delivers a 20 Hz (which is less than the recommended maximum value (1 kHz) [22]) AC current of about 20 μA through the measuring electrode to the skin. The DAQ card receives the analog signals back from the skin through the front-end electronic box and converts to digital. Then the digitized signals are processed by differentiation in the PC LabVIEW, and then separated into a DC component for SP and an AC component for SC from real part of the SY signal and SS from quadrature part by means of phase sensitive rectification. To detect variations in the reference site potential and to check to which extent the reference site is electrodermally inactive, voltage sensing by analog-to-digital conversion at both terminals with software differencing was used. This is a key issue of concern for accurate measurement of SP as recommended by [1].
Electrode type and placement
The employed electrodes in this study were Kendall Kittycat 1050NPSM Ag/AgCl solid gel ECG neonatal electrodes with an active electrode area of 5.05 cm2. These electrodes were selected since they cause no or minimal wetting of the skin [21], and also have minimal influence on the state of hydration of the skin. In addition, they are better suited than wet gel electrodes for EDA measurements [22, 23], and hence are crucial to obtain accurate results of EDA measurements. Electrodes were placed on the preferred arm of the participants. The M electrode was placed on the hypothenar site of the palm, the R electrode was placed on the apex of the elbow, which is an electrodermally inactive area as recommended [24], and finally the C electrode was placed on the underarm between M and R. Although abrasion [25] and skin drilling [26] were recommended as a pretreatment for the inactive site, no pretreatment of the skin was used in this study to avoid any risk of contamination.
Experimental protocol
The participants were 40 healthy volunteers (23 male and 17 female) age range 19 to 40 yrs (mean 25 yrs). They were recruited from the University of Duhok and all of them gave written informed consent before participation.
The subjects were sitting comfortably in a chair throughout the experiments in a silent room with only the participant and one operator present in order to standardize the experimental protocol and minimize the measurement uncertainty. The room temperature was held at 22-23 oC as recommended [1].
SC, SP, and SS responses were recorded as a result of three different levels of electrical stimuli. An electrical (TENS) stimulator (UniMed, Otto Trading Inc, Santa Ana, US) was used in “acupuncture” mode with two electrodes (Pads). The electrodes were OudysCare 510 K (TENS Unit Electrode Pads Snap-on 3.5 mm) ECG electrodes with an active electrode area of 2.27 cm2. They were attached on the wrist and underarm of the second hand (i.e. other than the hand, which was connected with the EDA electrodes) of each subject to obtain a sensation of pain. This stimulator has six pre-programmed modes with 20 levels of adjustable intensity strengths. In “acupuncture” mode, the device delivers short voltage pulses repeated at 12 Hz. The stimulation intensity scale on the device ranges from 1 to 20, with maximal amplitude of 2 V at level 20. We used levels 1, 2 and 3 that corresponds to 0.2, 0.3 and 0.4 V respectively. The stimulation period was 3 seconds for each level. Hence, about 37 pulses were produced by the stimulator for each stimulation level. After applying the stimuli and recording the EDA responses, 20 of the participants were asked to rate their pain on a 0-10 NRS, with 0 representing no pain and 10 the worst imaginable pain. Based on this self-reported pain from the participants, the intensities of stimulus from the electrical stimulator were compared to the NRS. It was found that the stimulator level is related to the NRS scale as: stimulator level 1 produced an NRS of 1-2, level 2 produced NRS of 3-4, and level 3 produced NRS of 5-6. Moreover, based on the relation between the felt/self-reported pain and the stimulator output level, all participants reported that felt pain increased with increasing stimulus intensity. It should be noted that using the stronger stimuli (i.e. 7-10 NRS) was not preferred due to severity of the stimuli, which caused acute pain. There was a relaxation time for 60 seconds before and after applying the pain stimuli to obtain stable level of EDA measurements. Thus, the total recording session was 249 seconds. Any unnecessary speaking was not allowed for participants, and they were instructed to keep the body relaxed, particularly the testing hand during the whole session of recording.
Data Analysis
To analysis EDA responses as results of painful stimuli, and to investigate variation within subjects and between stimuli intensity, several EDA parameters were calculated. In order to compute these parameters, the SCRs, SSRs and SPRs onsets and peaks were first specified. Locating the onsets and peaks was done analogous to the procedure presented in [11]. A complete list of all the extracted variables from EDA responses and included in the data analysis is given in Table 1.
Table 1.
Overview of extracted parameters from the EDA responses that were used in the data analyses.
| Parameter | Description | Unit |
|---|---|---|
| SCR_Amp | Amplitude of the skin conductance response | μS |
| SPR_Amp | Amplitude of the skin potential response | mV |
| SSR_Amp | Amplitude of the skin susceptance response | μS |
| SPRET | Turning point of the SPR relative to the SCR peak | % |
| SCR_Trise | Time from onset of SCR to peak SCR | sec. |
SPRET (Skin Potential Relative Early Turn) was extracted from the time of the SCR peak minus the time of the SPR peak, divided by the time from SCR onset to SCR peak, and multiplied by 100%. This score was calculated to show when the SC and SP waveforms are different [21].
The rise time (SCR_Trise), was calculated for each individual SCR for all participants for intraindividual variation analysis and to test whether the SCR_Trise is changed with respect to the intensity of the stimuli. Also, SCR_Amp, SPR_Amp, and SSR_Amp were calculated to study their dependency on stimuli intensity and variation within their values with respect to test subjects. SCL, SPL, and SSL were also extracted by calculating the mean value of their levels at the onsets of each response coming from the three stimulus intensity levels as a result of electrical stimulator used in the study. SCL, SPL, and SSL are additional variables to indicate variation within subjects and between groups (experienced pain strength levels).
Statistics
In order to statistically assess the differences between electrodermal responses as a results of different electrical stimuli, one-way repeated analysis of variation (ANOVA) was conducted, followed by post hoc multiple pairwise comparison using Sidak correction. The Pearson product-moment correlation coefficients and their p-values were calculated for each parameter, and the 0.05 level of confidence was used to define statistical significance. The analysis was done using IBM SPSS Statistics 22.
Also, the effects of electrical stimuli on electrodermal responses were assessed statistically by a linear mixed effects model, using either SCR, SPR or SSR as a dependent variable as a function of intensity of stimuli as a fixed effect, with subject as a random effect, including random slope and intercept in the model. The analysis was done by the fitlme() function in MATLAB (of the statistics and machine learning toolbox) (version 2015a, academic license).
Ethical approval
The protocol has been complied with all the relevant national regulations, institutional policies and in accordance with the Helsinki Declaration, and was approved by the Dean of the College of Medical Science at the University of Duhok.
Informed consent
Informed consent has been obtained from all individuals included in this study.
Results
Amplitudes of EDA responses
Skin conductance responses (SCRs)
Based on Figure 1 and the ANOVA analysis, the SCR_Amp is significantly (p < 0.001) increased with increasing intensity of the stimuli. Moreover, when the stimulus intensity was categorized as 1 (scale 1), 2 (scale 2), and 3 (scale 3), the corresponding values for amplitude of SCRs were significantly different. Post hoc pairwise multiple comparison tests also indicate significant differences (Figure 1) between the stimulus intensities.
Fig. 1.
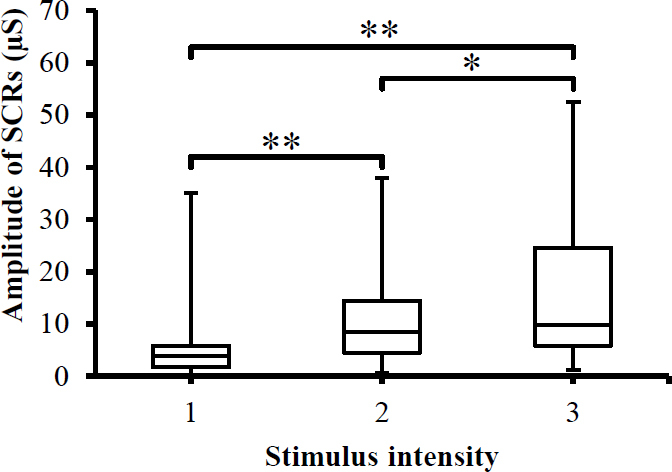
Box-plot with medians, quartiles and the min and max as whiskers shows value of SCRs_Amp with respect to the stimulus intensity. *p<0.05 and **p<0.005.
Skin potential responses (SPRs)
SPRs were monitored while exposing test subjects to painful stimuli. The amplitude of SPRs changed as results of different stimulus intensities (Figure 2). However, this changes were statistically insignificant (p>0.05) as indicated by ANOVA analysis.
Fig. 2.
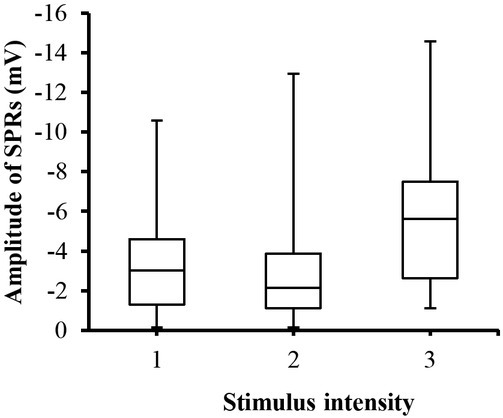
Box-plot with medians, quartiles and the min and max as whiskers shows value of SPRs_Amp with respect to the stimulus intensity.
Skin susceptance responses (SSRs)
SSRs were also changed with respect to the stimulator intensity. As shown in Figure 3, the amplitude of the SSRs is increased when increasing the intensity of the stimuli and the highest response is associated with the highest stimulus intensity. ANOVA analysis also revealed a significant (p<0.05) difference between the stimuli. Post hoc pairwise multiple comparison tests also indicate significant differences (Figure 3) between the stimulus intensities (except between levels one and two).
Fig. 3.
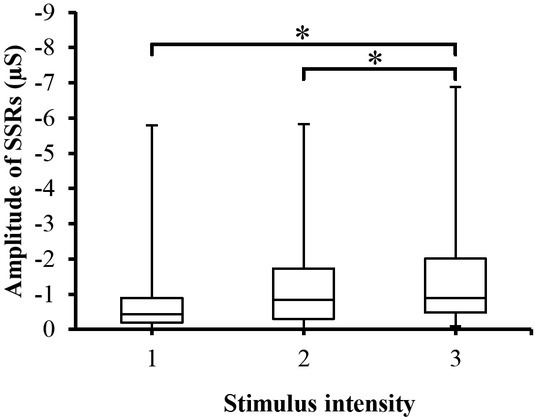
Box-plot with medians, quartiles and the min and max as whiskers shows value of SSRs_Amp with respect to the stimulus intensity. *p<0.05.
Relation between SCRs, SPRs and SSRs, and stimulus intensity
The average (over 40 subjects) of SCR_Amp consistently showed stepwise increase with increasing the stimulator intensity as seen in Figure 4. In average, the experienced pain-induced SCR_amp increased in a linear fashion with increasing the intensity of electrical stimulator, reaching a maximum value at stimulus level 3. The average of SSR_Amp also is increased in a linear fashion with respect to the intensity of stimuli and reaching the highest level at the highest intensity. However, SPR_Amp was not always following the stimulus intensity, which may mean SPRs does not correlate with the stimulus intensity. Furthermore, the statistical analysis with a linear mixed effects model results (Table 2) showed that the stimulator intensity had a significant linear effect (p<0.001) on the SCRs, increasing with approximately 4.3 μS per intensity level (CI from 2.5 to 6.0 μS), and a significant linear effect (p = 0.001) on the SSRs, in the negative direction, changing with -0.384 μS per intensity level (CI from -0.620 to -0.143 μS). SPRs also changed with respect to stimuli and increased in the negative direction with approximately -0.3 mV per intensity level (CI from -0.709 to 0.116 mV), but this effect was not statistically significant (p>0.05) as seen in Table 2.
Fig. 4.
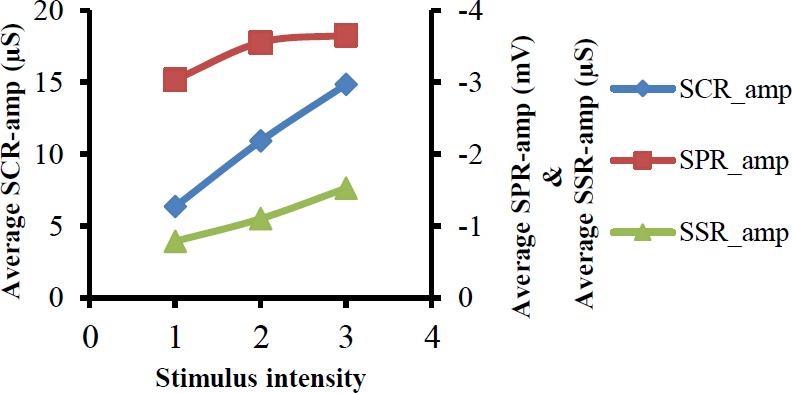
Shows relation between average values of amplitudes of SCRs, SPRs and SSRs on one side, and the stimulus intensity on other side.
Table 2.
Statistical analysis with a linear mixed effects model.
| 95% CI | ||||
|---|---|---|---|---|
| Parameters | Estimate | p value | Lower | Upper |
| SCRs | 4.255 | <0.001 | 2.490 | 6.019 |
| SPRs | -0.296 | 0.157 | -0.709 | 0.116 |
| SSRs | -0.384 | 0.001 | -0.620 | -0.143 |
Figure 5 shows a typical recording of EDA responses from a participant. It is clear from the figure that in this case, all stimulus intensities were able to evoke EDA responses. In addition, the highest response is associated with the strongest stimulus.
Fig. 5.
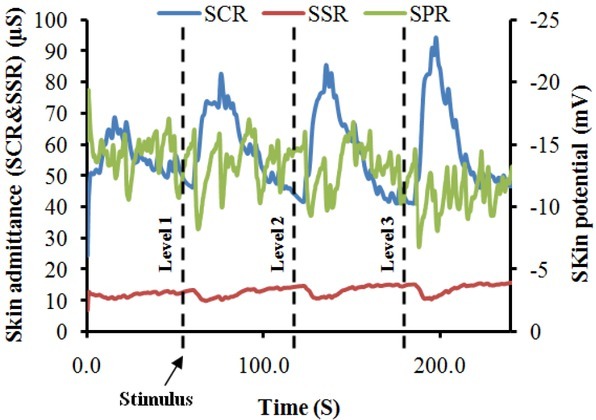
A typical EDA recording from a participant, demonstrating changes in EDA responses with respect to painful stimuli.
Skin potential relative early turn (SPRET)
Figure 6 shows the percentage value of SPRET for all SC and SP responses from all test subjects and how increase in SPRET values coincides with increase in stimuli intensity provoked by the electrical stimulator. ANOVA analysis yielded a significant (p<0.001) difference between groups (stimuli intensity), and pairwise comparisons between the stimuli intensity were performed with Sidak post hoc pairwise multiple comparison tests, revealing significant differences between some stimuli intensity, as shown in Figure 6. As seen in the histogram in Figure 7, negative SPRET (i.e., SPRET <0) was found in two responses, where the SPRs peaked later than the SCRs, whereas in all other responses SPRs turns before SCRs (positive SPRET) with most SPRs peaking from 20 to 90% earlier and the largest category is 70%-80%.
Fig. 6.
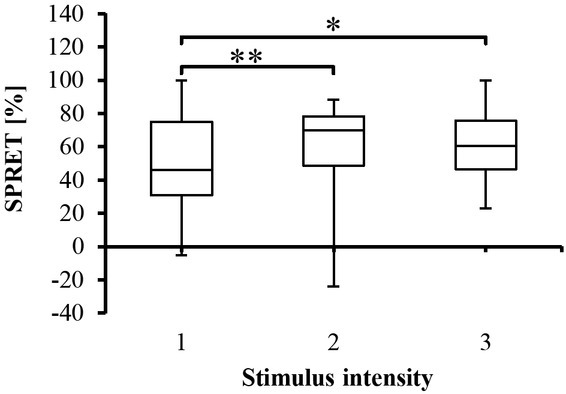
Box-plot with medians, quartiles and the min and max as whiskers, showing the SPRET percentage for all participants with respect to the stimulus intensity.*p<0.05 and **p<0.005.
Fig. 7.
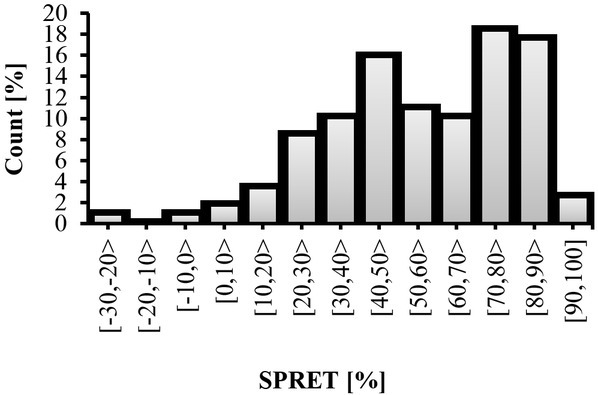
SPRET percentage for each category.
Rise time of SCRs (SCR_Trise)
There was an association between the painful stimuli and SCR_Trise (timing parameter of the SCRs) as shown in Figure 8. ANOVA analysis on SCR_Trise data showed a significant (p<0.005) difference between groups (stimulus intensity). It is clear from these findings and Figure 7 that the rise time of some SC responses was significantly larger than other SC responses regardless of the stimuli intensity.
Fig. 8.
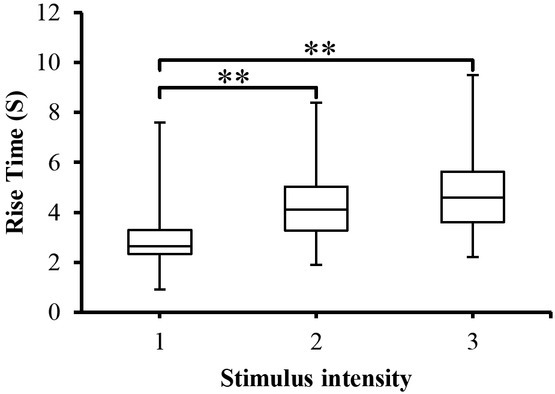
SCR_Trise to the different stimulus intensity presented as box-plots with medians, quartiles and the min and max as whiskers. **p<0.005.
In addition, as the highest SC response is associated with the strongest stimuli, the longer time is also associated with the strongest stimuli. When pairwise multiple comparison tests were employed between stimulus intensity, a significant (p<0.005) was obtained between stimuli intensity (except between level 2 and level 3) as indicated in Figure 7.
Discussion
The current study describes the characteristics of EDA responses during a sequence of electrical (painful) stimuli in a population of 40 healthy volunteers. In this investigation, we demonstrated a relation between EDA responses, in particular SCRs and SSRs, and stimulus intensity through the use of an electrical stimulator. The study results indicate that responsivity of the sympathetic nervous system to different stimulus levels leads to various electrodermal responses, as assessed by SC, SP, and SS responses.
It is interesting to note from the above results, that all stimulus intensities (see figure 5 for example) were able to evoke EDA responses in all test subjects and the amplitude of responses were associated with the stimulus levels. In general, the SCRs_Amp were always increasing as results of increasing the intensity of stimuli. This is due to the fact that when an outgoing sympathetic nervous burst occurs to the skin as a result of stimuli, the palmar and plantar sweat glands are filled up and hence the SCRs_Amp increase. This can be further explained in light of the poral valve model [13]. According to this model, sweat secretion in a duct that is filled to the limits of its limp capacity causes an increase in SCRs_Amp. The results of SCRs are consistent with previous studies [6, 18, 19] on that the SCRs could possibly be used as a pain detector and well correlated with the painful stimuli. Figure 8 provides data for SCR_Trise (the time between the onset and peak of the SCR). The figure depicts that SCR_Trise is associated with the stimulus strength. This should mean that the higher the SCRs is the longer the SCR_Trise.
SPRs_Amp for different stimulator levels can be seen in Figure 2. It can be noted through the figure that SPRs_Amp are changed (negatively increased), however, ANOVA analysis showed that these changes were statistically insignificant (p>0.05). This means that SPRs_Amp is not a appropriate parameter for predicting the stimulator intensity. In other words, it seems SPRs do not well correlate with the painful stimuli as noted by the linear mixed effects model results (Table 2). SPRET, which is a timing parameter between SC and SP responses, could be employed as a score to predict the experienced pain. It can be noted from Figure 7 that SPRET is a function of the stimulator intensity, and that it also changed with respect to the test subjects. According to Tronstad et al. [21] the SPRET provides a continuous parameter that quantifies the SPRs mechanisms, which cannot be found from inspecting the SPR waveform without the corresponding SCR. Figure 7 shows the distribution of SPRET percentage, where it was found that SPRET lies from -30% to 100%, with most of the SPRs possessing a SPRET from 20 to 90%. These results are in line with [11, 21].
The third response parameter (SSRs) has not previously been tested for the painful stimuli. Inspection of figure 3 and the analysis of a linear mixed effects model (Table 2) suggest that SSRs have a linear negative correlation with the stimulus intensity. These results are compatible with the results of Bari et al. [11] who noted that SSRs waveform decreased from positive to negative as a result of cognitive, noise, vision, deep breath and discomfort stimuli. According to Bari et al. [11] negative SS responses might be related to low (20 Hz) value of excitation frequency of the applied AC current.
In view of Figure 4, both SCRs and SSRs seem to be correlated with the intensity of the stimuli. It is clear that both SCRs and SSRs have a linear relationship with stimulus intensity. These results agree with how the participants felt in response to the intensity of the painful stimuli, because they felt that the pain was increased with increasing stimulator intensity.
In summary, the present study, together with previous studies [6, 18, 19], indicate that the EDA measurements may be employed as a useful means to monitor experienced pain.
Limitations of this study and method
1. Physiological effects, emotional states such as anxiety, discomfort or confusion may affect EDA measurements in addition to the pain response studied.
2. Also with respect to the employed method (i.e. using of EDA for pain monitoring), medication with drugs, for example anticholinergic drugs which have effects on the autonomic nervous system, potentially affect EDA measurements [19].
3. The pain was experimentally induced cutaneously (skin pain), while most clinical pain arises from deep tissues.
4. Stronger stimuli (supposedly NRS>7) were not used (due to ethical reasons), so we do not know whether the linear relationship between stimulator level or pain and SCRs continues for higher pain levels.
Conclusion
We conclude that electrical (painful) stimuli have a linear effect on electrodermal responses, especially SCRs and SSRs. Such measurements may be used as an indicator for the pain in clinical applications. In addition, this may help clinicians for successful pain management, and avoiding both inadequate anesthesia and possible awareness during different procedures. In the future the EDA equipment, particularly wearable devices might be employed in clinical applications to monitor pain or discomfort due to their fast response and sensitivity to stimuli.
Footnotes
Conflict of interest Ø.G. Martinsen is involved with a company (Biogauge AS, Norway), which produces instruments for electrodermal activity measurements. Authors state no other conflict of interest.
References
- 1.Boucsein W. Electrodermal activity. Berlin: Plenum Press; 2012. [DOI] [Google Scholar]
- 2.Martin I, Venables PH. Techniques in psychophysiology. Chichester: Wiley & Sons; 1980. [Google Scholar]
- 3.Healey JA, Picard RW. Detecting stress during real-world driving tasks using physiological sensors. IEEE Trans Intell Transp Syst. 2005;6:156–66. doi: 10.1109/TITS.2005.848368. [DOI] [Google Scholar]
- 4.Setz C, Arnrich B, Schumm J, La Marca R, Tröster G, Ehlert U. Discriminating stress from cognitive load using a wearable EDA device. IEEE Trans Inf Technol Biomed. 2010;14:410–17. doi: 10.1109/TITB.2009.2036164. [DOI] [PubMed] [Google Scholar]
- 5.Tronstad C, Kalvøy H, Grimnes S, Martinsen ØG.. Improved estimation of sweating based on electrical properties of skin. Annals Biomed Eng. 2013;41:1074–83. doi: 10.1007/s10439-013-0743-4. [DOI] [PubMed] [Google Scholar]
- 6.Hullett B, Chambers N, Preuss J, Zamudio I, Lange J, Pascoe E, Ledowski T. Monitoring Electrical Skin Conductance: A Tool for the Assessment of Postoperative Pain in Children? Anesthesiology: J Am Soc Anesthesiologists. 2009;111:51317. doi: 10.1097/ALN.0b013e3181b27c18. [DOI] [PubMed] [Google Scholar]
- 7.Kucera P, Goldenberg Z, Kurca E. Sympathetic skin response: review of the method and its clinical use. Bratisl Med J. 2004;105:108–16. [PubMed] [Google Scholar]
- 8.Martinsen ØG, Grimnes S, Karlsen J. Electrical methods for skin moisture assessment. Skin Pharmacol Physio. 1995;8:237–45. doi: 10.1159/000211353. [DOI] [PubMed] [Google Scholar]
- 9.Lidberg L, Wallin BG. Sympathetic skin nerve discharges in relation to amplitude of skin resistance responses. Psychophysiology. 1981;18:268–70. doi: 10.1111/j.1469-8986.1981.tb03033.x. [DOI] [PubMed] [Google Scholar]
- 10.Bini G, Hagbarth KE, Hynninen Pt, Wallin BG. Thermoregulatory and rhythm-generating mechanisms governing the sudomotor and vasoconstrictor outflow in human cutaneous nerves. J Physiol. 1980;306:537–52. doi: 10.1113/jphysiol.1980.sp013413. [DOI] [PMC free article] [PubMed] [Google Scholar]
- 11.Bari DS, Aldosky HYY, Tronstad C, Kalvøy H, Martinsen ØG.. Electrodermal responses to discrete stimuli measured by skin conductance, skin potential, and skin susceptance. Skin Res Technol. 2018;24:108–16. doi: 10.1111/srt.12397. [DOI] [PubMed] [Google Scholar]
- 12.Grimnes S, Martinsen ØG. Bioimpedance and Bioelectricity Basics. 3rd ed. Oxford: Elsevier; 2015. [Google Scholar]
- 13.Edelberg R. Roy JC, Boucsein W, Fowles DC, Gruzelier JH. Progress in Electrodermal Research. New York: Plenum Press; 1993. Electrodermal mechanisms: A critique of the two-effector hypothesis and a proposed replacement; p. 730. [DOI] [Google Scholar]
- 14.Martinsen ØG, Grimnes S, Nilsen JK, Tronstad C, Jang W, Kim H. Gravimetric method for in vitro calibration of skin hydration measurements. IEEE Trans Biomed Eng. 2008;55:728–32. doi: 10.1109/TBME.2007.912651. [DOI] [PubMed] [Google Scholar]
- 15.Vila JH, Smith RA, Augustyniak MJ, Nagi PA, Soto RG, Ross TW. The efficacy and safety of pain management before and after implementation of hospital-wide pain management standards: is patient safety compromised by treatment based solely on numerical pain ratings? Anesth Analg. 2005;101:474–80. doi: 10.1213/01.ANE.0000155970.45321.A8. [DOI] [PubMed] [Google Scholar]
- 16.Merboth MK, Barnason S. Managing pain: the fifth vital sign. Nurs Clin North Am. 2000;35:375–83. [PubMed] [Google Scholar]
- 17.Kim EJ, Buschmann MT. Reliability and validity of the Faces Pain Scale with older adults. Int J Nurs Stud. 2006;43:447–56. doi: 10.1016/j.ijnurstu.2006.01.001. [DOI] [PubMed] [Google Scholar]
- 18.Ledowski T, Bromilow J, Paech MJ, Storm H, Hacking R, Schug SA. Monitoring of skin conductance to assess postoperative pain intensity. Br J Anaesth. 2006;97:862–5. doi: 10.1093/bja/ael280. [DOI] [PubMed] [Google Scholar]
- 19.Ledowski T, Bromilow J, Wu J, Paech MJ, Storm H, Schug SA. The assessment of postoperative pain by monitoring skin conductance: results of a prospective study. Anaesthesia. 2007;62:989–93. doi: 10.1111/j.1365-2044.2007.05191.x. [DOI] [PubMed] [Google Scholar]
- 20.Sabourdin N, Arnaout M, Louvet N, Guye ML, Piana F, Constant I. Pain monitoring in anesthetized children: first assessment of skin conductance and analgesia-nociception index at different infusion rates of remifentanil. Pediatr Anesth. 2013;23:149–55. doi: 10.1111/pan.12071. [DOI] [PubMed] [Google Scholar]
- 21.Tronstad C, Kalvøy H, Grimnes S, Martinsen ØG. Waveform difference between skin conductance and skin potential responses in relation to electrical and evaporative properties of skin. Psychophysiology. 2013;50:1070–78. doi: 10.1111/psyp.12092. [DOI] [PubMed] [Google Scholar]
- 22.Martinsen ØG, Pabst O, Tronstad C, Grimnes S. Sources of error in AC measurement of skin conductance. J Electr Bioimp. 2015;6:49–53. doi: 10.5617/jeb.2640. [DOI] [Google Scholar]
- 23.Tronstad C, Johnsen GK, Grimnes S, Martinsen ØG. A study on electrode gels for skin conductance measurements. Physiol Meas. 2010;31:1395–410. doi: 10.1088/0967-3334/31/10/008. [DOI] [PubMed] [Google Scholar]
- 24.Boucsein W, Fowles DC, Grimnes S, Ben-Shakhar G, roth WT, Dawson ME, Filion DL. Publication recommendations for electrodermal measurements. Psychophysiology. 1981;18:232–9. doi: 10.1111/j.1469-8986.1981.tb03024.x. [DOI] [PubMed] [Google Scholar]
- 25.Edelberg R. Brown CC. Methods in psychophysiology. Baltimore: Williams & Wilkins; 1967. Electrical properties of the skin; pp. 1–53. [Google Scholar]
- 26.Venables PH, Christie MJ. Martin I, Venables PH. Techniques in psychophysiology. New York: Wiley; 1980. Electrodermal activity; pp. 3–67. [Google Scholar]


