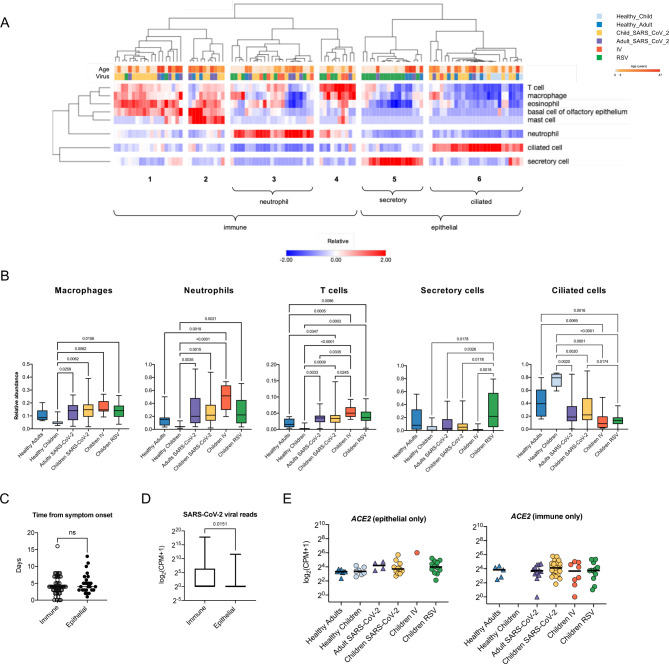
Figure 3. Cell type deconvolution of the transcriptomic signatures in the nasal mucosa demonstrates an influx of immune cells after viral infection.
A. Heatmap demonstrating the relative abundance of cell types as determined by in silico deconvolution of bulk RNA-seq gene expression profiles (see Methods). Hierarchical clustering on samples from 105 participants identified 6 clusters enriched for immune or epithelial cells. Z-score normalized relative abundance values are shown. B. Relative abundance of immune and epithelial cell types across all six participant groups. Participants with a viral infection had a significantly higher relative abundance of immune cells than healthy participants. Adjusted p-values calculated using the Kruskal-Wallis test with Benjamini-Hochberg FDR correction are shown. Adjusted p-values <0.05 were considered statistically significant. C. Number of days between symptom onset and day of sample collection were similar for immune-enriched and epithelial-enriched samples. n.s.= not significant, by Mann-Whitney U test. D. SARS-CoV-2 viral load, defined as average normalized reads for 11 SARS-CoV-2 viral genes, is significantly higher in immune-enriched clusters in comparison to epithelium-enriched clusters. Log-transformed pseudocounts (CPM+1) are shown. The adjusted p-value calculated by the Mann-Whitney U test is shown. E. Normalized expression of ACE2 in epithelial- and immune-enriched samples is similar across all participant groups; differences are not significant, Kruskal-Wallis testing with Benjamini-Hochberg FDR correction, all adjusted p-values >0.05. Log-transformed pseudocounts (CPM+1) are shown.

