

Targeting a sphingomyelin hydrolase improves the structure of remyelinated fibers in a mouse model of multiple sclerosis.
Abstract
Myelination requires a highly organized synthesis of multiple lipid species that regulate myelin curvature and compaction. For reasons that are not understood, central nervous system remyelinated axons often have thin myelin sheaths with a disorganized structure susceptible to secondary demyelination. We found that expression of the sphingomyelin hydrolase neutral sphingomyelinase 2 (nSMase2) during the differentiation of oligodendrocyte progenitor cells (OPCs) to myelinating oligodendrocytes changes their response to inflammatory cytokines. OPCs do not express nSMase2 and exhibit a protective/regenerative response to tumor necrosis factor–α and interleukin-1β. Oligodendrocytes express nSMase2 and exhibit a stress response to cytokine challenge that includes an overproduction of ceramide, a sphingolipid that forms negative curvatures in membranes. Pharmacological inhibition or genetic deletion of nSMase2 in myelinating oligodendrocytes normalized the ceramide content of remyelinated fibers and increased thickness and compaction. These results suggest that inhibition of nSMase2 could improve the quality of myelin and stabilize structure.
INTRODUCTION
Multiple sclerosis (MS) is a prevalent autoimmune disorder characterized by the presence of inflammatory lesions with an underlying neurodegenerative component. On the basis of clinical presentation, the disease is classified into relapsing remitting MS (RRMS), secondary progressive MS (SPMS), and primary progressive MS (PPMS). Most individuals (~85%) with MS present with RRMS, in which acute episodes of demyelination produce clinical symptoms that improve over time, with varying degrees of remyelination (1). PPMS presents in a smaller number of individuals where an initial demyelinating event is followed by progressive neurological deterioration, with no obvious periods of remittance. Even with effective immunomodulatory therapy, most individuals with RRMS will eventually develop SPMS (2). These progressive forms of MS are characterized pathologically by a failure in remyelination, axonal damage, and frank neuronal loss. While there are multiple immunological therapies that effectively treat RRMS, there are currently no effective interventions for progressive forms of MS, in part, due to an incomplete understanding of the mechanisms that trigger progressive MS.
Following a demyelinating event, oligodendrocyte progenitor cells (OPCs) and neural stem cells are activated and recruited to the site of damage to remyelinate denuded axons. The process of myelination requires that these progenitor cells differentiate into myelinating oligodendrocytes to orchestrate a highly synchronized and complex generation of multiple classes of lipids and proteins. The composition of lipids in myelin is asymmetrically distributed to create the biophysical properties required for membrane curvature and myelin compaction. The head-to-head arrangement of lipids in myelin creates a repulsive force between opposing layers that is overcome at the major dense line by the actions of myelin basic protein (MBP) that is stabilized in the membrane by interactions with phosphatidylinositol 4,5-bisphosphate (3). Electrostatic interactions between negatively charged phosphatidyl serine head groups and positively charged surface groups on MBP, combined with attractive van der Walls force, create a highly stable interface (4). Adhesion at the intraperiod line is less stable and relies heavily on the interactions of proteolipid protein (PLP) with membrane lipids to overcome repulsive energies originating from thermal undulations (5). Small changes in the lipid components can modify these adhesive forces and result in the decompaction and degeneration of myelin (6). Changes in the lipid composition of normal-appearing white matter adjacent to lesion sites were calculated to increase the repulsive force between bilayers (7). This derangement of lipid composition may explain the decompacted structure of myelin and altered myelin structure that are persistent features of secondary degeneration (8). However, a mechanism for altered lipid content in remyelinated fibers has yet to be identified.
Compared to most plasma membranes, myelin contains an especially high content of lipids accounting for ~80% of its dry weight (9). Myelin is enriched in cholesterol, plasmalogens, and complex ceramides (9). These highly saturated lipids tightly pack together to form ordered membrane domains where PLP preferentially resides (10). In contrast, MBP appears to prefer more fluid components of the bilayer and may itself contribute to the kinetics of lipid movement by replacing the actin cytoskeleton with a meshwork of MBP proteins that effectively sort the lipids allowed to exist within these MBP-rich domains (11). These heterogeneity and distribution of lipids into ordered and fluid domains are essential for myelin curvature and compaction around axons (12, 13). Here, we provide evidence that the overproduction of ceramide during remyelination is sufficient to produce a disorganized and decompacted myelin structure. The mechanism for this phenomenon involves the sphingomyelin (SM) hydrolase neutral sphingomyelinase 2 (nSMase2) that converts SM to ceramide. This enzyme is not expressed in OPCs but becomes expressed during differentiation into myelinating oligodendrocytes. Pharmacological inhibition or genetic deletion of nSMase2 in myelinating oligodendrocytes normalized the ceramide content of remyelinated fibers and restored myelin compaction in the cuprizone (CPZ) model of demyelination/remyelination.
RESULTS
Modifications in the lipid composition of myelin following remyelination
Compared with control mice fed a standard diet, we observed an 89.0 ± 9.5% reduction of black gold staining in the posterior corpus callosum (pCC) of mice fed a CPZ-containing diet for 4 weeks, consistent with a robust demyelination in this brain region. Four weeks after return to a standard diet, there was a considerable amount of remyelination in the pCC, but black gold staining remained 32.0 ± 4.3% below control levels (Fig. 1, A and B). Ultrastructural analysis of pCC showed a 51.0 ± 11.7% reduction in the number of myelinated axons following 4 weeks of CPZ feeding, which was partially recovered 4 weeks after return to standard diet. However, the number of myelinated axons remained 26.0 ± 23.0% below control (Fig. 1, C to E), and many axons appeared to be thinly myelinated with a decompacted structure characterized by increased focal points of curvature compared with control mice (Fig. 1, C and E). On the basis of evidence from human brain tissue studies of normal-appearing white matter close to lesion sites that contain a modified sphingolipid composition (7), we next measured how CPZ modified sphingolipid content during demyelination and at multiple time points during remyelination. After 4 weeks of a diet containing CPZ, we found that the pCC contained increased levels of multiple saturated ceramides (16:0, 20:0, 22:0, and 24:0), reduced levels of multiple saturated SMs (C20:0, 22:0, and 24:0), and a substantial reduction in multiple sulfatides (C20:0, 22:0, 22:1, 24:1, and 26:1) (Fig. 1G). This pattern of change in lipid composition was similar (albeit to a lesser degree) to that in anterior corpus callosum (aCC), cortex, and hippocampus, as well as, to a lesser extent, in striatum (STR) and cerebellum (CBL) (fig. S1). After return to a standard diet, ceramide levels slowly returned to control levels over ~6 weeks, with the exception of C18:0 ceramide (Fig. 1G). The initial reduction of SM after CPZ feeding rebounded to levels increased above control, and multiple saturated SMs remained elevated 6 weeks after return to standard diet (Fig. 1G). Decreased levels of sulfatides following CPZ feeding did not recover within 6 weeks following return to a regular diet (Fig. 1G). The pattern of increasing ceramides and decreasing SMs during demyelination is consistent with the action of nSMase2 that hydrolyzes SM to ceramide. We found that nSMase2 activity increased by 52.0 ± 3.5% in pCC after 4 weeks of CPZ feeding and was reduced but remained elevated 27.0 ± 16.5% above control levels 4 weeks after return to a regular diet (Fig. 1F).
Fig. 1. Modifications in the lipid content of remyelinated axons.
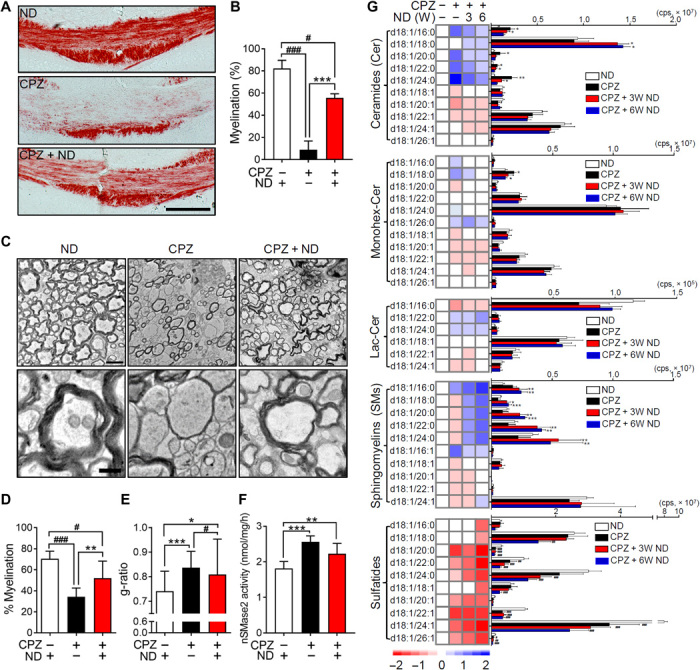
(A) Black gold staining in pCC of mice fed a normal diet (ND), a diet containing CPZ (4 weeks), and a CPZ diet (4 weeks), followed by a return to ND (CPZ + ND) (4 weeks). Images show extensive demyelination in the CPZ group and a partial restoration of myelin structure in CPZ + ND group. Scale bar, 200 μm. (B) Quantitation of black gold staining in pCC of mice fed ND, CPZ, and CPZ + ND (n = 5). (C) Representative electron microscope images of the pCC in mice fed a ND, a CPZ diet, and a CPZ + ND diet. Images show extensive demyelination in the CPZ group and partial restoration of myelin ultrastructure in the CPZ + ND group with many thinly myelinated axons with disorganized structure. Bottom images are magnifications of the corresponding top images. Scale bars, 2 μm (top) and 500 nm (bottom). (D) Quantitation of the percentage of myelinated axons and g-ratio (E) in pCC after the indicated treatment conditions (100 to 250 axons; n = 3). (F) nSMase2 activity in pCC after the indicated treatment conditions (n = 5). (G) Heatmaps (left) and quantitative comparisons (right) of the indicated sphingolipids (n = 5). Data show increases in multiple ceramides with decreases in SMs and sulfatides in the CPZ group, with time-dependent reductions of ceramides and increases in SMs in the CPZ + ND groups. Sulfatides do not recover in the CPZ + ND groups and remain depleted. Data are presented as means ± SD. *P < 0.05, **P < 0.01, ***P < 0.001, #P < 0.05, and ###P < 0.001 as indicated. Analysis of variance (ANOVA) with Tukey post hoc comparisons. cps, counts per second.
Inflammatory cytokines protect undifferentiated OPCs but promote apoptosis during OPC differentiation
Inflammation is functionally important for oligodendrocyte regeneration. Although the rate of OPCs proliferation in tissue culture was not modified by a 2-day treatment with tumor necrosis factor–α (TNFα) or interleukin-1β (IL-1β) (Fig. 2A), a 4-day treatment of OPCs with TNFα or IL-1β reduced immunoreactivity for the active form of caspase3 (Fig. 2B), consistent with a protective response to inflammatory cytokine exposure. TNFα also rapidly increased the rate of OPC migration (Fig. 2C and movies S1 and S2), suggesting that inflammatory challenge directly enhanced the migration of OPCs. We next exposed OPCs to TNFα and IL-1β every 2 days for 7 days during differentiation and found that the fraction of differentiated MBP+ oligodendrocytes was reduced from 42.5 ± 6.6% in control cultures (57 ± 32 cells/128 ± 58 cells) to 12.2 ± 1.8% with TNFα exposure (15 ± 3 cells/119 ± 2 cells) and to 15.9 ± 4.6% following IL-1β exposure (17 ± 7 cells/106 ± 24 cells) (Fig. 2, D and E). We also found a dose-related increase in the fraction of activated caspase3, with the highest dose of TNFα or IL-1β (100 ng/ml) producing a 324.0 ± 74.1% and 318.0 ± 70.9%, respectively, increase in activated caspase3 staining (Fig. 2, F and G). These data suggest that inflammatory stimuli promote a protective/instructive response in OPCs that is modified to an injurious response as OPCs differentiate into MBP+ oligodendrocytes.
Fig. 2. TNFα and IL-1β promote the survival and migration of oligodendrocyte progenitor cells but promote death during the differentiation of progenitors to mature oligodendrocytes.
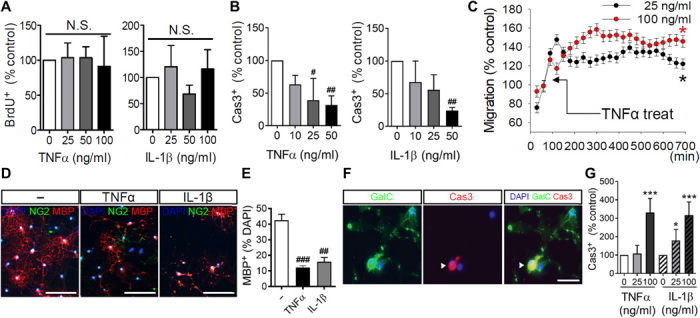
(A) Quantitation of oligodendrocyte progenitor cell (OPCs) proliferation following a dose response of TNFα (0 to 100 ng/ml) or IL-1β (0 to 100 ng/ml) as determined by incorporation of bromodeoxyuridine (BrdU; 5 μg/ml) (n = 3). (B) Quantitation of cell death in OPCs by treatment with a dose response of TNFα (0 to 100 ng/ml) or IL-1β (0 to 100 ng/ml) for four consecutive days as determined by the number of active caspase3 (Cas3)–immunopositive cells (n = 3). (C) Quantitation of OPCs migration over a 12-hour time frame showing increased cell migration following treatment with TNFα (25 or 100 ng/ml) (n = 6). (D) Representative images of OPCs induced to differentiate by the removal of platelet-derived growth factor (PDGF). Cultures showed a reduction in the number of MBP+ cells after treatment with TNFα or IL-1β (100 ng/ml) every other day for 7 days. Scale bars, 50 μm. (E) Quantitation of OPC differentiation (n = 3). Stage of differentiation was determined by quantitative analysis of MBP-immunopositive (red) cells, expressed as a percentage of total cell numbers [4′,6-diamidino-2-phenylindole (DAPI); blue]. (F) Images of caspase3 activation during differentiation of OPCs to GalC+ immature oligodendrocytes. Most caspase3-immunopositive cells were also GalC-immunopositive (green) (merge is yellow), demonstrating that caspase3 was activated during cell differentiation in response to TNFα or IL-1β. Scale bar, 50 μm. (G) Quantitation of caspase3 activation during differentiation of OPCs to GalC+ immature oligodendrocytes. Cell death was quantified as the percentage of caspase3-immunopositive (red) cells (n = 6). Data are presented as means ± SD. *P < 0.05, ***P < 0.001, #P < 0.05, ##P < 0.01, and ###P < 0.001 compared to untreated control cultures. ANOVA with Tukey post hoc comparisons. N.S., not significant.
Expression of nSMase2 modifies the cellular response to inflammatory cytokines
Our immunostaining results determined that nSMase2 was expressed in MBP+ oligodendrocytes but was not expressed in neural/glial antigen 2 (NG2+) OPCs (Fig. 3A). Oligodendrocytes exposed to TNFα increased ceramide and decreased SM content (Fig. 3B), consistent with the known linkage of TNFα to nSMase2 (14). In contrast, OPCs exposed to TNFα decreased ceramide content and increased sphingosine 1-phosphate (Fig. 3C), consistent with a protective response (15). These data suggest that the response of OPCs and oligodendrocytes to inflammatory cytokine challenge may be regulated by the expression of nSMase2. To test this notion, we artificially expressed nSMase2 in NG2+ OPCs and found that these cells became sensitive to TNFα-induced cell death and this cell death was blocked by a simultaneous addition of the nSMase2 inhibitor altenusin (Fig. 3, D to F). Expression of a control enhanced green fluorescent protein (EGFP) vector in NG2+ OPCs did not modify sensitivity to TNFα-induced cell death (pyknotic nuclei; Fig. 3F). We then reduced expression of nSMase2 in mature oligodendrocytes by lentiviral delivery of a sh-nSMase2-GFP directed against nSMase2 [or a scrambled short hairpin RNA (shRNA)–GFP] and found that oligodendrocytes were protected from TNFα-induced cell death (Fig. 3, G to I). These data suggest that the expression of nSMase2 markedly modifies the cellular response to TNFα.
Fig. 3. Manipulation of nSMase2 expression regulates cell survival in response to TNFα.
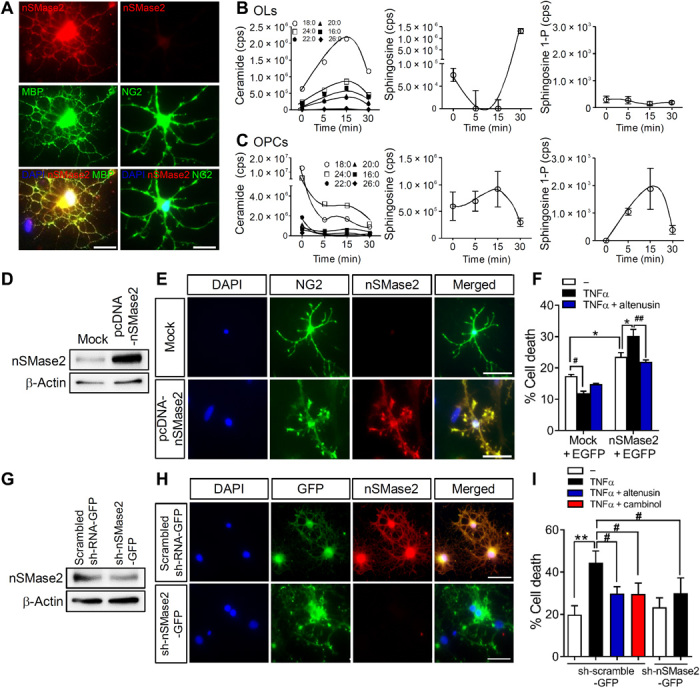
(A) Images of nSMase2 expression (red) in mature oligodendrocytes (MBP, green) and a lack of nSMase2 expression in oligodendrocyte progenitor cells (OPCs; NG2, green) (colocalization appears as yellow). Scale bars, 20 μm. (B) Analysis of sphingolipids in oligodendrocytes following treatment with TNFα (100 ng/ml) showing increases in ceramide and decreases in sphingosine (n = 3). (C) TNFα (100 ng/ml) decreased ceramide and increased sphingosine 1-phosphate (sphingosine 1-P) in OPCs (n = 3). (D) Immunoblots of nSMase2 overexpression in OPCs transfected with empty vector (Mock) or pcDNA-nSMase2. (E) Fluorescent images of NG2+ OPCs (green) transfected with an empty vector (Mock) or a vector expressing nSMase2 (pcDNA-nSMase2, red). Nuclei were stained with DAPI (blue). Scale bars, 50 μm. (F) Quantitation of cell death (pyknotic nuclei expressed as the percentage of EGFP-immunopositive cells) in OPCs transfected with empty vector or pcDNA-nSMase2 (cotransfected with EGFP-C2 as transfection indicator), followed by treatment with TNFα (100 ng/ml) (n = 3). Inhibition of nSMase2 with altenusin (25 μM) confirmed that nSMase2 expression in OPCs regulated TNFα-induced cell death of pcDNA-nSMase2 cells. (G) Knockdown of nSMase2 in oligodendrocytes transduced with a control lentivirus expressing scrambled RNA (scrambled shRNA-GFP) or shRNA directed against nSMase2 (sh-nSMase2-GFP). (H) Fluorescent images of oligodendrocytes transduced with a control lentivirus expressing scrambled RNA (scrambled shRNA-GFP) or shRNA directed against nSMase2 (sh-nSMase2-GFP). Scale bars, 50 μm. (I) Quantitation of cell death in oligodendrocytes transduced with the indicated vectors and treated with vehicle, TNFα (100 ng/ml), TNFα + altenusin (25 μM), or TNFα + cambinol (10 μM) for 24 hours (n = 3). Pyknotic nuclei were expressed as the percentage of GFP+ cells. Data are presented as means ± SD. *P < 0.05, **P < 0.01, #P < 0.05, and ##P < 0.01 as indicated. ANOVA with Tukey post hoc comparisons.
Inhibition of nSMase2 protects from CPZ-induced demyelination
We next determined whether inhibition of nSMase2 protected the integrity of white matter during demyelination (Fig. 4A). Twenty-six days of a CPZ-containing diet led to a 41.0 ± 9.2% increase in nSMase2 activity in the pCC of mice. This CPZ-associated increase in nSMase2 activity was prevented by the unilateral intraventricular infusion of cambinol (a potent inhibitor of nSMase2) (Fig. 4B) (16) delivered for 28 days by a mini-osmotic pump beginning 2 days before initiating the CPZ-containing diet. Intraventricular infusion of cambinol for 28 days did not change the health status of the mice compared to vehicle. Elevations of multiple ceramides (C16:0, 20:0, 22:0, 24:0, and 24:1; Monohex-Cer C18:0) in pCC were likewise reduced by ventricular infusion of cambinol in CPZ-fed mice (Fig. 4E). However, decreases in multiple SMs and sulfatides in CPZ-fed mice were not prevented by cambinol infusion (Fig. 4E). Black gold staining of myelin in the pCC showed that cambinol improved myelination from a 89.0 ± 9.5% reduction of staining intensity in CPZ-fed mice compared to a 59.0 ± 18.3% reduction of staining intensity in mice administered cambinol before CPZ-induced demyelination (Fig. 4, C and D). These data demonstrate that inhibition of nSMase2 before CPZ feeding prevents the rise in tissue ceramide content and partially increases the sparing of myelin.
Fig. 4. Inhibition of nSMase2 blocked CPZ-induced demyelination.
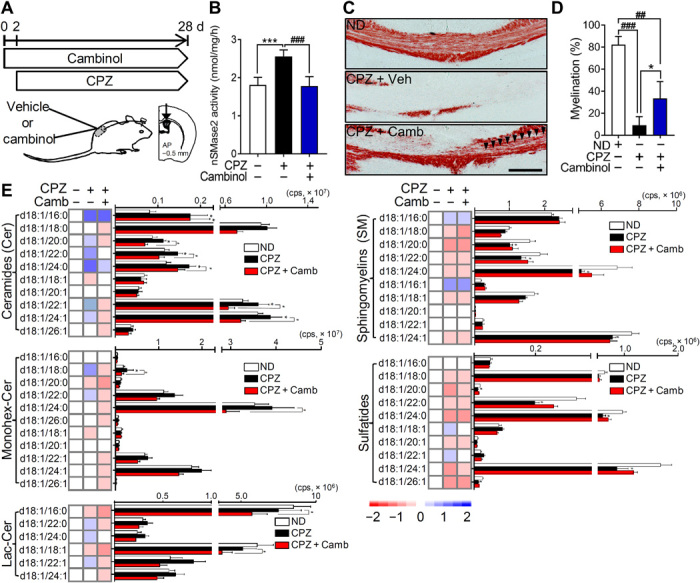
(A) Schematic illustration showing the timing of cambinol infusion during CPZ-induced demyelination. Cambinol was unilaterally infused into lateral ventricle 2 days before CPZ feeding for 28 days at the rate of 0.31 μg/kg per day. (B) Quantitation of nSMase2 activity in the cortex of mice exposed to CPZ following vehicle or cambinol infusion, showing that cambinol reduced CPZ-induced nSMase2 activity (n = 5 in each group). (C) Representative images of black gold–stained myelin in the pCC of mice from the indicated treatment groups. Arrowheads show the region of cambinol-mediated protection against CPZ-induced demyelination. Scale bar, 200 μm. (D) Quantification of black gold–stained area in the pCC showing protection from demyelination in the CPZ + cambinol group (n = 5 in each group). (E) Heatmaps and quantitative analysis of the indicated class and species of sphingolipids in the pCC of mice fed a standard diet (normal, n = 6), mice fed CPZ with vehicle infusion (n = 6), and mice fed CPZ + cambinol (n = 5). CPZ-induced increases in ceramide were reduced by cambinol infusion. Data are presented as means ± SD *P < 0.05, ***P < 0.001, #P < 0.05, ##P < 0.01, and ###P < 0.001 as indicated. ANOVA with Tukey post hoc comparisons.
Normalization of myelin ceramide content by inhibition of nSMase2
Modifications in the lipid content of myelin following remyelination remained for up to 6 weeks following the return of mice to a normal diet (ND) (i.e., during remyelination; see Fig. 1). We next determined whether inhibition of nSMase2 during the remyelination process modified the lipid content of myelin. Mice were fed a CPZ-containing diet for 28 days, followed by unilateral intraventricular infusion of cambinol for 28 days after return to an ND (Fig. 5A). Activity of nSMase2 was elevated after feeding a diet containing CPZ for 28 days and remained elevated for an additional 28 days during remyelination in mice that received vehicle infusions (Fig. 5B). Infusion of cambinol during remyelination normalized nSMase2 activity (Fig. 5B), as well as pCC ceramide content, but did not modify increases in SM or reductions in sulfatides (Fig. 5C). Similar patterns were apparent in multiple other brain regions, albeit to a lesser extent than pCC (fig. S2). Black gold staining demonstrated that the gross myelin content of pCC returned to 76% of baseline within 28 days of return to an ND (Fig. 5, D and E). Although cambinol infusion (Fig. 5, D and E) did not further increase the intensity of black gold staining in remyelinated pCC above what was apparent 28 days following the return to ND without cambinol, it did decrease cell death (cleaved caspase3-immunopositive) of oligodendrocytes [anti-adenomatous polyposis coli clone (CC1)–immunopositive] in pCC during remyelination (78.0 ± 16.6% decrease compared to vehicle; fig. S3). Ultrastructural analysis showed that cambinol increased the number of myelinated fibers by 31.0 ± 10.8% (Fig. 5, F and G), increased the thickness of myelin as evidenced by a 5.0 ± 3.2% reduction in the g-ratio, and reduced regions of enhanced membrane curvature with a consequent enhancement of myelin compaction (Fig. 5H). This improvement in myelin compaction was accompanied by improvements in neurite health. A 460.0 ± 237.9% increase in β-amyloid precursor protein (APP) staining of neurites 28 days following the initiation of a CPZ diet remained elevated at 350.7 ± 202.5% above control 28 days following the return to ND, but it was reduced to levels not different from control mice when cambinol was administered during the return to ND (Fig. 5, I and J). On the basis of evidence that lipid debris created during demyelination interacts with cellular receptors to up-regulate genes involved with the metabolism and transport of cholesterol and cholesteryl esters (CEs) (17), we measured CEs in brain tissues. CPZ markedly increased 11 of 12 CEs detected in pCC, with the largest increases in polyunsaturated CEs (Fig. 5K). None of the CEs elevated after 28 days of a CPZ-containing diet were notably reduced following 28 days of return to ND (Fig. 5K). Cambinol treatment during the return to ND significantly reduced 9 of the 11 CEs that were elevated by CPZ (Fig. 5K). A similar pattern of results was observed in the aCC, hippocampus, STR, and, to a lesser extent, cortex. However, CPZ-associated increases in CEs were not as robust in these brain regions compared with the pCC (fig. S4). These data suggest that inhibition of nSMase2 during remyelination protected remyelinating oligodendrocytes, improved the quality of myelin in remyelinated axons, and decreased the accumulation of CEs.
Fig. 5. Pharmacological inhibition of nSMase2 enhanced remyelination and improved myelin compaction.

(A) Timing of cambinol treatment following CPZ-induced demyelination. After 4 weeks of a CPZ-containing diet, cambinol was unilaterally infused for 28 days into the lateral ventricle during return to an ND. (B) Quantitation of nSMase2 activity in the cortex of mice fed a ND, a CPZ-containing diet (4 weeks), after return to a ND (4 weeks), and after return to a ND with cambinol infusion (4 weeks), showing that cambinol infusion blocks CPZ-induced up-regulation of nSMase2 activity (n = 5). (C) Cambinol infusion blocks CPZ-induced up-regulation of multiple ceramides but does not modify increases in SMs or decreases in the sulfatide content of pCC (n = 5). (D) Representative images and (E) quantitation of black gold staining in pCC following the indicated treatments (n = 5). Scale bar, 200 μm. (F) Electron microscopy images of axons in pCC following the indicated treatment conditions. Scale bars, 2 μm (top) and 500 nm (bottom). (G) Quantitation of myelinated axons in pCC showing a larger percentage of myelinated axons in CPZ + ND + cambinol mice compared to CPZ + ND + vehicle (100 to 250 axons; n = 3). (H) g-ratios in pCC showing thicker compact myelin structures in CPZ + ND + cambinol mice compared to CPZ + ND + vehicle (100 to 250 axons; n = 3). (I) Staining and (J) quantitation of APP in the pCC of mice following the indicted treatments (n = 5 in each group). Scale bar, 200 μm. (K) Heatmaps and quantitation of CEs and cholesterol in pCC from the indicated treatment groups (n = 5). Data are presented as means ± SD. *P < 0.05, **P < 0.01, ***P < 0.001, #P < 0.05, ##P < 0.01, and ###P < 0.001 as indicated. ANOVA with Tukey post hoc comparisons.
Genetic deletion of nSMase2 in remyelinating oligodendrocytes stabilized sphingolipid composition and promoted remyelination
To conditionally delete sphingomyelin phosphodiesterase 3 (smpd3) in a cell type–specific manner, we created floxed smpd3 mice (smpd3fl/fl) and then crossed these mice with PDGFRα-CreER mice (Fig. 6A) to selectively delete the nSMase2 gene in remyelinating oligodendrocytes. PDGFRα-CreER;smpd3fl/fl mice were fed a CPZ-containing diet for 4 weeks and then were administered tamoxifen (1 mg, intraperitoneally) during the first 5 days of return to ND (4 weeks). Mice were euthanized 4 weeks after return to a regular diet (Fig. 6B). Tamoxifen-induced deletion of nSMase2 in the PDGFRα-CreER;smpd3fl/fl mice was validated by immunohistochemical analysis of pCC (Fig. 6C). PDGFRα-CreER;smpd3fl/fl mice fed a CPZ-containing diet showed extensive loss of MBP+ myelin in the pCC compared to the mice fed a standard diet. In addition, expression of nSMase2 was diminished along with the loss of MBP in pCC, indicating that nSMase2 was enriched in MBP+ oligodendrocytes. Following return to standard diet, MBP+ myelin largely recovered in pCC and was enriched with nSMase2+ cells. Mice in which nSMase2 was deleted by administration of tamoxifen during remyelination exhibited complete loss of nSMase2 and almost complete recovery of MBP+ myelin in the pCC, indicating that inhibition of nSMase2 promoted remyelination. We next analyzed sphingolipid contents in these mice to confirm whether the deletion of nSMase2 stabilized sphingolipid perturbations during remyelination (Fig. 6G). Similar to the results from wild-type mice exposed to CPZ followed by remyelination, PDGFRα-CreER;smpd3fl/fl mice subjected to remyelination following CPZ exhibited elevation of multiple ceramides in pCC compared to control mice on an ND (C16:0, 20:0, 22:0, and 24:0). However, PDGFRα-CreER;smpd3fl/fl mice administered tamoxifen during remyelination had lower elevations of these multiple ceramides in pCC compared to Tam− mice (C18:0, 20:0, 22:0, 24:0, 22:1, and 24:1). Several monohexosyl ceramides (C24:0, 22:1, and 24:1) and lactosyl ceramides (C22:0 and C24:1) in the pCC of mice subjected to remyelination (CPZ + ND) were different from levels in the pCC of control mice, and deletion of nSMase2 significantly lowered their levels during remyelination. Overall levels of SMs were not significantly altered in mice where nSMase2 was deleted during remyelination. Moreover, the sustained overall decrease in multiple sulfatides in the pCC of mice during remyelination was not affected by deletion of nSMase2 during remyelination. Only one species of sulfatide (C18:0) was recovered by the deletion of nSMase2 during remyelination. Genomic deletion of nSMase2 in remyelinating oligodendrocytes resulted in an overall decrease in most of ceramides in other brain regions of PDGFRα-CreER;smpd3fl/fl mice compared to the mice with functional nSMase2 (fig. S5). These data suggest that genomic deletion of nSMase2 from remyelinating oligodendrocytes stabilized sphingolipid metabolism during remyelination.
Fig. 6. Genetic deletion of nSMase2 during remyelination improves myelin compaction.
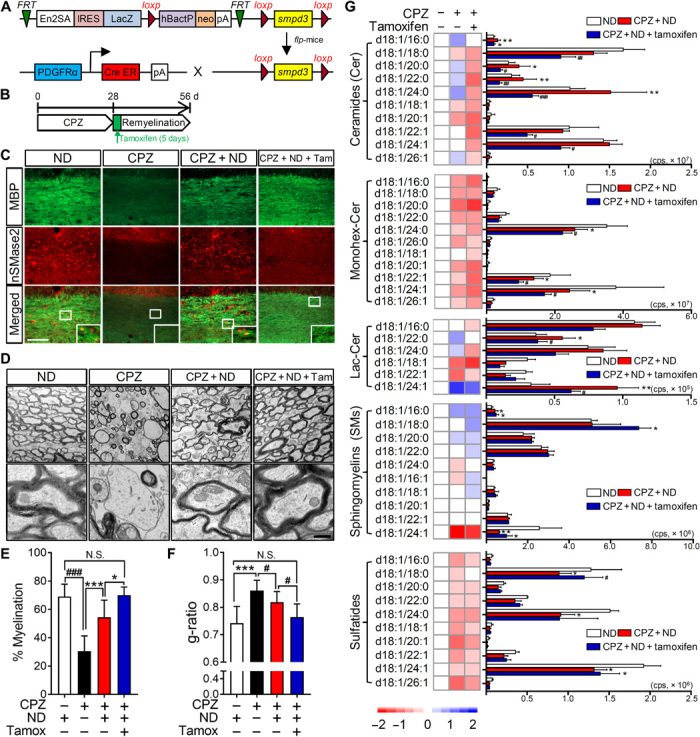
(A) Schematic illustration for creating PDGFRα-CreER-smpd3fl/fl mice. IRES, internal ribosomal entry site. (B) Schematic illustration showing the timing of CPZ feeding and tamoxifen treatment (1 mg/day, over 5 days) during the return to ND. (C) Images of MBP (green) and nSMase2 (red) fluorescence in the pCC of mice fed a ND, a CPZ-containing diet (4 weeks), a CPZ diet and return to ND (CPZ + ND) (4 weeks), and CPZ with tamoxifen induction of nSMase2 deletion during the first 5 days of return to ND (CPZ + ND + Tam). Increased expression of nSMase2 in the CPZ + ND group is absent in the CPZ + ND + Tam group, and MBP staining is more robust in the CPZ + ND + Tam group compared to the CPZ + ND group. Scale bar, 100 μm. (D) Representative electron microscopy images of pCC in mice treated with indicated conditions. Scale bar, 500 nm. (E) Quantitation of myelinated fibers in pCC showing a greater percentage of myelinated fibers in the CPZ + ND + Tam mice compared with the CPZ + ND mice (100 to 250 axons; n = 3). (F) Analysis of g-ratios for the pCC of mice showing thicker and compact myelin structures in the CPZ + ND + Tam mice compared with the CPZ + ND mice (100 to 250 axons; n = 3). (G) Heatmaps and quantitative analysis of the indicated class and species of sphingolipids in pCC of mice from the indicated treatment groups (n = 4 to 5). Ceramide content of the pCC was reduced, but SMs remained elevated and sulfatides reduced in the CPZ + ND + Tam mice compared with the CPZ + ND mice. Data are presented as means ± SD. *P < 0.05, **P < 0.01, ***P < 0.001, #P < 0.05, ##P < 0.01, and ###P < 0.001 as indicated. ANOVA with Tukey post hoc comparisons.
Remyelinated axons in the pCC of PDGFRα-CreER;smpd3fl/fl mice were indistinguishable from wild-type mice fed a CPZ diet, with 45% of the axons remaining unmyelinated. The remaining axons were thinly myelinated with a disorganized structure including enhanced focal points of curvature (Fig. 6D). In contrast, axons in the pCC of PDGFRα-CreER;smpd3fl/fl mice administered tamoxifen to delete nSMase2 from myelinating oligodendrocytes were almost completely remyelinated (101% of control), myelin was similar in thickness to control mice (94% of control) and was compacted, with no apparent enhancement in focal points of membrane curvature (Fig. 6, D to F). These results demonstrate that the deletion of nSMase2 in myelinating oligodendrocytes enhances myelination and stabilizes the structure of remyelinated axons.
DISCUSSION
Following a demyelinating event, OPCs are recruited to the lesion site where they differentiate into myelinating oligodendrocytes to repair denuded axons. The process of myelination requires that oligodendrocyte processes wrap axons and ultimately compact to stabilize the myelin sheath and underling axon. The myelin sheath consists of repeating units of lipid bilayers that are separated by 3- to 4-nm-thick aqueous layers that alternate between the cytoplasmic and extracellular faces of cellular membranes (18). Effective myelination requires a highly synchronized production of multiple types of lipids and proteins that regulate membrane curvature, intramembrane adhesion, and compaction. Even small changes in myelin lipid composition can result in the destabilization of myelin structure (6). Here, we provide evidence that this orchestrated synthesis of lipids is perturbed during remyelination through mechanisms that involve the expression and actions of the SM hydrolase nSMase2.
Sphingomyelinases produce ceramide through the hydrolysis of SM. Five types of sphingomyelinases have been identified to date that include a ubiquitous acid sphingomyelinase, a zinc-dependent acid sphingomyelinase, a Mg2+-dependent nSMase, a Mg2+-independent nSMase, and an alkaline sphingomyelinase (19). The Mg2+-dependent nSMase2 has been implicated in regulating the cellular stress response, is predominantly membrane bound, and can be directly activated by ligation of TNF receptors that are coupled to nSMase2 through linker proteins (20). IL-1β activates nSMase2 via a signaling pathway implicating IL-1 receptor 1, c-Jun N-terminal kinase, IL-1 receptor–activated protein kinase, and protein phosphatase 2A (21). It has been known since 1997 that TNFα stimulates nSMase activity in myelin to increase ceramide and CE and decrease SM (22). Ceramide is a bioactive sphingolipid that regulates a wide variety of cellular signaling events through the creation of highly ordered membrane microdomains. The creation and dispersion of these microdomains regulate the biophysical properties of cellular membranes to sequester and regulate the activity of some proteins while excluding other proteins that prefer to reside in more fluid portions of the membrane. An important biophysical property of ceramide is its marked intrinsic negative curvature that facilitates the formation of inverted hexagonal phases. This pathological modification in myelin structure from a lamellar phase to an inverted hexagonal phase with increased focal points of curvature has been observed in tissues from patients with MS and in experimental allergic encephalomyelitis (EAE) models of autoimmune demyelination (23, 24), although the mechanism for this myelin pathology has not been identified. These physical disruptions are accompanied by changes in myelin lipid content with higher phospholipid and ceramide content, increased lipid peroxidation, and reductions in sulfatide content (7, 25). We found that remyelinated axons in the CPZ model recapitulate the increased focal points of curvature and many of the modifications in lipid content observed in EAE and human brain tissues. In the CPZ model, we found that remyelination was incomplete, and many of the remyelinated axons were thinly myelinated, or the myelin was disorganized and not compacted, similar to findings by other groups (26, 27). This disorganization was accompanied by an abnormal lipid content with increased ceramide, increased SM, and reduced hexosylceramide and sulfatide. Pharmacological inhibition or a targeted knockout of nSMase2 in myelinating oligodendrocytes restored the ceramide content of remyelinated axons to levels not different from myelin in control mice not fed CPZ, increased the myelin thickness, and markedly reduced the number of axons with disorganized/uncompacted myelin. These findings suggest that normalizing ceramide content during remyelination was sufficient to markedly improve the structure of myelin.
The regulation of nSMase2 expression during the differentiation of OPCs into myelinating oligodendrocytes produces a marked shift in the cellular response to TNFα and IL-1β. OPCs do not express nSMase2 and exhibit a protective/instructional response to TNFα and IL-1β that is characterized by decreased ceramide, increased sphingosine 1-phopshate, decreased amounts of active caspase3, and increased motility. This response is consistent with the instructional nature of the early inflammatory response that protects OPCs as they migrate to the site of damage in the central nervous system. We do not, at this time, understand the mechanical linkages downstream of TNFα and IL-1β receptor ligation that are associated with this protective response in OPCs, but on the basis of previous data, it is tempting to speculate the involvement of palmitoyl protein thioesterase (PPT). This enzyme removes thioester-linked fatty acyl groups from modified cysteine residues in proteins. PPT activity decreases the ceramide content of detergent-resistant lipid rafts and protects against cell death induced by staurosporin or C2 ceramide when PPT is overexpressed (28). In the same study, the overexpression of nSMase2 increased ceramide and sensitized cells to staurosporin or C2 ceramide–induced death (28). A better understanding of the signaling pathways that promote cellular protection in the absence of nSmase2 would be beneficial to identify and therapeutically manipulate the protective components of inflammatory signaling during remyelination.
As OPCs differentiate into myelinating oligodendrocytes, they express nSMase2 and exhibit an injury response to TNFα and IL-1β that is characterized by increased ceramide, decreased sphingosine 1-phosphate, and increased cell death. This response is consistent with the damaging effects of a sustained inflammatory response. TNFα is known to promote the rapid translocation of nSMase2 to the plasma membrane by mechanisms that involve the p38 mitogen-activated protein kinase (29). This membrane localization and activation of nSMase2 by TNFα were elegantly shown to involve a translocation of the embryonic ectodermal development (EED) protein from the nucleus into the cytosol where it binds nSMase2. This complex is then targeted to the TNF receptor 1, receptor of activated protein C kinase 1 (RACK1), and Fan complex through the interactions of EED with nSMase2 and RACK1 (30). A prolonged hydrolysis of SM to ceramide in lipid raft domains stabilizes the death-inducing signaling complex (31). In this study, we found that TNFα and IL-1β increased oligodendrocyte death during differentiation from OPCs into myelinating oligodendrocytes, which could account for the decreased number of remyelinated axons in vivo. We also observed many thinly myelinated axons, consistent with damage to the surviving oligodendrocytes, and disorganized myelin structure typified by aberrant focal points of curvature. Pharmacological inhibition or genetic deletion of nSMase2 prevented the increase in ceramide content during remyelination and was sufficient to protect myelinating oligodendrocytes as evidenced by an increase in the number of myelinated axons and thicker myelin with compared structure.
The CPZ model of demyelination and remyelination is characterized by a degeneration of myelin largely in the corpus callosum, with some involvement of cortical and subcortical regions (32). Although the precise mechanism(s) of oligodendrocyte susceptibility to CPZ remains unclear, there is considerable evidence that inflammation contributes to both successful remyelination and failures to adequately remyelinate in the CPZ model. The activation of astrocytes and microglia is readily apparent in the CPZ model and appears to involve the Toll-like receptor 2 (33). Glial activation is a part of the innate immune response and is critical for remyelination. Activated astrocytes produce the chemoattractant C-X-C motif chemokine ligand 10 (CXCL10) that recruits microglia to phagocytose cellular debris during demyelination and remyelination. This clearance activity—in conjunction with the increased production of TNFα, insulin-like growth factor 1, and fibroblast growth factor-2—creates a microenvironment that supports regeneration (34). Ablation of astrocytes in a glial fibrillary acidic protein–thymidine kinase transgenic mouse model was associated with a failure to clear myelin debris and deficits in remyelination (35). Genetic ablation of CXCR3 (receptor for CXCL10 and CXCL9) likewise resulted in deficits of glial activation, debris clearance, and remyelination (36). Similar results were observed in IL-1β–, TNFα-, and TNF receptor 2–deficient mice due to a reduction in OPC proliferation and a profound delay of OPCs to differentiate into mature oligodendrocytes (37). These results emphasize the complexity of the inflammatory response and demonstrate that inhibition of inflammatory cytokine production early in the course of remyelination is detrimental to the process of remyelination.
While the inflammatory response is beneficial and necessary for tissue repair following damage, sustained inflammation can be detrimental to tissue repair. Our data suggest that the developmental expression of nSMase2 may be one mechanistic explanation for this dual effect of inflammation. OPCs do not express nSMase2 and, when exposed to TNFα or IL-1β, show reduced levels of active caspase3, increased motility, reductions in ceramide, and increases in sphingosine 1-phosphate—each is indicative of a protective response. During differentiation, maturing oligodendrocytes express nSMase2, and this expression markedly changes the cellular response to inflammatory cytokines. Mature oligodendrocytes exposed to TNFα show increased levels of active caspase3 and increased ceramide that are indicative of a toxic response. TNF and IL-1 receptors are physically associated with nSMase2 through the tryptophan-aspartic acid (WD)–repeat protein Fan (factor associated with nSMase activation) and may form a complex with other modulators including EED and RACK1 (38). Expressing nSMase2 in OPCs and genetic deletion of nSMase2 in mature oligodendrocytes confirmed that this differential response to TNFα was due to the expression (or lack of expression) of nSMase2. Thus, expression of nSMase2 during transition of OPCs to oligodendrocytes provides a promising therapeutic target, which does not modify the early protective response of OPCs to inflammatory cytokines but could protect maturing oligodendrocytes during remyelination. Since nSMase2 and ceramide are key regulators for the biogenesis of one population of extracellular vesicles shed from cells in response to TNFα and IL-1β with detrimental effects on bystander cells, the inhibition of nSMase2 could provide additional protection by reducing the release of extracellular vesicles in the setting of neuroinflammatory conditions (39, 40).
Our findings suggest that expression of nSMase2 modifies the cellular response to inflammation, from being protective in OPCs (when nSMase2 is not expressed) to damaging in myelinating oligodendrocytes. Pharmacological inhibition or genetic deletion of nSMase2 did not modify the instructive or protective response of OPCs to inflammatory stimuli but protected myelinating oligodendrocytes. Pharmacological inhibition or generic deletion of nSMase2 in maturing oligodendrocytes increased the number of remyelinated axons, partially restored myelin lipid composition, and improved the biophysical properties of myelin to allow greater compaction. We propose that the inhibition of nSMase2 could be beneficial in promoting myelin repair in MS. A more stable myelin structure is likely to be less susceptible to secondary demyelination.
MATERIALS AND METHODS
Animals and induction of demyelination/remyelination
Pregnant female Sprague-Dawley rats (embryonic day 17) and male C57BL6 mice (8 to 10 weeks old) were obtained from the Jackson laboratory (Bar Harbor, ME). Mice were housed in a temperature- and humidity-controlled room under a 12-hour light cycle. Mice were allowed to acclimate to the colony room for at least 7 days after arrival before experimentation. All procedures were conducted in accordance with the National Institutes of Health (NIH) guidelines for the Use of Animals and Humans in Neuroscience Research and approved by the Institutional Animal Care and Use Committee (Johns Hopkins University School of Medicine). To induce demyelination, mice were fed 0.2% (w/w) CPZ bis(cyclohexanone) oxaldihydrazone (Sigma-Aldrich) mixed with a powdered rodent diet containing 18% protein (Teklad Global) for 4 weeks. Mice were then returned to an ND for 4 to 6 weeks to promote remyelination (173 mice in total; 52 mice for ND and 121 mice for CPZ diet, followed by direct euthanasia, ND, or ND with drug infusion). Mice were identified by earmarks and numbered accordingly, randomly grouped before starting demyelination or remyelination. During experiments and analysis, the investigators were blinded to the experimental group.
In vivo inhibition of nSMase2 was accomplished using a mini-osmotic pump (ALZET, Cupertino, CA) to infuse cambinol (16) reconstituted in 5% dimethyl sulfoxide (DMSO), 1% Tween 80, and 94% saline into the lateral ventricle (0.31 mg per day, 0.11 μl/hour flow rate; Anterior-Posterior = −0.05 mm, Medial-Lateral = 1.0 mm, Dorsal-Ventral = 2.5 mm). Drug delivery began 2 days before initiation of the CPZ diet or after 4 weeks of the CPZ diet. Animals that received vehicle (5% DMSO, 1% Tween 80, and 94% saline) were used as a control. At the end of experimental protocols, the brains were rapidly removed and dissected on ice to isolate the pCC, aCC, cerebral cortex (CTX), hippocampus, STR, and CBL. Tissues were flash-frozen and stored at −80°C.
Conditional knockout of nSMase2
The mouse embryonic stem (ES) cells containing a conditional knockout allele for the smpd3 gene (nSMase2) were obtained from the European Conditional Mouse Mutagenesis Program (ES cell clone, HEPD0746_4_A11; targeting vector, PG00238_Z_4_F05). The ES cells harbored a LacZ reporter cassette in exon 1, resulting in expression of the β-galactosidase enzyme under the control of the endogenous smpd3 promoter. The LacZ cassette was flanked by flippase recognition target (FRT) sites that allow deletion of the LacZ and the stop codon when crossed with flippase-expressing (Flp-deletor) mice. Heterozygous male ES cells were injected into albino C57B6 embryos (Johns Hopkins University Transgenic Core facility) and implanted into females. The resultant male chimeric mice were crossed with albino C57B6 mice. Albino-coated offspring were genotyped for the presence of the LacZ gene (forward primer, 5′-CGATCGTAATCACCCGAGTGT-3′; reverse primer, 5′-CCGTGGCCTGACTCATTCC-3′; reporter, 5′-CCAGCGACCAGATGAT-3′; Transnetyx). Male mice containing the LacZ gene were then crossed with a homozygous flpo C57B6N mouse (Mutant Mouse Resource and Research Centers, NIH) to delete the LacZ gene. These mice were back-crossed with a nongenetically modified C57B6N (Charles River, Frederick, MD) strain to remove the FRT gene. Floxed smpd3 was confirmed by genotyping using wild-type smpd3 primers (forward primer, 5′-TCTTTCCTGGTCTAGTTGGCACTA-3′; reverse primer, 5′-GAGCCAGGGATGTGTTTAAAGTG-3′; reporter, 5′-TAGAGGAGCTGCAAACAT-3′) and floxed smpd3 primers (forward primer, 5′-GCTGGCGCCGGAAC-3′; reverse primer, 5′-GCGACTATAGAGATATCAACCACTTTGT-3′; reporter, 5′-AAGCTGGGTCTAGATATC-3′). Female smpd3fl/f mice were crossed with male hemizygous PdgfaR-CreER (Jackson laboratory, Bar Harbor, ME) to generate PdgfaR-CreER;smpd3fl/fl mice. The presence of Cre recombinase in PdgfaR-CreER;smpd3fl/fl mice was confirmed by genotyping (forward primer, 5′-TTAATCCATATTGGCAGAACGAAAACG-3′; reverse primer, 5′-CAGGCTAAGTGCCTTCTCTACA-3′; reporter, 5′-CCTGCGGTGCTAACC-3′). Two- to 3-month-old mice (males and females) were exposed to CPZ feeding for 4 weeks to induce demyelination and recovered for 4 weeks with ND (34 mice in total; 9 mice for ND and 25 mice for CPZ, followed by direct euthanasia, ND, or ND + tamoxifen). For the first 5 days of remyelination, the mice were administered 4-hydroxytamoxifen (1 mg/day per mouse; Sigma-Aldrich) as previously described to delete smpd3. The mice were euthanized after 4 weeks of remyelination, and the brains were rapidly extracted and stored at −80°C for analysis.
Histology and electron microscopy
Mice were transcardially perfused with 0.9% NaCl followed by 4% paraformaldehyde (PFA), and the brains were postfixed with 4% PFA for overnight at 4°C. Black gold staining was conducted according to the manufacturer’s instructions (Black Gold II myelin staining kit, EMD Millipore, Billerica, MA). Briefly, 30-μm-thick brain sections were incubated with 0.3% black gold at 60°C for 20 min. Sections were then fixed with 1% sodium thiosulfate for 3 min, dehydrated using a series of gradated alcohols, cleared in xylene, and coverslipped with mounting medium (EMD Millipore, Billerica, MA). Myelination of axons in pCC was calculated as the percent area stained with black gold in total pCC from three sequential sections (180 μm apart).
For immunohistochemical analyses, brain sections (30 μm in thickness) were incubated with 1% hydrogen peroxide at room temperature for 10 min to quench endogenous peroxidase activity, followed by incubation with 5% goat serum at room temperature for 1 hour. Sections were probed with a primary antibody for APP (1:1000; Cell Signaling Technology) at 4°C for overnight and then incubated with a biotinylated secondary antibody (1:200; Vector Laboratories, Burlingame, CA) for 1 hour. Staining was visualized using an avidin-biotin complex (1:100 of A and B; Vector Laboratories) and diaminobenzidine (Vector Laboratories) and was mounted onto slides with permanent mounting medium (Sigma-Aldrich). Microscopic images of APP-immunopositive cells were acquired using 10× objective mounted to a Zeiss Axiovert upright microscope equipped with an Axiocam MRm camera and Zen (version 2.3 sp1) imaging software. APP-immunopositive cells in pCC were calculated as the percent area stained with anti-APP antibody in total pCC from five sequential sections (180 μm apart).
For electron microscopy, mice were anesthetized with isofluorane and transcardially perfused with 4% PFA and 0.1% glutaraldehyde in 0.1 M sodium phosphate buffer (pH 7.4). The brains were postfixed with 4% PFA, 2% glutaraldehyde, 2.5% sucrose, and 3 mM NaCl in 0.1 M sodium cacodylate buffer (pH 7.4). Fixed tissues were dissected, dehydrated in graded ethanol, embedded in EMBed 812 resin (Electron Microscopy Sciences, Hatfield, PA). Thin sections (90 nm) were cut with a diamond knife using a Reichert-Jung Ultracut E ultramicrotome and picked up with copper slot (1 mm by 2 mm) grids. Grids were stained with 2% uranyl acetate, and lead citrate was then viewed using a Zeiss Libra 120 transmission electron microscope with a Veleta camera (Olympus, Muenster, Germany). g-ratios were calculated by measuring the inner and outer diameters of myelinated axons. Twenty to 50 axons from each of 10 images from every animal were counted and calculated as a percentage of myelination based on the total number of axons counted in each image divided by the myelinated axons.
Measurement of nSMase2 activity
Brain tissues were homogenized in ice-cold tris-HCl buffer (0.1 M) (pH 7.5), containing 250 mM sucrose, 10 mM EGTA (Research Products International, Prospect, IL), 100 μM sodium molybdate, and protease inhibitors. Measurement of nSMase2 activity was determined on the basis of the direct hydrolysis of [14C]-SM to [14C]-phosphorylcholine and ceramide as previously described (16). Bovine [N-methyl-14C]-SM [14C]-SM (10 μM, 52 mCi/mmol; Waltham, MA) was evaporated to dryness under a stream of nitrogen for 1 hour at 45°C. The dried [14C]-SM was reconstituted in tris-HCl buffer [0.12 M (pH 7.5); Quality Biological Inc., Gaithersburg, MD) with 20 mM MgCl2 (Sigma-Aldrich), 0.02% Triton X-100 (Sigma-Aldrich), and a mixed micelle solution of the substrate that was prepared using a 10-s vortex, a 1-min bath sonication, and a 1-min bath incubation at 37°C. The assay was conducted in eight-well polymerase chain reaction (PCR) tube strips and arranged in 96-well PCR tube racks. The reaction mixture contained 25 μl of the prepared substrate ([14C]-SM, 10 μM) and 20 μl of tissue lysate or recombinant human nSMase2. At the end of the incubation period, the reaction was terminated by the addition of 30 μl of water and 175 μl of chloroform/methanol (2:1, v/v), followed by vigorous vortexing. To achieve phase separation, PCR tubes were centrifuged at 2000g for 1 hour using a Beckman GS-6R centrifuge equipped with a PTS-2000 rotor. A 50-μl aliquot of the upper aqueous phase, containing the liberated [14C]-phosphorylcholine, was analyzed for radioactivity using PerkinElmer’s TopCount instrument in conjunction with their 96-well LumaPlates, normalized to protein content, and data are presented as picomol per milligram per hour.
Rat primary oligodendrocyte cultures
Rat oligodendrocyte progenitor cells were prepared from 3- to 5-day-old Sprague-Dawley rat cortices. Dissociated cells were plated on culture dishes coated with poly-d-lysine (10 μg/ml; Sigma-Aldrich, St. Louis, MO) in Dulbecco’s modified Eagle’s medium (DMEM) containing 15% fetal bovine serum (FBS), 2 mM glutamate (Life Technologies, Grand Island, NY), 100 μM nonessential amino acids (NEAAs; Life Technologies), 1 mM sodium pyruvate (Life Technologies), penicillin (100 U/ml), streptomycin (100 μg/ml), and platelet-derived growth factor (PDGF; 10 ng/ml) (R&D Systems, Minneapolis, MN). After 7 to 10 days in culture, OPCs were collected by shaking (200 rpm overnight) and replated in DMEM containing 0.5% FBS, 1% N2 supplement (Life Technologies), 2 mM glutamate, 100 μM NEAA, 1 mM sodium pyruvate, penicillin (100 U/ml), streptomycin (100 μg/ml), 0.5 mM N-acetylcysteine (Sigma-Aldrich), and PDGF (10 ng/ml).
OPCs were differentiated into mature oligodendrocytes by the removal of PDGF from culture media for 6 days. Cells were fixed with 4% PFA, blocked with 10% normal goat serum (v/v) in phosphate-buffered saline (PBS) containing 0.1% (v/v) Triton X-100 (PBS-T) for 1 hour at room temperature and then incubated with antibodies against NG2 (1:1000; EMD Millipore), MBP (1:1000; EMD Millipore), or galactocerebroside (GalC, 1:1000, EMD Millipore) overnight at 4°C. Cells were then washed three times with PBS-T and incubated for 1 hour at room temperature with an Alexa Fluor 488– or Alexa Fluor 594–conjugated secondary antibodies (Thermo Fisher Scientific, Waltham, MA). Approximately 60% of cells were MBP+ after 6 days of differentiation.
Cell motility
Primary OPCs cultures were maintained at 37°C and 5% CO2 in a live-imaging microscope and treated with TNF (25 or 100 ng/ml). Their dynamics were monitored continuously by collecting images every 30 min for 12 hours. Images were processed by ImageJ (NIH), and data are expressed as arbitrary units.
Manipulation of nSMase2 expression
nSMase2 expression
A pcDNA-nSMase2 vector (4 pg per cell of DNA) was delivered to OPCs by electroporation (model ECM830, Harvard Apparatus, Holliston, MA; 2-mm cuvette, voltage of 200 V, pulse length of 5 ms, single pulse/unidirection). An empty vector (Mock, pcDNA 3.1, Thermo Fisher Scientific) was used as a control. A vector expressing EGFP-C2 (Clontech, Mountain View, CA) was coelectroporated into cells as transfection indicator. Forty-eight hours after electroporation, the expression of nSMase2 was quantified by immunoblotting and immunofluorescent staining. Cells were harvested, and proteins resolved by 10% SDS–polyacrylamide gel electrophoresis and transferred to a polyvinylidene difluoride membrane (Bio-Rad, Hercules, CA). Nonspecific binding sites were blocked with 5% (w/v) milk in tris-buffered saline (TBS) containing 0.1% Tween 20 (TBS-T) and incubated with an antibody against nSMase2 (1:1000; Santa Cruz Biotechnology, Dallas, TX) overnight at 4°C. Following three washes with TBS-T, the immunoblot was incubated for 1 hour with a rabbit immunoglobulin G (IgG) horseradish peroxidase–linked antibody (1:1000; Cell Signaling Technology, Danvers, MA) in TBS-T and developed by enhanced chemiluminescence. Image analysis was conducted using a G:BOX Imaging system (Syngene, Frederick, MD). For immunostaining, the cells were fixed with 4% PFA, blocked with 10% normal goat serum for 1 hour at room temperature, and then incubated with an antibody against nSMase2 (1:200) overnight at 4°C. Cells were washed three times with PBS-T and incubated for 1 hour at room temperature with Alexa Fluor 594 conjugated with anti-rabbit IgG secondary antibody.
nSMase2 knockdown
Oligodendrocytes were pretreated with polybrene (5 μg/ml) for 10 min then infected with lentivirus expressing sh-nSMase2-GFP (sh-nSMase2-GFP, Applied Bio Materials, BC, Canada) or a scrambled RNA lentiviral vector (sc-con-GFP) (both multiplicity of infection at 5.0), and knockdown of nSMase2 was validated by immunofluorescence and immunoblotting.
Cell proliferation and survival
Cell proliferation was quantified in OPCs treated with bromodeoxyuridine (BrdU; 0.5 mg/ml) (Sigma-Aldrich, St. Louis, MO) before exposure to TNFα (0 to 100 ng/ml), IL-1β (0 to 100 ng/ml), or vehicle for 2 days. Cells were fixed with 4% PFA, treated with 2 N HCl for 30 min, and pH-neutralized with sodium borate (pH 9.0) for 10 min. Nonspecific binding was blocked with 10% normal goat serum in PBS-T, and cells were incubated with an antibody directed against BrdU (1:200; Sigma-Aldrich, St. Louis, MO) for 2 hours at room temperature in PBS. Cells were washed three times with PBS and incubated for 2 hours at room temperature with an Alexa Fluor 594–conjugated secondary antibody in PBS-T (Thermo Fisher Scientific, Waltham, MA). Cells were washed and mounted on glass slides (Vector Laboratories, Burlingame, CA).
Cell survival was quantified in OPCs and oligodendrocytes 16 hours after treatment with TNFα (100 ng/ml) or IL-1β (100 ng/ml). Nuclei were stained with Hoechst (1 μg/ml; Thermo Fisher Scientific) and fixed, and the number of pyknotic nuclei was expressed as a ratio to the number of diffusely stained nuclei (healthy). In some experiments, survival was also determined by immunostaining for active caspase3. Nonspecific binding was blocked with normal goat and horse serum in PBS-T for 2 hours at room temperature. Cells were then washed three times with PBS and incubated with an anti-active caspase3 antibody (1:200; EMD Millipore, Billerica, MA) for 2 hours at room temperature. Proliferation and survival were quantified in a minimum of 150 cells from at least three independent experiments by an experimenter blinded to the experimental condition.
Pharmacological treatments
Cells were pretreated with the nSMase2 inhibitor altenusin (25 μM; Enzo Life Sciences Inc., Farmingdale, NY) and cambinol (10 μM; Sigma-Aldrich) for 30 min before experimental treatments.
Mass spectrometry
A crude lipid extraction of the pCC, aCC, CTX, STR, hippocampus, and CBL was performed using a modified Bligh-Dyer procedure with ceramide and SM d18:0/12:0 included as internal standards (Avanti Polar Lipids, Alabaster, AL, USA). The organic layers containing the crude lipid extracts were dried in a nitrogen evaporator (Organomation, Berlin, MA, USA) and suspended in MeOH before analysis. Chromatographic separations were conducted using a Shimadzu ultrafast liquid chromatography system (Shimadzu, Nakagyo-ku, Kyoto, Japan) coupled to a C18 reverse-phase column (Phenomenex, Torrance, CA, USA). Eluted samples were injected into an API3000 triple quadrupole mass spectrometer (AB Sciex Inc., Thornhill, ON, Canada) where individual ceramide and SM species were detected by multiple reaction monitoring. Instrument and high-performance liquid chromatography parameters have been previously described (41, 42). Eight-point calibration curves (0.1 to 1000 ng/ml) were constructed by plotting the area under the curve for each ceramide calibration standard d18:1/C16:0, d18:1/C18:0, d18:1/C20:0, d18:1/C22:0, and d18:1/C24:0 and SM calibrations standards C16:0, C18:0, C20:0, C22:0, and C24:0 (Avanti Polar Lipids, Alabaster, AL, USA). Correlation coefficients for standard curves were >0.999. Ceramide and SM concentrations were calculated by fitting the identified ceramide and SM species to these standard curves based on acyl chain length. Intraday coefficients of variation for each ceramide SM species were less than 10% (42). Instrument control and quantification were performed using Analyst 1.4.2 and MultiQuant software (AB Sciex Inc., Thornhill, ON, Canada).
Statistics
Data were analyzed by one-way analysis of variance (one-way ANOVA), followed by Tukey post hoc comparisons when group differences were significant (GraphPad Software, La Jolla, CA, USA). Results are expressed as means ± SD as indicated.
Supplementary Material
Acknowledgments
Funding: These studies were supported by the NIH grants MH110246, DA040390, MH096636, and MH105280 to N.J.H. and R37NS041435 to P.A.C. Support was also provided by the Hilton Foundation to P.A.C. and N.J.H. and by the Dr. Miriam and Sheldon G. Adelson Medical Research Foundation to D.E.B. A.A. was supported by the National Multiple Sclerosis Society postdoctoral fellowship (FG 1927-A-1), the Chica and Heinz Schaller Research Foundation, and a grant from the Deutsche Forschungsgemeinschaft [FOR 2289 (P8): AG 287/1-1]. Author contributions: The study was designed by S.-W.Y. and N.J.H. Most of in vivo and in vitro experiments were performed by S.-W.Y. CPZ feeding in mice was performed by M.D.S. Creation of PDGF-Cre-Smpd3 mice was performed by A.A. Analyses of electron microscopy were performed by S.-W.Y. and S.S.K. Analyses of nSMase2 activity were performed by A.G.T. All of the liquid chromatography–mass spectrometry analyses were performed by E.G.B. and M.M. Manuscript revisions and comments included contributions from C.R., B.S.S., D.E.B., and P.A.C. S.-W.Y. and N.J.H. wrote the manuscript. All authors read and revised the manuscript. Competing interests: The authors declare that they have no competing interests. Data and materials availability: All data needed to evaluate the conclusions in the paper are present in the paper and/or the Supplementary Materials. Additional data related to this paper may be requested from the authors.
SUPPLEMENTARY MATERIALS
Supplementary material for this article is available at http://advances.sciencemag.org/cgi/content/full/6/40/eaba5210/DC1
REFERENCES AND NOTES
- 1.Lublin F. D., Reingold S. C., Cohen J. A., Cutter G. R., Sørensen P. S., Thompson A. J., Wolinsky J. S., Balcer L. J., Banwell B., Barkhof F., Bebo B., Calabresi P. A., Clanet M., Comi G., Fox R. J., Freedman M. S., Goodman A. D., Inglese M., Kappos L., Kieseier B. C., Lincoln J. A., Lubetzki C., Miller A. E., Montalban X., O’Connor P. W., Petkau J., Pozzilli C., Rudick R. A., Sormani M. P., Stüve O., Waubant E., Polman C. H., Defining the clinical course of multiple sclerosis: The 2013 revisions. Neurology 83, 278–286 (2014). [DOI] [PMC free article] [PubMed] [Google Scholar]
- 2.Correale J., Gaitán M. I., Ysrraelit M. C., Fiol M. P., Progressive multiple sclerosis: From pathogenic mechanisms to treatment. Brain 140, 527–546 (2017). [DOI] [PubMed] [Google Scholar]
- 3.Nawaz S., Kippert A., Saab A. S., Werner H. B., Lang T., Nave K.-A., Simons M., Phosphatidylinositol 4,5-bisphosphate-dependent interaction of myelin basic protein with the plasma membrane in oligodendroglial cells and its rapid perturbation by elevated calcium. J. Neurosci. 29, 4794–4807 (2009). [DOI] [PMC free article] [PubMed] [Google Scholar]
- 4.Min Y., Kristiansen K., Boggs J. M., Husted C., Zasadzinski J. A., Israelachvili J., Interaction forces and adhesion of supported myelin lipid bilayers modulated by myelin basic protein. Proc. Natl. Acad. Sci. U.S.A. 106, 3154–3159 (2009). [DOI] [PMC free article] [PubMed] [Google Scholar]
- 5.Watson M. C., Morriss-Andrews A., Welch P. M., Brown F. L., Thermal fluctuations in shape, thickness, and molecular orientation in lipid bilayers. II. Finite surface tensions. J. Chem. Phys. 139, 084706 (2013). [DOI] [PubMed] [Google Scholar]
- 6.Shaharabani R., Ram-On M., Talmon Y., Beck R., Pathological transitions in myelin membranes driven by environmental and multiple sclerosis conditions. Proc. Natl. Acad. Sci. U.S.A. 115, 11156–11161 (2018). [DOI] [PMC free article] [PubMed] [Google Scholar]
- 7.Wheeler D., Bandaru V. V., Calabresi P. A., Nath A., Haughey N. J., A defect of sphingolipid metabolism modifies the properties of normal appearing white matter in multiple sclerosis. Brain 131, 3092–3102 (2008). [DOI] [PMC free article] [PubMed] [Google Scholar]
- 8.Payne S. C., Bartlett C. A., Harvey A. R., Dunlop S. A., Fitzgerald M., Myelin sheath decompaction, axon swelling, and functional loss during chronic secondary degeneration in rat optic nerve. Invest. Ophthalmol. Vis. Sci. 53, 6093–6101 (2012). [DOI] [PubMed] [Google Scholar]
- 9.O’Brien J. S., Sampson E. L., Lipid composition of the normal human brain: Gray matter, white matter, and myelin. J. Lipid Res. 6, 537–544 (1965). [PubMed] [Google Scholar]
- 10.Simons M., Krämer E. M., Thiele C., Stoffel W., Trotter J., Assembly of myelin by association of proteolipid protein with cholesterol- and galactosylceramide-rich membrane domains. J. Cell Biol. 151, 143–154 (2000). [DOI] [PMC free article] [PubMed] [Google Scholar]
- 11.Steshenko O., Andrade D. M., Honigmann A., Mueller V., Schneider F., Sezgin E., Hell S. W., Simons M., Eggeling C., Reorganization of lipid diffusion by myelin basic protein as revealed by STED nanoscopy. Biophys. J. 110, 2441–2450 (2016). [DOI] [PMC free article] [PubMed] [Google Scholar]
- 12.Bakhti M., Aggarwal S., Simons M., Myelin architecture: Zippering membranes tightly together. Cell. Mol. Life Sci. 71, 1265–1277 (2014). [DOI] [PMC free article] [PubMed] [Google Scholar]
- 13.Bakhti M., Snaidero N., Schneider D., Aggarwal S., Möbius W., Janshoff A., Eckhardt M., Nave K.-A., Simons M., Loss of electrostatic cell-surface repulsion mediates myelin membrane adhesion and compaction in the central nervous system. Proc. Natl. Acad. Sci. U.S.A. 110, 3143–3148 (2013). [DOI] [PMC free article] [PubMed] [Google Scholar]
- 14.Adam-Klages S., Adam D., Wiegmann K., Struve S., Kolanus W., Schneider-Mergener J., Krönke M., FAN, a novel WD-repeat protein, couples the p55 TNF-receptor to neutral sphingomyelinase. Cell 86, 937–947 (1996). [DOI] [PubMed] [Google Scholar]
- 15.Brait V. H., Tarrasón G., Gavaldà A., Godessart N., Planas A. M., Selective sphingosine 1-phosphate receptor 1 agonist is protective against ischemia/reperfusion in mice. Stroke 47, 3053–3056 (2016). [DOI] [PubMed] [Google Scholar]
- 16.Figuera-Losada M., Stathis M., Dorskind J. M., Thomas A. G., Bandaru V. V. R., Yoo S.-W., Westwood N. J., Rogers G. W., McArthur J. C., Haughey N. J., Slusher B. S., Rojas C., Cambinol, a novel inhibitor of neutral sphingomyelinase 2 shows neuroprotective properties. PLOS ONE 10, e0124481 (2015). [DOI] [PMC free article] [PubMed] [Google Scholar]
- 17.Nugent A. A., Lin K., van Lengerich B., Lianoglou S., Przybyla L., Davis S. S., Llapashtica C., Wang J., Kim D. J., Xia D., Lucas A., Baskaran S., Haddick P. C. G., Lenser M., Earr T. K., Shi J., Dugas J. C., Andreone B. J., Logan T., Solanoy H. O., Chen H., Srivastava A., Poda S. B., Sanchez P. E., Watts R. J., Sandmann T., Astarita G., Lewcock J. W., Monroe K. M., Di Paolo G., TREM2 regulates microglial cholesterol metabolism upon chronic phagocytic challenge. Neuron 105, 837–854.e9 (2020). [DOI] [PubMed] [Google Scholar]
- 18.Inouye H., Kirschner D. A., Membrane interactions in nerve myelin. I. Determination of surface charge from effects of pH and ionic strength on period. Biophys. J. 53, 235–245 (1988). [DOI] [PMC free article] [PubMed] [Google Scholar]
- 19.Marchesini N., Hannun Y. A., Acid and neutral sphingomyelinases: Roles and mechanisms of regulation. Biochem. Cell Biol. 82, 27–44 (2004). [DOI] [PubMed] [Google Scholar]
- 20.Neumeyer J., Hallas C., Merkel O., Winoto-Morbach S., Jakob M., Thon L., Adam D., Schneider-Brachert W., Schütze S., TNF-receptor I defective in internalization allows for cell death through activation of neutral sphingomyelinase. Exp. Cell Res. 312, 2142–2153 (2006). [DOI] [PubMed] [Google Scholar]
- 21.Karakashian A. A., Giltiay N. V., Smith G. M., Nikolova-Karakashian M. N., Expression of neutral sphingomyelinase-2 (NSMase-2) in primary rat hepatocytes modulates IL-β-induced JNK activation. FASEB J. 18, 968–970 (2004). [DOI] [PubMed] [Google Scholar]
- 22.Chakraborty G., Ziemba S., Drivas A., Ledeen R. W., Myelin contains neutral sphingomyelinase activity that is stimulated by tumor necrosis factor-α. J. Neurosci. Res. 50, 466–476 (1997). [DOI] [PubMed] [Google Scholar]
- 23.Riccio P., Fasano A., Borenshtein N., Bleve-Zacheo T., Kirschner D. A., Multilamellar packing of myelin modeled by lipid-bound MBP. J. Neurosci. Res. 59, 513–521 (2000). [DOI] [PubMed] [Google Scholar]
- 24.Ohler B., Graf K., Bragg R., Lemons T., Coe R., Genain C., Israelachvili J., Husted C., Role of lipid interactions in autoimmune demyelination. Biochim. Biophys. Acta 1688, 10–17 (2004). [DOI] [PubMed] [Google Scholar]
- 25.Takahashi T., Suzuki T., Role of sulfatide in normal and pathological cells and tissues. J. Lipid Res. 53, 1437–1450 (2012). [DOI] [PMC free article] [PubMed] [Google Scholar]
- 26.Tagge I., O’Connor A., Chaudhary P., Pollaro J., Berlow Y., Chalupsky M., Bourdette D., Woltjer R., Johnson M., Rooney W., Spatio-temporal patterns of demyelination and remyelination in the cuprizone mouse model. PLOS ONE 11, e0152480 (2016). [DOI] [PMC free article] [PubMed] [Google Scholar]
- 27.Mullin A. P., Cui C., Wang Y., Wang J., Troy E., Caggiano A. O., Parŕy T. J., Colburn R. W., Pavlopoulos E., rHIgM22 enhances remyelination in the brain of the cuprizone mouse model of demyelination. Neurobiol. Dis. 105, 142–155 (2017). [DOI] [PubMed] [Google Scholar]
- 28.Goswami R., Ahmed M., Kilkus J., Han T., Dawson S. A., Dawson G., Differential regulation of ceramide in lipid-rich microdomains (rafts): Antagonistic role of palmitoyl:protein thioesterase and neutral sphingomyelinase 2. J. Neurosci. Res. 81, 208–217 (2005). [DOI] [PubMed] [Google Scholar]
- 29.Clarke C. J., Truong T.-G., Hannun Y. A., Role for neutral sphingomyelinase-2 in tumor necrosis factor α-stimulated expression of vascular cell adhesion molecule-1 (VCAM) and intercellular adhesion molecule-1 (ICAM) in lung epithelial cells: p38 MAPK is an upstream regulator of nSMase2. J. Biol. Chem. 282, 1384–1396 (2007). [DOI] [PubMed] [Google Scholar]
- 30.Philipp S., Puchert M., Adam-Klages S., Tchikov V., Winoto-Morbach S., Mathieu S., Deerberg A., Kolker L., Marchesini N., Kabelitz D., Hannun Y. A., Schütze S., Adam D., The polycomb group protein EED couples TNF receptor 1 to neutral sphingomyelinase. Proc. Natl. Acad. Sci. U.S.A. 107, 1112–1117 (2010). [DOI] [PMC free article] [PubMed] [Google Scholar]
- 31.Grassmé H., Cremesti A., Kolesnick R., Gulbins E., Ceramide-mediated clustering is required for CD95-DISC formation. Oncogene 22, 5457–5470 (2003). [DOI] [PubMed] [Google Scholar]
- 32.Matsushima G. K., Morell P., The neurotoxicant, cuprizone, as a model to study demyelination and remyelination in the central nervous system. Brain Pathol. 11, 107–116 (2001). [DOI] [PMC free article] [PubMed] [Google Scholar]
- 33.Esser S., Göpfrich L., Bihler K., Kress E., Nyamoya S., Tauber S. C., Clarner T., Stope M. B., Pufe T., Kipp M., Brandenburg L.-O., Toll-like receptor 2-mediated glial cell activation in a mouse model of cuprizone-induced demyelination. Mol. Neurobiol. 55, 6237–6249 (2018). [DOI] [PubMed] [Google Scholar]
- 34.Voss E. V., Škuljec J., Gudi V., Skripuletz T., Pul R., Trebst C., Stangel M., Characterisation of microglia during de- and remyelination: Can they create a repair promoting environment? Neurobiol. Dis. 45, 519–528 (2012). [DOI] [PubMed] [Google Scholar]
- 35.Skripuletz T., Hackstette D., Bauer K., Gudi V., Pul R., Voss E., Berger K., Kipp M., Baumgärtner W., Stangel M., Astrocytes regulate myelin clearance through recruitment of microglia during cuprizone-induced demyelination. Brain 136, 147–167 (2013). [DOI] [PubMed] [Google Scholar]
- 36.Krauthausen M., Saxe S., Zimmermann J., Emrich M., Heneka M. T., Müller M., CXCR3 modulates glial accumulation and activation in cuprizone-induced demyelination of the central nervous system. J. Neuroinflammation 11, 109 (2014). [DOI] [PMC free article] [PubMed] [Google Scholar]
- 37.Mason J. L., Suzuki K., Chaplin D. D., Matsushima G. K., Interleukin-1β promotes repair of the CNS. J. Neurosci. 21, 7046–7052 (2001). [DOI] [PMC free article] [PubMed] [Google Scholar]
- 38.Tcherkasowa A. E., Adam-Klages S., Kruse M.-L., Wiegmann K., Mathieu S., Kolanus W., Krönke M., Adam D., Interaction with factor associated with neutral sphingomyelinase activation, a WD motif-containing protein, identifies receptor for activated C-kinase 1 as a novel component of the signaling pathways of the p55 TNF receptor. J. Immunol. 169, 5161–5170 (2002). [DOI] [PubMed] [Google Scholar]
- 39.Trajkovic K., Hsu C., Chiantia S., Rajendran L., Wenzel D., Wieland F., Schwille P., Brügger B., Simons M., Ceramide triggers budding of exosome vesicles into multivesicular endosomes. Science 319, 1244–1247 (2008). [DOI] [PubMed] [Google Scholar]
- 40.Datta Chaudhuri A., Dasgheyb R. M., DeVine L. R., Bi H., Cole R. N., Haughey N. J., Stimulus-dependent modifications in astrocyte-derived extracellular vesicle cargo regulate neuronal excitability. Glia 68, 128–144 (2020). [DOI] [PubMed] [Google Scholar]
- 41.Mielke M. M., Bandaru V. V. R., Han D., An Y., Resnick S. M., Ferrucci L., Haughey N. J., Demographic and clinical variables affecting mid- to late-life trajectories of plasma ceramide and dihydroceramide species. Aging Cell 14, 1014–1023 (2015). [DOI] [PMC free article] [PubMed] [Google Scholar]
- 42.Mielke M. M., Bandaru V. V. R., Han D., An Y., Resnick S. M., Ferrucci L., Haughey N. J., Factors affecting longitudinal trajectories of plasma sphingomyelins: The Baltimore longitudinal study of aging. Aging Cell 14, 112–121 (2015). [DOI] [PMC free article] [PubMed] [Google Scholar]
Associated Data
This section collects any data citations, data availability statements, or supplementary materials included in this article.
Supplementary Materials
Supplementary material for this article is available at http://advances.sciencemag.org/cgi/content/full/6/40/eaba5210/DC1