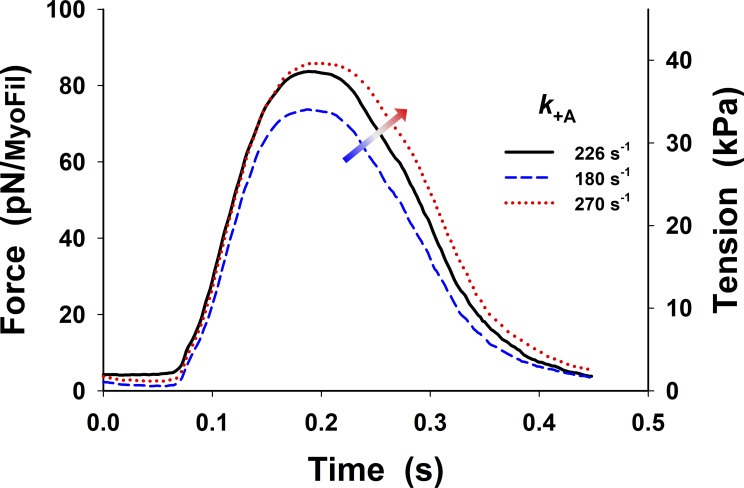
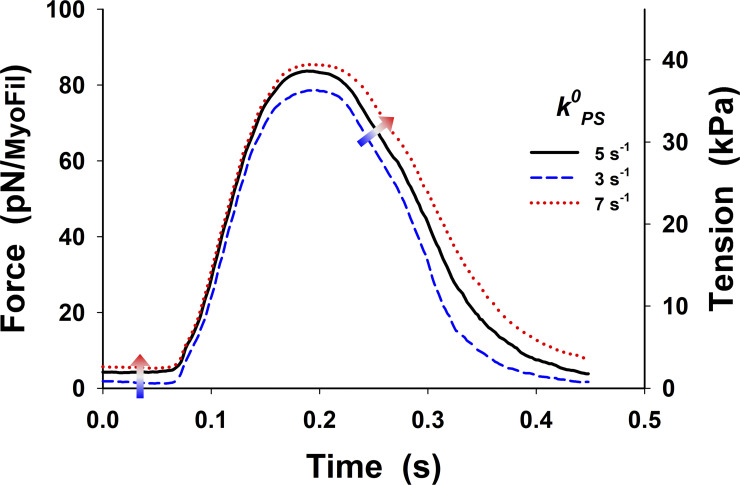
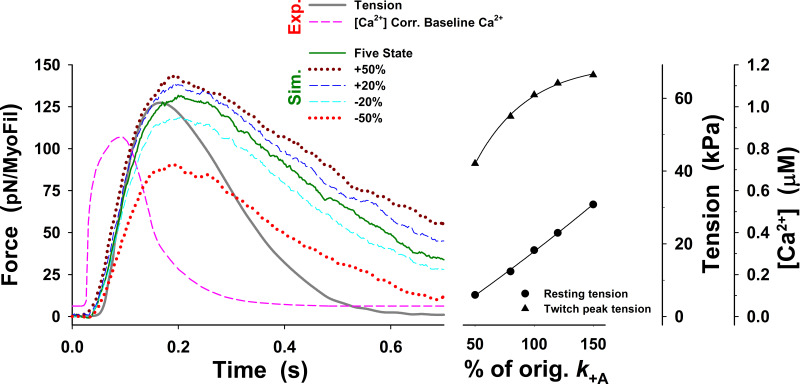
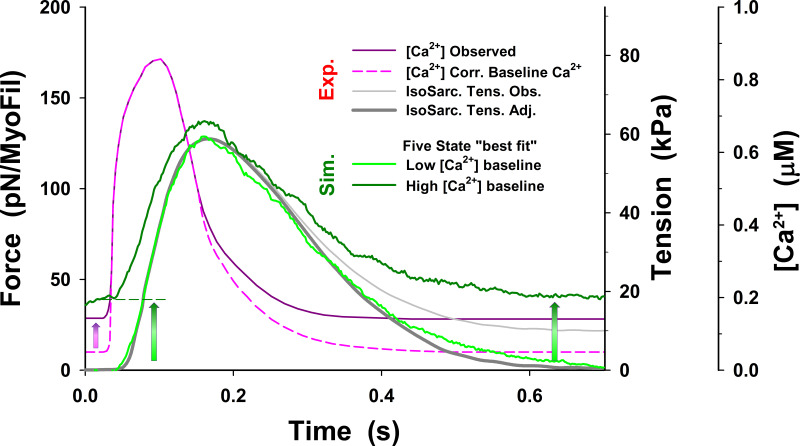
Our multiscale modeling approach incorporates the spatial and chemomechanical properties of sarcomeres for simulation of the mechanical performance of striated muscle. In this study, we demonstrate the ability to simulate the twitch tension and kinetics of cardiac muscle, and this requires inclusion of muscle elasticity and thick-filament regulation. The model provides precise simulations of twitch contractions in rat cardiac muscle, and the parameters used can accurately predict the Ca2+ sensitivity of force in an intact muscle.
Abstract
Understanding the dynamics of a cardiac muscle twitch contraction is complex because it requires a detailed understanding of the kinetic processes of the Ca2+ transient, thin-filament activation, and the myosin–actin cross-bridge chemomechanical cycle. Each of these steps has been well defined individually, but understanding how all three of the processes operate in combination is a far more complex problem. Computational modeling has the potential to provide detailed insight into each of these processes, how the dynamics of each process affect the complexity of contractile behavior, and how perturbations such as mutations in sarcomere proteins affect the complex interactions of all of these processes. The mechanisms involved in relaxation of tension during a cardiac twitch have been particularly difficult to discern due to nonhomogeneous sarcomere lengthening during relaxation. Here we use the multiscale MUSICO platform to model rat trabecular twitches. Validation of computational models is dependent on being able to simulate different experimental datasets, but there has been a paucity of data that can provide all of the required parameters in a single experiment, such as simultaneous measurements of force, intracellular Ca2+ transients, and sarcomere length dynamics. In this study, we used data from different studies collected under similar experimental conditions to provide information for all the required parameters. Our simulations established that twitches either in an isometric sarcomere or in fixed-length, multiple-sarcomere trabeculae replicate the experimental observations if models incorporate a length–tension relationship for the nonlinear series elasticity of muscle preparations and a scheme for thick-filament regulation. The thick-filament regulation assumes an off state in which myosin heads are parked onto the thick-filament backbone and are unable to interact with actin, a state analogous to the super-relaxed state. Including these two mechanisms provided simulations that accurately predict twitch contractions over a range of different conditions.
Introduction
In cardiac muscle, transient increases in the cytosolic calcium concentration trigger twitchlike contractions during the systolic phase of heart function (Gordon et al., 2000). Ca2+ binding to cardiac troponin (cTn) results in movement of tropomyosin (Tpm) over the F-actin surface of the thin filament. This exposes myosin-binding sites on actin that allow for myosin–actin cross-bridge formation, cyclic interactions of myosin heads with actin, force generation, and contraction. After reaching a peak, intracellular Ca2+ concentration ([Ca2+]) is rapidly removed from the cytosol, lowering [Ca2+], enhancing additional dissociation of Ca2+ from cTn, and allowing Tpm to return to its blocking position. The increasing number of Tpms in the blocked position reduces overall binding flux, reduces the number of bound cross-bridges, and results in muscle relaxation. Understanding the dynamics of this process in a single twitch contraction is complicated because it requires a detailed understanding of the kinetics of each step of the process: the Ca2+ transient, the dynamics of the troponin (Tn)–Tpm switch, and the myosin cross-bridge chemomechanical cycle. Each of these steps is well defined individually, but how all three processes work in combination is not understood. Here we build on our previous work on modeling the different elements of the contraction cycle to define a novel multiscale model of a cardiac muscle twitch contraction.
Computational models have the potential to interconnect multiple types of experiments and protocols and can be a useful tool for generating and testing hypotheses regarding the mechanisms of contractile function in healthy hearts and contractile dysfunction in diseased hearts. Early models defined structural cooperative effects in sarcomeres, such as end-to-end interactions between adjacent Tpm–Tn regulatory units, between cross-bridges bound to actin and the thin-filament regulatory units, and between neighboring bound cross-bridges (Campbell et al., 2001; Rice et al., 2008; Tanner et al., 2012). Several of these models are derived from the original formulation by Razumova et al. (1999, 2000), where the muscle tension is proportional to the product of fractional occupancy of the myosin bound states and the mean cross-bridge distortion of each state population. The approximation of strain-dependent distributions by mean distortions is mathematically effective because the model can be defined by a system of ordinary differential equations. The newer generations of spatially explicit models, coupled with a cross-bridge cycle and thin-filament regulation by Ca2+, show significantly improved relationships between molecular interactions and muscle fiber behavior (Chan et al., 2000; Tanner et al., 2012; Mijailovich et al., 2016; Mijailovich et al., 2019). The key feature of these models is the ability to predict mechanical response to Ca2+ transients reflecting cardiac muscle behavior in a living heart. The dynamic relationships in a contraction are defined by the coupling of thin-filament regulation by Ca2+ and the strain-dependent kinetics of myosin binding to actin. However, just as with experiments studying force generation and cross-bridge cycling, this type of model has been limited primarily to simulating force generation under steady-state Ca2+ conditions (Chase et al., 2004; Kataoka et al., 2007; Tanner et al., 2007; Tanner et al., 2008; Tanner et al., 2012). Modeling twitch contractions has been approached with different levels of complexity, ranging from models based on solution of ordinary differential equations (Campbell et al., 2001; Niederer et al., 2006; Rice et al., 2008; Land et al., 2017), to a spatially detailed cardiac sarcomere model (Washio et al., 2012), to a continuous time Markov (regulatory) chain coupled with a generalized Huxley 57 model (Regazzoni et al., 2020), to more detailed models based on solution of partial differential equations (Chung et al., 2017; Campbell et al., 2018).
Moreover, the latest models include mechanisms that could alter cardiac muscle contractility by structural changes in thick filaments. Possible mechanisms could include “mechanosensing” in thick filaments (Linari et al., 2015; Irving, 2017) and interfilament mechanical signaling by myosin-binding protein C (MyBP-C; Kampourakis et al., 2016; Irving, 2017; Brunello et al., 2020). Following these ideas, Campbell et al. (2018) hypothesized that the transition rate from the parked state (PS) to the myosin on state, which permits binding to actin, is dependent on force. They successfully fitted the length-dependent activation data, where the twitch contractions only include fitting of the observed tension traces, but they did not take into account the observed significant shortening and lengthening at the sarcomere level known to occur in trabeculae held at fixed length (Janssen and de Tombe, 1997; Ferrantini et al., 2014; Caremani et al., 2016). In addition, these fits were achieved in the model using simplified cross-bridge cycle kinetics and sarcomere geometry. The simulations of twitch contractions, in which transition rate from PS state to M.D.Pi (myosin head with nucleotides ADP and phosphate, Pi) are force dependent, using a more detailed model (muscle simulation code, MUSICO), however, showed that the relaxation of tension is slow at higher levels of tension even when the [Ca2+] falls to low values. Our preliminary results suggest that the transition rate from PS state should be defined by the relationship of some process other than a linear dependence on tension because the PS should act as a sink for myosin heads during relaxation and a source for additional myosin head recruitment during contractions (Prodanovic et al., 2020).
Taken together, all of these models can more or less successfully replicate observed tension traces in response to Ca2+ transients. However, they all include a large number of simplifications, so that changes in molecular interactions within sarcomeres, such as by mutations of contractile and regulatory proteins, may not be transparent across the multiple length scales. Thus, these models may not be able to translate the changes at the molecular level to the observed changes in cardiac muscle behavior in associated diseases.
Furthermore, a major challenge in validating computational models by simulating experimental data has been the variability in conditions used by investigators. For example, some experimenters have recorded tension and sarcomere length (SL) transients but not the Ca2+ transient (Caremani et al., 2016), or they have recorded Ca2+ and tension transients at different temperatures without monitoring changes in the SL during the twitch in fixed-length trabeculae (Janssen et al., 2002). The only studies that we are aware of that reported [Ca2+], tension, and SL simultaneously were reported by Janssen and de Tombe (1997) and Ferrantini et al. (2014). Studies that do not include SL control do not account for the series elastic (SE) compliance, i.e., for significant changes in SLs during contractions of intact muscle preparations held at a fixed length. Attempts to take this SE compliance into account include the study by Kataoka et al. (2007), where the series compliance of trabeculae was exclusively attributed to the compliance of thin and thick filaments but did not account for SL changes caused by SE compliance of trabeculae. This series compliance was considered by Rice et al. (2008), who demonstrated a profound effect on the tension response during twitch contractions. However, Rice at al. used a model that showed only the sensitivity of the responses to a large range of simulated compliances, with little reference to experimental data. To more precisely simulate the steady-state and dynamic properties of striated muscle contraction and relaxation, all compliances and SL changes must be considered because cross-bridge kinetics is sensitive to the changing load as the sarcomeres shorten or lengthen.
In this study, we report a model that more precisely defines the multiple sarcomere parameters that vary during contraction and relaxation, using the methodology implemented in the MUSICO computational platform (Mijailovich et al., 2016; Mijailovich et al., 2019). This model allows simulation of the tension developed during a twitch contraction, as well as the kinetics of contraction and relaxation. Previous models have successfully simulated the kinetics but have accomplished this using a normalized force value. We initially simulated the twitch data of Janssen and de Tombe, 1997; Caremani et al., 2016 without normalizing tension using a five-state cross-bridge model. This resulted in an elevation of resting force and prolonged relaxation that were addressed by addition of two features: (1) SE compliance to account for shortening and lengthening of sarcomeres during a twitch in a trabecula kept at fixed length and (2) expansion of the cross-bridge cycle to include a myosin “off state” that acts as a source for myosin recruitment during activation of contraction and as a sink for taking myosin out of the cycling pool during relaxation (analogous to the super-relaxed [SRX] state of the thick filament; Linari et al., 2015; McNamara et al., 2015; Irving, 2017). Addition of this state to the cross-bridge model accelerated relaxation kinetics and reduced resting tension, producing simulated twitches that matched the experimental twitch data of Janssen and de Tombe, 1997; Caremani et al., 2016. Additional validation of the model was performed by simulations of a twitch for multiple datasets, including varying temperature, and the force–Ca2+ relationship. Thus, the model can predict both twitch transients and the Ca2+ sensitivity of force. Preliminary reports of this work have been published previously in the forms of abstracts and proceedings (Prodanovic et al., 2020; Mijailovich et al. 2018. Biophys. J. 114:Abstract 500A. https://doi.org/10.1016/j.bpj.2017.11.2737; Mijailovic et al. 2019. Biophys. J. 116:Abstract 116A. https://doi.org/10.1016/j.bpj.2018.11.654).
Materials and methods
Here we outline the essential definitions and relationships developed in previous studies, including (1) the multiscale structural organization of intact muscle (Mijailovich et al., 2016) and (2) Ca2+-dependent kinetics that regulate Tn–Tpm interaction with F-actin in cardiac muscle (Geeves et al., 2011; Mijailovich et al., 2012; Mijailovich et al., 2019; Prodanovic et al., 2020). We also describe new features implemented in MUSICO to model transient contractions in cardiac trabeculae, namely (3) an expanded cross-bridge cycle that contains five essential states and further expansion to six states, (4) intrinsic series compliance that permits SL changes during twitch in fixed-length trabeculae, and (5) and thick-filament activation.
Multiscale model of trabeculae
Intact ventricular trabeculae from the rat heart are composed of parallel cardiac muscle cells, or myocytes, embedded in an extracellular matrix that includes the collagen structure laterally connecting the muscle fibers. Myocytes occupy ∼70% of a trabecular volume, and the cardiac cells have a diameter ranging between 10 and 20 µm and a length between 80 and 100 µm. The myocyte contractile substructure consists of myofibrils aligned in parallel, where each myofibril is composed of 40–50 sarcomeres in a series. The sarcomeres are composed of interdigitated thick and thin filaments, where each half thick filament consists of ∼150 myosin molecules projecting on each side of the M-line and each thin filament contains from 360 to 400 actin monomers emerging from Z-discs on opposite sides of a sarcomere. The thick filaments are associated with the auxiliary protein titin, connecting it via the thick-filament backbone with the Z-disc and the M-line, and MyBP-C connecting thick and thin filaments. The thin filaments contain the regulatory proteins Tpm and Tn essential for Ca2+ regulation of contraction and other auxiliary proteins regulating thin-filament length and other functions.
Trabecular geometry and elasticity
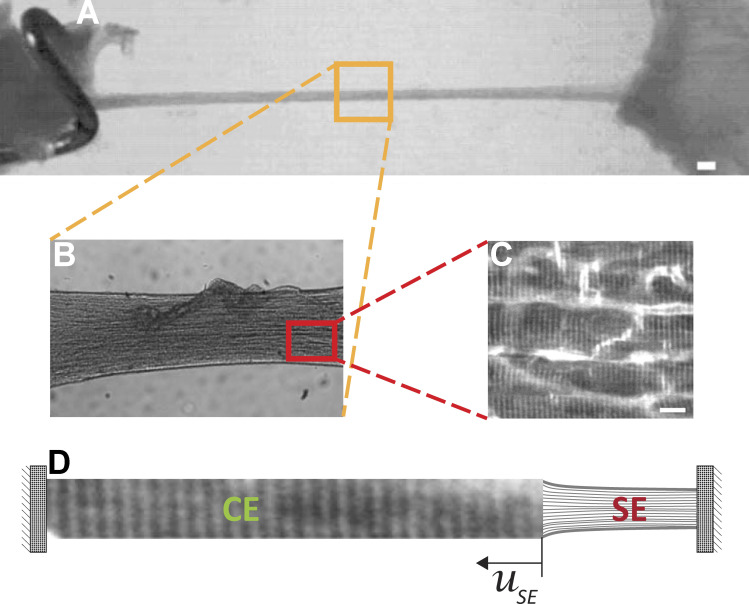
The contractile characteristics of cardiac muscles are typically derived from isometric and isotonic twitch contractions in ex vivo preparations. However, twitches of trabeculae that are isometric at the muscle level are not isometric at the level of the sarcomere (Janssen and de Tombe, 1997; Caremani et al., 2016). During twitches, when force rises, the sarcomeres shorten; during relaxation, they lengthen. The origin of the elasticity in trabeculae is complex and may include muscle cell alignment and connective tissue serial elasticity. The simplest method is to include a trabecula SE element in series with the contractile element (CE) consisting of multisarcomere muscle fibers (Fig. 1).
Figure 1.
Origin of trabecula series elasticity is complex and might include muscle fiber alignment and connective tissue serial elasticity. (A) A rat right ventricular trabecula mounted between a force transducer and a motor (scale bar, 50 µm). (B) The magnified region displays alignment of muscle fibers along trabeculae. (C) Higher magnification shows stratifications along muscle fibers as well as imperfect alignments showing gaps between and along muscle fibers (scale bar, 10 µm). (D) The simplest method is to include trabecula elasticity (SE) in series with the CE consisting of multiplesarcomere muscle fibers. The change of SE element length uSE is equal to change in multisarcomere fiber length.
Spatially explicit 3-D model of a sarcomere
In the 3-D sarcomere, an overlapping hexagonal lattice of thick and thin filaments has a well-defined interfilament spacing where the mean spacing is measured by x-ray diffraction (Higuchi et al., 1995; Millman, 1998). Explicit formulation of the sarcomere lattice is defined by the discrete position of two-headed myosin molecules and their binding sites on actin filaments. For simplicity, we consider that only one myosin head per myosin molecule is active at any one time and is denoted as a cross-bridge. Overall, the 3-D sarcomere structure is viewed as an array of thin and thick filaments connected by cross-bridges and other elastic elements (e.g., titin and MyBP-C) in a lattice network, and all of these elements can be represented as linear springs and elastic beams (Daniel et al., 1998; Mijailovich et al., 2016). The instantaneous equilibrium between actin and myosin filaments interconnected by cross-bridges is defined by a stiffness matrix, which includes the elasticity of thick and thin filaments, attached cross-bridges and titin, and load containing a vector of all external forces and internal forces generated by the action of cross-bridges. The loading conditions are defined at the boundaries of the muscle system, and they follow the experimental protocol of the relevant experiment. Typically, these include changes of length or imposed tension at the muscle end(s). The stiffness matrix is constantly changing as actomyosin bonds are created or disrupted, and active forces are also changing during conformational changes in attached myosins.
In this study, we used experimental conditions such as isometric (half) sarcomeres and fixed-length trabeculae. The latter case includes variable loading (tension) on multisarcomere (muscle fiber) structure due to serial elasticity in fixed-length trabeculae. Regarding the MUSICO simulations of trabeculae, it is possible to prescribe at the end of trabeculae arbitrary changes of length, such as in previous studies (Janssen and de Tombe, 1997; Caremani et al., 2016) where trabecular length was changed in order to keep SL constant or approximately constant or tension was applied on the trabecular ends. This kind of loading is shown in Fig. S3. The solutions of the equations defining the mechanical system of sarcomeres in series are obtained by standard finite element procedures for nonlinear systems using an iterative procedure (Bathe and Mijailovich, 1988; Mijailovich et al., 1993; Bathe, 1996).
Figure S3.
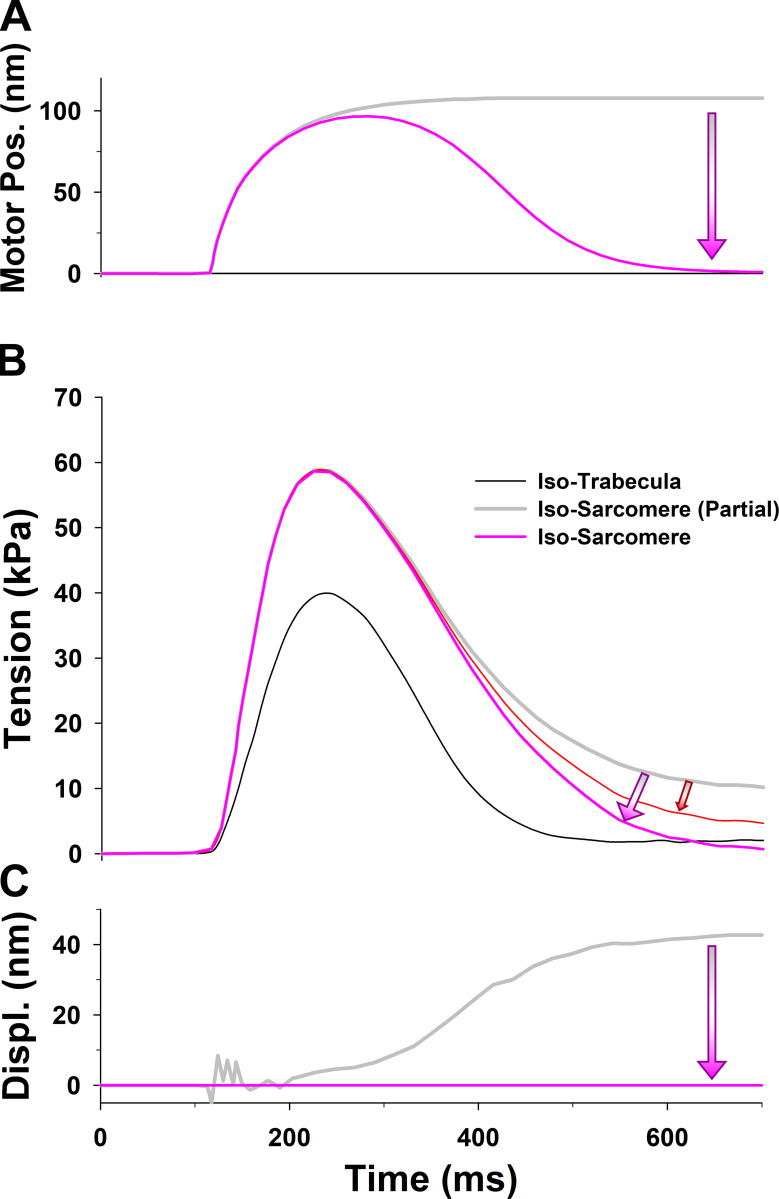
SL controlled isometric tension of a half-sarcomere. (A) Observed change in length of trabeculae per half-sarcomere (gray line) and corrected length of trabeculae to truly keep a half-sarcomere length isometric (pink line), which shows a decrease in trabecula length (i.e., motor position) toward the initial length of relaxed muscle. (B) Correction of the tension transient during the twitch due the change in SL (gray line in C). The observed tension (gray line) and the tension after correcting for the PE passive tension due to change of half-sarcomere length (red line) and also after additional correction for titin (passive) forces (pink line). (C) Change in half-sarcomere length (gray line) shows the effect of losing control of HS length that apparently should be constant (pink line). The tension of the trabecula length was fixed (black line in B) is shown for reference. The direction and color of the arrows signify changes in length and tension.
Strain-dependent kinetics of cross-bridge cycle in the 3-D sarcomere lattice
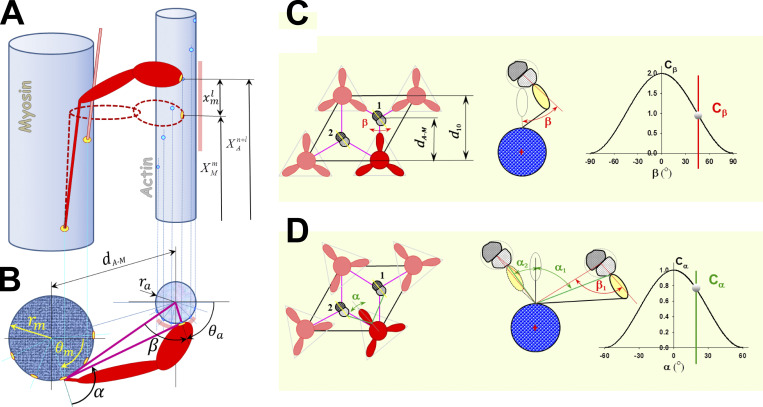
The discrete nature of the myosin-binding sites in two helically arranged strands in each actin filament and the regular arrangement of myosin crowns along the myosin filaments require that myosin heads in a 3-D sarcomere lattice move not only axially but also radially and azimuthally to reach binding sites on actin monomers with the correct orientation (Squire, 1992). The relative spatial positions between myosin heads and binding sites on the thin filament are obtained from the current spatial positions of the sites on deformed thin and thick filaments (Mijailovich et al., 2016; Mijailovich et al., 2019), as shown in Fig. S1. The cause of deformation in the elastic filaments originates from local forces imposed by bound cross-bridges and other elastic elements (e.g., titin), but, in turn, the forces in cross-bridges depend on state and the relative positions between actin and myosin sites. The strain-dependent rate of myosin binding to actin in the 3-D sarcomere lattice is modulated by the axial strain component, as used in all cross-bridge kinetic models, and by radial and azimuthal spatial arrangement relative to binding sites on the actin filaments (Fig. S1), displayed by interfilament spacings, and azimuthal angles α and β (Mijailovich et al., 2016, 2019).
Figure S1.
Interaction between myosin heads and actin filaments in 3-D is defined by the triple-helical arrangement of myosin molecules along the myosin filament and the double-helical arrangement of monomers (myosin-binding sites) along the actin filaments. The 3-D geometry of myosin head binding domains and binding sites on actin in a sarcomere requires both longitudinal position matching and angular matching in the azimuthal plane. (A) Each myosin head m can move from its undeformed position along actin filament due to thermal agitation and can reach a few neighboring binding sites on actin. The myosin-binding domain is shown as a yellow oval at the tip of the myosin head, and binding sites on actin are shown as bright blue circles. The range of axial movement is shown as a pale red bar. The relative axial position of a myosin head (cross-bridge) and adjacent actin sites where superscripts and denote the index of an adjacent site on actin, and is the index of accessible sites on actin in neighborhood of m, respectively. The maximum number of adjacent sites on actin reachable by a myosin head m is denoted as La. To bind the site +l, the cross-bridge, including S2 and a myosin head, needs to stretch or compress axially for displacement (B) In the 3-D sarcomere lattice, the actin and myosin filaments are separated by spacing and sites on the actin filament (strand) are at an azimuthal angle β. In addition, a cross-bridge needs to turn from its equilibrium position by an angle α to reach an actin filament that is not aligned with its equilibrium angular position. For precise calculations of the angles, it is necessary to know the myosin equilibrium angular positions angular position of site on actin filament and diameters of myosin and actin filaments and respectively. The angular range of movement is denoted as a pale red arc around the actin filament. The azimuthal weight factors Cβ and Cα of myosin binding in 3-D sarcomere lattice are defined as in C and D. (C) When myosin heads in crown 1 are directly aligned with three actin filaments, then Cα = 1 and Cβ weights the azimuthal departure of a myosin-binding site on the actin filament from the plane passing through myosin and actin longitudinal axes, where the angle β is a function of the axial departure from perfect matching, ξ, which resembles the preference for myosin heads to bind to favorably oriented sites on the actin filament. (D) When myosin heads are not directly aligned with the surrounding actin filaments, such as with crowns 2 and 3, the weight factor Cα takes into account the departure by the angle α from perfect alignment between the heads on the crown and the reachable actin filaments. Figure S1 is adapted from Mijailovich et al. (2016).
Minimal cross-bridge cycle including five essential states
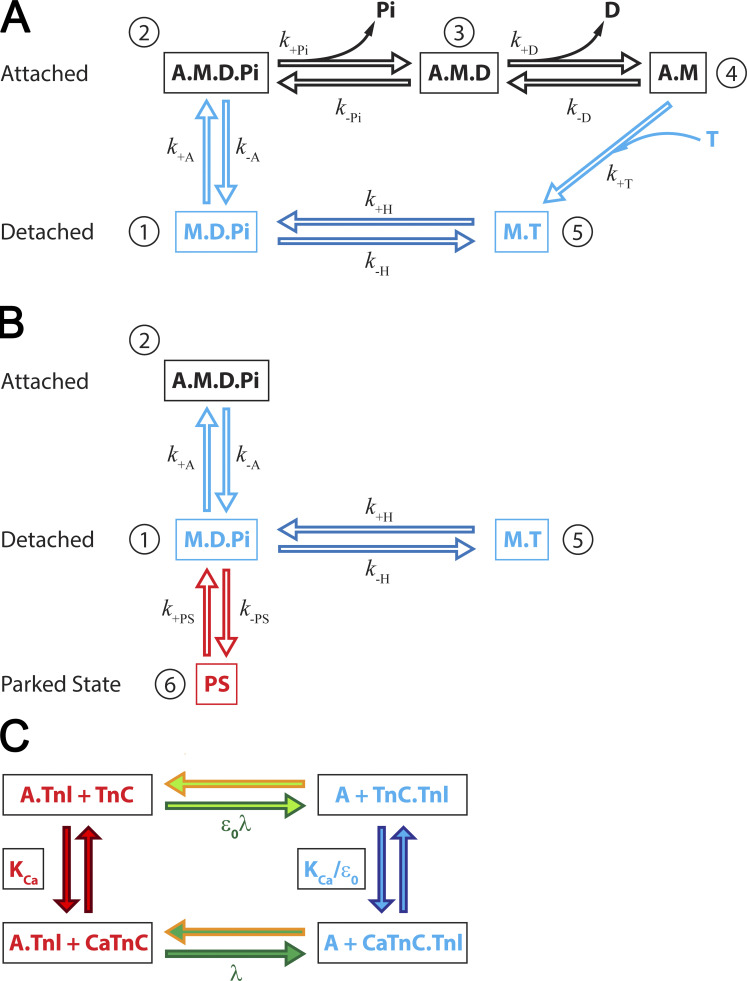
Simple kinetic models include only three states (e.g., Daniel et al., 1998; Duke, 1999; Mijailovich et al., 2016; Mijailovich et al., 2019), where multiple states are lumped into a single state. A cross-bridge model with additional states is desirable to relate the underlying well-defined molecular kinetics to the simulations of, for example, twitches in cardiac trabecula and allow simulation of tension levels in units of the observations. The additional states provide closer proximity to measurements of state transition rates from assays in solution and motility assays and thus provide experimentally measured model parameters at the molecular scale rather than parameters estimated from fits of data from higher length scale experiments. Hence, we expanded the above models into a five-state cross-bridge model that introduces a separate strain-dependent ADP release to distinguish it from ATP binding associated with cross-bridge detachment and the hydrolysis step that separates M.T (myosin head with ATP) and M.D.Pi states (Fig. 2 A). The former defines the maximum cycling rate of the cross-bridge cycle as a function of load. The hydrolysis step defines the minimum lifetime of the detached cross-bridge. Separation of M.T and M.D.Pi is convenient for introduction of the concepts associated with thick-filament regulation defined as interaction of the detached M.D.Pi state and the PS (Fig. 2 B).
Figure 2.
Model of the cross-bridge cycle. (A) Five-state model of the actomyosin cycle includes biochemical states consistent with observed structural states: a detached state 1, M.D.Pi; weakly bound state 2, A.M.D.Pi; strongly bound post–power stroke state 3, A.M.D; rigor-like state 4, A.M; and detached state 5, M.T. The strain-dependent state transition rates are also associated with conformational changes defining the structural conformations of myosin in each state (i.e., power stroke, associated with Pi release, and stroke, δ, associated with the ADP release, ATP binding and cross-bridge detachment, and hydrolysis and reverse stroke). (B) Addition of a state representing interaction of myosin heads with the thick filament backbone, the so-called “parked state”, PS, denoted as state 6, into a five-state model from A. The PS is a partial M.D.Pi state with structural conformation associated with thick-filament backbone, reducing the population of the M.D.Pi state capable of binding to actin and therefore fluxes from M.D.Pi state to A.M.D.Pi state (myosin binding to actin) or the reverse hydrolysis to M.T state. The transition rate from PS to M.D.Pi, is assumed to be strongly dependent on [Ca2+], and the transition rate from M.D.Pi state to PS, is independent on [Ca2+]. (C) Kinetic scheme of calcium binding to TnC and interaction of TnI with actin in cardiac muscle. Calcium binding to TnC, with the equilibrium rate forms a Ca2+.TnC complex and reduces affinity of TnI to actin. The detachment rate of TnI from actin is defined by the equilibrium rate λ forming the CaTnC.TnI state. In CaTnC state, Tpm is free to move, mostly azimuthally, permitting myosin binding and force generation. The dissociation from A.TnI to TnC.TnI state without bound Ca2+ is slow, attenuated by and the calcium binding to TnC.TnI into the CaTnC.TnI complex is accelerated by a factor
Strain-dependent, thermally activated chemical reaction rates are obtained from transition state theory (Eyring, 1935; Glasstone et al., 1941) as updated by Kramers (1940), assuming that the rate of a reaction is limited by the energy barrier presented by the point of highest Gibbs energy on the reaction path. The general form of the state transition rates in models with a power stroke is formulated by Hill (1974) as the ratio of forward to backward rates that must satisfy Gibbs’s thermodynamic identity. The rates are defined in terms of the Gibbs energies of the initial and final states, including the elastic strain energy derived from the cross-bridge tension (Hill, 1974; Wood and Mann, 1981).
The state transition rates between states in the cross-bridge cycle are derived from the free energy of the cross-bridge states in terms of the axial strain component The complete set of the state transition rate constants is described in Appendix A. Moreover, in the 3-D sarcomere lattice, the strain-dependent rate of myosin binding to actin is modulated, in addition to the axial strain component by the spatial position of the actin filaments and the azimuthal departure of a myosin-binding site on an actin filament from the plane passing through actin longitudinal axes (Fig. S1). This effect is implemented in MUSICO via weight factors and for the azimuthal departures and, in addition, includes the normalization factor, that takes into account the number of actin sites that a cross-bridge can reach and bind (for further details, see Mijailovich et al., 2016; Mijailovich et al., 2019).
Thin-filament regulation by calcium
Muscle contraction and relaxation are regulated by the Ca2+-dependent azimuthal movements of Tpm–Tn complexes over the surface of the actin filament. Structurally, Tpm covers seven monomers on one strand of the actin double helix and is associated with one Tn molecular complex. The Tn complex consists of troponin T, troponin C, and troponin I, denoted as TnT, TnC, and TnI, respectively. The affinity of myosin for the actin filament is controlled by the azimuthal position of Tpm, where Tpm molecules are aligned along each strand of the actin double-stranded helix. Most regulatory models assume that each Tpm molecule moves between three discrete orientations: blocked, closed, and myosin induced, originally called the “open state” (McKillop and Geeves, 1993; Lehman et al., 2000; Pirani et al., 2005; Poole et al., 2006). These Tpm positions are defined by TnI bound to actin, a free chain interacting with actin, and a chain displaced by strongly bound myosin heads, respectively. Calcium regulation of these processes is defined by calcium binding or dissociation from cardiac TnC and change in the affinity of TnI to actin surface induced by a conformational change in the Tn molecule.
Calcium-dependent kinetics of Tpm–Tn complex with actin in cardiac muscle
Ca2+ regulation of the interaction of the Tpm–Tn complex with actin is defined by open and closed allosteric states of TnC with one Ca2+ ion bound in cardiac muscle or with two Ca2+ ions in skeletal muscle (McKay et al., 2000). Ca2+ binding to TnC exposes a hydrophobic region in the N-domain of TnC, providing a binding site for the segment of TnI, strengthening the interaction of TnC with TnI, and weakening the affinity of TnI to actin. A minimal description of the allosteric mechanism in cardiac muscle includes four states (Fig. 2 C), comprising two TnC closed states, where TnC has no or one bound Ca2+ to N-terminal site II, denoted as TnC and CaTnC, and similarly two TnC open states. In the presence of Ca2+, the open state is favored over the closed state, and TnI binds preferentially to the open TnC, forming CaTnC.TnI state. In the absence of Ca2+, the closed form of TnC is favored, and TnI binds preferentially to actin, forming A.TnI state. The equilibrium rate constant of Ca2+ binding to TnC closed states, is effectively defined via the forward constant, where linearly depends on and the Ca2+-independent dissociation constant, The dissociation constant of TnI from closed A.TnI to CaTnC.TnI is defined by a first-order affinity λ when one Ca2+ is bound. With no bound Ca2+, the transition from A.TnI to TnC.TnI shows slow dissociation of TnI from actin with an attenuated rate, where allosteric fraction is On the other hand, Ca2+ binding to TnC in a TnC.TnI complex is accelerated to keeping the population of the A+TnC.TnI state low.
Thin-filament regulation of myosin interactions with actin
The kinetics of interactions between the Tpm–Tn complexes with an actin filament are, at present, best described by the long-range cooperative continuous flexible chain (CFC) model (Geeves et al., 2011; Mijailovich et al., 2012) that includes structural constraints between Tpm–Tn regulatory units. The model is built on structural evidence that neighboring Tpms overlap and that one end of TnT is bound to a specific site on Tpm, whereas its N terminus overlaps with the adjacent Tpm, forming linked Tpm–Tpm regions. The interconnected neighboring Tpm–Tn units form the appearance of a CFC on each strand of an actin (Lorenz et al., 1993; Vibert et al., 1997) rather than a set of the independent Tpm–Tn units.
For modeling thin-filament regulation as a CFC, we follow a Monte Carlo approach with spatially explicit myosin binding to regulated actin filaments in solution (Geeves et al., 2011; Mijailovich et al., 2012) that we later expanded to the model of thin filaments in a 3-D sarcomere lattice (Mijailovich et al., 2019). The coupled algorithm for thin-filament regulation and the actomyosin cycle consists of three main steps: (1) calculation of the state transitions between actin–Tpm–Tn states as a function of [Ca2+], (2) calculation of mean CFC angular positions and their azimuthal angular fluctuations along the actin filament, and (3) calculation of state transitions between actin–myosin states. These processes are interrelated and regulated by the [Ca2+] where CFC angular position is modulated by either TnI bound to actin or dissociated from actin after calcium binding to TnC. The release of TnI from the actin surface allows Tpm angular movement, exposing myosin-binding sites on actin and thus permitting myosin binding and force generation by cross-bridges. The CFC moves azimuthally at a high frequency, and the mean CFC angular position and the thermally induced azimuthal fluctuations are defined by the instantaneous spatial positions of the pinning sites, at which the TnI and myosin are bound to actin (Geeves et al., 2011; Mijailovich et al., 2012; Mijailovich et al., 2019). General definitions, calculations of CFC angular position and its variance, and the coupling between the calcium-regulated position of the CFC and myosin cycle states are described in Appendix B.
Thick-filament regulation by calcium
There is now substantial evidence for a myosin off state in the relaxed structure of the thick filament in which the two myosin heads self-associate and pack down onto the thick filament to form what is referred to here as the “PS.” This state is denoted as a disordered relaxed state (DRX) associated with the thick-filament backbone (Anderson et al., 2018; Brunello et al., 2020) or an ordered SRX state (McNamara et al., 2016). The kinetics of the equilibrium between the PS and the on state of myosin on the thick filament is necessary to define how the filament is activated and relaxed and how the transition between these thick filament states is modified by mechanosensing in thick filaments (Linari et al., 2015; Irving, 2017), interfilament mechanical signaling by cardiac MyBP-C (McNamara et al., 2016; Brunello et al., 2020), and phosphorylation of the regulatory light chain (RLC) and cardiac MyBP-C (Kampourakis et al., 2016) and, perhaps, titin.
In the absence of precise information concerning the molecular details of each of these prospective mechanisms, we began by implementing a minimal version of the PS. We treated each myosin head as an independent force generator that can isomerize from the M.D.Pi state to the PS. For reducing high levels of tension at low [Ca2+] (Prodanovic et al., 2020), we modeled the PS to be activated by Ca2+ association with a component of the thick filament so that the activation follows the Ca2+ transient. This idea is supported by the observation of Huxley et al. (1994) that, during fast Ca2+ activation, myosin heads move radially away from the thick-filament backbone much faster than they attach to the thin filament. Thus, this process could be attributed to a [Ca2+]-dependent transition from the PS to M.D.Pi state that can reduce resting tension at low levels of Ca2+ and accelerate tension relaxation when [Ca2+] falls. Alternative hypotheses are considered in the Discussion section.
The full implementation of a cross-bridge model including a PS in the MUSICO platform requires knowledge of the equilibrium between the PS and the myosin on state on the thick filament (Fig. 2 B). In the absence of strong experimental evidence regarding the mechanism defining the transition from or into the PS, for simplicity, we consider the rate constant that could potentially depend on [Ca2+]. We define the rate in the form of a Hill curve:
| (1) |
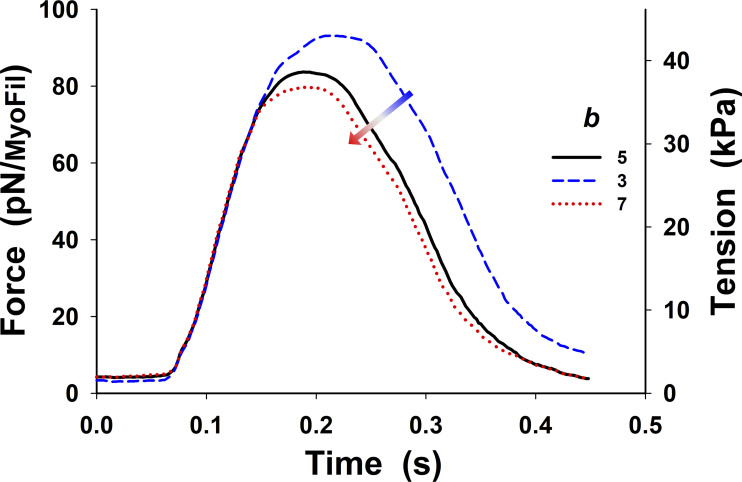
where is the baseline rate, is the rate at high calcium (e.g., at pCa = 4.6), b is the Hill coefficient of the rate sigmoidal rise, and is [Ca2+] when is equal to The reverse rate, is assumed to be constant.
Monte Carlo simulations of rate-dependent stochastic processes
In Monte Carlo simulations, we used the standard Metropolis algorithm, where a kinetic transition in a time step occurs when a random number in (0, 1) lies in the range (0, where k is state transition rate constant. must be much smaller than the inverse of the fastest rate constant of the system, and, in practice, was sufficient to achieve satisfactory statistics and avoid interference between multiple transitions within a single subsystem and the negligibly small interference between the subsystems.
The coupling between thin-filament regulatory processes and the actomyosin cycle requires two sets of Monte Carlo random number drawings within each time step. The first set of random number drawings defines transitions of TnI–actin states from the calcium kinetics scheme in Fig. 2 C, depending on [Ca2+]. The position of bound TnI to actin after updating and bound myosins from the previous time step set the chain configuration for obtaining the mean CFC angular position along the actin filament strand and its azimuthal variation. The second set of random number drawings defines the changes in actomyosin states regulated by the CFC, setting the configuration for the calculation of the mechanical equilibrium with external forces and constraints.
For each TnI or cross-bridge, we use one Monte Carlo random number drawing to define whether the TnI or cross-bridge remains in its current state or will change its state into one of the other possible states within the current time step The change of state is defined by the probability, in the range from 0 to 1, that is divided into probability bins, in a specified order, including the set of probability bins associated with a TnI or cross-bridge changing state and a bin associated with the probability of remaining in the current state. Depending which bin the drawn random number falls into, the fate of a particular TnI or cross-bridge is defined and set for the following time step. The calculations of the transition probabilities from the transition rates between TnI–actin states and between actomyosin states in the 3-D sarcomere lattice are as described previously (Mijailovich et al., 2012; Mijailovich et al., 2016; Mijailovich et al., 2019). The coupling between cross-bridge cycling and calcium regulation of the thin filament is described in Appendix C.
Stochastic process, model size, and myofibril edge effects
Due to stochastic transitions in the cross-bridge cycle, the force per myosin filament can vary between the filaments by ±15% at any instant of time and also by about the same amount in the same filament over time. In contrast, the variation in average force per myosin filament is small; for example, if the number of myosin filaments matches the number of filaments in an average myofibril, the fluctuations in isometric force are minimal (<0.1%) and reflect observed tension variations.
In the parameter exploration phase, we limited the stochastic simulations to a half-sarcomere with 200 myosin and 400 actin filaments that is approximately one-third of the number of filaments in a cross-section of a typical myofibril. This number of filaments is sufficient for stable simulations and statistical averaging without requiring running the simulation multiple times. In the final simulations, we increased the number of myosin filaments per half-sarcomere to 500 in order to get realistically smooth tension responses.
Procedure for estimation of model parameters
The MUSICO platform is formulated on three principal pillars: the 3-D explicit (multi)sarcomere geometry, a strain-dependent cross-bridge cycle, and calcium-dependent thin- and thick-filament regulation. This model provides the precision necessary to quantify the effects of kinetics and the structural changes, associated with mutations in contractile and regulatory proteins, on muscle function, but it requires a large number of model parameters to properly define muscle fiber structure, cross-bridge kinetics, and thin-filament regulation by Ca2+. We contend that conventional fitting of the data is not ideal, because the published experimental data show that large variations and fitting many free parameters can result in unreasonable estimates. Thus, we used established structural data and best estimates deduced from experimentally established kinetic data to define as many parameters as possible (Table 1). In this study, we then varied only a few parameters depending on the particular sets of data that model prediction had to match. In most of the cases, we adjusted (1) the myosin–actin binding rate, to account for changes of interfilament spacing, high speed of sarcomere shortening, and possible myosin activation by stretching thick filaments via titin at longer SLs; (2) the power stroke Gibbs free energy change, and the ADP release rate, because these parameters are load dependent and the degree of shortening and or sarcomere disorder is difficult to define, particularly during relaxation; (3) the kinetics of Ca2+ binding, and dissociation, from TnC that reciprocally defines interaction of TnI with actin; and (4) the [Ca2+] for the half-maximal rate from PS, [Ca2+]50, a key parameter defining the state transition rate from PS, due to large changes in the cytosol from intact cells to the bathing solution in demembranated muscles. The parameters used in simulations are described in detail in Appendix D, and the complete set of parameters used in simulations of trabecular twitch responses to calcium transients is shown in Table 1. In a few simulations, different parameters were used to accommodate large differences in experimental conditions, such as a large change in interfilament spacing, due to demembranation of trabeculae, or to achieve good fits of the relaxation phase of the twitch contractions that must account for inhomogeneous lengthening between sarcomeres.
Table 1. MUSICO parameters for the simulations of twitch contractions in intact rat trabeculae at fixed length and at temperature 27.2°C in Fig. 5 (Caremani et al., 2016) and at 27.5°C in Fig. 6 (Janssen et al., 2002).
| Description | Parameter | Isometric trabeculae | Notes |
|---|---|---|---|
| Cross-bridge cycle | |||
| Myosin–actin binding rate | 226 s−1 | ||
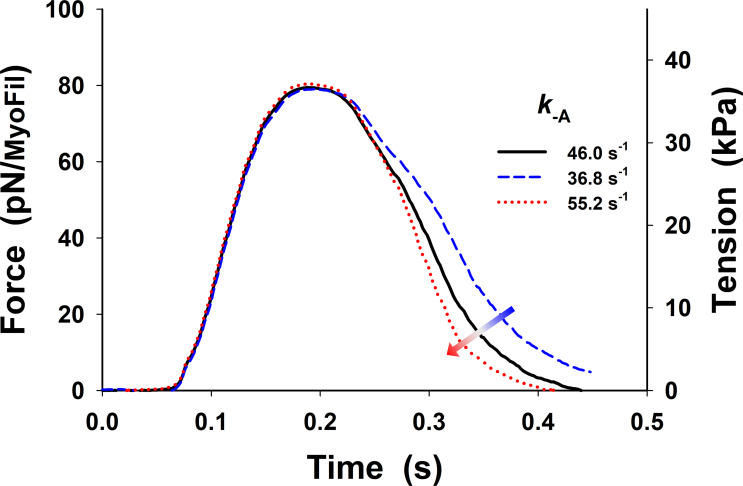
| Myosin–actin detachment ratea | 46 s−1 | ||
| Myosin stroke cap rate | 1,000 s−1 | Mijailovich et al., 2016, 2019 | |
| Myosin reverse stroke cap rate | 100 s−1 | Mijailovich et al., 2016, 2019 | |
| Power stroke Gibbs energy change | −13 | Mijailovich et al., 2016, 2019 | |
| Working stroke | 10.5 nm | Duke, 1999; Mijailovich et al., 2016, 2019 | |
| Second working stroke | 1 nm | Mijailovich et al., 2016, 2019 | |
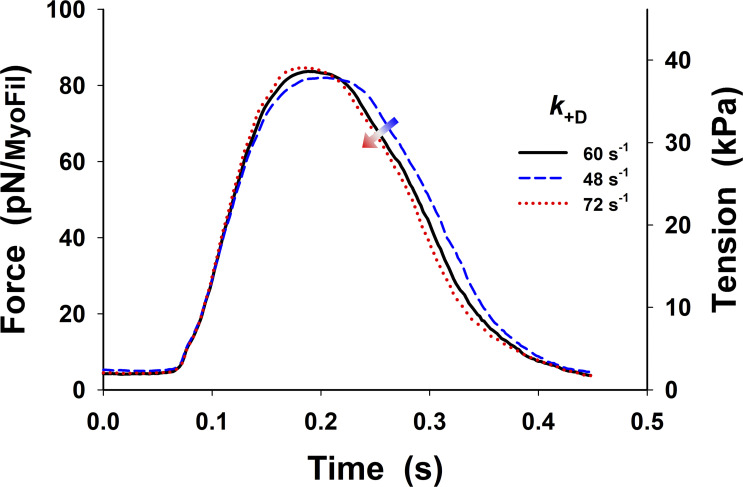
| ADP release ratea | 60 s−1 | ||
| ATP binding and myosin detachmenta | 106 s−1 | ||
| Hydrolysis forward ratea | 100 s−1 | ||
| Hydrolysis backward ratea | 10 s−1 | ||
| Cross-bridge stiffness | 1.3 pN/nm | Duke, 1999; Mijailovich et al., 2016, 2019 | |
| at 27.5°C | 4.147 pN·nm | ||
| Calcium kinetics | |||
| Calcium binding to TnC equilibrium rate | 1 µM−1 | Smith and Geeves, 2003; Geeves et al., 2011 | |
| Calcium binding rate to TnC | 75.4 µM−1·s−1 | Smith and Geeves, 2003; Geeves et al., 2011 | |
| Calcium dissociation rate from TnC | 75.4 s−1 | Kreutziger et al., 2011; Wang et al., 2012, 2013 | |
| TnI–actin equilibrium rate constant At high Ca2+ | 10 | ||
| TnI–actin backward rate constant | 375 s−1 | ||
| Allosteric TnC–TnI–actin–Ca2+ parameter | 0.01 | Smith and Geeves, 2003; Geeves et al., 2011 | |
| CFC | |||
| Tpm pinning angle | −25° | Poole et al., 2006 | |
| Myosin Tm angular displacements | 10° | Poole et al., 2006 | |
| Angular SD of free CFC | 29.7° | Pirani et al., 2005; Mijailovich et al., 2012 | |
| Persistence length of Tm–Tn confined chain | 50 nm | Mijailovich et al., 2012 | |
| PS | |||
| Transition rate to PS | 200 s−1 | Assumed | |
| Baseline rate | 5 s−1 | Assumed | |
| Amplitude | 400 s−1 | Assumed | |
| Calcium Hill function slope | 5 | Assumed | |
| Half-activation point of the Hill function | 1 µM | Assumed | |
| Sarcomere | |||
| Length of sarcomere | 2.2 µm | ||
| Length of actin filament | 1.1 µm | Robinson and Winegrad, 1977, 1979 | |
| Interfilament spacing | 33.83 nm | Irving and Maughan, 2000 | |
| Thin-filament elastic modulus | 65 nN | Huxley et al., 1994; Kojima et al., 1994 | |
| Thick-filament elastic modulus | 132 nN | Huxley et al. 1994 |
Based on mouse and human α myosin values in (Deacon et al., 2012a, 2012b) with corrections for temperature; ionic strength is as documented in (Mijailovich et al., 2017).
A sensitivity analysis is typically needed when fitted parameters have a large range of possible values (Mijailovich et al., 2010; Mijailovich et al., 2012; Ujfalusi et al., 2018). In this study, we also performed a sensitivity analysis of the parameters and and b in which were necessary to be estimated (usually no more than three, depending on specific case) to match all experimental data. The sensitivity analysis of these and other important parameters is shown in the supplemental text (see bottom of the PDF and Figs. S8–S13 and S16–S23). We used the sensitivity analysis of a set of free parameters to estimate parameters for the next simulation by methodology described by Mijailovich et al. (2010). From those estimates, the changes in parameters were filtered, using our experience, in order to avoid imposing changes in parameters that marginally affect the predicted response and therefore move the next model prediction more quickly toward the observation. Using this approach, we achieved good fits with a minimal number of long simulation runs.
Figure S8.
Changes in twitch tension from Fig. 5 B (black line) by ±20% variation in binding rate, Increase in increases the peak of the twitch tension and shows delay in relaxation. The superscript o is omitted from the figure display for clarity.
Figure S13.
Changes in twitch tension from Fig. 5 B in the main text (black line) by ±40% variation in baseline rate from the PS, Increases in increase the resting muscle tone and the peak of the twitch tension, and the relaxation is slower and slightly delayed.
Figure S16.
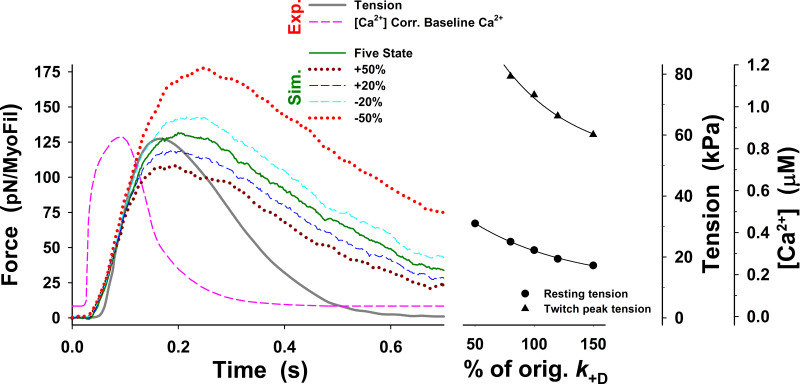
Changes in twitch tension predicted by the five-state model for change in up to ±50% from those used for Fig. 3 (dark green line), denoted as orig. The main effects of changes in on the tension responses are displayed in changes in the peak tension, resting tension, and the rate of tension rise, but the rate of relaxation only marginally changes in all cases and is much slower than the observed. The superscript o is omitted from the figure axis label for clarity.
Figure S23.
Effect of changes in baseline calcium level on resting and twitch tension. In all simulations with cross-bridge cycle without PS (i.e., five-state model), the calcium transient (dashed pink line) with baseline [Ca2+] levels was reduced from observed values of 0.143 µM to 0.05 µM. MUSICO simulations with the observed [Ca2+] transient (dark pink line) with the same model parameters as shown in Fig. S22 predicted significantly elevated resting tension, slightly higher peak tension, and slower tension relaxation rate (dark green line). After returning to low [Ca2+] levels (i.e., at time >0.4 s), tension remains about the same as the resting tension. For reference, the twitch tension response to [Ca2+] transients with reduced baseline [Ca2+] level is shown as a green line.
The adjusted parameters that differ from data in Table 1 are shown in comparative tables and in the figure legends associated with the specific simulations where the adjustments were necessary.
The MUSICO software environment and simulation details
The MUSICO software was developed as a C++ object-oriented application that includes the LAPACK linear algebra package and the deal.II finite element library. In parts of MUSICO, where parallelization provides a significant reduction in computational time, OpenML is implemented. Typical run times for these simulations depend on the number of actin and myosin filaments. The simulation of 200 myosin filaments over 1 s with a time step of 1 µs requires ∼10 h on the AEG IS04-KG grid site, consisting of six nodes, each equipped with two AMD Opteron 6276 16-core processors and 96 GB RAM, totaling 192 processors.
Online supplemental material
The supplemental text includes (1) the spatial positions between myosin heads and binding sites on the thin filament in 3-D sarcomere lattice; (2) the correction of Caremani et al. (2016) observed tension under isometric half-sarcomere length due to the loss of trabecular length control during the sarcomere-lengthening phase of a twitch; (3) how the accelerated relaxation can be achieved by variation of parameters in the five-state model; (4) measurements of passive SE compliance during twitch in isometric trabeculae; (5) ATPase consumption during twitch contractions in fixed-length trabeculae; (6) sensitivity analysis of twitch tension to model parameters in fixed-length trabeculae; (7) estimation of the active tension increase due to decrease of titin passive tension during twitch contractions in fixed-length trabeculae where large changes in SL are observed (Caremani et al., 2016); and (8) sensitivity analysis of twitch tension transients to model parameters in the absence of a PS in isometric half-sarcomere. The following supplemental figures are available online in a ZIP package. Fig. S1 shows the interaction between myosin heads and actin filaments in three dimensions defined by the triple-helical arrangement of myosin molecules along the myosin filament and the double-helical arrangement of monomers (myosin-binding sites) along the actin filaments. Fig. S2 shows the effect of the five-state cross-bridge model rate on relaxation of twitch tension in isometric half-sarcomeres (IoSarc.). Fig. S3 shows the SL controlled isometric tension of a half-sarcomere. Fig. S4 shows the significance of the PS in twitch relaxation phase. Fig. S5 shows the comparative tension–displacement loops obtained from Janssen and de Tombe, 1997; Caremani et al., 2016. Fig. S6 shows a comparison of ATP consumption rate and ATPase during twitch contractions of isometric half-sarcomere and fixed-length trabeculae. Fig. S7 shows that ATPase is strongly correlated to sarcomere-shortening velocities in fixed-length trabeculae during force development (in SL per second). Fig. S8 shows the changes in twitch tension from Fig. 5 B by ±20% variation in binding rate. Fig. S9 shows the changes in twitch tension from Fig. 5 B by ±20% variation in detachment rate. Fig. S10 shows the changes in twitch tension from Fig. 5 B by ±20% variation in ADP release rate. Fig. S11 shows the changes in twitch tension from Fig. 5 B by ±40% variation in Hill coefficient of the rate of sigmoidal rise. Fig. S12 shows the changes in twitch tension from Fig. 5 B by ±20% variation in [Ca2+] at [Ca2+]50. Fig. S13 shows the changes in twitch tension from Fig. 5 B by ±40% variation in baseline rate from the PS. Fig. S14 shows active tension corrected for the decrease in titin force due to shortening of a half-sarcomere. Fig. S15 shows the effect of allosteric TnC–TnI–actin–Ca2+ interaction parameter, on resting tension at observed baseline calcium level and when [Ca2+] was reduced to 0.05 µM. Fig. S16 shows changes in twitch tension predicted by the five-state model for change in for up to ±50% from those used for Fig. 3, denoted as original Fig. S17 shows changes in twitch tension predicted by the five-state model for change in or up to ±50% from those used in Fig. 3, denoted as original Fig. S18 shows changes in twitch tension predicted by the five-state model for change in for up to ±50% from those used in Fig. 3. Fig. S19 shows changes in twitch tension predicted by the five-state model for change in for up to 24-fold from those used in Fig. 3. Fig. S20 shows changes in twitch tension at isometric half-sarcomere obtained from simulations by the five-state model. Fig. S21 shows changes in twitch tension relaxation rates with increase of predicted by the five-state model. Fig. S22 shows the best fit to the observations with the five-state model requiring the change in power stroke rate Fig. S23 shows the effect of changes in baseline calcium level on resting and twitch tension. Fig. S24 shows a comparison of tension–pCa relationships between the cross-bridge cycle models with or without PS (i.e., the six-state and five-state models).
Figure S2.
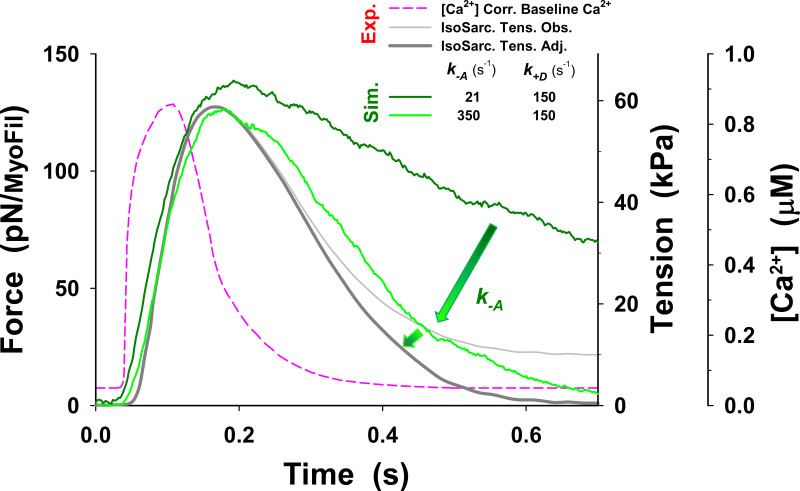
Effect of the five-state cross-bridge model rate on relaxation of twitch tension in isometric half-sarcomeres (IoSarc.). The simulation, with parameters obtained from fits of isometric half-sarcomere tension at 27.2°C (Fig. 3), shows slow relaxation (dark green line). An additional increase of by ∼17-fold significantly increases the rate of relaxation (green line and arrows), but it is still insufficient to reach the observation (dark gray line). The superscript o is omitted from the figure display for clarity.
Figure S4.
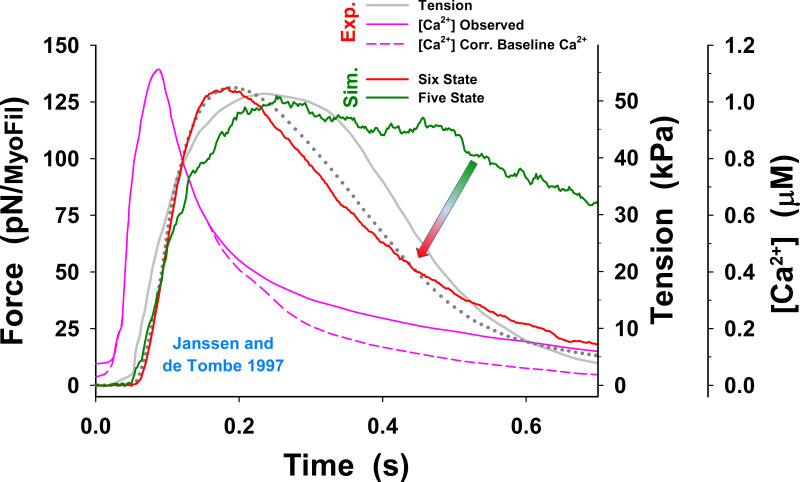
Significance of the PS in twitch relaxation phase. The simulations of a half-sarcomere isometric twitch with the five-state model showed slow relaxation (dark green line) compared with adjusted observations of Janssen and de Tombe, 1997 (gray line), even when the baseline [Ca2+] was reduced (pink dashed line). The simulations also showed high muscle resting tension at observed baseline [Ca2+] (not shown), similar to that shown by Prodanovic et al. (2020) at comparable low [Ca2+]. In contrast, the simulations with the six-state model, which includes the PS, significantly increased the speed of relaxation (indicated by arrow), but the model predictions state (red line) followed the poorly observed unusual flat top to the tension transient reported by Janssen and de Tombe, 1997. However, the model predictions approximately matched the simulation of tension reported by Niederer et al. (2006) (dark gray dotted line), suggesting possible inconsistency of the observation with other similar data. In the simulations, we used the same model parameters as shown in Table 1, except and which are presented in the text here for the five-state model and in Table 2 for the six-state cross-bridge cycle. For comparison, mean force per myosin filament and corresponding (observed) muscle tension are shown on the vertical axes. For consistency, resting tension is subtracted in all plots; thus, the responses to calcium transient display net change in active tension.
Figure S5.
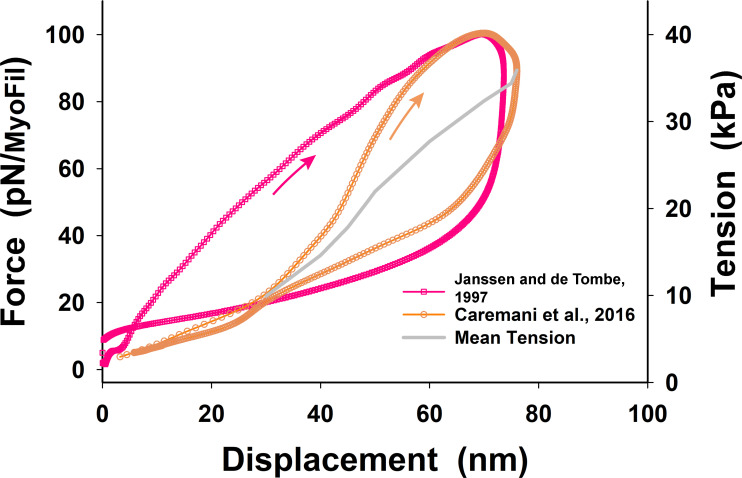
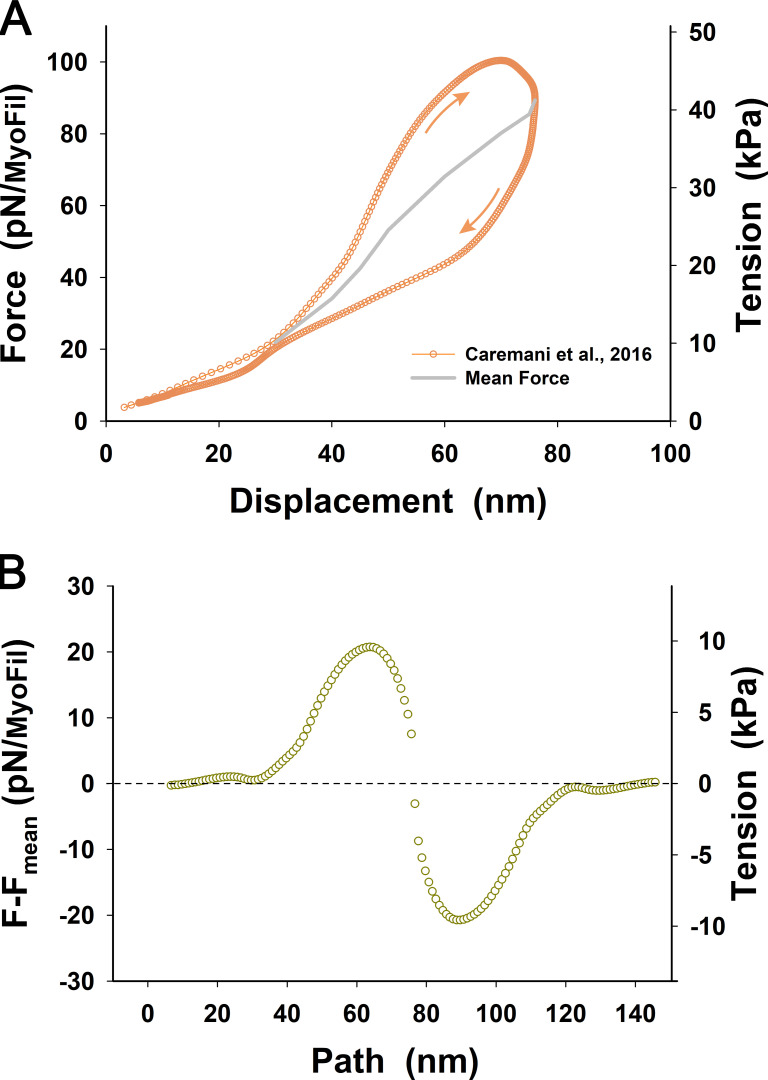
Comparative tension–displacement loops obtained from Janssen and de Tombe and Caremani et al. (red and orange symbols and lines, respectively). Related to Janssen and de Tombe, 1997; Caremani et al., 2016. Both loops indicated viscoelastic behavior showing higher tension during shortening and lower tension during relaxation accompanied with lengthening. In both cases, the peak force per myofilament and maximum shortening were about the same, but Janssen and de Tombe’s loop is much wider and more asymmetric about the mean value than that of Caremani et al. (see also Fig. 4 B). The Janssen and de Tombe loop (red line) also shows a large drop in tension after reaching maximum shortening and, after the drop in tension, relaxes slowly during lengthening, having a higher value of tension than the initial value at displacement <4 nm. This deviation of the descending part of the loop shows some uncertainty in the measurements compared with that of Caremani et al. Thus, for simplicity, we derived a nonlinear serial springlike elasticity from Caremani et al.’s average tension–displacement relationship (thick gray line) that shows more consistent behavior at displacement <40 nm and a nicely rounded loop at the tip of shortening. Because the conversion factor between force per myofilament and tension depends on the length at which the trabecula cross-section was measured, the corresponding tensions are shown in red letters for Janssen and de Tombe’s loop and in orange letters for Caremani et al.’s loop.
Figure S6.
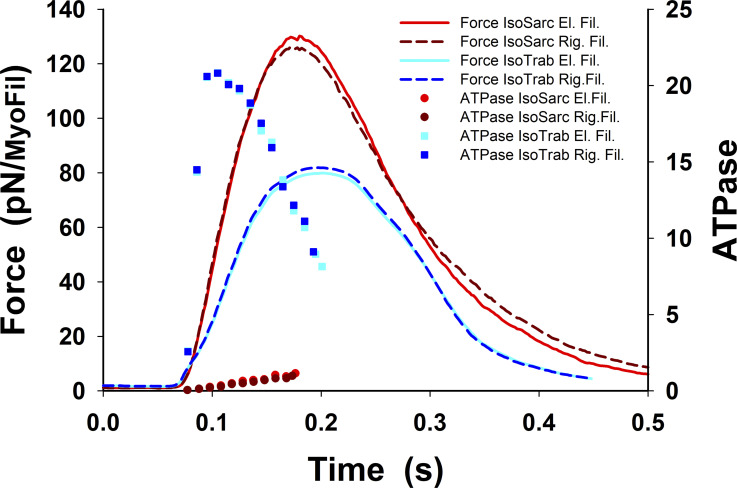
Comparison of ATP consumption rate, ATPase, during twitch contractions of isometric half-sarcomere and fixed-length trabeculae. During twitch in an isomeric half-sarcomere, the ATPase rate increases up to 15% due to relative movement between extensible filaments compared with the ATPase with rigid filaments (Mijailovich et al., 1996). Therefore, ATPase shows only a minor increase if the extensibility of thick and thin filaments is taken into account. In contrast, the ATPase in fixed-length trabeculae shows more than an order of magnitude change during tension rise, having a peak value ∼21 s−1. This large increase is associated with a large degree of sarcomere shortening (80 nm) that requires multiple detachments and reattachments of the cross-bridges. The ATPase is calculated as the rate of cross-bridge detachment over the number of cross-bridges participating in an active cross-bridge cycle; that is, the cross-bridge in PS is excluded.
Figure S7.
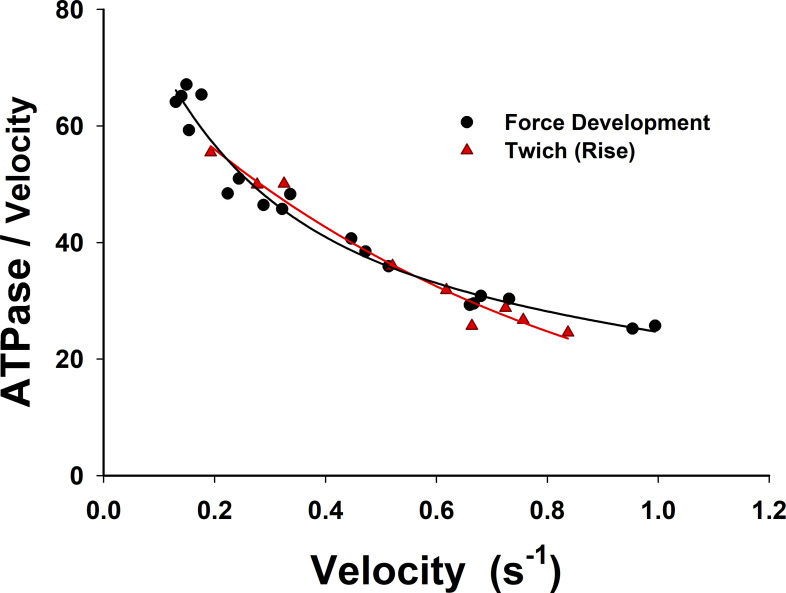
ATPase is strongly correlated to sarcomere-shortening velocities in fixed-length trabeculae during force development (in SL per second). The nondimensional ratio of the ATPase and sarcomere-shortening velocity slowly increases from ∼25 at 1 SL/s to ∼50 at 0.25 SL/s. The progressive increase of the normalized ATPase suggests that there is a steady-state component of ATPase that becomes more evident at low shortening velocities <0.25 SL/s. Interestingly, about the same behavior is observed for the simulations of twitches and force development in fixed-length trabeculae. The shortening velocities rise sharply up to 3 SL/s and quickly drop to ∼1 SL/s and further decrease as the rate of force rise decreases.
Figure 5.
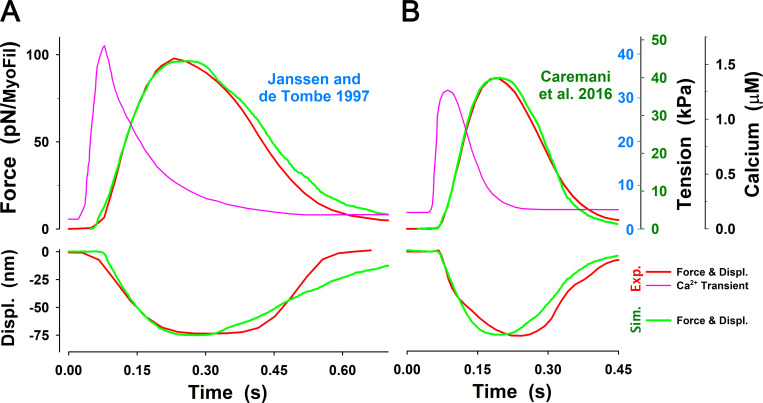
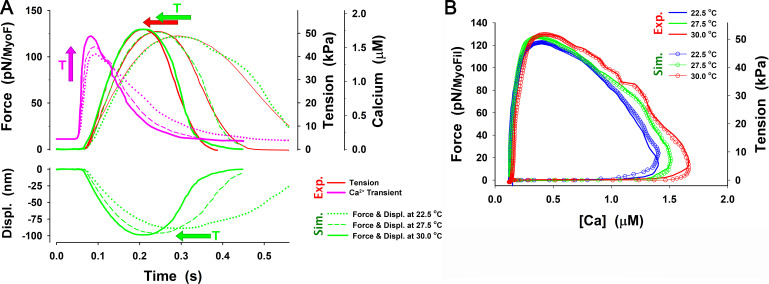
The MUSICO simulation with the six-state model of twitch observed by Caremani et al. and Janssen and de Tombe. Related to Janssen and de Tombe, 1997; Caremani et al., 2016. (A) For the calcium transient observed by Janssen and de Tombe at 22°C (pink solid line), the MUSICO simulations (green solid lines) fitted well the observed force transient (red line). (B) A similar observation was made for the calcium transient observed by Janssen et al. at 27.5°C (pink solid line). The simulations (green solid lines) followed the tension transient observed by Caremani et al. (2016), at 27.2°C (red line). Both simulations also fitted well the shortening during rising tension phase (i.e., decrease in HS length, denoted as Displ.); however, during tension relaxation, the half-sarcomere lengthening is faster than observed. To achieve good fits for the transients at different temperatures (22°C versus 27.2°C) and with fixed and variable SLs, the cross-bridge rates and should be adjusted accordingly (see Table 2). The difference in tension axes between Janssen and de Tombe, 1997; Caremani et al., 2016, denoted as blue and green numbers, respectively, are a consequence of assessment of nominal cross-sectional area at different SLs that strongly affect the conversion factor between force per myosin filament in piconewtons and tension in kilopascals (see Appendix E).
Figure S9.
Changes in twitch tension from Fig. 5 B (black line) by ±20% variation in detachment rate, Increase in increases the rate in tension relaxation. The superscript o is omitted from the figure display for clarity.
Figure S10.
Changes in twitch tension from Fig. 5 B (black line) by ±20% variation in ADP release rate, Increase in only slightly increases the peak of the twitch tension and the relaxation starts at earlier times. The superscript o is omitted from the figure display for clarity.
Figure S11.
Changes in twitch tension from Fig. 5 B (black line) by ±40% variation in Hill coefficient of the rate sigmoidal rise, b. Increase in b decreases the peak of the twitch tension, and the relaxation starts earlier. These changes are much smaller for values of
Figure S12.
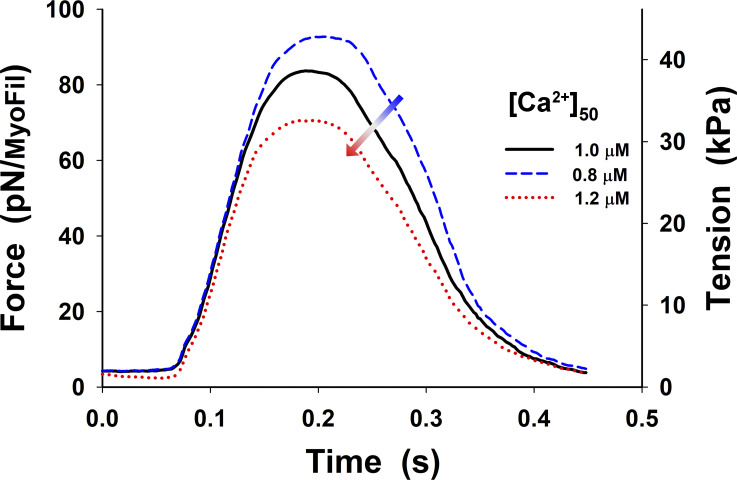
Changes in twitch tension from Fig. 5 B (black line) by ±20% variation in [Ca2+] at the half of rise, [Ca2+]50. Increase in [Ca2+]50 decreases the peak of the twitch tension, and the relaxation starts earlier.
Figure S14.
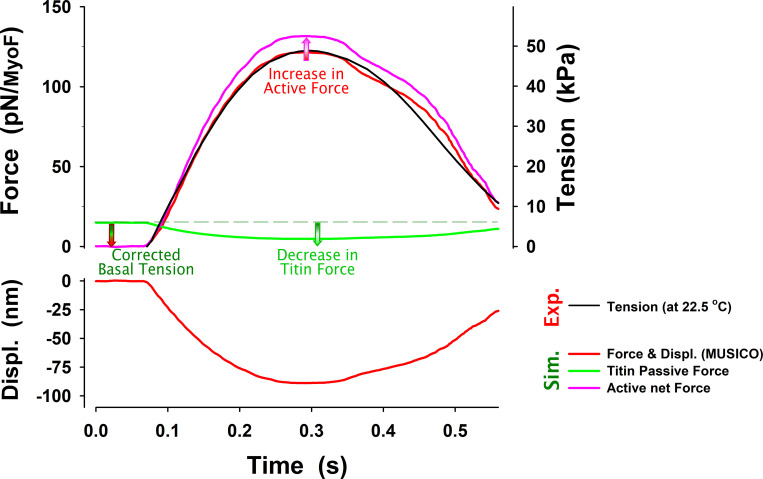
Active tension corrected for the decrease in titin force due to shortening of a half-sarcomere. The observed tension is usually corrected for resting tension associated with the force in titin and other parallel connective tissue. The observed tension (black line) after the subtraction of the resting tension is usually reported as active tension. However, the resting tension in titin and other passive components decreases the tension due to shortening of the half-sarcomere denoted as displacements. The decrease in the (titin) force (green line) during twitch effectively increases active force (red to pink line) by the same amount. Force per myosin filament from MUSICO simulations is shown in parallel with the observed tension.
Figure S15.
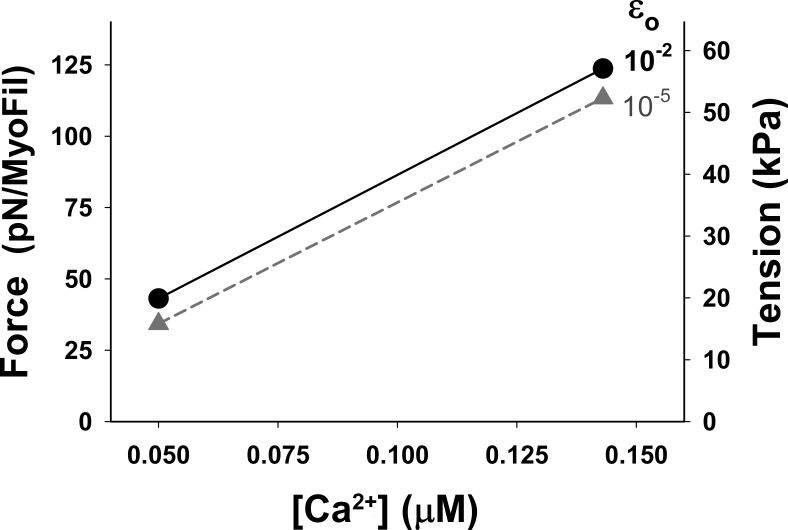
Effect of allosteric TnC–TnI–actin–Ca2+ interaction parameter, εo, on resting tension at observed baseline calcium level (0.143 µM) and when [Ca2+] is reduced to 0.05 µM. MUSICO simulations using the five-state cross-bridge cycle predicted a slight decrease in resting tension at both baseline [Ca2+] for decrease by three orders of magnitude in εo, but significant resting tension remains even at extremely low εo values. Parameters used in simulations are the same as used in the five-state model simulations shown in Fig. 3.
Figure 3.
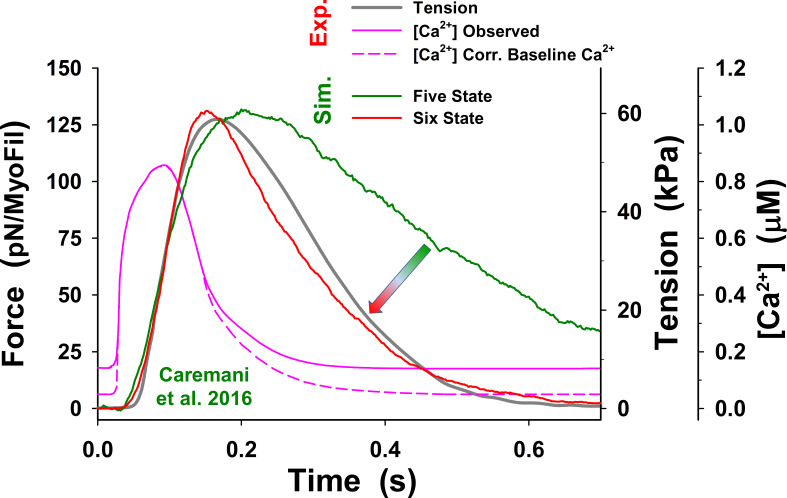
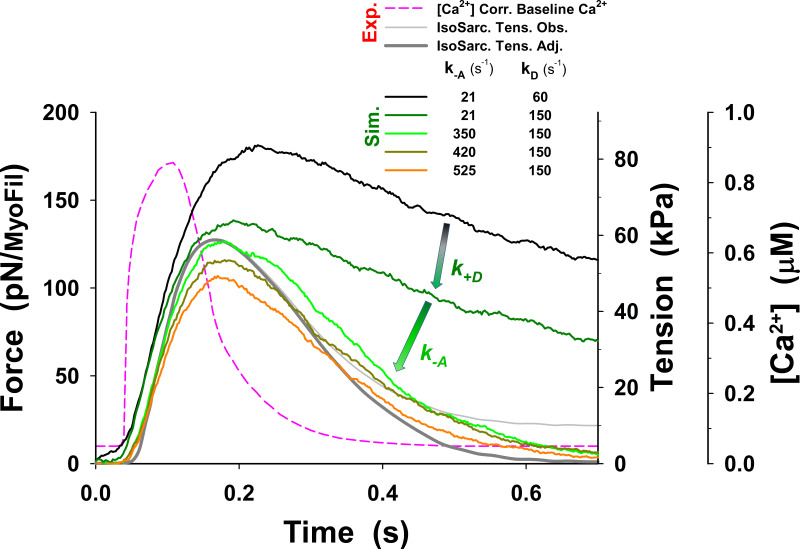
Significance of the PS in twitch relaxation phase. The simulations of a half-sarcomere isometric twitch with the five-state model showed slow relaxation (dark green line) compared with adjusted observations of Caremani et al. (2016) (dark gray line), even when the baseline [Ca2+] was reduced (pink dashed line, denoted as Corr. Baseline). The simulations also predicted high muscle tone at observed baseline [Ca2+] (not shown), similar to that shown by Prodanovic et al. (2020) at comparable low [Ca2+]. In contrast, the simulations with the six-state model, which includes the PS, significantly increased speed of relaxation (indicated by arrow) and the model predictions (red line) matching adjusted tensions observed by Caremani et al. (2016) (dark gray line). Note that the observed tension is adjusted to truly isometric conditions at a half-sarcomere by subtracting passive tension caused by sarcomere lengthening due to length control malfunction (for the details of how the adjustment is obtained, see Fig. S3). Force is shown as an average force per myosin filament (MyoFil). In all simulations (Sim.), we used the same model parameters as shown in Table 1, except and which are presented in the text for the five-state model and in Table 2 for the six-state cross-bridge cycle. For comparison, mean force per myosin filament and corresponding (observed) muscle tension (Exp.) are shown on the vertical axes. For consistency in all plots, resting tension is subtracted; thus, the responses to calcium transient display net change in active tension.
Figure S17.
Changes in twitch tension predicted by the five-state model for change in up to ±50% from those used in Fig. 3 (dark green line), denoted as orig. The main effects of changes in on the tension responses are displayed in changes in the peak tension, resting tension, and the rate of tension rise, but the rate of relaxation changes only marginally in all cases and is about twofold slower than that observed. The superscript o is omitted from the figure axis label for clarity.
Figure S18.
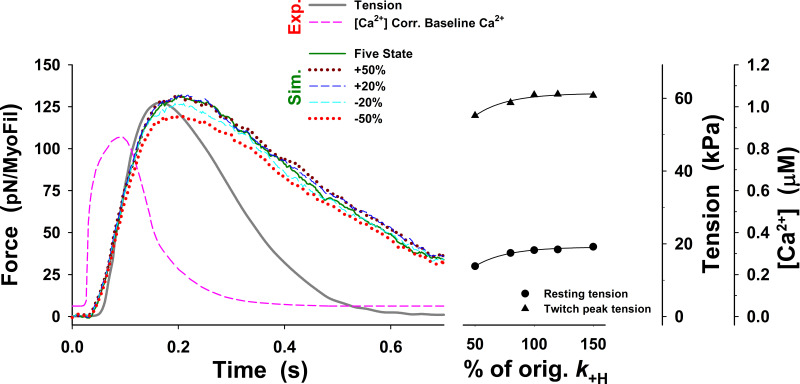
Changes in twitch tension predicted by the five-state model for change in up to ±50% from those used in Fig. 3 (dark green line), denoted as orig. The main effect of changes in on the tension responses are displayed in modest changes in the peak tension, resting tension, the rate of tension rise, and the rate of relaxation. For all values of the rate of relaxation is about twofold slower than that observed.
Figure S19.
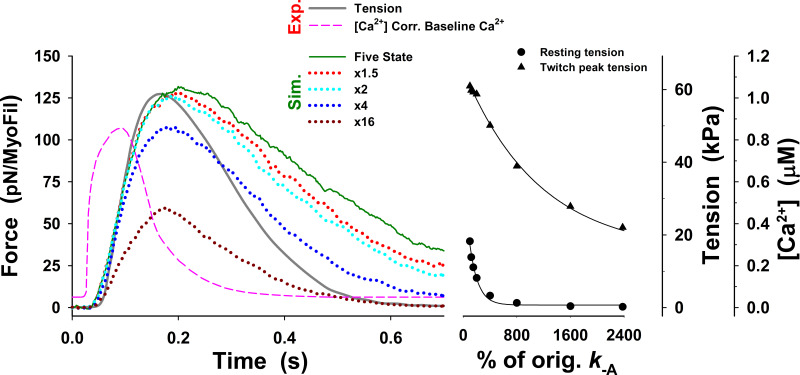
Changes in twitch tension predicted by the five-state model for change in up to 24-fold from those used in Fig. 3 (dark green line), denoted as orig. The main effect of changes in on the tension responses are displayed as changes in the peak tension, resting tension, and the rate of tension rise. There are two distinctive regions in the peak and resting tensions: (1) the peak tensions modestly decrease for increase up to twofold and resting tension decreases for increase up to fourfold; and (2) for larger increases in the peak tension rapidly falls, and resting tension reaches very low levels. Similarly, the rate of tension relaxation increases for increase up to fourfold and then decreases. The superscript o is omitted from the figure axis label for clarity.
Figure S20.
Changes in twitch tension at isometric half-sarcomere obtained from simulations with the five-state model. The tension transient predicted by the cross-bridge model without the PS, using parameters estimated by the best fit with the six-state model (Fig. 3 and Table 2 at 27.2°C) shows much higher peak tension and slow relaxation (black line). Increase of by 2.5-fold significantly decreased peak tension (dark green line) and, in addition, increase of for ∼17-fold brings the peak tension to the observed level, significantly increasing the rate of the relaxation (green line), but it is still not sufficient to reach the observed rate (gray line). Further decreasing decreased the peak tension and slowed the relaxation rate. The superscript o is omitted from the figure display for clarity.
Figure S21.
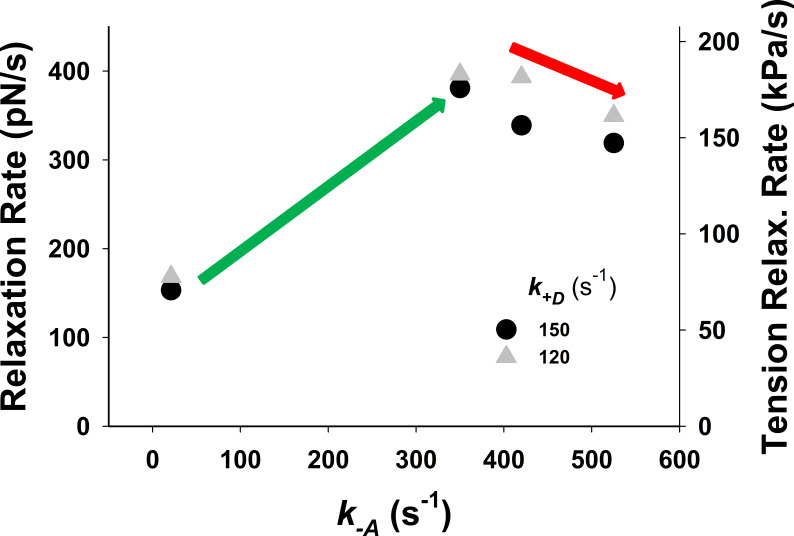
Changes in twitch tension relaxation rates with increase predicted by the five-state model. The tension relaxation rate first increases to approach the observed values for up to ∼350 s−1 (green arrow), but with further increases of the relaxation rate starts to decrease (red arrow). At a lower value of (gray triangle), the relaxation rate is slightly higher but still short of reaching the observed rate value. The superscript o is omitted from the figure display for clarity.
Figure S22.
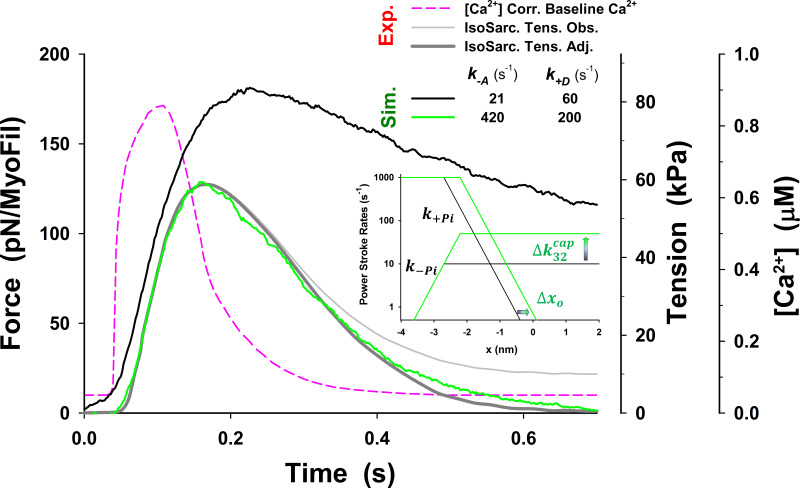
The best fit to the observations with the five-state model requires the change in power stroke rate k+Pi (inset) in addition to changing and Effectively, a shift of for ∼0.5 increases the number of cross-bridges that can complete an ATPase cycle and enables faster relaxation. This change is achieved by an increase in while keeping the equilibrium rate and the reverse power stroke rate unchanged (see Eq. A4). The superscript o is omitted from the figure display for clarity.
Figure S24.
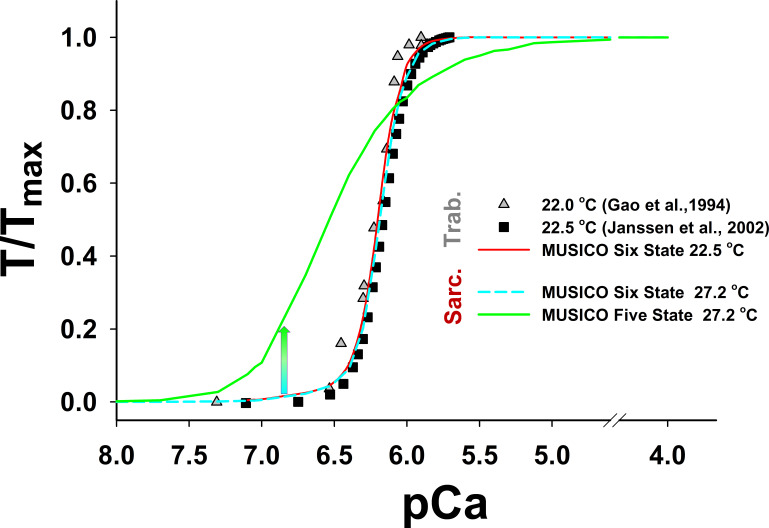
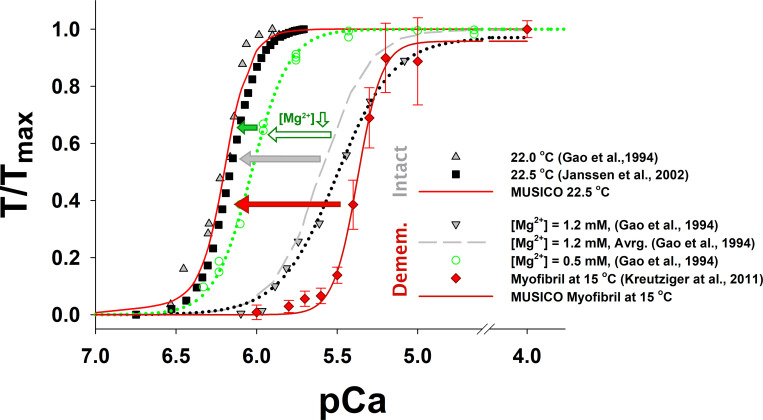
Comparison of tension–pCa relationships between the cross-bridge cycle models with or without PS (i.e., the six- and the five-state models). The simulations of tension–pCa relationships in fixed-length intact trabeculae with the six-state model (red line) agrees well with the experiments of (Gao et al., 1998; Janssen et al., 2002) at 22.5°C (symbols). The parameters used in these simulations are the same as those used in Fig. 7. The simulations of tension–pCa relationships in isometric half-sarcomeres with the five-state model (green line), using the parameters from the simulations that matched the observations (in Fig. S22), showed significantly higher sensitivity of tension at low levels of [Ca2+] (pCa > 6.6) and lower cooperativity (i.e., Hill coefficient) than observed. In contrast, the simulations with the six-state model (dashed cyan line) using the same parameters as those for simulations of twitch contractions of isometric half-sarcomeres at 27.2°C (Fig. 3) matched the observations and showed low levels of tension for pCa >6.6. Notably, the five-state model predicted about the same resting tension at [Ca2+] 0.143 µM (cyan-green arrow) as at the same baseline [Ca2+] shown in Fig. S23.
Results
Isometric fixed end twitch contractions in cardiac muscle result from Ca2+ transients that lead to transient tension responses and SL changes. In intact trabeculae, this involves the combined effects of multiple underlying mechanisms acting together. Thus, to test the effects of two novel features of our new model, namely thick filament activation during contraction and the series elasticity observed in cardiac muscle, we first address them separately. To establish the kinetic parameters of the Ca2+ activation scheme and the cross-bridge cycle, we first simulated twitches in a single isometric half-sarcomere. Then, using these parameters, we simulated twitches of a fixed-length trabecula using a multisarcomere system in series that contains an elastic component to predict changes in the SLs.
Why a PS is necessary for twitch contractions of an isometric sarcomere
We tested the ability of the five-state cross-bridge model (Fig. 2 A), coupled to a Ca2+ regulatory scheme (Fig. 2 C), to simulate twitch contractions in an isometric half-sarcomere using MUSICO. There are only a few published trabecular twitch experiments where SL was kept approximately constant (Janssen and de Tombe, 1997; Caremani et al., 2016). The experiments of Janssen and de Tombe recorded Ca2+ and tension transients at 22°C, but the data have an unusual flat top to the tension transient, which is not typical of the transients recorded in the literature and is hard to describe in simulations (see Fig. S4; and Niederer et al., 2006). Caremani et al. recorded tension but not Ca2+ at 27.2°C. To provide the Ca2+ transient for the Caremani et al. experiment, we adapted the calcium transient of Janssen et al. (2002) collected at similar temperature (i.e., 27.5°C) during twitch contractions in fixed-length trabecula experiments. The transients typically achieve a higher peak [Ca2+] in fixed-length trabeculae, where internal shortening can occur, than in isometric sarcomere twitches where feedback length is controlled (Janssen and de Tombe, 1997). We rescaled the adapted Ca2+ transient for the Caremani et al. trabecula to the isometric half-sarcomere using the ratio of peak Ca2+ recorded in both protocols by Janssen and de Tombe, 1997 at the lower temperature (for details, see Appendix D).
In the isometric half-sarcomere twitches at 27.2°C observed by Caremani et al. (2016), the length of half-sarcomeres was well controlled during the rising phase of tension (Fig. S3). However, it was far more difficult to control tension during relaxation, where inhomogeneity in the sarcomeres can occur, leading to differential shortening and lengthening of sarcomeres. We considered whether a loss of SL control could induce a discrepancy in the recorded tension. Specifically, the Caremani et al. tension transients showed some lengthening at the sarcomere level during the relaxation phase (Fig. S3). This lengthening increased tension in a passive parallel elastic (PE) component that is not present if the half-sarcomere is kept isometric. Consequently, the adjusted tension for the effect of PE (dark gray line in Fig. 3) had faster relaxation and lower resting tension than the observed tension in the Caremani et al. experiment.
The obtained prediction of the twitches using our five-state model shows a good match to the peak tension, but tension rise was slightly slower, and there was a poor overall fit to the relaxation phase (dark green line in Fig. 3), with the fall in tension being too slow, compared with the observed tension transient (dark gray line in Fig. 3). The parameters used in the simulations of the isometric half-sarcomere are listed in Table 1, except parameters and which were adjusted for the isometric conditions having values 50 s−1, 21 s−1, and 150 s−1, respectively. In addition, the five-state model also predicted a high level of resting tension, of the order of ∼40 kPa, which was corrected by lowering baseline [Ca2+] (Fig. 3, pink dashed line) to the observed tension values of <10 kPa. Both the high resting tension and the slow relaxation were the result of a high population of cross-bridges in the M.D.Pi state that can bind to actin to generate tension even at low [Ca2+]. Thus, there are too many bound, tension-generating cross-bridges at baseline [Ca2+] levels and during relaxation after [Ca2+] becomes low.
To resolve this problem, we explored the possibility that changes in a few key rate constants of the five-state model could increase relaxation rate and closely replicate the observed twitch. A reduction in the number of available cross-bridges could potentially be achieved by weakening the association equilibrium constant for cross-bridge binding by increasing the value of An increase of to 350 s−1 brought the rate of relaxation closer to that observed but also began to slow the rate of tension rise (see Fig. S2, green line versus dark gray line). A 350 s−1 decreased from 2.38 to 0.14, which reduced the probability of cross-bridge binding to an available actin site from 70% to 12%. Such a low probability would be incompatible with the tension levels observed at full calcium activation. Similarly, assuming an effective actin concentration of 1 mM in the sarcomere, the predicted affinity of the cross-bridge for actin would be 420 µM for KA of 2.38 and ∼7 mM for a KA of 0.14. The value of [A]/KA = 7 mM is far too high, resulting in low estimates of actin affinity comparing to observed values in ATPase assays.
We further explored the possibility of various combinations of parameters (see Figs. S16, S17, S18, S19, S20, S21, S22, and S23) so that model predictions with the five-state model match the observed tension responses. The best match of MUSICO five-state model predictions with experimental observations was achieved by varying values of and shifting forward power stroke rate for nm (Fig. S22). The shift (see inset in Fig. S22) effectively increased the number of cross-bridges that can complete the power stroke and go through a full ATPase cycle. The latest step increased the cross-bridge detachment and rate of tension relaxation, enabling the model predictions to match the observations (Fig. S22). However, this was only achieved by a reduced level of baseline [Ca2+], as used in Fig. 3 for simulations with the five-state model. Moreover, the simulations with the observed Ca2+ transients showed the high resting tension and slightly higher tension peak, and they slowed the rate of tension relaxation (Fig. S23). We further explored other values of parameters, but we were not able to reduce the resting tension. The reason is shown in Fig. S24, where the tension–pCa relationship, obtained using the parameters that achieved very good fit to the observation (displayed in Fig. S22), shows increased Ca2+ sensitivity at low [Ca2+]. Importantly the tension at baseline [Ca2+] shown in Fig. S24 is approximately the same as the resting tension in Fig. S23 at the same [Ca2+].
An alternative way to reduce the number of available M.D.Pi cross-bridges, accelerate relaxation, and lower resting tension is to incorporate a regulated thick-filament relaxed state (see Fig. 2 B). Such a relaxed state of the thick filament, called the “PS,” has been widely discussed in the literature in recent years, and the background to this is introduced in the Materials and methods section (Linari et al., 2015; McNamara et al., 2015; Irving, 2017).
There are several ways in which a relaxed thick filament could be regulated and implemented in our model, as outlined in the Materials and methods section. The PS could be regulated via strain in the thick filament, via phosphorylation of the RLC and MyBP-C, or Ca2+-dependent association/dissociation from the thick filament backbone. To implement any of these in the spatially explicit 3-D model, we would need to know details of myosin head packing onto the thick filament, the degree of cooperativity in the transition between the parked and active states, and any necessary differences between, for example, the C and D zones of the thick filament, as suggested by Brunello et al. (2020). In the absence of direct experimental evidence for a detailed thick-filament activation mechanism, and for simplicity, we made the PS Ca2+ sensitive with a Ca2+ affinity of 1 µM. This allowed thick-filament regulation to mirror that of the thin filament (see Eq. 1 in the Materials and methods section for a definition of Ca2+-dependent state transition rates). The simulations using the six-state model (red line in Fig. 3) substantially improved matching of the observed experimental resting tension and tension transients, and, importantly, the relaxation time course was close to observations. The parameters used in our simulations of isometric sarcomere experiments that are different from those listed in Table 1 are shown in Table 2.
Table 2. Comparison of parameters for the twitch contraction simulations with the six-state model (including PS) of isometric half-sarcomere (Figs. 3, S2, and S4) and trabeculae at fixed length Fig. 5, A and B, and Fig. 6 A.
| Isometric HS | Fixed-length trabeculae | |||||
|---|---|---|---|---|---|---|
| XB cycle | Parameter | 22°Ca | 27.2°Cb | 22°Ca,c | 27.2°Cb,c | 30°Cc |
| Myosin–actin binding rate | 72 | 125 | 140 | 226 | 256 | |
| Myosin–actin detachment rate | 10 | 21 | 22 | 46 | 66 | |
| Power stroke Gibbs energy change | −15.3 | −15.3 | −13 | −13 | −13 | |
| ADP release rate | 40 | 60 | 40 | 60 | 92 | |
Displayed are only parameters that are different from those shown in Table 1. Rates and are per second; is in units of kBT. HS, half-sarcomere; XB, cross-bridge.
Janssen et al. (2002) at slightly different temperatures of 22.5°C and 27.5°C; the rate is slightly higher, 149 s−1 at 22.5°C.
We also did attempt to fit the transient of Janssen and de Tombe (see Fig. S4). We could generate a reasonable description of tension rise and peak tension; however, the relaxation phase was inconsistent with the observed tension trace by Janssen and de Tombe. This could be consistent with a problem controlling the SL during relaxation similar to that of Caremani et al. The parameters used in these simulations were adjusted for the 5.2°C-lower temperature than that used by Caremani et al., and they are listed in Table 2.
Importantly, simulations with the cross-bridge model with the PS showed significantly reduced resting tension and had little effect on the rate of tension rise or peak tension, but they accelerated the relaxation phase and resulted in a near-perfect fit to the adjusted tension transient (Fig. 3, red line). Thus, this six-state model was able to effectively simulate relaxation, which has been a major challenge in modeling data where tension is not normalized, because detaching myosin heads entering the PS was not available to reattach and contribute to the maintenance of tension.
Tension and SL responses to Ca2+-evoked twitch transients in fixed-end trabeculae
As noted above, sarcomeres are not isometric during an observed “fixed-end” trabecular twitch, as shown by Janssen and de Tombe, 1997; Caremani et al., 2016, who simultaneously measured the tension and half-sarcomere displacement during the twitch. The sarcomere-level shortening and lengthening due to trabecular compliance affects the time course and magnitude of the observed tension (Caremani et al., 2016). The observed tension–displacement loop shows higher tensions during sarcomere shortening and lower tensions during sarcomere lengthening (Fig. 4 A, orange circles). Accordingly, sarcomeres shortened during tension rise and lengthened during relaxation. The next step in development of the model was to incorporate a compliance originating from the series elasticity of cardiac muscle structural components (Fig. 1).
Figure 4.
The twitch in fixed-length trabecula is not isometric at the level of a sarcomere. Caremani et al. (2016) measured the tension–sarcomere displacement relationship during isometric twitch contraction of rat trabeculae. During twitch contraction, the tension rises and sarcomeres shorten, but during tension relaxation, sarcomeres lengthen. (A) The tension–displacement loop shows higher forces during sarcomere shortening and lower forces during sarcomere lengthening (orange circles). The arrows signify the direction of these changes. For simplicity, we derived a nonlinear serial springlike elasticity from average loop force–displacement relationship (thick gray line). (B) The difference of force (orange circles) from the mean (thick gray line) in A showed an approximately symmetric shape along the path of the loop. For comparison, the tension–displacement loop from Janssen and de Tombe, 1997 experiment is shown in Fig. S5.
For simplicity, we derived a nonlinear serial spring-like elasticity (SE) from the average loop tension–displacement relationship (gray line in Fig. 4 A). The difference of tension (orange circles) to the mean (gray line) in Fig. 4 A showed an approximately symmetric shape along the path of the loop (Fig. 4 B), reflecting the viscoelastic effects due to shortening and lengthening velocities. A similar relationship was derived from the Janssen and de Tombe experiments (see Fig. S5), where the magnitudes of the peak tensions and displacements show about the same values, but viscoelastic effects were a little different, more so during relaxation.
Caremani et al. did not observed [Ca2+] transients for the fixed-length trabecula at 27.2°C. Therefore, as for the isometric sarcomere twitches above, we used the time course of the [Ca2+] transient from Janssen et al. (2002) at 27.5°C, but with a reduced peak from 1.51 to 1.20 µM to match the lower tension at the lower temperature. The corrected [Ca2+] trace, proportionally scaled down from Janssen et al., is shown as a pink line in Fig. 5 B.
The tension and [Ca2+] transients shown on Fig. 5, A and B, reflect the change in temperature between the two conditions. In all simulations, we used the six-state model with the same parameters as for the isometric sarcomere data in Fig. 3, and the nonlinear trabecular SE stiffness (Fig. 4 A and Fig. S5). The MUSICO simulations did not produce a good match to the observed transients (not shown). To produce a match to the tension transient, three parameters needed to be adjusted: the forward and reverse rates for myosin attachment to actin and the power stroke free energy change, Their values used are listed in Table 2. The simulations, shown in Fig. 5, A and B (green line), describe the tension transients (red line) quite well in both the rising and relaxing tension phases. However, during tension relaxation in both experiments, the predicted half-sarcomere lengthening was slower than experimentally observed.
A principal cause of the inability to fit both tension and displacement could be the oversimplified nonlinear stiffness used for the SE component, which neglects the hysteresis in the observed tension–displacement data caused by the viscoelastic effect shown in Fig. 4 A and Fig. S5. However, the model predictions were able to describe tension and the size of the SL changes in fixed-length trabeculae (Fig. 5). Because measurements of tension are more precise and more reliable than measurements of displacements, in the following analyses and comparisons, we focus on the tension transients.
The adjustments required to simulate the fixed-length trabecula versus isometric sarcomere tension transients were similar at both temperatures used (Table 2). The values of and increased approximately twofold in each case (range, 1.8–2.2-fold), whereas remained unaltered and increased by ∼15%. This adjustment can be accounted for to a significant extent by the shortening/lengthening of sarcomeres that occurs during the twitch. This change in structure affects the number of accessible actin-binding sites for myosin through changing the alignment of the thick and thin filaments and alterations to the strain-dependent rate constants (k+A, k−A). Note that because both and change by the same amount, there is no change in the equilibrium constant of M.D.Pi binding to actin. For a sensitivity analysis of the adjusted parameters, see Figs. S8, S9, S10, S11, S12, and S13.
It is interesting to note that lengthening and shortening also result in significant changes in the cross-bridge cycling rates (ATPase rates; Figs. S6 and S7), as expected from the Fenn effect (Fenn, 1924). Length effects on Tn Ca2+ release/uptake rates have also been reported (Kataoka et al., 2007). Moreover, it is worth noting that correcting for the 5.2°C temperature change between the two datasets was identical for the isometric sarcomere and the fixed-end twitches. This is consistent with the temperature effect being due to the temperature sensitivity of the underlying molecular events (actin binding and ADP release).
To test our model further, we took a third independent fixed-length rat trabecular twitch dataset from Janssen et al. (2002) collected at three different temperatures (see Fig. 6). These data were collected under conditions similar to the earlier measurements and indicate a slight increase in peak tension, as well as marked acceleration of both tension rise and relaxation with a temperature increase from 22.5°C to 30°C (Fig. 6, red lines). Note that these transients are not identical to those of Fig. 5 because the [Ca2+] transient has a slightly higher peak and hence also a higher peak tension. This provides a reasonable test of the precision of our model. For simulations of tension transients at the three temperatures (Fig. 6, green lines), only three parameters needed to be adjusted (Table 2). Our simulations used the identical set of parameters, including the serial elastic element parameters, used for the 22°C (Janssen and de Tombe, 1997) and 27.2°C (Caremani et al., 2016) datasets (Table 1 and Table 2). The only exception is a slightly increased rate of from 140 to 149 s−1 for an increase in temperature of 0.5°C (from 22 to 22.5°C). The simulations at temperatures paralleling the previous two experiments (Fig. 6, green lines) show an excellent match to tension traces for the Janssen et al. (2002) experiments (Fig. 6 A, red lines). Also, the predicted tension–[Ca2+] loops (solid lines) matched the observations (circle symbols) at all three temperatures (Fig. 6 B). Notably, further increasing temperature to 30°C also produced a modest increase in peak tension and in the rates of tension rise and relaxation. The simulations required a further increase of parameters and by factors of 1.13, 1.4, and 1.5, respectively, for the 2.5°C temperature increase (from 27.5 to 30°C). This is in line with those required for the ∼5°C temperature change from 22 to 27.2°C. Thus, this independent dataset with higher Ca2+ transients and higher peak tensions required no special adjustments from experiments used in Figs. 3 and 5.
Figure 6.
The effect of temperature on twitch transients. (A) The MUSICO simulation with the six-state model (green lines) matched well the force responses (red lines) at 22.5°C, 27.5°C, and 30°C (Janssen et al., 2002). The rise of temperature increased peak [Ca2+] and relaxed [Ca2+] faster (pink lines). The tension transients showed faster rise times, modest increase in peak force, and a fast relaxation phase, reflecting the changes in patterns of calcium transients with the increase of temperature. The arrows signify these trends with increase of temperature. In addition, the good match of the experimental observations required increase in binding and ADP release rates with increasing temperature (Table 2). (B) The same data plotted as force or tension versus [Ca2+] (in μM) following the observations of Janssen et al. (2002).
Predictions of tension–pCa relationship in intact muscles with parameters from twitch contraction simulations
A major challenge in simulating cardiac muscle contraction is to predict the [Ca2+]50 and Hill coefficient in the force–pCa relationship of intact muscle. We took the parameters from Table 1, and the cross-bridge kinetics at 22.5°C listed in Table 2, used to generate fits of the twitch data of Janssen et al. (2002) at 22.5°C (Fig. 6 A), to simulate values of the force–pCa relationship (Fig. 7) for fixed-length trabeculae. The simulations with the six-state model (Fig. 7, red line) matched very well the force–pCa data of Janssen et al. (2002) (Fig. 7, black filled squares), including the pCa50 and Hill coefficient (nH) values. The simulations also fit the intact muscle tension–pCa data from Gao et al. (1994) (Fig. 7, gray triangles), which were almost identical to those of Janssen et al. (2002). It is notable that the simulations, with no change in values from those used in Figs. 5 and 6, generated not only the correct pCa50 but also the observed high value of the Hill coefficient. Models that rely solely on Ca2+ regulation of the thin filament via CFC (i.e., intrinsic cooperativity) do not typically produce values of the Hill coefficient above 3 in cardiac muscle (Mijailovich et al., 2019). The higher Hill coefficient, shown in Fig. 7, is a consequence of the cooperativity assumed in the regulation of the thick filament, in addition to thin-filament mechanisms. It is important to note that other models based on cooperativity factors can achieve higher cooperativity factors (Campbell et al., 2001; Rice et al., 2008), but these are parametric models, and these kind of models cannot be compared with structurally based models such as CFC (Geeves et al., 2011; Mijailovich et al., 2012; Mijailovich et al., 2019).
Figure 7.
Increase in calcium sensitivity in intact muscle normalized tension–pCa relationships deduced from the twitch simulations versus those observed in intact and demembranated muscles. MUSICO simulations of the tension–pCa relationships matched the observations in intact muscles by Gao et al. (1994) and Janssen et al. (2002). The muscle tension is normalized by maximum tension at fully activated muscle (T/Tmax). The parameters for MUSICO simulations are the same as in twitch simulations at 22.5°C shown in Fig. 6. However, the sensitivity in intact muscles was significantly higher than in demembranated (Demem.) muscles. The experiments performed on the same muscle before and after demembranation showed a somewhat smaller increase in the muscle sensitivity (gray arrow) than between Kreutziger et al. (2011) demembranated muscle (red arrow). Interestingly, the intact muscle tension–pCa relationships show only small differences between the Gao et al. (1994) and Janssen et al. (2002) observations. Change in [Mg2+] from 1.2 mM (gray dashed line) to the physiological value of 0.5 mM increased calcium sensitivity (green dotted line) toward that observed in intact trabeculae (green arrows; Gao et al., 1994).
Discussion
The MUSICO platform, which includes explicit 3-D sarcomere geometry, several multistate cross-bridge cycles, and Ca2+ regulation of thin-filament activation by a CFC (Mijailovich et al., 2016; Mijailovich et al., 2019), has now been further developed to allow simulations of twitch contraction in cardiac trabeculae. The key new implemented features reported here include a cross-bridge cycle with a PS that enables regulation of thick-filament activation and an SE component observed in twitch experiments in fixed-end trabeculae. In this study, we showed that both features are necessary for our model to simulate twitches and predict the tension–pCa relationship from twitches.
Our simulations show that we can describe three independent datasets for fixed-end trabecula twitches (Janssen and de Tombe, 1997; Janssen et al., 2002; Caremani et al., 2016) using the same parameters after corrections for the different temperatures. The corrections required to the three parameters and listed in Table 2 were modest and in line with expectations of the temperature dependence of protein reactions. Similarly, we have simulated the Caremani et al. (2016) data in which SL was held constant during the rising phase of tension at 27.2°C and the corrected tension during twitch relaxation phase for the distortions of the PE elements caused by imperfect sarcomere control during relaxation. The corrections between the isometric sarcomere and the fixed-end twitches were twofold decreases in the rates of attachment and detachment of myosin to actin, which may reflect changes in accessibility to actin sites during lengthening/shortening.
In addition to the sensitivity analysis in the supplemental material, two other features came out of the model that were not part of the initial objective. The same parameters used to describe the twitches in Figs. 5 and 6 were able to generate a force–pCa relationship observed in two previous studies (Gao et al., 1994; Janssen et al., 2002). Similarly, the same sets of parameters were able to predict the change in the ATPase/cross-bridge cycling rate during the rising and falling phases of the tension transient. The cycling rates, as expected, change due to the shortening and lengthening of the sarcomeres (Fenn, 1924).
Why a PS may be necessary for cardiac muscle and normal ventricular function
Simulations using a minimal five-state cross-bridge model, coupled with thin-filament activation by Ca2+ in intact muscle, presented three apparently unrelated problems: slow tension relaxation during the twitch (Fig. 3), high levels of resting tension, and unrealistic values for the myosin (cross-bridge) detachment rate, to bring the tension relaxation rate toward the observations (Fig. S2). High resting tension was also predicted in simulations of demembranated cardiac muscle fibers and at low Ca2+ (Prodanovic et al., 2020). These observations suggest a missing component in the underlying mechanisms of activation and relaxation. This conclusion is supported by recent studies indicating that, in addition to thin-filament activation, thick-filament activation may be an important process (Linari et al., 2015; McNamara et al., 2015; Irving, 2017; Reconditi et al., 2017). This is especially true when considering length-dependent activation (Ait-Mou et al., 2016; Caremani et al., 2019) and the contractile abnormalities that occur in cardiac myopathies associated with mutations in thick-filament proteins (Hooijman et al., 2011; Spudich, 2015; Nag et al., 2017; Anderson et al., 2018). The thick filament may contain one or more “off” states where myosins are not available to bind to the thin filament. For example, both structural (Zoghbi et al., 2008) and biochemical energetic studies suggest an ordered state, the so-called SRX state proposed by Cooke (McNamara et al., 2015), and a disordered state still associated with the thick-filament backbone (Anderson et al., 2018; Brunello et al., 2020) that has extremely low probability for myosin heads to bind actin. One possibility for the transition from a myosin PS to an “on” (i.e., M.D.Pi) state could be triggered by thick-filament strain (Linari et al., 2015; Irving, 2017). This kind of mechanism has been implemented in a model of cardiac contraction where the rate of transition from the myosin PS state to M.D.Pi state is proportional to force (Campbell et al., 2018). This model provides reasonable predictions of length-dependent activation and twitch contractions in cardiac muscle, but the model used simplified cross-bridge cycle kinetics and sarcomere geometry and did not take into account the observed significant SL changes (Janssen and de Tombe, 1997; Ferrantini et al., 2014; Caremani et al., 2016). In addition, these good fits are achieved by an empirically defined flux of thin-filament regulatory units to an on state tightly coupled to the Ca2+ transient and inclusion of a cooperativity factor that amplifies the number of on states during calcium rise and attenuating during the fall of [Ca2+] levels. The cooperativity factor was necessary to close units during tension relaxation because the thick filament is strongly activated at high tension, and relaxation was prolonged without this factor. The concept of thick-filament activation rates coupled to force should be further investigated to provide possible mechanisms. Moreover, a recent paper (Ma et al., 2018a) suggested that thick filament–based regulation is likely to be more complex than the previous studies implied and that other mechanisms of thick-filament activation could be operating during twitch contractions, as suggested, for example, in our preliminary studies (Prodanovic et al., 2020) and justified here.
In our model, the PS acts as a Ca2+-dependent buffer for myosin cross-bridges, increasing the available myosin heads on Ca2+ activation and reducing the population of M.D.Pi state during relaxation. This was achieved in the model by the transition rate out of the PS, having a slow rate at low [Ca2+] and a fast rate at high [Ca2+] concentrations (Eq. 1). Such a model may be supported by x-ray diffraction observations that myosin heads rapidly move radially away from the thick-filament backbone during fast Ca2+ activation of frog skeletal muscle (Huxley et al., 1994), much faster than the increase in the number of attached cross-bridges and subsequent development of tension. These unbound myosin heads in the proximity of actin filaments increase the pool of cross-bridges available to bind to the thin filament. A Ca2+-dependent transition rate from PS is one of multiple alternative possibilities for activation of the thick filament that needs to be further investigated experimentally before it is fully confirmed.
Our implementation of the PS illustrates how the presence of this PS can slow the rate of tension rise, reduce resting tension, and accelerate relaxation by limiting the number of myosin heads available to interact with actin. It follows, therefore, that if the occupancy of the PS can be manipulated by phosphorylation events (e.g., RLC, MyBP-C), small molecules (e.g., mavacamten, deoxyadenosine ADP), or mutations in myosin or MyBP-C, then alterations in all three twitch parameters can be expected. Indeed, several recent studies have suggested that many hypertrophic cardiomyopathy–linked mutations in myosin or MyBP-C cause hypercontraction by reducing the occupancy of the SRX state, allowing more myosin heads to participate in a contraction, and that this can be reversed by molecules such as mavacamten. The SRX and DRX states observed in experiments is equivalent to our PS in the model presented here. Our model may therefore be able to predict the results of mutations and small molecules on the cardiac myocyte twitch. Effects on twitch relaxation times similar to those anticipated in the absence of PS here were reported by Toepfer et al. (2020) for cardiac induced pluripotent stem cells expressing hypertrophic cardiomyopathy–linked mutations in myosin that were reversed by mavacamten.
Series elasticity of trabeculae
Fixed-length contractions of cardiac muscle can result in relatively large changes in SLs during twitch contractions (∼7%; Janssen and de Tombe, 1997; Caremani et al., 2016), indicating significant compliance in intact muscle preparations. Current simulations of the cardiac twitch contraction typically use models of the half-sarcomere (though, on rare occasions, multiple sarcomeres in series) where the thick- and thin-filament compliances account for only a small fraction of the observed compliance in the cardiomyocytes or tissue. The first attempt to model the SE component was reported by Parmley and Sonnenblick (1967), who proposed schemes of CE in series and in parallel with the elastic elements (SE and PE). This kind of model has been used in simulations of twitch contractions in trabeculae; however, prediction of a highly simplified model only showed the effect of the variation of SE and PE elements but not in milieu or experimentally observed data (Rice et al., 2008). In a more detailed model (Campbell et al., 2018), SE is apparently incorporated, but the changes in SLs reported are small and largely underestimate the observed values. It is likely that they considered only compliance of thick and thin filaments and not compliance of trabeculae. Our results presented here and elsewhere (Prodanovic et al., 2020) suggest that analysis of subtle differences in cardiac muscle dynamic contractions associated with, for example, mutations in sarcomere proteins requires a thorough description of the series elasticity observed in cardiac muscle in order to be most accurate and informative.
A simplified definition of the series elasticity, derived from the observations of Caremani et al. (2016), was used in our simulations and provided reasonable but not exact fits of tension transients and sarcomere displacements during twitch contractions of fixed-end trabeculae (Fig. 5). Specifically, it was difficult to achieve good fits for both tension and displacements, particularly during relaxation. The reasons for this may come from both experimental and model limitations. On the experimental side, measurements of SLs are obtained by different techniques, often with different outcomes. For example, Caremani et al. (2016) used a striation follower to monitor SL in the middle portion of the trabeculae, whereas Ferrantini et al. (2014) used laser diffraction. In the first case, the change in a half-sarcomere length, denoted as displacement, represents an average of half-sarcomere length changes in the middle portion of trabeculae, where the SLs are more uniform. In the laser diffraction case, the half-sarcomere length is determined as an average of all sarcomeres reflected from the laser beam. The use of different measurement techniques resulted in large variations in recorded displacement traces, such as between observations of Caremani et al. (2016) and Ferrantini et al. (2014). In addition, either of these techniques cannot fully control the inhomogeneity within these SLs during tension relaxation, particularly in the chaotic phase of relaxation (Brunello et al., 2009).
The use of simplified elastic characteristics in the model instead of the observed hysteretic loop (Fig. 3) is in part responsible for imperfect matches of displacements in simultaneous traces compared with the observations of sarcomere lengthening during tension relaxation (Fig. 5, A and B). The exact tension–length relationship (orange circles in Fig. 4 A) can be implemented in MUSICO, but we prefer the simplified model (thick gray line in Fig. 4 A). This is because the observed force loop depends on the magnitude and rate of developed tension and needs to be recorded separately for each experiment, information that is usually not available. Thus, we believe that fitting the tension traces is a more general and more robust approach than fitting displacements.
The effect of changes in calcium sensitivity on twitch contractions
The majority of studies on cardiac muscle contraction have focused on force generation and the Ca2+ sensitivity of steady-state force that can be relatively easily assessed as a function of [Ca2+] in the activation solutions. Accordingly, an abundance of experimental data in the form of force–pCa relationships provides evidence for functional changes in cardiac muscle associated with cardiomyopathies and their responses to treatment by prospective drugs. However, these data cannot be directly translated to physiological transient contractions in the living heart. Our simulations predicted the tension–pCa data of Janssen et al. (2002) and Gao et al. (1994) (Fig. 7) with the same model parameters as for the twitches at the same temperature. This is a promising step toward the possibility of interrelating the Ca2+ sensitivity from steady-state measurements to tension responses to Ca2+ transients. We believe that the reverse process is possible: to predict twitches with parameters estimated from tension–pCa relationships of cardiac muscles under similar experimental conditions. However, the problem is that most force–pCa data originate from the measurements in demembranated cardiac muscle.
The experimentally observed difference in the Ca2+ sensitivity of tension between intact and demembranated cardiac muscle is well recognized, but there are only a few studies that have quantitatively assessed the magnitude of these differences (Gao et al., 1994). The [Ca2+] used to determine the force–pCa relationship observed in demembranated muscle is well controlled, but interfilament spacing and experimental conditions such as SL, pH, phosphate, and ionic strength can be significantly different from those in intact muscle cells. To the best of our knowledge, only Gao et al. (1994) have measured the force–pCa relationship for both conditions in the same muscle (Fig. 7). The sensitivity in demembranated muscles was significantly lower than in intact muscles, and it is strongly dependent on experimental conditions (Fig. 7). The differences in experimental conditions between these preparations affecting the Ca2+ sensitivity, including pCa50 and cooperativity, nH, are shown in Table 3. Bringing the experimental conditions in demembranated muscles close to those observed in intact muscle reduces the differences in both pCa50 and nH between the preparations. The strongest effect is reduction of free Mg2+ to the physiological value of 0.5 mM that reduces the difference between intact and demembranated muscle to only ∼0.2 pCa units. Interestingly, this difference in sensitivity can be attributed to the effect of the large increase in interfilament spacing, from d10 = 33.83 nm in intact muscle to 41.66 nm in demembranated muscle (both at SL = 2.2 µm). This increase in sensitivity is similar to that observed experimentally when the lattice of demembranated muscles is compressed back to intact muscle values with dextran (Cazorla et al., 2001; Martyn et al., 2004). Our simulations of these experiments predicted a change of 0.15–0.25 pCa units (Mijailovich et al., 2019) that can bring the sensitivity values of demembranated muscle at 0.5 mM free Mg2+ to the values observed in intact muscle. This is a promising result, but it is based on a single experiment, and to fully develop methodology to translate the force–pCa data from demembranated muscle to twitches, it is necessary to confirm it by stronger experimental evidence. This is additional evidence of how strongly coupled experimental data and computational simulations could translate valuable data to physiologically relevant cases.
Table 3. Hill coefficient and pCa50 in intact and demembranated rat trabeculae.
| Source | Temp. (°C) | SL (μm) | Free Mg2+ (mM) | nH | pCa50 |
|---|---|---|---|---|---|
| Intact | |||||
| Gao et al., 1994 (Fig. 8) | 22.0 | 2.2 | 4.87 | 6.21 | |
| Janssen et al., 2002 | 22.5 | 2.2 | 4.8 | 6.16 | |
| Yue et al., 1986 (Fig. 2) | 5.59 | 6.34 | |||
| MUSICO | 22.5 | 2.2 | 5.1 | 6.2 | |
| Demembranated | |||||
| Gao et al., 1994 (Fig. 5) | 20.0–22.0 | 2.2–2.3 | 1.2 | 2.44 | 5.5 |
| Gao et al., 1994 (Fig. 5) | 20.0–22.0 | 2.2–2.3 | 1.2 | 2.84 | 5.61 |
| Gao et al., 1994 (Fig. 8) | 20.0–22.0 | 2.2–2.3 | 0.5 | 3.75 | 6.03 |
| Dobesh et al., 2002 | 15 | 2.25 | 1.0 | 6.9 | 5.48 |
| Kreutziger et al., 2011 | 15 | 2.29 | 5.74 | 5.37 |
The observed values are complemented with MUSICO predictions, shown in Fig. 7, for intact muscles. Displayed in parantheses are the figure numbers in the cited references from which data were taken.
Active tension and role of titin in length-dependent calcium sensitivity
Tension in cardiac muscle is measured as the aggregate of active and passive tension. The active tension reflects forces generated by bound cross-bridges and the passive tension as the collective contribution of titin and collagen (Cazorla et al., 2001). The passive tension is ∼0 at slack length, but at longer SLs the tension progressively increases nonlinearly (Mijailovich et al., 2019). During twitch contractions of the isometric trabeculae, a significant shortening of sarcomeres, up to 80 nm per half-sarcomere, can be observed and is due to series elasticity (Fig. 6). The shortening during a twitch starting from SL = 2.2 µm decreases force in titin from ∼16.5 pN per myosin filament to ∼0 at SL = 1.9 µm; thus, the active tension has slightly higher peak magnitude than reported in the literature, where initial (passive) tension is simply subtracted from total tension measured (Fig. S14).
Potential model limitations: variation of the model parameters, uncertainties of experimental evidence, and parameter estimation methodology
Fitting multiple sets of data presents numerous challenges. The model is imperfect (as are all models), and multiple sets of parameters can fit the desired set of data. On the other hand, there is a need to reconcile the large variability in the data obtained in the same kind of experiments from different laboratories with slight or no obvious changes in experimental conditions. There are also differences in preparations (e.g., intact versus demembranated trabeculae) and in modes of contraction, such as transient twitch responses and steady-state contractions usually displayed as force–pCa relationships. Here, we minimized the number of fitting parameters by using experimentally determined values whenever possible. Examples include SL and lattice spacing and other well-established experiments such as ATPase measurements and motility assays. The remaining parameters are estimated as best guesses based on experience and experimentation. However, some parameters can inherit hidden deviations due to specific conditions of the experiments that could be quite different in intact or demembranated muscles. For example, demembranated muscles show a large increase in sarcomere lattice spacing that is associated with decreases in myosin-binding rate and Ca2+ sensitivity compared with intact muscle. Experiments often have their own large variation, with differences in magnitude and shape of tension responses during twitches that may reflect seemingly minor differences in experimental conditions. A second large hurdle is the incompleteness of most datasets, where simultaneously measurements of tension and changes in SL during twitch contractions of trabeculae with fixed lengths and Ca2+ transients are not available. Thus, with these multiple uncertainties on the experimental side, it is exceedingly difficult to fit all experiments with the same set of input parameters. The strength of the detailed modeling approach presented here is the ability to distinguish the contributions of each effect individually to the overall recorded responses where multiple effects operate in aggregate. For example, the contribution of changes in interfilament spacing between demembranated and intact trabeculae to the Ca2+ sensitivity of tension development can be estimated from MUSICO simulations (Mijailovich et al., 2019). The estimate of such an increase in sensitivity of demembranated muscle due to an increase in lattice spacing is only a small fraction of the total increase in Ca2+ sensitivity. The remaining differences need to be attributed to other mechanisms when they are known.
Conclusions
Developing an accurate model of a twitch contraction is a serious challenge that requires multiple theoretical concepts to be integrated into simulations to account for diverse experiments. Our current model includes the Ca2+ transient, mechanisms of cooperativity between thick- and thin-filament activation processes, series elasticity of cardiac tissue, and the force-generating cross-bridge cycle. This was sufficient to provide an accurate description of a twitch contraction of rat cardiac muscle, enabling simulations of tension and SL changes in fixed-length trabeculae as a response to intracellular Ca2+ transients. To accomplish this, two new features needed to be introduced: an SE element and a process for thick-filament myosin activation and deactivation. An elastic component that is adjustable during tension rise and fall is essential to account for the internal sarcomere shortening that occurs in fixed-end “isometric” cardiac muscle contractions. Using thin-filament regulation alone was not sufficient to match the observed relaxation patterns. The main reason for simulations having slow relaxation was the large population of myosin heads in the M.D.Pi state. These heads can rebind to actin filament and therefore impede the relaxation process. Inclusion of a PS (either DRX or SRX state), where myosin heads interact with the thick-filament backbone, provided a mechanism to remove heads from the cycling cross-bridge pool. Our simulations also account for the effect of change in sarcomere interfilament spacing and differences in local experimental conditions (e.g., ionic strength, SL, and temperature). Thus, our simulations demonstrate the need for spatially explicit models to understand the multiple interacting processes that occur within cardiac muscle during twitch contractions. Furthermore, in future studies, the MUSICO platform developed here may provide a powerful tool to explore the effects of point mutations in sarcomeric proteins on twitch transient responses, the effect of the degree of penetrance of the mutated protein(s), and the potential influence of small molecules on rebalancing altered twitch kinetics.
Appendix A
Strain-dependent rates in the actomyosin cycle
The 6-state actomyosin cycle is defined by 11 state transition rates (Fig. 2), of which five are strain dependent. For myosin binding to actin, the strain-dependent rate in quadratic form is derived from a Langevin type of equation balancing thermal fluctuations of the detached myosin molecule, elastic restoring, inertial, and viscous drag forces (Kramers, 1940; Papoulis, 1991; Hunt et al., 1994; Daniel et al., 1998). Most of the cross-bridge kinetics models used the following the equilibrium relation:
| (A1) |
where is the reduction in free energy due to myosin binding in units of is the Boltzmann constant, and is absolute temperature in degrees Kelvin. At zero strain the equilibrium binding rate represents the ratio of unstrained binding and detaching rates, For simplicity, the detachment rate, is usually kept constant, and the attachment rate has quadratic dependence on (strain) x. This approach has worked well for steady-state solutions where there is sufficient time to achieve the equilibrium cross-bridge distributions except during lengthening. During transient changes, typical for trabecular twitch contractions, sarcomeres shorten during force rise due to serial elasticity and then lengthen during force relaxation. The above approach can satisfactorily replicate transient shortening but shows, however, prolonged tension relaxation during transient lengthening. To speed up relaxation, detachment rates during lengthening should progressively increase with strain (for x > 0). Hill explored different distributions of attachment and detachment rates that are consistent with an equilibrium rate constant (Hill, 1974). Following his approach, we used modified attachment and detachment rates:
| (A2a) |
and
| (A2b) |
where, for x > 0, factor increases both attachment and detachment rates but, for larger values of increase in attachment rates becomes smaller, whereas detachment rate progressively increases. For we set leading to (i.e., the formulation in standard form we used previously; Mijailovich et al., 2016; Mijailovich et al., 2019).
The transitions between the two attached states, A.M.D.Pi and A.M.D, are rapid, and this transition includes inorganic phosphate (Pi) release accompanied by a large (negative) change in chemical free energy in units of and the displacement of the lever arm carrying out the power stroke, d:
| (A3) |
Here, defines the equilibrium rate in an unstrained system, such as in experiments in solution, and factor is free energy increase by stretch due to a power stroke from arbitrary x at state 2. The latter term shows a constant shift to higher energy at any whereas decay of is defined by the term. The forward and backward power stroke rates, and can be obtained in the simplified form by assuming that the backward rate of is independent but, in this formulation, forward rate reaches extremely large values with a decrease of even to moderate negative values. Taking into account bending of the lever arm, rates are attenuated, reaching more moderate values with decreases of (Smith et al., 2008). To keep this pattern, the exponential rise of the forward rates and backward rates, for convenience, are capped to the assigned maximums of forward and backward constants (Smith and Mijailovich, 2008; Mijailovich et al., 2016; Mijailovich et al., 2019). For example, for assigned values of (i.e., and cross-bridge stiffness the forward rate including capping is defined as
| (A4) |
where is the cross-bridge strain where large exponential rates are capped. When the cap value is reached, the reverse rate changed to decay exponentially to satisfy the equilibrium constant, (Eq. A3).
For the strain-dependent ADP release (i.e., A.M.ADP → A.M), the forward rate is defined as a function of the rate of ADP release when the elastic element is relaxed, and of the displacement that the lever arm must move to open the nucleotide pocket,
| (A5) |
The backward rate, depends on ADP concentration and for small ADP concentrations can be assumed to be
For ATP binding and cross-bridge detachment rates (i.e., transition between A.M. and M.T states), we assume for now that constant, although it depends on ATP concentration, and due to a large increase in
The state transition rates between detached states M.T and M.D.Pi, and are independent of strain. The forward rate, involves a conformational change in the head following the opening of the 50-kD cleft leading to the recovery stroke and hydrolysis of ATP transitioning into the M.D.Pi state.
The transition of the M.D.Pi state into the PS is defined by the rate constant that could potentially depend on [Ca2+], myosin light chain, and MyBP-C phosphorylation. For simplicity, we first consider only the effect of [Ca2+] by setting, for example, constant and in the form of a Hill curve described by Eq. 1.
Appendix B
Thin-filament regulation by calcium
CFC angular position and its variance
The angular displacements of the Tpm–Tn chain are defined by the function of thermally excited chain configurations defined by the Feynman path integral (Feynman and Hibbs, 1965; Smith, 2001), where the current configuration of bound TnIs and myosins at defined positions, along F-actin, the path of minimum energy represents the mean chain angle and the SD of chain angles arising from thermal excitation (Smith, 2001; Smith et al., 2003; Geeves et al., 2011; Mijailovich et al., 2012).
If there are no constraints, the mean configuration of the CFC is in the closed state sitting on the bottom of the confined potential at the angle and the SD of fluctuating angle, has a value of about where R is the radius at which Tpm sits on the actin filament, and is the confined persistence length of the CFC (Smith et al., 2003). When the CFC is constrained, the chain is pinned at the positions where TnIs are bound to actin at an angle forming a local blocked state, whereas the chain is assumed to be conditionally constrained at positions where myosins are strongly bound to actin, preventing the CFC from reaching angles forming a local open state. At positions where myosins are weakly bound, the chain is conditionally constrained, preventing the CFC from reaching angles The pinning and conditional constraints guarantee that the blocked, open, and closed states correspond to the three orientations seen in cryo-EM images defined by angular displacements and (Pirani et al., 2005; Poole et al., 2006).
Chain-regulated cross-bridge kinetics
The coupling between the Ca2+-regulated position of the CFC and the state myosin cycle involves (1) modulation of myosin binding and the transition between weakly and strongly bound myosin states by the current position of the CFC to the actin site and (2) restriction of TnI rebinding to actin by nearby bound myosins. The biochemical TnI-A states include a bound state of TnI to actin that maintains Tpm–Tn in the position inhibiting myosin binding and in the other state, where TnI is not bound to actin, allowing the Tpm–Tn chain to move azimuthally along the actin surface. The CFC chain on the actin surface is not static but dynamically moves azimuthally, except at locations where TnI is bound to actin, and permits myosin binding for a fraction of time when a binding site on actin is available. Because these azimuthal fluctuations are much faster than myosin binding, the fraction of time that an actin site is available for weak myosin binding is proportional to the probability that the local position of CFC is at and the transition from weak to strong binding, when These probabilities are calculated from the local mean angular position of the chain, and its SD, where i denotes the actin site at the discrete position, along an actin filament strand (Mijailovich et al., 2012; Mijailovich et al., 2019). Conversely, bound myosins reduce the mobility of the CFC and modulate TnI rebinding to actin. In this case, the fraction of time that a TnI can reach its actin site is proportional to the probability that the local position of CFC is at
Appendix C
The coupling between cross-bridge cycling and thin-filament regulation by calcium
Modulation of TnI–actin transitions by bound myosins
In the absence of Ca2+, most TnIs are bound to actin, but in the presence of Ca2+, calcium binds TnC in a concentration-dependent manner. For simplicity, we assume that has a fixed value, whereas the binding rate of TnI to actin is a weighted function of the rate of TnI binding to actin from the unweighted closed (or open) state rate, (Mijailovich et al., 2012). The transition probability of attachment of TnI to actin is where is a weight factor and the transition probability for the detachment of TnI from actin is simply The first Monte Carlo drawing is performed over all TnCs along all CFCs, where each actin filament has two CFC strands. If any change of TnI state is drawn, the TnI state is updated for calculation of the CFC configuration in the current time step.
Modulation of myosin–actin transitions by the CFC
The probabilities of changing state in the five-state (and six-state) cross-bridge model are constructed so that each state can transition to two or three neighboring states. The transition from the detached state M.D.Pi, associated with axial strain-dependent rates, includes attachment probability, adjusted for binding to multiple binding sites on actin. For the cross-bridges in the detached state, the attachment probability is shared between all reachable actin states defined as where and Because is the sum of the probabilities of attaching myosin heads to each of reachable sites to the equivalent axial strain–dependent binding rate is set to provide the same flux as the probabilistic binding rate The scaling factor, decreases the magnitude of at each by an average number of reachable binding sites to myosin heads (Mijailovich et al., 2016). The weight factors and are associated with the azimuthal position of actin filaments in the sarcomere lattice relative to the myosin head, angle and azimuthal angle of actin site (see Fig. S1 and Mijailovich et al., 2016). The weight factors are proportional to the fraction of time step when these transitions are possible (i.e., to the weighted probabilities that the CFC is at positions that modulates weak myosin binding, denoted as subscript (Mijailovich et al., 2012).
The transitions from the weakly to the strongly attached states (2 and 3) are defined by the probabilities for the prestroke state 2 (A·M·D·Pi) and for the poststroke state 3 (A·M·D). Calculation of these probabilities is almost identical to that reported by Mijailovich et al. (2016), except that includes the weight factor that modulates weak to strong myosin binding, denoted as subscript The factor is proportional to the fraction of time step when the isomerization is possible (i.e., Mijailovich et al., 2012).
Appendix D
Model parameters
Sarcomere geometry
The 3-D sarcomere lattice in vertebrate striated muscle is composed of myosin filaments, each surrounded with six actin filaments and each actin filament with three myosin filaments. Each half-length myosin filament is associated with six titin molecules (Mijailovich et al., 2019). Actin filaments can vary in length, depending on species, muscle type, and presence or absence of nebulin in skeletal muscle. The actin filaments have a monomer spacing of 2.7359 nm, and the half period of one strand is 35.56 nm under relaxed conditions (Huxley et al., 1994; Wakabayashi et al., 1994; Prodanovic et al., 2016). The length of a myosin filament is ∼1.58 µm, having 50 crowns (i.e., 150 myosin molecules per half-thick filament), with a crown spacing of 14.3 nm (Luther et al., 2008). This number of crowns and amount of spacing provides maximum overlap with a thin filament of ∼0.7 µm. The actin radius is and the myosin radius is (Mijailovich et al., 2016). The lattice interfilament spacing depends on SL, the specificities of the muscle type, and experimental conditions. The values of the spacing d10 are specified for each set of simulations.
Interfilament lattice spacing
The interfilament spacings in intact trabeculae are much smaller than in demembranated trabeculae having values of ∼33.83 nm at SL 2.2 µm. All intact trabecula fixed-length simulations used this value. In contrast, the interfilament spacings of demembranated cardiac trabecula muscle were obtained at SL 2.25 µm, having values of ∼41.36 nm (Irving et al., 2000; Cazorla et al., 2001) and used in simulations of force–pCa relationships observed by Kreutziger et al. (2011). The interfilament spacing is an important factor in modulation of myosin binding to actin and possibly other rates in the cross-bridge cycle (Williams et al., 2013; Mijailovich et al., 2019).
Myofilament elasticity
Actin and myosin filaments are extensible with filament moduli (elastic modulus times cross-sectional area) derived from x-ray diffraction or direct measurement: for actin, for myosin, (Huxley et al., 1994; Kojima et al., 1994). We used the modulus, rather than stiffness, because the reported stiffness values depend on the filament length, and cross-sectional area is not well defined for myosin and actin filaments. The only nonlinear element included in calculations is titin, whose nonlinear elastic characteristics were described previously (Mijailovich et al., 2019). In filaments, the deformation in contracting muscle is small: <1% (Huxley et al., 1994; Wakabayashi et al., 1994; Ma et al., 2018b). The elasticity of cross-bridges originates from multiple sources and can be nonlinear (Kaya and Higuchi, 2010) but, for simplicity, here we used a linear elastic model, as is usually done in sliding filament models.
Cross-bridge model parameters
To achieve the observed rate of twitch relaxation, we used a six-state cycle that includes a PS (Fig. 2, A and B). Following the approach of Duke (Duke, 1999; Mijailovich et al., 2016; Mijailovich et al., 2019), the state transition rate constants are defined by specifically designed experiments, estimated from indirect observations, or deduced from multiple sources. The simulations used a large number of the same parameters, except a few, that can strongly vary with the experimental conditions. For clarity, we show the complete set of cross-bridge model parameters, where variable ones are taken from simulations of trabecula twitch experiments at 27.5°C (see Table 1). When different parameter values are used for simulations of the experiments performed under different conditions, such as at what temperature, SL, and interfilament lattice spacings and whether the muscle is demembranated or intact, they are shown in the main text or in figure legends.
The cross-bridge cycle parameters for myosin binding to and detachment from actin (Eq. A2) are and for the power stroke, the equilibrium constant (Eq. A3) is defined by the power stroke for ADP release, and the second power stroke Because of the exponential forms in the expressions for the state transition rates, Eq. A3 and Eq. A5 can become very large and can generate numerical problems; they are capped to and When the cap value is reached, the reverse rates are changed to decay exponentially to satisfy the equilibrium constant, The remaining rates of the six-state cycle (Fig. 2) are defined as follows: ATP-binding and myosin detach rate, hydrolysis forward rate and backward rate the transition rate to PS and the calcium-dependent transition rate from PS (Eq. 1), where baseline rate is the rate at high [Ca2+] Hill coefficient of the rate sigmoidal [Ca2+] rise and calcium concentration, when is equal to is In all simulations, cross-bridge stiffness is taken to be and the value for at 27.5°C or calculated at the temperature of the experiment.
CFC model parameters
For calcium-binding kinetics to TnC and interaction of TnI with actin (Fig. 2 C), the equilibrium rate constant of calcium binding to TnC along TnC closed states, is effectively defined via forward constant where and calcium-independent dissociation constant TnI–actin interaction equilibrium rate constant and TnI attachment rate and cooperativity coefficient
For the CFC model, we used the same parameters reported previously (Mijailovich et al., 2012): a Tpm pinning angle, myosin-imposed Tpm angular displacement, the persistence length of Tpm–Tn confined chain and angular SD (Pirani et al., 2005). The strength of the chain confining potential is weaker than used for skeletal muscle (Mijailovich et al., 2012), having a value for of 0.149 pN.
Calcium transients: measurements, conversions, and derivations when they are not available
Used in twitch simulations are [Ca2+] transients reported by Janssen et al. (2002) (shown in Fig. 6) or converted from 340-nm/380-nm fluorescence ratio data reported by Janssen and de Tombe, 1997 using the calibration equation (Backx and Ter Keurs, 1993; Gao et al., 1994; Backx et al., 1995), where and (Fig. 5 A and Fig. S4), or deduced from these measurements when calcium transients are not reported (Figs. 3 and 5 B). In the latter case, we adapted the Janssen et al. (2002) Ca2+ transient recorded at 27.5°C in the fixed-length trabecula to the Caremani et al. (2016) experiment at similar temperature (27.2°C) by reducing the peak concentration from 1.51 to 1.20 µM to match lower observed maximum twitch tension (lower by 27.3%) in the Caremani et al. (2016) experiment.
Because the calcium transients typically achieve a higher peak [Ca2+] in fixed-length muscles than in isometric sarcomere twitches (Janssen and de Tombe, 1997), we rescaled the adapted calcium transient for the Caremani et al. fixed-length trabecula experiment (from the peak of 1.2 µM to the isometric half-sarcomere using the ratio of the peaks of [Ca2+] recorded by Janssen and de Tombe at 22°C).
Appendix E
Conversion between observed tension and isometric force per myosin filament
Due to the stochastic process of myosin interacting with actin, the forces in the myofilaments fluctuate in time and each filament experiences somewhat different force. For comparison with observed isometric tensions, we include in all plots both the tension in kilopascals and the average force per myosin filament, in piconewtons. The scales are related by a factor that takes into account how many myosin filaments there are per unit of the fiber cross-sectional area (Linari et al., 1998; Mijailovich et al., 2016). Because the total number of thick filaments in a myofibril or muscle fiber does not change with experimental conditions, for the estimation of the number of thick filaments per unit of cross-sectional area, we used the lattice spacing, d1,0, at slack length (i.e., at the same length where the muscle cross-sectional area used in the tension calculations is measured).
The lattice spacing in demembranated rat cardiac trabeculae cells at slack SL (1.9 µm) is d1.0 = 43.5 nm (Irving et al., 2000) and the number of thick filaments per μm2 myofibril is ∼458. Taking into account the fraction of the cross-sectional area in cardiac cells occupied by myofibrils as 68% (Cazorla et al., 2000), this reduces the number of myosin filaments over the muscle cell cross-section to ∼311 per μm2. In this case, the scaling factor provides that corresponds to per myosin filament or 64.25 pN per actin filament.
In intact trabeculae, the lattice spacing is smaller and at 2.2 µm, where the cross-sectional area was measured, is d1,0 = 33.83 nm (Irving et al., 2000), and the number of thick filaments per μm2 myofibril is ∼757. Taking into account the fraction of the cross-sectional area in rat trabeculae occupied by myofibrils to be ∼61%, as observed in previous studies (Schaper et al., 1985; Barth et al., 1992), reduces the number of myosin filaments over the trabecula cross-section to ∼462 per μm2. In this case, the scaling factor provides that kPa corresponds to pN per myosin filament or 43.35 pN per actin filament.
Supplementary Material
is a ZIP package that contains all supplemental figures.
Acknowledgments
Henk L. Granzier served as editor.
We gratefully acknowledge the help of Prof. Thomas C. Irving with editing of the final version of the manuscript.
This project is supported by National Institutes of Health grants R01 HL128368 and RM1 GM131981 (to M. Regnier) and by the European Union’s Horizon 2020 research and innovation program under grant agreement 777204 (to S.M. Mijailovich, M. Regnier, M.A. Geeves, and C. Poggesi). This article reflects only the authors’ view. The European Commission is not responsible for any use that may be made of the information the article contains.
The authors declare no competing financial interests.
Author contributions: S.M. Mijailovich conceptualized the study, introduced new additions into MUSICO platform, including formulation of thin filaments calcium regulation, implementation of updated cross-bridge cycle, series elastic element in the model of trabecula contraction, new structural elements and changes in sarcomere geometry, designed numerical procedures, analyzed the data from simulations, wrote the first draft of the manuscript, and supervised each step of the work. M. Prodanovic assisted in designing numerical procedures and monitored implementation of changes computer code, performed all simulations and data analyses, contributed in graphical design, and assisted in the writing of the manuscript. C. Poggesi provided interpretation of experimental data and contributed in the comparative analysis of simulations and experimental data. M.A. Geeves contributed to development of the model of cross-bridge cycle and thin filament regulation, to formulating the key points in the Discussion, and in writing the final draft of the manuscript. M. Regnier contributed by providing experimental data, formulating the elucidating important points in the Discussion, and assisted in writing the final draft of the manuscript.
References
- Ait-Mou, Y., Hsu K., Farman G.P., Kumar M., Greaser M.L., Irving T.C., and de Tombe P.P.. 2016. Titin strain contributes to the Frank-Starling law of the heart by structural rearrangements of both thin- and thick-filament proteins. Proc. Natl. Acad. Sci. USA. 113:2306–2311. 10.1073/pnas.1516732113 [DOI] [PMC free article] [PubMed] [Google Scholar]
- Anderson, R.L., Trivedi D.V., Sarkar S.S., Henze M., Ma W., Gong H., Rogers C.S., Gorham J.M., Wong F.L., Morck M.M., et al. 2018. Deciphering the super relaxed state of human β-cardiac myosin and the mode of action of mavacamten from myosin molecules to muscle fibers. Proc. Natl. Acad. Sci. USA. 115:E8143–E8152. 10.1073/pnas.1809540115 [DOI] [PMC free article] [PubMed] [Google Scholar]
- Backx, P.H., and Ter Keurs H.E.. 1993. Fluorescent properties of rat cardiac trabeculae microinjected with fura-2 salt. Am. J. Physiol. 264:H1098–H1110. [DOI] [PubMed] [Google Scholar]
- Backx, P.H., Gao W.D., Azan-Backx M.D., and Marban E.. 1995. The relationship between contractile force and intracellular [Ca2+] in intact rat cardiac trabeculae. J. Gen. Physiol. 105:1–19. 10.1085/jgp.105.1.1 [DOI] [PMC free article] [PubMed] [Google Scholar]
- Barth, E., Stämmler G., Speiser B., and Schaper J.. 1992. Ultrastructural quantitation of mitochondria and myofilaments in cardiac muscle from 10 different animal species including man. J. Mol. Cell. Cardiol. 24:669–681. 10.1016/0022-2828(92)93381-S [DOI] [PubMed] [Google Scholar]
- Bathe, K.J. 1996. Finite Element Procedures. Prentice-Hall, Englewood Cliffs, NJ. [Google Scholar]
- Bathe, K.J., and Mijailovich S.M.. 1988. Finite element analysis of frictional contact problems. J. Mec. Appl. 7:31–47. [Google Scholar]
- Brunello, E., Fusi L., Reconditi M., Linari M., Bianco P., Panine P., Narayanan T., Piazzesi G., Lombardi V., and Irving M.. 2009. Structural changes in myosin motors and filaments during relaxation of skeletal muscle. J. Physiol. 587:4509–4521. 10.1113/jphysiol.2009.176222 [DOI] [PMC free article] [PubMed] [Google Scholar]
- Brunello, E., Fusi L., Ghisleni A., Park-Holohan S.J., Ovejero J.G., Narayanan T., and Irving M.. 2020. Myosin filament-based regulation of the dynamics of contraction in heart muscle. Proc. Natl. Acad. Sci. USA. 117:8177–8186. 10.1073/pnas.1920632117 [DOI] [PMC free article] [PubMed] [Google Scholar]
- Campbell, K.B., Razumova M.V., Kirkpatrick R.D., and Slinker B.K.. 2001. Myofilament kinetics in isometric twitch dynamics. Ann. Biomed. Eng. 29:384–405. 10.1114/1.1366669 [DOI] [PubMed] [Google Scholar]
- Campbell, K.S., Janssen P.M.L., and Campbell S.G.. 2018. Force-dependent recruitment from the myosin off state contributes to length-dependent activation. Biophys. J. 115:543–553. 10.1016/j.bpj.2018.07.006 [DOI] [PMC free article] [PubMed] [Google Scholar]
- Caremani, M., Pinzauti F., Reconditi M., Piazzesi G., Stienen G.J., Lombardi V., and Linari M.. 2016. Size and speed of the working stroke of cardiac myosin in situ. Proc. Natl. Acad. Sci. USA. 113:3675–3680. 10.1073/pnas.1525057113 [DOI] [PMC free article] [PubMed] [Google Scholar]
- Caremani, M., Pinzauti F., Powers J.D., Governali S., Narayanan T., Stienen G.J.M., Reconditi M., Linari M., Lombardi V., and Piazzesi G.. 2019. Inotropic interventions do not change the resting state of myosin motors during cardiac diastole. J. Gen. Physiol. 151:53–65. 10.1085/jgp.201812196 [DOI] [PMC free article] [PubMed] [Google Scholar]
- Cazorla, O., Freiburg A., Helmes M., Centner T., McNabb M., Wu Y., Trombitás K., Labeit S., and Granzier H.. 2000. Differential expression of cardiac titin isoforms and modulation of cellular stiffness. Circ. Res. 86:59–67. 10.1161/01.RES.86.1.59 [DOI] [PubMed] [Google Scholar]
- Cazorla, O., Wu Y., Irving T.C., and Granzier H.. 2001. Titin-based modulation of calcium sensitivity of active tension in mouse skinned cardiac myocytes. Circ. Res. 88:1028–1035. 10.1161/hh1001.090876 [DOI] [PubMed] [Google Scholar]
- Chan, W.L., Silberstein J., and Hai C.M.. 2000. Mechanical strain memory in airway smooth muscle. Am. J. Physiol. Cell Physiol. 278:C895–C904. 10.1152/ajpcell.2000.278.5.C895 [DOI] [PubMed] [Google Scholar]
- Chase, P.B., Macpherson J.M., and Daniel T.L.. 2004. A spatially explicit nanomechanical model of the half-sarcomere: myofilament compliance affects Ca(2+)-activation. Ann. Biomed. Eng. 32:1559–1568. 10.1114/B:ABME.0000049039.89173.08 [DOI] [PubMed] [Google Scholar]
- Chung, C.S., Hoopes C.W., and Campbell K.S.. 2017. Myocardial relaxation is accelerated by fast stretch, not reduced afterload. J. Mol. Cell. Cardiol. 103:65–73. 10.1016/j.yjmcc.2017.01.004 [DOI] [PMC free article] [PubMed] [Google Scholar]
- Daniel, T.L., Trimble A.C., and Chase P.B.. 1998. Compliant realignment of binding sites in muscle: transient behavior and mechanical tuning. Biophys. J. 74:1611–1621. 10.1016/S0006-3495(98)77875-0 [DOI] [PMC free article] [PubMed] [Google Scholar]
- Deacon, J.C., Bloemink M.J., Rezavandi H., Geeves M.A., and Leinwand L.A.. 2012a. Erratum to: Identification of functional differences between recombinant human α and β cardiac myosin motors. Cell. Mol. Life Sci. 69:4239–4255. 10.1007/s00018-012-1111-5 [DOI] [PMC free article] [PubMed] [Google Scholar]
- Deacon, J.C., Bloemink M.J., Rezavandi H., Geeves M.A., and Leinwand L.A.. 2012b. Identification of functional differences between recombinant human α and β cardiac myosin motors. Cell. Mol. Life Sci. 69:2261–2277. 10.1007/s00018-012-0927-3 [DOI] [PMC free article] [PubMed] [Google Scholar]
- Dobesh, D.P., Konhilas J.P., and de Tombe P.P.. 2002. Cooperative activation in cardiac muscle: impact of sarcomere length. Am J Physiol Heart Circ Physiol. 282:H1055-1062. [DOI] [PubMed] [Google Scholar]
- Duke, T.A. 1999. Molecular model of muscle contraction. Proc. Natl. Acad. Sci. USA. 96:2770–2775. 10.1073/pnas.96.6.2770 [DOI] [PMC free article] [PubMed] [Google Scholar]
- Eyring, H. 1935. The activated complex in chemical reactions. J. Chem. Phys. 3:107–115. 10.1063/1.1749604 [DOI] [Google Scholar]
- Fenn, W.O. 1924. The relation between the work performed and the energy liberated in muscular contraction. J. Physiol. 58:373–395. 10.1113/jphysiol.1924.sp002141 [DOI] [PMC free article] [PubMed] [Google Scholar]
- Ferrantini, C., Coppini R., Sacconi L., Tosi B., Zhang M.L., Wang G.L., de Vries E., Hoppenbrouwers E., Pavone F., Cerbai E., et al. 2014. Impact of detubulation on force and kinetics of cardiac muscle contraction. J. Gen. Physiol. 143:783–797. 10.1085/jgp.201311125 [DOI] [PMC free article] [PubMed] [Google Scholar]
- Feynman, R.P., and Hibbs A.R.. 1965. Quantum Mechanics and Path Integrals. McGraw-Hill, New York. [Google Scholar]
- Gao, W.D., Backx P.H., Azan-Backx M., and Marban E.. 1994. Myofilament Ca2+ sensitivity in intact versus skinned rat ventricular muscle. Circ. Res. 74:408–415. 10.1161/01.RES.74.3.408 [DOI] [PubMed] [Google Scholar]
- Gao, W.D., Perez N.G., and Marban E.. 1998. Calcium cycling and contractile activation in intact mouse cardiac muscle. J. Physiol. 507:175–184. 10.1111/j.1469-7793.1998.175bu.x [DOI] [PMC free article] [PubMed] [Google Scholar]
- Geeves, M., Griffiths H., Mijailovich S., and Smith D.. 2011. Cooperative [Ca2+]-dependent regulation of the rate of myosin binding to actin: solution data and the tropomyosin chain model. Biophys. J. 100:2679–2687. 10.1016/j.bpj.2011.04.020 [DOI] [PMC free article] [PubMed] [Google Scholar]
- Glasstone, S., Laidler J., and Eyring K.. 1941. The Theory of Rate Processes. McGraw Hill, New York. [Google Scholar]
- Gordon, A.M., Homsher E., and Regnier M.. 2000. Regulation of contraction in striated muscle. Physiol. Rev. 80:853–924. 10.1152/physrev.2000.80.2.853 [DOI] [PubMed] [Google Scholar]
- Higuchi, H., Yanagida T., and Goldman Y.E.. 1995. Compliance of thin filaments in skinned fibers of rabbit skeletal muscle. Biophys. J. 69:1000–1010. 10.1016/S0006-3495(95)79975-1 [DOI] [PMC free article] [PubMed] [Google Scholar]
- Hill, T.L. 1974. Theoretical formalism for the sliding filament model of contraction of striated muscle. Part I. Prog. Biophys. Mol. Biol. 28:267–340. 10.1016/0079-6107(74)90020-0 [DOI] [PubMed] [Google Scholar]
- Hooijman, P., Stewart M.A., and Cooke R.. 2011. A new state of cardiac myosin with very slow ATP turnover: a potential cardioprotective mechanism in the heart. Biophys. J. 100:1969–1976. 10.1016/j.bpj.2011.02.061 [DOI] [PMC free article] [PubMed] [Google Scholar]
- Hunt, A.J., Gittes F., and Howard J.. 1994. The force exerted by a single kinesin molecule against a viscous load. Biophys. J. 67:766–781. 10.1016/S0006-3495(94)80537-5 [DOI] [PMC free article] [PubMed] [Google Scholar]
- Huxley, H.E., Stewart A., Sosa H., and Irving T.. 1994. X-ray diffraction measurements of the extensibility of actin and myosin filaments in contracting muscle. Biophys. J. 67:2411–2421. 10.1016/S0006-3495(94)80728-3 [DOI] [PMC free article] [PubMed] [Google Scholar]
- Irving, M. 2017. Regulation of contraction by the thick filaments in skeletal muscle. Biophys. J. 113:2579–2594. 10.1016/j.bpj.2017.09.037 [DOI] [PMC free article] [PubMed] [Google Scholar]
- Irving, T.C., and Maughan D.W.. 2000. In vivo x-ray diffraction of indirect flight muscle from Drosophila melanogaster. Biophys. J. 78:2511–2515. 10.1016/S0006-3495(00)76796-8 [DOI] [PMC free article] [PubMed] [Google Scholar]
- Irving, T.C., Konhilas J., Perry D., Fischetti R., and de Tombe P.P.. 2000. Myofilament lattice spacing as a function of sarcomere length in isolated rat myocardium. Am. J. Physiol. Heart Circ. Physiol. 279:H2568–H2573. 10.1152/ajpheart.2000.279.5.H2568 [DOI] [PubMed] [Google Scholar]
- Janssen, P.M., and de Tombe P.P.. 1997. Uncontrolled sarcomere shortening increases intracellular Ca2+ transient in rat cardiac trabeculae. Am. J. Physiol. 272:H1892-1897. 10.1152/ajpheart.1997.272.4.H1892 [DOI] [PubMed] [Google Scholar]
- Janssen, P.M., Stull L.B., and Marbán E.. 2002. Myofilament properties comprise the rate-limiting step for cardiac relaxation at body temperature in the rat. Am. J. Physiol. Heart Circ. Physiol. 282:H499–H507. 10.1152/ajpheart.00595.2001 [DOI] [PubMed] [Google Scholar]
- Kampourakis, T., Sun Y.B., and Irving M.. 2016. Myosin light chain phosphorylation enhances contraction of heart muscle via structural changes in both thick and thin filaments. Proc. Natl. Acad. Sci. USA. 113:E3039–E3047. 10.1073/pnas.1602776113 [DOI] [PMC free article] [PubMed] [Google Scholar]
- Kataoka, A., Hemmer C., and Chase P.B.. 2007. Computational simulation of hypertrophic cardiomyopathy mutations in troponin I: influence of increased myofilament calcium sensitivity on isometric force, ATPase and [Ca2+]i. J. Biomech. 40:2044–2052. 10.1016/j.jbiomech.2006.09.026 [DOI] [PubMed] [Google Scholar]
- Kaya, M., and Higuchi H.. 2010. Nonlinear elasticity and an 8-nm working stroke of single myosin molecules in myofilaments. Science. 329:686–689. 10.1126/science.1191484 [DOI] [PubMed] [Google Scholar]
- Kojima, H., Ishijima A., and Yanagida T.. 1994. Direct measurement of stiffness of single actin filaments with and without tropomyosin by in vitro nanomanipulation. Proc. Natl. Acad. Sci. USA. 91:12962–12966. 10.1073/pnas.91.26.12962 [DOI] [PMC free article] [PubMed] [Google Scholar]
- Kramers, H.A. 1940. Brownian motion in a field of force and the diffusion model of chemical reactions. Physica. 7:284–304. 10.1016/S0031-8914(40)90098-2 [DOI] [Google Scholar]
- Kreutziger, K.L., Piroddi N., McMichael J.T., Tesi C., Poggesi C., and Regnier M.. 2011. Calcium binding kinetics of troponin C strongly modulate cooperative activation and tension kinetics in cardiac muscle. J. Mol. Cell. Cardiol. 50:165–174. 10.1016/j.yjmcc.2010.10.025 [DOI] [PMC free article] [PubMed] [Google Scholar]
- Land, S., Park-Holohan S.J., Smith N.P., Dos Remedios C.G., Kentish J.C., and Niederer S.A.. 2017. A model of cardiac contraction based on novel measurements of tension development in human cardiomyocytes. J. Mol. Cell. Cardiol. 106:68–83. 10.1016/j.yjmcc.2017.03.008 [DOI] [PubMed] [Google Scholar]
- Lehman, W., Hatch V., Korman V., Rosol M., Thomas L., Maytum R., Geeves M.A., Van Eyk J.E., Tobacman L.S., and Craig R.. 2000. Tropomyosin and actin isoforms modulate the localization of tropomyosin strands on actin filaments. J. Mol. Biol. 302:593–606. 10.1006/jmbi.2000.4080 [DOI] [PubMed] [Google Scholar]
- Linari, M., Dobbie I., Reconditi M., Koubassova N., Irving M., Piazzesi G., and Lombardi V.. 1998. The stiffness of skeletal muscle in isometric contraction and rigor: the fraction of myosin heads bound to actin. Biophys. J. 74:2459–2473. 10.1016/S0006-3495(98)77954-8 [DOI] [PMC free article] [PubMed] [Google Scholar]
- Linari, M., Brunello E., Reconditi M., Fusi L., Caremani M., Narayanan T., Piazzesi G., Lombardi V., and Irving M.. 2015. Force generation by skeletal muscle is controlled by mechanosensing in myosin filaments. Nature. 528:276–279. 10.1038/nature15727 [DOI] [PubMed] [Google Scholar]
- Lorenz, M., Popp D., and Holmes K.C.. 1993. Refinement of the F-actin model against X-ray fiber diffraction data by the use of a directed mutation algorithm. J. Mol. Biol. 234:826–836. 10.1006/jmbi.1993.1628 [DOI] [PubMed] [Google Scholar]
- Luther, P.K., Bennett P.M., Knupp C., Craig R., Padrón R., Harris S.P., Patel J., and Moss R.L.. 2008. Understanding the organisation and role of myosin binding protein C in normal striated muscle by comparison with MyBP-C knockout cardiac muscle. J. Mol. Biol. 384:60–72. 10.1016/j.jmb.2008.09.013 [DOI] [PMC free article] [PubMed] [Google Scholar]
- Ma, W., Gong H., and Irving T.. 2018a. Myosin head configurations in resting and contracting murine skeletal muscle. Int. J. Mol. Sci. 19:2643. 10.3390/ijms19092643 [DOI] [PMC free article] [PubMed] [Google Scholar]
- Ma, W., Gong H., Kiss B., Lee E.J., Granzier H., and Irving T.. 2018b. Thick-filament extensibility in intact skeletal muscle. Biophys. J. 115:1580–1588. 10.1016/j.bpj.2018.08.038 [DOI] [PMC free article] [PubMed] [Google Scholar]
- Martyn, D.A., Adhikari B.B., Regnier M., Gu J., Xu S., and Yu L.C.. 2004. Response of equatorial x-ray reflections and stiffness to altered sarcomere length and myofilament lattice spacing in relaxed skinned cardiac muscle. Biophys. J. 86:1002–1011. 10.1016/S0006-3495(04)74175-2 [DOI] [PMC free article] [PubMed] [Google Scholar]
- McKay, R.T., Saltibus L.F., Li M.X., and Sykes B.D.. 2000. Energetics of the induced structural change in a Ca2+ regulatory protein: Ca2+ and troponin I peptide binding to the E41A mutant of the N-domain of skeletal troponin C. Biochemistry. 39:12731–12738. 10.1021/bi001240u [DOI] [PubMed] [Google Scholar]
- McKillop, D.F., and Geeves M.A.. 1993. Regulation of the interaction between actin and myosin subfragment 1: evidence for three states of the thin filament. Biophys. J. 65:693–701. 10.1016/S0006-3495(93)81110-X [DOI] [PMC free article] [PubMed] [Google Scholar]
- McNamara, J.W., Li A., Dos Remedios C.G., and Cooke R.. 2015. The role of super-relaxed myosin in skeletal and cardiac muscle. Biophys. Rev. 7:5–14. 10.1007/s12551-014-0151-5 [DOI] [PMC free article] [PubMed] [Google Scholar]
- McNamara, J.W., Li A., Smith N.J., Lal S., Graham R.M., Kooiker K.B., van Dijk S.J., Remedios C.G.D., Harris S.P., and Cooke R.. 2016. Ablation of cardiac myosin binding protein-C disrupts the super-relaxed state of myosin in murine cardiomyocytes. J. Mol. Cell. Cardiol. 94:65–71. 10.1016/j.yjmcc.2016.03.009 [DOI] [PMC free article] [PubMed] [Google Scholar]
- Mijailovich, S.M., Stamenović D., and Fredberg J.J.. 1993. Toward a kinetic theory of connective tissue micromechanics. J Appl Physiol (1985). 74:665–681. 10.1152/jappl.1993.74.2.665 [DOI] [PubMed] [Google Scholar]
- Mijailovich, S.M., J.J. Fredberg, and J.P. Butler. 1996. On the theory of muscle contraction: filament extensibility and the development of isometric force and stiffness. Biophys. J. 71:1475–1484. [DOI] [PMC free article] [PubMed] [Google Scholar]
- Mijailovich, S.M., Li X., del Alamo J.C., Griffiths R.H., Kecman V., and Geeves M.A.. 2010. Resolution and uniqueness of estimated parameters of a model of thin filament regulation in solution. Comput. Biol. Chem. 34:19–33. 10.1016/j.compbiolchem.2009.11.002 [DOI] [PMC free article] [PubMed] [Google Scholar]
- Mijailovich, S.M., Kayser-Herold O., Li X., Griffiths H., and Geeves M.A.. 2012. Cooperative regulation of myosin-S1 binding to actin filaments by a continuous flexible Tm-Tn chain. Eur. Biophys. J. 41:1015–1032. 10.1007/s00249-012-0859-8 [DOI] [PMC free article] [PubMed] [Google Scholar]
- Mijailovich, S.M., Kayser-Herold O., Stojanovic B., Nedic D., Irving T.C., and Geeves M.A.. 2016. Three-dimensional stochastic model of actin-myosin binding in the sarcomere lattice. J. Gen. Physiol. 148:459–488. 10.1085/jgp.201611608 [DOI] [PMC free article] [PubMed] [Google Scholar]
- Mijailovich, S.M., Nedic D., Svicevic M., Stojanovic B., Walklate J., Ujfalusi Z., and Geeves M.A.. 2017. Modeling the actin.myosin ATPase cross-bridge cycle for skeletal and cardiac muscle myosin isoforms. Biophys. J. 112:984–996. 10.1016/j.bpj.2017.01.021 [DOI] [PMC free article] [PubMed] [Google Scholar]
- Mijailovich, S.M., Stojanovic B., Nedic D., Svicevic M., Geeves M.A., Irving T.C., and Granzier H.L.. 2019. Nebulin and titin modulate cross-bridge cycling and length-dependent calcium sensitivity. J. Gen. Physiol. 151:680–704. 10.1085/jgp.201812165 [DOI] [PMC free article] [PubMed] [Google Scholar]
- Millman, B.M. 1998. The filament lattice of striated muscle. Physiol. Rev. 78:359–391. 10.1152/physrev.1998.78.2.359 [DOI] [PubMed] [Google Scholar]
- Nag, S., Trivedi D.V., Sarkar S.S., Adhikari A.S., Sunitha M.S., Sutton S., Ruppel K.M., and Spudich J.A.. 2017. The myosin mesa and the basis of hypercontractility caused by hypertrophic cardiomyopathy mutations. Nat. Struct. Mol. Biol. 24:525–533. 10.1038/nsmb.3408 [DOI] [PMC free article] [PubMed] [Google Scholar]
- Niederer, S.A., Hunter P.J., and Smith N.P.. 2006. A quantitative analysis of cardiac myocyte relaxation: a simulation study. Biophys. J. 90:1697–1722. 10.1529/biophysj.105.069534 [DOI] [PMC free article] [PubMed] [Google Scholar]
- Papoulis, A. 1991. Probability, Random Variables, and Stochastic Processes. McGraw-Hill, New York. [Google Scholar]
- Parmley, W.W., and Sonnenblick E.H.. 1967. Series elasticity in heart muscle. Its relation to contractile element velocity and proposed muscle models. Circ. Res. 20:112–123. 10.1161/01.RES.20.1.112 [DOI] [PubMed] [Google Scholar]
- Pirani, A., Xu C., Hatch V., Craig R., Tobacman L.S., and Lehman W.. 2005. Single particle analysis of relaxed and activated muscle thin filaments. J. Mol. Biol. 346:761–772. 10.1016/j.jmb.2004.12.013 [DOI] [PubMed] [Google Scholar]
- Poole, K.J., Lorenz M., Evans G., Rosenbaum G., Pirani A., Craig R., Tobacman L.S., Lehman W., and Holmes K.C.. 2006. A comparison of muscle thin filament models obtained from electron microscopy reconstructions and low-angle X-ray fibre diagrams from non-overlap muscle. J. Struct. Biol. 155:273–284. 10.1016/j.jsb.2006.02.020 [DOI] [PubMed] [Google Scholar]
- Prodanovic, M., Irving T.C., and Mijailovich S.M.. 2016. X-ray diffraction from nonuniformly stretched helical molecules. J. Appl. Cryst. 49:784–797. 10.1107/S1600576716003757 [DOI] [PMC free article] [PubMed] [Google Scholar]
- Prodanovic, M., Stojanovic B., Maric M., Prodanovic D., and Mijailovich S.M.. 2020. Tuning cooperativity of calcium activation in cardiac muscle. In Computational Bioengineering and Bioinformatics. ICCB 2019: Learning and Analytics in Intelligent Systems. Vol. 11. Tsihrintza G.A., Virvou M., and Jain L.C., editors. Springer, Cham. 27–42. 10.1007/978-3-030-43658-2_6 [DOI] [Google Scholar]
- Razumova, M.V., Bukatina A.E., and Campbell K.B.. 1999. Stiffness-distortion sarcomere model for muscle simulation. J Appl Physiol (1985). 87:1861–1876. 10.1152/jappl.1999.87.5.1861 [DOI] [PubMed] [Google Scholar]
- Razumova, M.V., Bukatina A.E., and Campbell K.B.. 2000. Different myofilament nearest-neighbor interactions have distinctive effects on contractile behavior. Biophys. J. 78:3120–3137. 10.1016/S0006-3495(00)76849-4 [DOI] [PMC free article] [PubMed] [Google Scholar]
- Reconditi, M., Caremani M., Pinzauti F., Powers J.D., Narayanan T., Stienen G.J., Linari M., Lombardi V., and Piazzesi G.. 2017. Myosin filament activation in the heart is tuned to the mechanical task. Proc. Natl. Acad. Sci. USA. 114:3240–3245. 10.1073/pnas.1619484114 [DOI] [PMC free article] [PubMed] [Google Scholar]
- Regazzoni, F., Dedè L., and Quarteroni A.. 2020. Biophysically detailed mathematical models of multiscale cardiac active mechanics. PLOS Comput. Biol. 16:e1008294. 10.1371/journal.pcbi.1008294 [DOI] [PMC free article] [PubMed] [Google Scholar]
- Rice, J.J., Wang F., Bers D.M., and de Tombe P.P.. 2008. Approximate model of cooperative activation and crossbridge cycling in cardiac muscle using ordinary differential equations. Biophys. J. 95:2368–2390. 10.1529/biophysj.107.119487 [DOI] [PMC free article] [PubMed] [Google Scholar]
- Robinson, T.F., and Winegrad S.. 1977. Variation of thin filament length in heart muscles. Nature. 267:74–75. 10.1038/267074a0 [DOI] [PubMed] [Google Scholar]
- Robinson, T.F., and Winegrad S.. 1979. The measurement and dynamic implications of thin filament lengths in heart muscle. J. Physiol. 286:607–619. 10.1113/jphysiol.1979.sp012640 [DOI] [PMC free article] [PubMed] [Google Scholar]
- Schaper, J., Meiser E., and Stämmler G.. 1985. Ultrastructural morphometric analysis of myocardium from dogs, rats, hamsters, mice, and from human hearts. Circ. Res. 56:377–391. 10.1161/01.RES.56.3.377 [DOI] [PubMed] [Google Scholar]
- Smith, D. 2001. Path integral theory of an axially-confined worm-like chain. J. Phys. Math. Gen. 34:4507–4523. 10.1088/0305-4470/34/21/307 [DOI] [Google Scholar]
- Smith, D.A., and Geeves M.A.. 2003. Cooperative regulation of myosin-actin interactions by a continuous flexible chain II: actin-tropomyosin-troponin and regulation by calcium. Biophys. J. 84:3168–3180. 10.1016/S0006-3495(03)70041-1 [DOI] [PMC free article] [PubMed] [Google Scholar]
- Smith, D.A., and Mijailovich S.M.. 2008. Toward a unified theory of muscle contraction. II: predictions with the mean-field approximation. Ann. Biomed. Eng. 36:1353–1371. 10.1007/s10439-008-9514-z [DOI] [PubMed] [Google Scholar]
- Smith, D.A., Maytum R., and Geeves M.A.. 2003. Cooperative regulation of myosin-actin interactions by a continuous flexible chain I: actin-tropomyosin systems. Biophys. J. 84:3155–3167. 10.1016/S0006-3495(03)70040-X [DOI] [PMC free article] [PubMed] [Google Scholar]
- Smith, D.A., Geeves M.A., Sleep J., and Mijailovich S.M.. 2008. Towards a unified theory of muscle contraction. I: foundations. Ann. Biomed. Eng. 36:1624–1640. 10.1007/s10439-008-9536-6 [DOI] [PubMed] [Google Scholar]
- Spudich, J.A. 2015. The myosin mesa and a possible unifying hypothesis for the molecular basis of human hypertrophic cardiomyopathy. Biochem. Soc. Trans. 43:64–72. 10.1042/BST20140324 [DOI] [PMC free article] [PubMed] [Google Scholar]
- Squire, J.M. 1992. Muscle filament lattices and stretch-activation: the match-mismatch model reassessed. J. Muscle Res. Cell Motil. 13:183–189. 10.1007/BF01874155 [DOI] [PubMed] [Google Scholar]
- Tanner, B.C., Daniel T.L., and Regnier M.. 2007. Sarcomere lattice geometry influences cooperative myosin binding in muscle. PLOS Comput. Biol. 3:e115. 10.1371/journal.pcbi.0030115 [DOI] [PMC free article] [PubMed] [Google Scholar]
- Tanner, B.C., Regnier M., and Daniel T.L.. 2008. A spatially explicit model of muscle contraction explains a relationship between activation phase, power and ATP utilization in insect flight. J. Exp. Biol. 211:180–186. 10.1242/jeb.013466 [DOI] [PMC free article] [PubMed] [Google Scholar]
- Tanner, B.C., Daniel T.L., and Regnier M.. 2012. Filament compliance influences cooperative activation of thin filaments and the dynamics of force production in skeletal muscle. PLOS Comput. Biol. 8:e1002506. 10.1371/journal.pcbi.1002506 [DOI] [PMC free article] [PubMed] [Google Scholar]
- Toepfer, C.N., Garfinkel A.C., Venturini G., Wakimoto H., Repetti G., Alamo L., Sharma A., Agarwal R., Ewoldt J.F., Cloonan P., et al. 2020. Myosin sequestration regulates sarcomere function, cardiomyocyte energetics, and metabolism, informing the pathogenesis of hypertrophic cardiomyopathy. Circulation. 141:828–842. 10.1161/CIRCULATIONAHA.119.042339 [DOI] [PMC free article] [PubMed] [Google Scholar]
- Ujfalusi, Z., Vera C.D., Mijailovich S.M., Svicevic M., Yu E.C., Kawana M., Ruppel K.M., Spudich J.A., Geeves M.A., and Leinwand L.A.. 2018. Dilated cardiomyopathy myosin mutants have reduced force-generating capacity. J. Biol. Chem. 293:9017–9029. 10.1074/jbc.RA118.001938 [DOI] [PMC free article] [PubMed] [Google Scholar]
- Vibert, P., Craig R., and Lehman W.. 1997. Steric-model for activation of muscle thin filaments. J. Mol. Biol. 266:8–14. 10.1006/jmbi.1996.0800 [DOI] [PubMed] [Google Scholar]
- Wakabayashi, K., Sugimoto Y., Tanaka H., Ueno Y., Takezawa Y., and Amemiya Y.. 1994. X-ray diffraction evidence for the extensibility of actin and myosin filaments during muscle contraction. Biophys. J. 67:2422–2435. 10.1016/S0006-3495(94)80729-5 [DOI] [PMC free article] [PubMed] [Google Scholar]
- Wang, D., Robertson I.M., Li M.X., McCully M.E., Crane M.L., Luo Z., Tu A.Y., Daggett V., Sykes B.D., and Regnier M.. 2012. Structural and functional consequences of the cardiac troponin C L48Q Ca(2+)-sensitizing mutation. Biochemistry. 51:4473–4487. 10.1021/bi3003007 [DOI] [PMC free article] [PubMed] [Google Scholar]
- Wang, D., McCully M.E., Luo Z., McMichael J., Tu A.Y., Daggett V., and Regnier M.. 2013. Structural and functional consequences of cardiac troponin C L57Q and I61Q Ca(2+)-desensitizing variants. Arch. Biochem. Biophys. 535:68–75. 10.1016/j.abb.2013.02.006 [DOI] [PMC free article] [PubMed] [Google Scholar]
- Washio, T., Okada J.I., Sugiura S., and Hisada T.. 2012. Approximation for cooperative interactions of a spatially-detailed cardiac sarcomere model. Cell. Mol. Bioeng. 5:113–126. 10.1007/s12195-011-0219-2 [DOI] [PMC free article] [PubMed] [Google Scholar]
- Williams, C.D., Salcedo M.K., Irving T.C., Regnier M., and Daniel T.L.. 2013. The length-tension curve in muscle depends on lattice spacing. Proc. Biol. Sci. 280:20130697. [DOI] [PMC free article] [PubMed] [Google Scholar]
- Wood, J., and Mann R.. 1981. A sliding-filament cross-bridge ensemble model of muscle contraction for mechanical transients. Math. Biosci. 57:211–263. 10.1016/0025-5564(81)90105-X [DOI] [Google Scholar]
- Yue, D.T., Marban E., and Wier W.G.. 1986. Relationship between force and intracellular [Ca2+] in tetanized mammalian heart muscle. J Gen Physiol. 87:223–242. [DOI] [PMC free article] [PubMed] [Google Scholar]
- Zoghbi, M.E., Woodhead J.L., Moss R.L., and Craig R.. 2008. Three-dimensional structure of vertebrate cardiac muscle myosin filaments. Proc. Natl. Acad. Sci. USA. 105:2386–2390. 10.1073/pnas.0708912105 [DOI] [PMC free article] [PubMed] [Google Scholar]
Associated Data
This section collects any data citations, data availability statements, or supplementary materials included in this article.
Supplementary Materials
is a ZIP package that contains all supplemental figures.


