

Abstract
We used 2 commercially available antibody tests to estimate seroprevalence of severe acute respiratory syndrome coronavirus 2 infection in Japan during June 2020. Of 7,950 samples, 8 were positive by both assays. Using 2 reliable antibody tests in conjunction is an effective method for estimating seroprevalence in low prevalence settings.
Keywords: seroprevalence, antibodies, SARS-CoV-2, COVID-19, diagnostics, immunology, antibody responses, respiratory infections, severe acute respiratory syndrome coronavirus 2, 2019 novel coronavirus disease, coronavirus disease, zoonoses, viruses, coronavirus, serology, Japan
During the first wave of the coronavirus disease (COVID-19) pandemic in Japan, a total of 16,884 persons tested positive for severe acute respiratory syndrome coronavirus 2 (SARS-CoV-2) by May 31, 2020, indicating a national cumulative incidence of 0.013% (1,2) (Appendix Figure). To establish a surveillance method in low prevalence settings, we assessed the seroprevalence of SARS-CoV-2 infection in Japan in early June 2020.
The Study
By October 2020, no standard antibody test or standardized method for estimating the seroprevalence of SARS-CoV-2 infection had been established. We used 2 serologic tests, a neutralizing antibody assay, and participant questionnaires to estimate the seroprevalence of SARS-CoV-2 infection in Japan.
We conducted a seroprevalence survey of SARS-CoV-2 infection in 3 prefectures of Japan during June 1–7, 2020. We selected 2 prefectures with a relatively high cumulative incidence of confirmed COVID-19 cases as of May 31, 2020: Tokyo, with an incidence of 0.039% (5,408 cases/13.9 million population) and Osaka, with an incidence of 0.020% (1,785 cases/8.8 million population). To better estimate the range of seroprevalence of SARS-CoV-2 infection in Japan, we also chose a prefecture with a relatively low cumulative incidence, Miyagi, with an incidence of 0.004% (88 cases/2.3 million population).
Each prefecture was responsible for using its civil registration data to randomly select participants. The Tokyo metropolitan government used random sampling stratified by age and sex in 3 cities with a cumulative incidence resembling the average of the Tokyo metropolitan area. The Miyagi prefectural government used its residence registry to conduct random sampling with stratification for age, sex, and geographic region. The Osaka prefecture used age-adjusted random sampling to select resident users of an existing smartphone application on general health (Figure).
Figure.
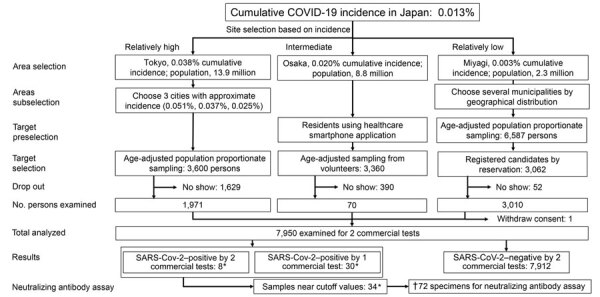
Flowchart of participants and results of SARS-CoV-2–specific antibody survey, Japan, 2020. Dagger (†) indicates sum of values marked with asterisks (*). SARS-CoV-2, severe acute respiratory syndrome coronavirus 2.
Eligible participants were persons >20 years of age living in Japan. The Tokyo and Miyagi prefectures excluded otherwise eligible participants with temperatures ≥37.5°C. All participants provided written informed consent. The study was approved by the internal review boards of the Research Institute of Tuberculosis (approval no. RIT/IRB 2020–04, 2020–05) and the National Institute of Infectious Diseases (approval no. 1140).
First, we asked participants to complete a questionnaire (Appendix Table 1). Trained healthcare workers collected blood samples from the participants. After centrifuging the samples, the workers collected serum and tested the samples with 2 commercially available antibody tests to detect the SARS-CoV-2 nucleocapsid antigen: a chemiluminescent microparticle immunoassay with published specificity results of 99.6%–99.9% at a cutoff index of 1.4 (SARS-CoV-2 IgG assay; Abbott, https://www.abbott.com) (3,4) and an electrochemiluminescence immunoassay for the qualitative detection of antibodies with 99.8% specificity and 100% (manufacturer determined) sensitivity (Elecsys Anti-SARS-CoV-2 immunoassay; F. Hoffmann-La Roche Ltd, https://www.roche.com) (5). Samples that were positive or borderline negative by >1 assay (reference range 1.20–1.39 for the Abbott test and 0.70–0.99 titer for the Roche test) were sent to Japan’s National Institute of Infectious Diseases (Tokyo) for a neutralizing antibody assay with VeroE6/TMPRSS2 cells (JCRB Cell Bank accession no. JCRB1819) (6). For the neutralizing antibody assay, we used an in vitro cytopathic effect assay, which is more accurate than serologic tests and therefore well-suited for confirmation of results; however, only a few laboratories in Japan have the resources to conduct the assay.
We compared the 2 groups using the χ2 test, considering values with p<0.05 to be significant. We compared ordinal scales by using the Mann-Whitney U test. We used Excel (Microsoft, https://www.microsoft.com) to conduct statistical analyses.
In total, 13,547 persons were invited to participate in the study; 7,950 (58.7%) accepted and gave informed consent. Of the participants, 3,660 (46.0%) were men and 4,290 (54.0%) were women. Persons 20–29 years of age (877 of 1,875 invitees) or 80–99 years of age (337 of 1,102 invitees) had the lowest response rate (Appendix Table 2). Participants from Osaka were more likely to have a history of fever within the past 4 months (2.7%) than participants from Tokyo (2.2%) and Miyagi (1.2%) (Appendix Table 1).
Of the 7,950 serum samples, 8 tested positive by both tests and 30 samples tested positive by only 1 test (15 by Abbott and 15 by Roche) (Table). All 8 specimens that were positive for both commercial tests also tested positive in the neutralizing antibody assay. No other specimens, including those that tested positive or borderline negative in 1 assay, tested positive by the neutralizing antibody assay.
Table. Serologic results of 2 antibody tests for severe acute respiratory syndrome coronavirus 2, Japan, June 2020*.
| Characteristic |
Both + |
Roche –, Abbott + |
Roche +, Abbott – |
Both – |
Subtotal |
% Patients positive
by both tests (95% CI) |
|
|---|---|---|---|---|---|---|---|
| Total |
8 |
15 |
15 |
7,912 |
7,950 |
0.10 (0.04–0.20) |
|
| Area | |||||||
| Tokyo | 2 | 2 | 4 | 1,963 | 1,971 | 0.10 (0.01–0.37) | |
| Osaka | 5 | 11 | 5 | 2,949 | 2,970 | 0.17 (0.05–0.39) | |
| Miyagi |
1 |
2 |
6 |
3,000 |
3,009 |
0.03 (0.00–0.19) |
|
| Sex | |||||||
| M | 3 | 7 | 5 | 3,643 | 3,658 | 0.08 (0.02–0.24) | |
| F |
5 |
8 |
10 |
4,269 |
4,292 |
0.12 (0.04–0.27) |
|
| Age, y | |||||||
| 20–29 | 3 | 0 | 0 | 875 | 878 | 0.34 (0.07–1.00) | |
| 30–39 | 3 | 2 | 1 | 1,210 | 1,216 | 0.25 (0.05–0.72) | |
| 40–49 | 0 | 3 | 7 | 1,589 | 1,599 | 0 (0.00–0.23) | |
| 50–59 | 0 | 2 | 4 | 1,457 | 1,463 | 0 (0.00–0.25) | |
| 60–69 | 1 | 4 | 0 | 1,315 | 1,320 | 0.08 (0.00–0.42) | |
| 70–79 | 1 | 4 | 1 | 1,128 | 1,134 | 0.09 (0.00–0.49) | |
|
>80 |
0 |
0 |
2 |
338 |
340 |
0 (0.00–1.08) |
|
| Job setting | |||||||
| Working as before | 4 | 4 | 3 | 3,091 | 3,102 | 0.13 (0.04–0.33) | |
| Working at home | 0 | 3 | 2 | 432 | 437 | 0 (0.00–0.84) | |
| Working as before and at home | 1 | 1 | 5 | 1,974 | 1,981 | 0.05 (0.00–0.28) | |
| Not working | 3 | 7 | 5 | 2,410 | 2,425 | 0.12 (0.03–0.36) | |
| No information |
0 |
0 |
0 |
5 |
5 |
0 (0.00–52.20) |
|
| Time spent outside the home, h | |||||||
| 0 | 1 | 4 | 1 | 1,153 | 1,159 | 0.09 (0.00–0.48) | |
| <2 | 1 | 5 | 6 | 2,871 | 2,883 | 0.03 (0.00–0.19) | |
| 2–4 | 3 | 5 | 5 | 1,182 | 1,195 | 0.25 (0.05–0.73) | |
| >4 | 3 | 1 | 3 | 2,704 | 2,711 | 0.11 (0.02–0.32) | |
| No information |
0 |
0 |
0 |
2 |
2 |
0 (0.00–84.20) |
|
| Fever at time of study | |||||||
| Yes | 0 | 0 | 0 | 16 | 16 | 0 (0.00–20.60) | |
| No | 8 | 15 | 15 | 7,886 | 7,924 | 0.10 (0.04–0.20) | |
| No information |
0 |
0 |
0 |
10 |
10 |
0 (0.00–30.90) |
|
| History of fever lasting >4 days in past 4 months | |||||||
| Yes | 4 | 1 | 1 | 155 | 161 | 2.48 (0.68–6.24) | |
| No | 4 | 14 | 14 | 7,756 | 7,788 | 0.05 (0.01–0.13) | |
| No information |
0 |
0 |
0 |
1 |
1 |
0 (0.00–97.50) |
|
| Previous PCR result | |||||||
| Positive | 1 | 0 | 0 | 0 | 1 | 100.00 (2.50–100.00) | |
| Negative | 0 | 0 | 0 | 33 | 33 | 0 (0.00–10.60) | |
| Not applicable |
7 | 15 | 15 | 7,879 | 7,916 | 0.09 (0.04–0.18) | |
*Roche, Elecsys Anti SARS-CoV-2 (F. Hoffmann-La Roche Ltd, https://www.roche.com); Abbott, ARCHITECT SARS-CoV-2 IgG assay (Abbott, https://www.abbott.com); +, positive; –, negative.
The proportion of participants with 2 positive test results was significantly higher among those with fever (2.5%) than those without fever (0.05%; p<0.01). The proportion of participants with 1 positive test result was not significantly different among those with fever (1.2%) and those without fever (0.36%; p = 0.25) (Appendix Table 1). These findings, validated by the neutralizing antibody assay, indicated that 2 positive test results accurately identified seropositive participants. The proportion of participants that tested positive by both tests was 0.1% in Tokyo, 0.17% in Osaka, and 0.03% in Miyagi. The ratios of seroprevalence to cumulative incidence were 2.6 in Tokyo, 8.3 in Osaka, and 8.7 in Miyagi. Seropositivity rates were highest among participants 20–39 years of age.
Conclusions
The US Centers for Disease Control and Prevention suggests using an orthogonal testing algorithm, which considers the results of 2 independent antibody tests, in settings with low SARS-CoV-2 prevalence (7). Some surveys in high SARS-CoV-2 prevalence areas such as Spain (8), China (9), and Geneva, Switzerland (10) have not adopted this approach. We believe an orthogonal testing algorithm, such as the one used in this study, would be particularly valuable in our low prevalence setting. The 8 specimens that tested positive by both commercial antibody assays were confirmed to have neutralizing activity against SARS-CoV-2 with a neutralizing antibody assay. These results support our use of the neutralizing assay to confirm the validity of the commercial tests. Any 2 commercial tests with high sensitivity and specificity would be appropriate to use in this orthogonal testing strategy.
Our prefecture-level seroprevalence:cumulative case detection ratios (2.6–8.7) resemble those of the United States, which are ≈10 (11), and are lower than those of Switzerland (≈20–50) (10). These results indicate that Japan has monitored the pandemic as accurately as have other countries.
This study has several limitations. First, participant selection in Osaka was based on a volunteer population (i.e., users of a particular smartphone application) rather than the general community. In addition, the prefectures of Tokyo and Miyagi excluded otherwise eligible participants with temperatures ≥37.5°C. As a result, Osaka had the highest proportion of participants with fevers at the time of the survey and the highest seroprevalence. These factors might have introduced participation bias, skewing the results. Another limitation is that Tokyo had the lowest participation of participants 20–29 years of age. Because seroprevalences were higher in younger age groups, this sampling distribution might have reduced the seropositivity rate and prevalence:cumulative incidence ratio found in Tokyo. Furthermore, this study did not include participants <20 years of age. Although patients <20 years of age make up <10% of COVID-19 cases (1), excluding these patients might lead to an overestimation of SARS-CoV-2 infection prevalence. Finally, antibodies against SARS-CoV-2 might disappear after 60 days (12); however, the elapsed time might not affect levels of nucleocapsid protein antibody (13). Further studies on antibody levels after disease onset and recovery are essential for monitoring the course of infections.
We estimate that SARS-CoV-2 seroprevalence ranged from 0.03%–0.17% in Japan in early June 2020. Public health officials in low prevalence areas should consider using 2 antibody tests in conjunction for accurate surveillance.
Further information on prevalence of severe acute respiratory syndrome coronavirus 2–specific antibodies, Japan, June 2020.
Acknowledgments
We thank the Tokyo, Osaka, and Miyagi prefecture governments, and Yukio Nakano and Shuji Ohgaki for conducting the survey. We also thank National Institute of Infectious Diseases’ COVID-19 Antibody Testing Working Group (Akira Ainai, Hitomi Kinoshita, Kaori Sano, Kazu Okuma, Kiyoko Nojima, Ken Maeda, Naoko Iwata-Yoshikawa, Noriyo Nagata, Saya Moriyama, Shuetsu Fukushi, Souichi Yamada, Taishi Onodera, Takayuki Matsumura, Yoshimasa Takahashi, and Yu Adachi) for the laboratory examination. We are grateful to Kazuya Takemura, Hiroe Kawahara, Etsuko Takizawa, Yu Nagakura, Shinya Ueno, Yasuko Okui, Wataru Yamashita, Mika Nakamae, and Masayuki Hino for their support of the survey. We also thank Shutoku Matsuyama for providing samples of SARS-CoV-2 strain 2019-nCoVJPN/TY/WK-521/2020.
The survey was funded by the Ministry of Health, Labor and Welfare of Japan.
Biography
Dr. Yoshiyama is a senior researcher at the Research Institute of Tuberculosis, Kiyose, Japan. His primary interests are epidemiology and the clinical aspects of tuberculosis and other respiratory diseases, including COVID-19.
Footnotes
Suggested citation for this article: Yoshiyama T, Saito Y, Masuda K, Nakanishi Y, Kido Y, Uchimura K, et al. Prevalence of SARS-CoV-2–specific antibodies, Japan, June 2020. Emerg Infect Dis. 2021 Feb [date cited]. https://doi.org/10.3201/eid2702.204088
References
- 1.Ohhamazaki T. Coronavirus COVID-19 Japan case by each prefecture. 2020. [cited 2020 Jun 5]. https://jagjapan.maps.arcgis.com/apps/opsdashboard/index.html#/641eba7fef234a47880e1e1dc4de85ce
- 2.Ministry of Internal Affairs and Communications. Population estimates. 2019. Oct 1 [cited 2020 Jun 5]. https://www.stat.go.jp/data/jinsui/2019np/index.html
- 3.Bryan A, Pepper G, Wener MH, Fink SL, Morishima C, Chaudhary A, et al. Performance characteristics of the Abbott Architect SARS-CoV-2 IgG assay and seroprevalence in Boise, Idaho. J Clin Microbiol. 2020;58:e00941–20. 10.1128/JCM.00941-20 [DOI] [PMC free article] [PubMed] [Google Scholar]
- 4.Abbott Core Laboratory. SARS-CoV-2 immunoassays. 2020. [cited 2020 Jun 17]. https://www.corelaboratory.abbott/us/en/offerings/segments/infectious-disease/sars-cov-2
- 5.F. Hoffman–La Roche Ltd. Elecsys® Anti-SARS-CoV-2. 2020. [cited 2020 Aug 19]. https://diagnostics.roche.com/no/en/products/params/elecsys-anti-sars-cov-2.html
- 6.Matsuyama S, Nao N, Shirato K, Kawase M, Saito S, Takayama I, et al. Enhanced isolation of SARS-CoV-2 by TMPRSS2-expressing cells. Proc Natl Acad Sci U S A. 2020;117:7001–3. 10.1073/pnas.2002589117 [DOI] [PMC free article] [PubMed] [Google Scholar]
- 7.US Centers for Disease Control and Prevention. Interim guidelines for COVID-19 antibody testing in clinical and public health settings. 2020. [cited 2020 Jul 20]. https://www.cdc.gov/coronavirus/2019-ncov/lab/resources/antibody-tests-guidelines.html
- 8.Pollán M, Pérez-Gómez B, Pastor-Barriuso R, Oteo J, Hernán MA, Pérez-Olmeda M, et al. ; ENE-COVID Study Group. Prevalence of SARS-CoV-2 in Spain (ENE-COVID): a nationwide, population-based seroepidemiological study. Lancet. 2020;396:535–44. 10.1016/S0140-6736(20)31483-5 [DOI] [PMC free article] [PubMed] [Google Scholar]
- 9.To KKW, Cheng VCC, Cai JP, Chan KH, Chen LL, Wong LH, et al. Seroprevalence of SARS-CoV-2 in Hong Kong and in residents evacuated from Hubei province, China: a multicohort study. Lancet Microbe. 2020;1:e111–8. 10.1016/S2666-5247(20)30053-7 [DOI] [PMC free article] [PubMed] [Google Scholar]
- 10.Stringhini S, Wisniak A, Piumatti G, Azman AS, Lauer SA, Baysson H, et al. Seroprevalence of anti-SARS-CoV-2 IgG antibodies in Geneva, Switzerland (SEROCoV-POP): a population-based study. Lancet. 2020;396:313–9. 10.1016/S0140-6736(20)31304-0 [DOI] [PMC free article] [PubMed] [Google Scholar]
- 11.Concepcion S. CDC: for every COVID-19 case reported ‘there are actually 10’ more. Talking Points Memo. 2020. Jun 25 [cited 2020 Jun 26]. https://talkingpointsmemo.com/news/cdc-covid-19-cases-10-times-higher-than-reported
- 12.Liu A, Wang W, Zhao X, Zhou X, Yang D, Lu M, et al. Disappearance of antibodies to SARS-CoV-2 in a -COVID-19 patient after recovery. Clin Microbiol Infect. 2020;26:1703–5; Epub ahead of print. 10.1016/j.cmi.2020.07.009 [DOI] [PMC free article] [PubMed] [Google Scholar]
- 13.Bruni M, Cecatiello V, Diaz-Basabe A, Lattanzi G, Mileti E, Monzani S, et al. Persistence of anti-SARS-CoV-2 antibodies in non-hospitalized COVID-19 convalescent health care workers. J Clin Med. 2020;9:3188. 10.3390/jcm9103188 [DOI] [PMC free article] [PubMed] [Google Scholar]
Associated Data
This section collects any data citations, data availability statements, or supplementary materials included in this article.
Supplementary Materials
Further information on prevalence of severe acute respiratory syndrome coronavirus 2–specific antibodies, Japan, June 2020.