Abstract
The duplication of DNA is a fundamental process that is required for the transfer of the genetic information from parent to daughter cells. Aberrant DNA replication processes are associated with diverse disease phenotypes, including developmental defects, ageing disorders, blood disorders such as Fanconi Anemia, increased inflammation and cancer. Therefore, the development of tools to study proteins associated with error-free DNA replication processes is of paramount importance. So far, methods to study proteins associated with nascent replication forks relied on conventional immunofluorescence and immunoprecipitation assays of 5′-ethylene-2′-deoxyuridine (EdU) labeled DNA (iPOND). While greatly informative and important, these methods lack specificities for nascent fork interactions (e.g., IF) or assay an average change of millions of cells without single-cell resolution (e.g., iPOND). The assay system described here combines proximity ligation assay (PLA) with EdU coupled click-iT chemistry, which we termed “in situ protein interaction with nascent DNA replication forks (SIRF)”. This method enables sensitive and quantitative analysis of protein interactions with nascent DNA replication forks with single-cell resolution, and can further be paired with conventional immunofluorescence marker analysis for added multi-parameter analysis.
Keywords: SIRF, DNA replication, Stalled replication forks, Genome instability, Proximity ligation assay, Fork protection, IPOND
Background
Defects in high fidelity DNA replication are associated with severe biological outcomes. These amongst others include developmental abnormalities, premature aging, hematological disorder and cancer (Loeb and Monnat, 2008; Magdalou et al., 2014 ). To avoid DNA replication instability, cells have evolved intricate mechanisms to ensure error-free propagation of its genetic material. There is an ever-growing list of disease-suppressing proteins that actively ensure DNA replication stability and function at all stages of DNA replication processes. A comprehensive understanding of the functions of DNA replication stability proteins is imperative to allow development of effective and specific agents targeting disease outcomes.
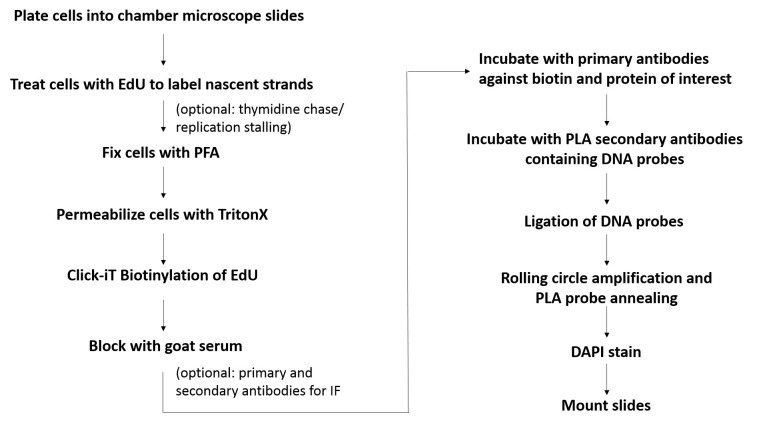
Historically, visualization of proteins localized at or near DNA replication forks was advanced by the advent of nucleoside analogs, such as 5-bromo-2’-deoxyuridine (BrdU) that is incorporated into newly replicating DNA and further detected with fluorescent-labeled antibodies ( Gonchoroff et al., 1986 ; Leif et al., 2004 ). Immunofluorescence (IF) assays examining co-localization of proteins with the BrdU-label indicates that the protein is present in close vicinity to actively replicating DNA ( Sengupta et al., 2003 ). This method provided critical information on replication processes. However, it is an indirect method that lacks the resolution that would be required to unequivocally distinguish protein-DNA interactions from proteins located near DNA. Another ground-breaking procedure was iPOND (standing for isolation of proteins on nascent DNA) that allows to detect and isolate proteins on newly replicated DNA ( Petermann et al., 2010 ; Sirbu et al., 2011 and 2013; Dungrawala et al., 2015 ). In this procedure, nascent DNA is labeled with the thymidine analog EdU, which is then biotinylated using click-IT chemistry (Moses and Moorhouse, 2007). The newly synthesized biotinylated DNA is immuno-precipitated with streptavidin-coated agarose or magnetic beads. This so isolates proteins that bind to newly replicated DNA, which either can be detected by Western blotting or by mass spectrometry. While this method revolutionized the DNA replication field by enabling to directly study protein interactions with replication forks, iPOND detects the average of thousands of replication forks and cells. iPOND lacks the single-cell level resolution that is achieved by IF, which can provide valuable additional parameter information such as stage of the S-phase, or cell identity. Moreover, the technique is labor-intensive and requires copious amounts of starting material (~100,000,000 cells per condition). The assay system described here termed in situ protein interaction with nascent DNA replication forks (SIRF) ( Roy et al., 2018a and 2018b) combines EdU-biotin Click-chemistry with proximity ligation assay (PLA) to overcome these challenges. The PLA technology developed by Soderberg et al. for single-molecule protein-protein interaction studies, utilizes antibodies with oligonucleotides conjugates, that can be ligated into a circular DNA molecule when two antibodies are in close proximity to each other (< 40 nm) ( Soderberg et al., 2008 ). Once ligated, the DNA circle can be amplified by rolling circle DNA polymerase. After annealing of fluorescent DNA probes that are complementary to the DNA circle, this procedure results in a highly amplified fluorescent signal, so that even single molecule interactions are readily detectable by conventional immunofluorescence microscopy. In SIRF, PLA is used with antibodies against biotin (detecting biotinylated EdU) and a protein of interest, which results in a PLA signal only if the protein is located within 40 nm or less from the newly synthesized DNA (Figure 1). The SIRF method requires little amounts of cells (~100-1,000), preserves the single-cell resolution as seen with IF, and can be readily and accurately quantified. Moreover, the single-cell resolution provides additional valuable information including cell morphology, cell-cycle stage (early or late S-phase), spatial orientation of protein signal in the nucleus, which can be associated with changes in replication fork-protein dynamics. The SIRF assay furthermore can be combined with conventional IF for additional cell-biomarker analysis, which amongst others allows to examine replication proteins in a heterogeneous cell population that can be differentiated by lineage specific markers. In this case, primary and secondary antibody staining for IF is performed prior to the PLA reaction to avoid interference of PLA secondary antibodies from cross-reacting with IF primary antibodies. The SIRF assay can be used to study protein dynamics at ongoing and stalled DNA replication forks, as well as chromatin maturation at newly replicated DNA regions ( Petruk et al., 2017 , Roy et al., 2018a and 2018b).
Figure 1. Flowchart for the SIRF assay.
Shown is the basic workflow and the major steps involved in SIRF assay.
Materials and Reagents
8-well chamber microscope slides (Thermo Scientific, Nunc, catalog number: 177402)
Plastic cover slips (Electron Microscopy Sciences, catalog number: 72261-50)
glass cover slips (Fisher Scientific, catalog number: 12-548-5M)
Kimwipes (Fisher Scientific, catalog number: NC9855580)
aluminum foil (Fisher Scientific, catalog number: 01-213-105)
paper towel (Envision, catalog number: 23304)
0.22 µm bottletop filter (Corning, catalog number: 430758)
Thymidine (Sigma-Aldrich, catalog number: T1895)
Rabbit anti-biotin antibody (Cell Signaling, catalog number: 5597S)
Mouse anti-biotin antibody (Sigma-Aldrich, catalog number: B7653)
Rabbit anti-RPA antibody (Abcam, catalog number: ab79398)
Goat serum (Sigma-Aldrich, catalog number: G9023)
5′-ethylene-2′-deoxyuridine (EdU) (Invitrogen, catalog number: A10044)
Hydroxyurea (HU) (Sigma-Aldrich, catalog number: H8627)
Paraformaldehyde 32% solution, EM grade (EMS, catalog number: 15714)
Triton X-100 (Sigma-Aldrich, catalog number: T8787)
Biotin Azide (Invitrogen, catalog number: B10184)
Alexa Fluor 488 azide (Invitrogen, catalog number: A10266)
Copper sulfate solution (Fluka Analytical, catalog number: 35185)
Sodium ascorbate (Sigma-Aldrich, catalog number: 11140)
Phosphate buffered saline (PBS) (Sigma-Aldrich, catalog number: P4417)
Duolink® Mouse plus PLA probe (Sigma-Aldrich, catalog number: DUO92001-100RXN)
Duolink® Rabbit minus PLA probe (Sigma-Aldrich, catalog number: DUO92005-100RXN)
Duolink® PLA detection reagent red (Sigma-Aldrich, catalog number: DUO92008-100RXN)
Duolink® Duolink In Situ Wash Buffers (Sigma-Aldrich, catalog number: DUO82049-20L)
4’, 6-diamidino-2-phenylindole (DAPI) (Life Technologies, catalog number: 62248)
Prolong Gold antifade reagent (Invitrogen, catalog number: P36934)
Tween 20 (Sigma-Aldrich, catalog number P7949)
Hydrochloric acid (Fisher Scientific, catalog number: A144-212)
Tris base (Fisher Scientific, catalog number: BP152-1)
IMDM (Gibco, catalog number: 12440-053)
FBS (Gemini Bio-products, catalog number: 100-106)
Sodium Chloride (Fisher Scientific, S271-3)
Fixation solution (see Recipes)
Permeabilization solution (see Recipes)
Blocking Buffer (see Recipes)
Wash Buffer A (see Recipes)
Wash Buffer B (see Recipes)
Equipment
Autoflow IR water jacketed CO2 incubator (NUAIRE, model: NU-4750)
Nikon eclipse Ti-U inverted microscope (Nikon, model: Ti-U)
coplin jar (Thermo ScientificTM E94)
fine curved forceps (Fine Science Tools, Dumont #7, catalog number: 11271-30)
slide box (VWR, catalog number: 82003-414)
vortexer (VWR analog vortex mixer, catalog number: 10153-838)
4 °C refrigerator (BSI, model: SCGP21OW1AREF)
-20 °C freezer (BSI, model: ABT-2020MB)
Software
-
Duolink® Analysis tool
(Sigma-Aldrich, http://www. Sigma-aldrich. com/ catalog/ product/ sigma / duo90806? Lang = en & ion = US)
NIS-elements (Nikon, https://www.nikoninstruments.com/Products/Software)
Microsoft Excel (Microsoft, https://products.office.com/en-us/excel)
ImageJ (ImageJ, https://imagej.net/Welcome)
GraphPad Prism (GraphPad, https://www.graphpad.com/scientific-software/prism/)
Procedure
-
Cell labeling
-
Plate 1 x 10⁴-2 x 10⁴ log-phase growing cells in 300 µl growth medium for each well of an eight-chamber glass microscope slide on the day before the experiment, such that the cells are 50-60% confluent the day of cell labeling. We typically use adherent cells, for e.g. HAP-1 cells that grow in IMDM medium supplemented with 10% FBS.
Note: We have not used this procedure with suspension cells. However, in principle it should be possible to use suspension cells as they can be treated with EdU in solution, deposited on microscopic slides using a cytospin, and then fixed to proceed with the assay.
-
The next day, gently aspirate growth medium from wells and add 200 μl pre-warmed growth medium containing EdU (125 μM). Incubate the slide at 37 °C in a tissue culture incubator for 8 min before fixation. This condition allows to detect proteins at unperturbed newly replicated DNA, ‘E only’.
Note: Equilibrate growth media to 37 °C prior to treating cells to ensure uninterrupted replication of cells during treatments. Be quick with washes and treatments, so as to limit exposure to room temperature that may disturb replication.
-
(Optional) For replication stalling conditions, aspirate the EdU-media after 8 min, wash wells swiftly but gently twice with PBS, aspirate and add growth medium containing hydroxyurea (HU) or any replication stalling agent of choice for a desired amount of time, typically 1-5 h at 37 °C. This condition allows detection of proteins at stalled forks, ‘E-HU’.
Note: We typically use 200 μM or 4 mM HU for replication stalling conditions. Lower concentrations of HU represent a transient fork stalling condition while high concentrations can cause DNA breakage (Roy et al, 2018b). One hour HU treatment would enable visualization of early replication stalling events, while 4 h HU (or longer) treatment enables visualization of later events.
(Optional) The EdU treatment (Step A2) is chased with thymidine. This allows to differentiate proteins bound to newly synthesized DNA from proteins associated with ongoing DNA replication forks; Proteins that travel with the DNA replication fork will have moved on during incubations with thymidine and will no longer be in proximity to the original EdU label, which makes the PLA reaction unproductive. For a thymidine chase, aspirate the EdU-containing media after 8 min, wash wells twice with PBS and add back growth medium containing thymidine (100 μM). Incubate slides at 37 °C for 4 h. This condition allows detection of proteins that are bound to replicated DNA and not progressing with the active replication fork, ‘E-Thy’. Similarly, the absence of a signal under this condition combined with the presence of a signal under the “E only” condition defines proteins traveling with ongoing DNA replication forks.
-
Always include a well with no EdU treatments as a negative control, ‘No EdU’. The EdU-EdU SIRF (see notes) serves as a positive control.
Note: It is advisable to perform all the conditions including the optional ones, to distinguish between proteins at a regular unperturbed replication fork (E only), versus at stalled replication forks (E-HU) or a chromatin bound protein that is in close proximity to a replication fork (E-Thy). The E-Thy condition distinguishes between proteins bound DNA itself from proteins bound to active replication forks.
-
-
Cell fixation
-
Gently aspirate growth medium, and carefully add 200 μl of fixation solution to each well (2% PFA diluted in PBS [pH 7.4]). Incubate at room temperature (RT) for 15 min without disturbing the slide. Fixation time may vary depending on cell type.
Note: Handle PFA with caution inside a biochemical safety cabinet. Discard PFA waste according to institutional biosafety guidelines.
-
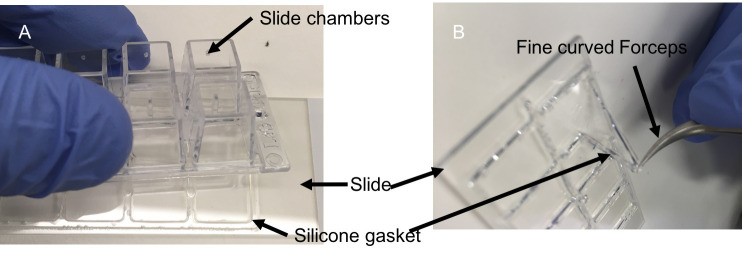
After fixation, discard of PFA and wash wells with PBS (pH 7.4) twice for 5 min. Dis-assemble chambers from chamber slide (Figure 2), ensuring that the wells do not dry out during disassembly and carefully place slides in Coplin jar containing 60 ml PBS.
Note: Fixed slides can be stored at 4 °C for up to one week.
-
-
Cell permeabilization
Permeabilize cells by placing slides in Coplin jar containing 60 ml permeabilization solution (0.25% Triton X-100 in PBS) for 15 min at RT.
Wash slides in Coplin jar with PBS (pH 7.4) twice for 5 min each.
-
Click-iT reaction
Prepare humid slide chamber by placing wet kimwipes inside a slide box at RT and equilibrate for 5 min (Figure 3).
-
Prepare fresh click-iT reaction cocktail by combining 2 mM copper sulfate, 10 μM biotin-azide and 100 mM sodium ascorbate in PBS in said order and mix well by vortexing.
Notes:
Make 1 M sodium ascorbate fresh, prior to use. Limit light exposure to biotin azide aliquots.
A mixture of Alexa 488 azide and biotin azide (1:10, total 10 μM) can be used instead of biotin azide alone, during click reaction. This enables normalization of PLA signal to the EdU signal and determination of the cell-cycle phase, such as early, mid and late S-phase (Figure 4).
Place slides in the slide box facing up (Figure 3), and add 30 μl/well click-iT reaction cocktail. Cover slides with new plastic cover slips, taking care to avoid air bubbles.
Close lid of slide box, which allows for humid chamber conditions, and incubate at RT for 1 h.
-
Blocking and primary antibody incubation
Remove plastic cover slips and wash slides in Coplin jar containing PBS (pH 7.4) for 5 min at RT.
Place slides back in humid chamber and add 30 μl/well blocking buffer (10% goat serum and 0.1% Triton X-100 in PBS). Cover slides with new plastic cover slips, taking care to avoid and discourage air bubbles.
Close slide box and incubate at RT for 1 h.
Dilute primary antibodies of interest in blocking buffer. Different dilutions may need to be tested for optimal signals. Use a complementary anti-biotin antibody in conjunction with an antibody against the protein of interest. For example, shown in Figure 5, is the use of a mouse anti-biotin (1:100, Sigma) and rabbit anti-RPA antibody pair (see notes). When using a mouse anti-protein of interest antibody, chose a rabbit anti-biotin (1:200, Cell Signaling).
Take off plastic cover slips from slides and gently tap off the blocking buffer.
Add 30-40 μl primary antibody mixture per well and apply new plastic cover slips, avoiding and discouraging air bubbles.
Place slides inside the humid chamber and incubate at 4 °C overnight.
-
Proximity ligation assay (PLA)
Wash slides in Coplin jar containing 60 ml Duolink wash buffer A (10 mM Tris-HCl pH 7.5, 150 mM NaCl and 0.05% Tween 20) three times for 5 min each.
Prepare Duolink In Situ PLA probes anti-plus and anti-minus against the respective primary antibodies by diluting them 1:5 in blocking buffer. For example, prepare anti-mouse plus and anti-rabbit minus in the example given in Figure 5 when using rabbit anti-RPA and mouse anti-biotin.
Tap off excess wash buffer and place slides in pre-warmed (37 °C) humid chamber. Swiftly add 30 μl/well diluted PLA probes, taking care to prevent wells from drying out.
Place new plastic cover slips on the slides and incubate humid slide chamber at 37 °C for 1 h.
Wash slides again in Coplin jar containing 60 ml Duolink wash buffer A, three times for 5 min each.
Prepare ligation mix by diluting Duolink ligation stock buffer (1:5) and Duolink ligase enzyme (1:40) in autoclaved water. Vortex the ligation stock buffer during and after thawing, making sure to dissolve any precipitate. Keep ligase enzyme in a freezing block at -20 °C and add to ligation buffer.
Tap off excess wash buffer and place slides back in humid slide chamber, add 30 μl/well ligation mix taking care to prevent slides from drying out.
Put new plastic cover slips on the slides and incubate humid slide chamber at 37 °C for 30 min.
Wash slides again in Coplin jar containing 60 ml Duolink wash buffer A, two times for 2 min each.
Prepare amplification mix by diluting Duolink amplification stock (1:5) and Duolink rolling circle polymerase enzyme (1:80) in autoclaved water. Limit the exposure of the amplification stock to light, e.g., by preparing the solution in an amber light-protected tube, or in a tube covered with aluminum foil. Keep polymerase enzyme in a freezing block at -20 °C.
Tap off excess wash buffer and place slides back in humid slide chamber. Add 30 μl/well amplification mix, taking care to prevent slides from drying out.
Cover with a new plastic cover slip and incubate humid slide chamber at 37 °C for exactly 100 min.
Wash slides in Coplin jar containing 60 ml Duolink wash buffer B (200 mM Tris-HCl pH 7.5 and 100 mM NaCl), three times for 10 min each in the dark.
Wash slides in Coplin jar containing 60 ml 0.01x diluted Duolink wash buffer B for 1 min in the dark. Proceed to DAPI staining.
-
DAPI staining and mounting
Prepare DAPI solution (1:1000, 1 μg/ml end concentration) in PBS. Protect from light.
Tap off excess wash buffer B and place slides back in humid slide chamber. Add 30 μl/well DAPI solution, taking care to prevent slides from drying out.
Cover with new plastic cover slips and incubate humid slide chamber at RT for 5 min.
Wash slides in coplin jar containing PBS two times for 5 min each.
Tap off excess PBS from slides and place them on a paper towel for mounting.
-
Add 20 µl of Prolong Gold antifade reagent to each well of the slide and mount with glass cover slips (1.5 mm). Avoid air bubbles while mounting and wipe off excess mounting reagent from the edges of the cover slip. Keep slides in a dry slide box at RT overnight to cure and avoid exposure to light.
Note: Store slides at -20 °C, if not imaged within 2 days.
Figure 2. Slide chamber dis-assembly.
A. dis-assembly of slide chambers. B. removal of silicone gasket (demarcating the chambers) using fine curved forceps. Apply caution to avoid scratches on the glass wells with forceps.
Figure 3. Humid slide chamber.
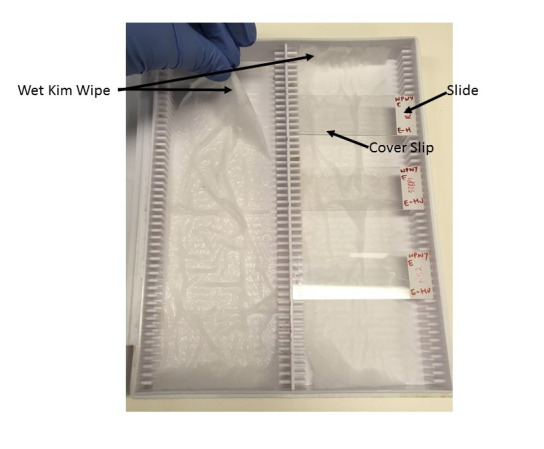
Preparation of humid slide chamber by placing folded paper wipes (Kimwipes) wetted with distilled water at the bottom of a slide box. Slides are laid flat, facing up during antibody and PLA solution incubations and are covered with plastic cover slips during respective incubations.
Figure 4. Representative image to distinguish SIRF signals at various stages of the cell cycle.

The above panel shows an example of RAD51 SIRF (red channel) in HAP-1 cells treated with 125 μM EdU for 8 min and 200 μM HU for 4 h. The arrows indicate cells in late S-phase based on EdU patterning. Note that the green signal for Alexa 488 azide co-click enables distinction of late S-phase versus early S-phase cells. scale bars = 20 μm.
Figure 5. Representative RPA-SIRF image in HAP-1 cells.
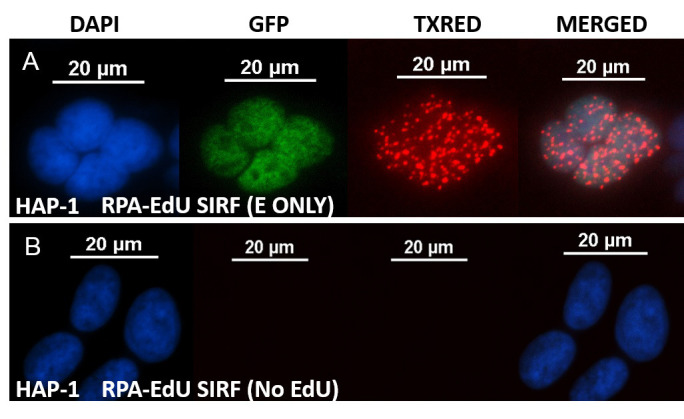
A. representative images of an RPA-SIRF assay in HAP-1 cells that have been treated with 125 μM EdU for 8 min. The cells were co-clicked with biotin-azide and alexa 488-azide (10:1, total 10 μM). The GFP channel shows the EdU-Alexa 488 signal of S-phase cells. PLA signals are visualized in TXRED channel. The PLA signal can be normalized to the Alexa 488 signal to account for PLA signal differences depending on EdU content of the cells. B. representative images of RPA-SIRF with no EdU condition (negative control). scale bars = 20 μm.
Data analysis
Image slides using fluorescent microscope (such as Nikon Eclipse Ti) at a magnification of 40x/0.95 numerical aperture (N.A.) (20x/0.75 N.A. may also be sufficient for larger cells). PLA signals are captured in the TXRED channel (Ex 594 nm, Em 624 nm, as recommended by Sigma Duolink for Duolink detection reagent Red). The GFP filter is used to image cells when co-clicked with Alexa 488-azide (Ex 495 nm, Em 519 nm). DAPI filter is used to visualize cell nuclei (Ex 358 nm, Em 461 nm). The merged image file is used for subsequent analysis (Figure 5). Typically, 3-5 image fields in different areas of the well are obtained for a total of minimally 100-200 cells per condition.
If the PLA signals are discrete and well dispersed, the Duolink quantification tool or the microscope intrinsic quantitation software, such as Nikon NIS-elements software, can be used to determine the number of signals per nuclei. Alternatively, when signals are very abundant and indistinguishable by the software (e.g., Figure 6) the mean fluorescent intensity of the TXRED channel is measured using ImageJ software or the software of the microscope such as Nikon NIS-elements software. Differences in EdU levels will alter the efficiency of the PLA between protein of interest and biotinylated EdU. Therefore, the PLA signals per cell should be normalized either individually to the total EdU signal per cell (as measured by Alexa 488-EdU signal in green channel) or to the median PLA signals measured in the EdU-EdU SIRF condition.
The preferred method to normalize SIRF signals to EdU content is to divide the number of SIRF signals per nucleus by the total GFP intensity per nucleus obtained by Alexa 488 for GFP+ cells (# SIRF signals per nucleus/sum GFP intensity of that given cell). Note that this condition should be compared to the identical SIRF assay without Alexa 488-azide co-click, to ensure that the overall PLA-signal abundance remains unchanged by the co-click.
-
Alternatively, an EdU-EdU SIRF can be performed by using mouse anti-biotin and rabbit anti-biotin antibodies (see notes). The mean TXRED intensity in this case is an indicator of EdU content of the cell. The number of SIRF signals per nucleus is then divided by the median EdU-EdU TXRED intensity per condition (# SIRF signals per nucleus/median TXRED intensity of all cells per condition).
Note: Exclude cells that are EdU-Alexa488 negative when calculating the median intensity.
If the data follows a non-normal distribution as measured by the D'Agostino & Pearson normality test, a Mann-Whitney t-test is used to determine the statistical significance of the differences in SIRF signals between conditions or cell lines ( Roy et al., 2018a ).
Figure 6. Representative EdU SIRF image in HAP-1 cells.
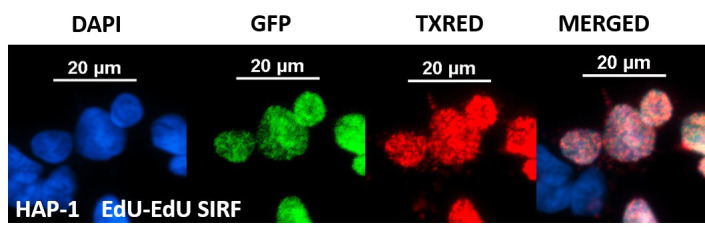
The above panel shows an example of EdU-EdU SIRF in HAP-1 cells treated with 125 μM EdU for 8 min. The PLA signals are too abundant to be hand counted. Mean TXRED intensity in this case can be measured for PLA quantification. The green channel represents Alexa 488-EdU signal. scale bars = 20 μm.
Notes
Optional: perform an additional PLA reaction solely with mouse anti-biotin and rabbit anti-biotin antibodies for identical experimental conditions on a separate slide. This “EdU-EdU” SIRF can be used for normalizing the PLA signals with the EdU content (Figure 6), as an alternative to normalization against EdU-Alexa 488 intensities when Alexa 488-azide is co-clicked with the biotin-azide (Figure 5).
The fixation time that we used is optimized for HAP-1, MCF10a, MEF, MCF7, HCT116, U2OS, H1299 cells. The amount and duration of fixation may need to be optimized for different cell lines.
Recipes
-
Fixation solution
Add 10 ml of 32% PFA solution stock (EMS) in 150 ml of PBS pH 7.4 to make 2% PFA, mix well
Store leftover diluted PFA in air-tight bottles, protected from light at either RT (for up to a week) or 4 °C for up to a month
-
Permeabilization solution
Add 12.5 ml 10% Triton X-100 solution in 487.5 ml PBS (pH 7.4) to make 0.25% Triton X-100 solution
Mix well and store at RT
-
Blocking Buffer
Add 1 ml goat serum and 100 µl Triton X-100 (10%) solution in 8.9 ml sterile PBS
Mix well and store at 4 °C for up to one week
-
Wash Buffer A
Dissolve 8.8 g NaCl, 1.2 g Tris base and 0.5 ml Tween 20 in 800 ml autoclaved water
Adjust pH to 7.4 using HCl
Add autoclaved water to 1,000 ml (final concentrations 0.01 M Tris, 0.15 M NaCl and 0.05% Tween 20)
Filter the solution (0.22 µm filter) and store at 4 °C. Bring the solutions to room temperature before use
-
Wash Buffer B
Dissolve 5.84 g NaCl, 4.24 g Tris base and 26 g Tris-HCl in 500 ml autoclaved water
Adjust pH to 7.5 using HCl
Add autoclaved water to 1,000 ml (final concentrations 0.2 M Tris and 0.1 M NaCl)
Filter the solution (0.22 µm filter) and store at 4 °C. Bring the solutions to room temperature before use
-
EdU stock solution
Add 2 ml DMSO directly into the vial containing 50 mg EdU to make 100 mM stocks. Dissolve powder by vortexing. Store aliquots of stock solution at -20 °C protected from light
Acknowledgments
This work was supported by RP180463, RP180813 (CPRIT) and 1R01ES029680 (NIEHS) grants, and K.S is a Rita Allen Foundation fellow and a CPRIT Scholar in Cancer biology. The PLA technology was originally developed by Soderberg et al., 2008 . PLA between biotin-clicked EdU and proteins of interest, reflecting the principle technology of SIRF, were also reported by Petruk et al., 2012 and 2017; Taglialatela et al., 2017 , in addition to Roy et al., 2018a and 2018b.
Competing interests
The authors declare no conflicts of interest.
Citation
Readers should cite both the Bio-protocol article and the original research article where this protocol was used.
References
- 1. Darzynkiewicz Z., Traganos F., Zhao H., Halicka H. D. and Li J.(2011). Cytometry of DNA replication and RNA synthesis: Historical perspective and recent advances based on"click chemistry". Cytometry A 79(5): 328-337. [DOI] [PMC free article] [PubMed] [Google Scholar]
- 2. Dungrawala H., Rose K. L., Bhat K. P., Mohni K. N., Glick G. G., Couch F. B. and Cortez D.(2015). The replication checkpoint prevents two types of fork collapse without regulating replisome stability. Mol Cell 59(6): 998-1010. [DOI] [PMC free article] [PubMed] [Google Scholar]
- 3. Gonchoroff N. J., Katzmann J. A., Currie R. M., Evans E. L., Houck D. W., Kline B. C., Greipp P. R. and Loken M. R.(1986). S-phase detection with an antibody to bromodeoxyuridine. Role of DNase pretreatment. J Immunol Methods 93(1): 97-101. [DOI] [PubMed] [Google Scholar]
- 4. Leif R. C., Stein J. H. and Zucker R. M.(2004). A short history of the initial application of anti-5-BrdU to the detection and measurement of S phase. Cytometry A 58(1): 45-52. [DOI] [PubMed] [Google Scholar]
- 5. Loeb L. A. and Monnat R. J., Jr (2008). DNA polymerases and human disease. Nat Rev Genet 9(8): 594-604. [DOI] [PubMed] [Google Scholar]
- 6. Magdalou I., Lopez B. S., Pasero P. and Lambert S. A.(2014). The causes of replication stress and their consequences on genome stability and cell fate. Semin Cell Dev Biol 30: 154-164. [DOI] [PubMed] [Google Scholar]
- 7. Moses J. E. and Moorhouse A. D.(2007). The growing applications of click chemistry. Chem Soc Rev 36(8): 1249-1262. [DOI] [PubMed] [Google Scholar]
- 8. Petermann E., Orta M. L., Issaeva N., Schultz N. and Helleday T.(2010). Hydroxyurea-stalled replication forks become progressively inactivated and require two different RAD51-mediated pathways for restart and repair. Mol Cell 37(4): 492-502. [DOI] [PMC free article] [PubMed] [Google Scholar]
- 9. Petruk S., Cai J., Sussman R., Sun G., Kovermann S. K., Mariani S. A., Calabretta B., McMahon S. B., Brock H. W., Iacovitti L. and Mazo A.(2017). Delayed accumulation of H3K27me3 on nascent DNA is essential for recruitment of transcription factors at early stages of stem cell differentiation. Mol Cell 66(2): 247-257 e5. [DOI] [PMC free article] [PubMed] [Google Scholar]
- 10. Petruk S., Sedkov Y., Johnston D. M., Hodgson J. W., Black K. L., Kovermann S. K., Beck S., Canaani E., Brock H. W. and Mazo A.(2012). TrxG and PcG proteins but not methylated histones remain associated with DNA through replication. Cell 150(5): 922-933. [DOI] [PMC free article] [PubMed] [Google Scholar]
- 11. Roy S., Luzwick J. W. and Schlacher K.(2018). SIRF: Quantitative in situ analysis of protein interactions at DNA replication forks . J Cell Biol 217(4): 1521-1536. [DOI] [PMC free article] [PubMed] [Google Scholar]
- 12. Roy S., Tomaszowski K. H., Luzwick J. W., Park S., Li J., Murphy M., Schlacher K., (2018). p53 suppresses mutagenic RAD52 and POLθ pathways by orchestrating DNA replication restart homeostasis. eLife. DOI: 10.7554/elife.31723 [DOI] [PMC free article] [PubMed] [Google Scholar]
- 13. Sengupta S., Linke S. P., Pedeux R., Yang Q., Farnsworth J., Garfield S. H., Valerie K., Shay J. W., Ellis N. A., Wasylyk B. and Harris C. C.(2003). BLM helicase-dependent transport of p53 to sites of stalled DNA replication forks modulates homologous recombination. EMBO J 22(5): 1210-1222. [DOI] [PMC free article] [PubMed] [Google Scholar]
- 14. Sirbu B. M., Couch F. B., Feigerle J. T., Bhaskara S., Hiebert S. W. and Cortez D.(2011). Analysis of protein dynamics at active, stalled, and collapsed replication forks. Genes Dev 25(12): 1320-1327. [DOI] [PMC free article] [PubMed] [Google Scholar]
- 15. Sirbu B. M., McDonald W. H., Dungrawala H., Badu-Nkansah A., Kavanaugh G. M., Chen Y., Tabb D. L. and Cortez D.(2013). Identification of proteins at active, stalled, and collapsed replication forks using isolation of proteins on nascent DNA(iPOND) coupled with mass spectrometry. J Biol Chem 288(44): 31458-31467. [DOI] [PMC free article] [PubMed] [Google Scholar]
- 16. Soderberg O., Leuchowius K. J., Gullberg M., Jarvius M., Weibrecht I., Larsson L. G. and Landegren U.(2008). Characterizing proteins and their interactions in cells and tissues using the in situ proximity ligation assay . Methods 45(3): 227-232. [DOI] [PubMed] [Google Scholar]
- 17. Taglialatela A., Alvarez S., Leuzzi G., Sannino V., Ranjha L., Huang J. W., Madubata C., Anand R., Levy B., Rabadan R., Cejka P., Costanzo V. and Ciccia A.(2017). Restoration of replication fork stability in BRCA1- and BRCA2-deficient cells by inactivation of SNF2-family fork remodelers. Mol Cell 68(2): 414-430 e8. [DOI] [PMC free article] [PubMed] [Google Scholar]


