Abstract
Background
COVID-19 pandemic has currently no vaccines. Thus, the only feasible solution for prevention relies on the detection of COVID-19-positive cases through quick and accurate testing. Since artificial intelligence (AI) offers the powerful mechanism to automatically extract the tissue features and characterise the disease, we therefore hypothesise that AI-based strategies can provide quick detection and classification, especially for radiological computed tomography (CT) lung scans.
Methodology
Six models, two traditional machine learning (ML)-based (k-NN and RF), two transfer learning (TL)-based (VGG19 and InceptionV3), and the last two were our custom-designed deep learning (DL) models (CNN and iCNN), were developed for classification between COVID pneumonia (CoP) and non-COVID pneumonia (NCoP). K10 cross-validation (90% training: 10% testing) protocol on an Italian cohort of 100 CoP and 30 NCoP patients was used for performance evaluation and bispectrum analysis for CT lung characterisation.
Results
Using K10 protocol, our results showed the accuracy in the order of DL > TL > ML, ranging the six accuracies for k-NN, RF, VGG19, IV3, CNN, iCNN as 74.58 ± 2.44%, 96.84 ± 2.6, 94.84 ± 2.85%, 99.53 ± 0.75%, 99.53 ± 1.05%, and 99.69 ± 0.66%, respectively. The corresponding AUCs were 0.74, 0.94, 0.96, 0.99, 0.99, and 0.99 (p-values < 0.0001), respectively. Our Bispectrum-based characterisation system suggested CoP can be separated against NCoP using AI models. COVID risk severity stratification also showed a high correlation of 0.7270 (p < 0.0001) with clinical scores such as ground-glass opacities (GGO), further validating our AI models.
Conclusions
We prove our hypothesis by demonstrating that all the six AI models successfully classified CoP against NCoP due to the strong presence of contrasting features such as ground-glass opacities (GGO), consolidations, and pleural effusion in CoP patients. Further, our online system takes < 2 s for inference.
Supplementary Information
The online version contains supplementary material available at 10.1007/s11548-021-02317-0.
Keywords: COVID-19, Pandemic, Lung, Computer tomography, Deep learning, Transfer learning, Machine learning, Bispectrum, Accuracy, Performance, Validation, Ground-glass opacities
Introduction
The coronavirus disease 2019 (COVID-19) is highly infectious (Ro = 3) and caused by SARS-CoV-2, the single-stranded RNA virus referred to as “severe acute respiratory syndrome coronavirus.” This disease leads to complications like pneumonia, acute respiratory distress syndrome (ARDS), damage to the heart, acute strokes, or even systemic hyper-inflammation syndrome, which, in turn, leads to multiorgan failure [1]. As of 20 August 2020, nearly 23 million people have been infected by COVID-19, and nearly 800,000 subsequent deaths have been recorded worldwide [2]. Most of the mortalities have occurred within eight countries—namely the USA, Brazil, the UK, Mexico, Italy, France, India, and Spain [2].
COVID-19 affects the lungs and causes respiratory difficulties. Common symptoms of COVID-19 include breathlessness, dry cough, fatigue, and fever [3]. Some relatively uncommon symptoms of COVID-19 include a loss of taste or smell, sore throat, and vomiting [4]. The danger posed by COVID-19, as well as its spread, is worsened by the fact that many people infected with COVID-19 are asymptomatic [3]. COVID-19 impacts the pulmonary tissues of the lungs, resulting in ARDS, [5] and a considerable percentage of the patients end up needing ventilator support [6]. Many of the initial victims of COVID-19 in China were hospitalised because they exhibited lower respiratory tract (LRT) symptoms [3,7] though these symptoms varied considerably among patients. Some patients exhibited minimal symptoms, while others suffered from hypoxia due to ARDS. For some patients, LRT transformed into ARDS within nine days [7]. It has also been discovered that patients suffering from COVID-19-induced ARDS are prone to organ failure [8,9].
Radiologists primarily use radiography, computerised tomography (CT), or ultrasounds to diagnose lung disease [10–12]. These methods allow symptomatic patients to be tested for COVID-19 quickly when tests like real-time transcription polymerase chain reaction (RT-PCR) are not available [13]. Researchers have demonstrated that CT is a more sensitive COVID-19 detection method than traditional techniques for symptomatic patients [14]. One recent study showed that chest radiography could not be used to detect the opaque image features of COVID-19 [15]. Lung ultrasounds can be used as an alternative to CT to detect COVID-19, although CT is still considered the gold standard for detecting pulmonary infections [16].
Apart from conventional techniques, many researchers have also employed artificial intelligence (AI)-based machine learning (ML), deep learning (DL), and transfer learning (TL) techniques to diagnose COVID-19. One group of researchers provided a novel technique to classify COVID-19 infection from lung CT images using weakly supervised DL; this method was also utilised to localise the inflammation caused by COVID-19 [17]. In other work, Xiao et al. developed a multiple instance learning module based on ResNet34 to predict the severity of COVID-19 cases using lung CT scans [18].
Meanwhile, other researchers used UNet + + architecture for segmenting COVID-19-infected lung areas using CT images [19]. They transformed their study into an online platform to provide fast COVID-19 diagnostic tools that are accessible worldwide [20]. Another group of researchers created a DL and “deep reinforcement learning” model that can automatically quantify COVID-19-related lung abnormalities such as ground-glass opacities and consolidations [21]. Their proposed architecture produces two metrics that can accurately quantify the spread of COVID-19.
Several other pieces of research have proposed new methods for diagnosing COVID-19 using TL on lung CT scans. TL is used when COVID-19 data are very less, or existing deep learning models can be improved by artistically utilising it [22–24]. However, TL works efficiently only if the model is trained using data that are similar to the target problem [25] (i.e., COVID-19 lung CT data). Otherwise, performance gains are minimal or insignificant.
In this study, we compared six state-of-the-art AI models (two traditional ML models, two TL models, and two DL models) using K-fold cross-validation to solve the COVID-19 detection problem related to lung CT data. To the best of our knowledge, no study has benchmarked the comparative efficacy of traditional machine learning, deep learning, and transfer learning architectures on COVID-19 lung CT data. As such, doing so is one of the objectives of the present study. Another important objective is to design COVID severity using output class probability values using AI models and then clinically validate against radiologist’s greyscale feature scores. As part of the clinical validation, we demonstrate the association of AI’s correlation with ground-glass opacities (GGO) values, thus validating the hypothesis on COVID severity estimation. We also performed 2D and 3D bispectrum analyses to classify COVID pneumonia (CoP) patients using CT images. Our results show that even though TL can reduce the training time of the model, DL and ML models match or surpass TL regarding the performance benchmarks of COVID-19 classification.
The aggressiveness of the COVID-19 severity can be seen using the imaging-based tests. If the Troponin is released, we know that it is likely to cause a heart attack. Similarly, if CT images can infer to tell the COVID-19 severity due to hyper-intensity distribution in the lung CT (which cannot be known from the swap sample), more aggressive care can be given to the patient. Therefore, the main clinical advantage of CT-based imaging is the determination of aggressiveness of the care which needs to be given to the patient.
Second benefit of doing this study is the development of the AI-based tool to avoid bias by the expert radiologist or pulmonologist. Due to fatigue of the over-length stay of the physicians at the hospital, the results can vary from radiologist to radiologist, so-called inter- and intra-observer variability. Thus, using the AI-based solutions, this major weakness can also be overcome. Third, if tropin is released when COVID-19 pneumonia CT has GGO, we know that it is likely to cause a heart attack too. Lastly, if CT shows pathology that means you, we have pneumonia, it is therefore important to quantify the risk using CT.
The rest of the paper is organised as follows. Section 2 discusses the pathophysiology of COVID-19 cases that develop into ARDS. Section 3 overviews the methodology. Section 4 discusses the experimental results using the K10 protocol and bispectrum analysis. The AI models’ performance is evaluated in Sect. 5 based on the ROC curve, and multiple classification metrics. We discuss our findings in Sect. 6. Sections 7 and 8 provide conclusions and references, respectively.
Methodology
Patient demographics
The CT images of 130 patients were collected. There were 100 CoP patients (68 males and 32 females) from the 17–93 age group (mean age = 61.49 ± 16). The remaining 30 cases (nine males and 21 females) from the age group of 17–93 (mean age = 51.4 ± 2 years) were NCoP patients.
Data acquisition and baseline characteristic
The methodology of this study consists of the design and development of a CADx that has three components. These components are divided based on their functionality. The first component is the region-of-interest extraction, which envelops the CT lung region. The second component of the system consists of the automatic classification of CoP patients and non-COVID pneumonia (NCoP) patients. The final stage of the CADx system consists of a performance evaluation that implements (1) a standardised analysis (e.g., ROC), (2) DOR validation (see Fig. S8 Online Resources 1), and (3) CoP validation using a bispectrum analysis paradigm. Before we dive into these three subsystems, we present the patient demographics and data acquisition systems.
Data acquisition
CT images were collected using a Philips Ingenuity Core CT Scanner, while patients were in a deep inspiration breath-hold (DIBH) supine position. The patients were not given any oral contrast or intravenous agents. The CT scan was done at 120 kV, 225 mAs. The spiral pitch factor, gantry rotation time, and detector configurations were fixed at 1.08, 0.5 s, and 65 × 0.625, respectively. A 768 × 768 lung window and a 512 × 512 mediastinal window size, were used to reconstruct 1-mm-thick images with soft tissue kernel. The CT images were reviewed using twin 35 × 43 EIZO PACS displays with a 2048 × 1536 matrix. The final data comprised 2788 CT images for CoP patients and 990 CT images for NCoP patients. For 100 COVID-19 patients, we took 27–28 scans per patient which helped us obtain 100*27–100*28, i.e., 2758 CT scans. Similarly, for healthy patients, we took around 33 scans for each of 30 patients, resulting in 30*33 = 990 CT scans.
Baseline characteristics
The baseline characteristics of the Italian cohort’s COVID-19 data are presented in Table 1. We have utilised the “R package” to perform a t-test on the data, with the level of significance set to P < = 0.05. The table shows the essential characteristic traits of CoP patients. The baseline characteristics reflect the visual characteristics of the CT lung data (row #3 to row #6). The ground-glass opacity (GGO) is significant in differentiating between CoP and NCoP classes (P = 0.00001). Lung consolidations (CONS) also differentiates the two classes from one another (P = 0.00453). The pleural effusion (PLE) attribute is also significant in the classification of CoP and NCoP patients (P = 0.00413). The most common physiological symptom of CoP is fever, which is also be correlated with body temperature (P = 0.00313).
Table 1.
Baseline characteristics of CoP and NCoP patients
| S. no. | Characteristic | Acronym | Description | CoP (N = 100) | NCoP (N = 30) | p-values |
|---|---|---|---|---|---|---|
| 1 | Age (years) | – | – | 61.49 | 51.4 | 0.02131 |
| 2 | Gender (M) | – | – | 0.30 | 0.68 | 0.43840 |
| 3 | GGO | Ground-glass opacities | An area charactersed by hazy lung opacity through which vessels and bronchial structures may still be seen | 4.42 | 1.77 | 0.00001 |
| 4 | CONS | Consolidations | A pulmonary consolidation is a region of compressible lung tissue that has filled with fluid instead of air | 3.07 | 2.53 | 0.00453 |
| 5 | PLE | Pleural effusion | The collection of excess fluid between the layers of the pleura outside the lungs | 0.12 | 0.63 | 0.00413 |
| 6 | LNF | Lymph nodes | A kidney-shaped organ of the lymphatic system and a part of adaptive immune system | 0.19 | 0.20 | 0.36280 |
| 7 | Cough | – | – | 0.62 | 0.40 | 0.03834 |
| 8 | Sore throat | – | – | 0.09 | 0.06 | 0.67040 |
| 9 | Dyspnoea | – | Shortness of breath | 0.57 | 0.40 | 0.10770 |
| 10 | BT + | – | – | 37.89 | 37.42 | 0.00313 |
Three kinds of AI architectures for classification
We have shortlisted two representative candidates from ML algorithms—namely k nearest neighbours (k-NN) and random forest (RF). The developed framework is a modified version of our previous work [26].
For TL, we utilised VGG19 and InceptionV3 pre-trained models [27] (see Fig. S5, S6 (Online Resources 1) and changed only the model top. VGG19 is a 19-layered deep model consisting of sixteen convolution layers to extract visual features, five max pool filters to reduce the spatial size of the extracted features, and three fully connected layers for classifying the image. InceptionV3 is a 42-layered deep model consisting of 11 inception modules (each comprising of multiple convolution layers and max-pooling filters), followed by three fully connected layers and a softmax activation layer.
The initial layers of TL were made nontrainable, and only last layers were made trainable. The reason for not training the entire network in case of transfer learning is that it can save computation time because the network would already be able to extract generic features from images. The network will not have to learn extracting generic features from scratch. A neural network works by abstracting and transforming information in steps. In the initial layers, the features extracted are generic, and independent of a particular task. It is the latter layers which are much more tuned specific for a particular task. So, by freezing the initial stages, we get a network which can already extract meaningful general features. We would unfreeze the last few stages (or just the new untrained layers), which would be tuned for our paradigm. It is not recommended to unfreeze all layers if we have any new/untrained layers in our model. These untrained layers will train as if initialised by random (and not pre-trained) weights which would lose the basic idea of transfer learning.
For DL, we developed our custom architectures (CNN and iCNN), consisting of a multi-layer convolution network (see Fig. S7, Table S5 (Online Resources 1). It contains three convolution layers, each of which is followed by a max-pooling filter, and two fully connected layers. A two-class probability score is obtained by passing the output to a softmax activation function. In iCNN, we slightly changed the “ReLU” activation function in the hidden layers to σ = (max(0, x))1.00001. Here, x is the input value, sigma is the activated output value, max is a function that gives the maximum value between zero and the input value, and the exponent 1.00001 slightly scales the output.
Several lightweight convolution neural network models have been experimented with 3, 4, 5 convolution layers for COVID disease identification, and it has been shown that these models provide very good results with 3 convolution layer model giving best accuracy. In the proposed three convolution layer model, 32, 16, and 8 hidden units are there in hidden layers 1, 2, and 3, respectively. Moreover, each convolution layer is followed by a max-pooling layer. After the last max-pooling layer, the flattened layer is present which converts the 2-D matrix to 1-D column vector which is densely connected with a layer having 128 hidden units, followed by the output layer. To provide nonlinearity in the model, the standard ReLU activation function has been modified and used in hidden layers.
Results
Accuracy of the two ML, two TL, and two DL models
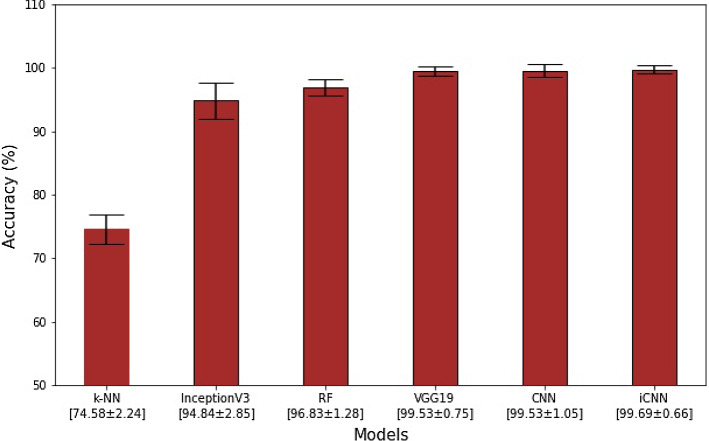
We compared the K10 classification accuracy of all the six AI models for the COVID-19 data, as shown in Table S2 (Online Resources 1). Our observations demonstrate that accuracies are in the following order DL > TL > ML. Further, DL-based iCNN and CNN architectures had accuracies of 99.69 ± 0.66% and 99.53 ± 1.05%, respectively, making them the two most accurate models among the six tested models. Of the TL architectures, only VGG19 fared well against DL architectures, as it had a classification accuracy of 99.53 ± 0.75%. The other TL architecture (i.e., InceptionV3) achieved a classification accuracy of only 94.84 ± 2.85%. The two ML architectures varied considerably in terms of their performance; their RF scoring was 96.84 ± 1.28%, and their k-NN scoring was 74.58 ± 2.24%. The mean accuracy figures of all six AI models are summarised in Fig. 1.
Fig. 1.
Mean K10 classification accuracies (in %) of two ML, two TL, and two DL architectures. The bar chart is presented in increasing order of accuracy
CT lung characterisation using bispectrum analysis
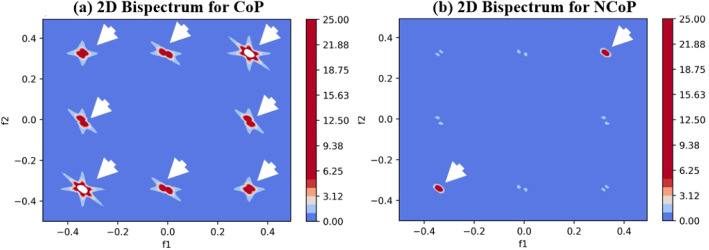
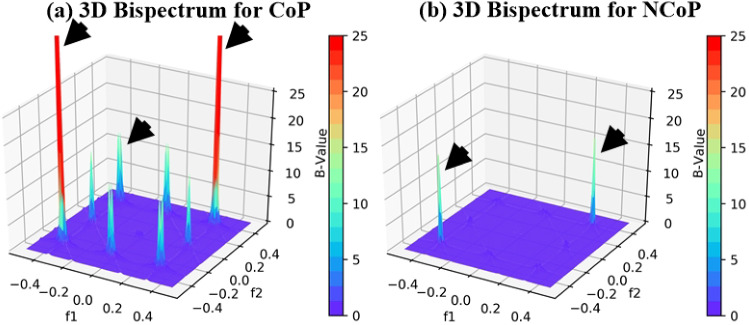
We characterised CoP and NCoP CT lung tissues using bispectrum analysis based on a higher-order spectrum (HOS). Bispectrum analysis is based on the principle of coupling of components of spectral signals. If there is a sudden change in grayscale image density (as is the case for COVID-19-infected tissues), then higher bispectrum (or B) values are generated. This property of bispectrum analysis can be exploited to identify COVID-19-infected tissue quickly. This study is intended to identify NCoP and CoP patients without using AI-based techniques.
Generally, COVID-19-infected lungs are characterised by a hyper-intensity region. We separated those pixels from lung CT images and passed them into a Radon transform, which acts as a signal for HOS to generate B values. The images of CoP patients have much higher B values. The 2D and 3D bispectrum plots for CoP and NCoP patients are shown in Figs. 2 and 3.
Fig. 2.
Comparison of bispectrum (2D) plots of CoP and NCoP patients
Fig. 3.
Comparison of bispectrum (3D) plots of CoP and NCoP patients
Performance evaluation of AI models and its clinical validation
Receiver operating characteristics
The ability of all six AI models to differentiate CoP and NCoP data sets is illustrated in Fig. 4. We used the K10 protocol to compute receiver operating characteristic (ROC) curves. As expected, the simplest ML model (i.e., k-NN) performed the worst in this regard, achieving a score of just 0.744 area under the curve (AUC) (P < 0.0001). The best-performing model was the novel iCNN DL, whose AUC score was 0.993 (P < 0.0001). Other AI models based on their increasing AUC values are TL-based InceptionV3, machine learning-based RF, transfer learning-based VGG19, and our custom deep learning CNN.
Fig. 4.
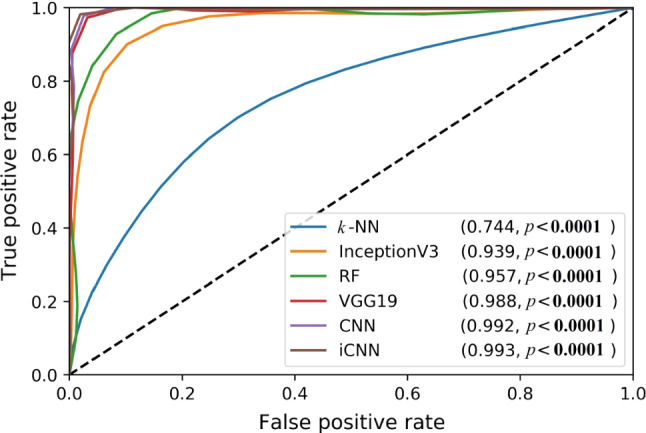
ROC plots for the six AI models (two ML, two TL, and two DL), along with their corresponding AUC values
A comparison of six AI models based on multiple classification metrics
We compared six AI models based on a COVID-19 data set containing 377 samples (99 NCoP patients and 278 CoP patients). We choose ten classification metrics for this comparison: sensitivity, specificity, precision, negative prediction value (NPR), false positive rate (FPR), false discovery rate (FDR), false negative rate (FNR), F1 score, Matthews correlation coefficient (MCC), and Cohen’s Kappa coefficient. Cohen Kappa and F1 score are measure of AI methods performance metrics calculated based on true positive, false positive and true negative and false negative values. F1 score [37] can be calculated using the formula:
| 1 |
We adopted Matthew’s correlation coefficient [28] for quantifying the quality of binary classification since it is typically used in machine learning. It was in 1975 that the biochemist Brian W. Matthews had introduced this measure. Given the truth table values represented as TP: true positive, FP: false positive, TN: true negative, FN: false negative, we mathematically express MCC as shown in Eq. 2.
| 2 |
Note that MCC represents the correlation between predicted and observed binary classification. It returns a value between −1 or +1. The perfect prediction is represented when MCC is +1, and −1 represents total disagreement between prediction and observation.
The results of the study are summarised in Table 2. Both the DL models (CNN and iCNN) and one of the TL models (VGG19) performed equally well. Both ML models (RF and k-NN) and the second TL model (InceptionV3) did not perform well in comparison with the DL models.
Table 2.
Comparison of the six AI models on the basis of multiple classification metrics
| Arch* | Sens | Spec | Prec | NPR | FPR | FDR | FNR | F1 | MCC | Kappa |
|---|---|---|---|---|---|---|---|---|---|---|
| k-NN | 0.5097 | 0.9099 | 0.798 | 0.7266 | 0.0901 | 0.2020 | 0.4903 | 0.6220 | 0.4692 | 0.444 |
| RF | 0.9065 | 0.9926 | 0.9798 | 0.964 | 0.0074 | 0.0202 | 0.0935 | 0.9417 | 0.9212 | 0.920 |
| IV3 | 0.8624 | 0.9813 | 0.9495 | 0.946 | 0.0187 | 0.0505 | 0.1376 | 0.9038 | 0.8692 | 0.867 |
| VGG19 | 0.9899 | 0.9964 | 0.9899 | 0.9964 | 0.0036 | 0.0101 | 0.0101 | 0.9899 | 0.9863 | 0.986 |
| CNN | 0.9899 | 0.9964 | 0.9899 | 0.9964 | 0.0036 | 0.0101 | 0.0101 | 0.9899 | 0.9863 | 0.986 |
| iCNN | 0.9899 | 0.9964 | 0.9899 | 0.9964 | 0.0036 | 0.0101 | 0.0101 | 0.9899 | 0.9863 | 0.986 |
*Arch: architecture; Sens: sensitivity; Spec: specificity; Prec: precision MCC: Mathew’s correlation coefficient; F1: F1-score; IV3: InceptionV3;
COVID risk stratification
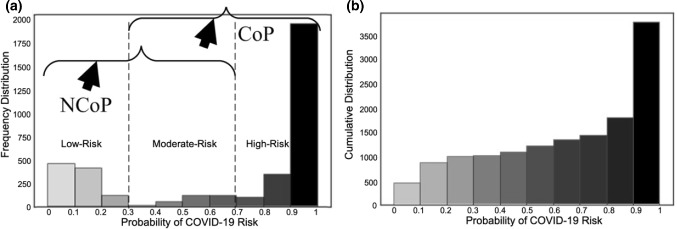
Figure 5 presents the COVID-19 risk levels of patients as predicted by our custom CNN DL model. We created the frequency distribution (Fig. 5a) by using a softmax function in the output layer of the model such that the model produced a probability score (ranging from 0 to 1) that indicates a patients’ COVID-19 risk. We divided the overall probability range into ten bins and added each CT image sample to one of the bins based on the output of the model. We considered three levels of risk: low risk (probability score of 0 to 0.3), moderate risk (0.3 to 0.7), and high risk (0.7 to 1). A cumulative distribution plot of all 3788 lung CT samples is given in Fig. 5b. This distribution was computed by summing all the CT samples for each bin by adding the previous total of samples until all the COVID-19 risk probability bins are completed.
Fig. 5.
COVID risk assessment: a frequency distribution of COVID-19 risk for CoP and NCoP patients; b cumulative distribution of COVID-19 risk
Clinical validation of COVID risk stratification
The ground-glass opacity values (GGO) correlation with CNN model was determined for each patient. For this, the mean of all CT scan slices of patient probability score was calculated and compared with GGO values. Similarly, bispectrum mean for each patient was calculated and compared with GGO values. CONS values were also tested for their correlation with COVID severity and bispectrum values. A list of all patients’ values of GGO, CONS, severity, and bispectrum B values is given in Table S3 (Online Resources 1). The correlation between these fields among themselves is also given in Table S4 (Online Resources 1).
The association linear curve between COVID severity and GGO is shown in Fig. 6 and that between bispectrum (B) value and GGO is shown in Fig. 7. Similarly, the curve between bispectrum and COVID severity is also shown in Fig. 8.
Fig. 6.
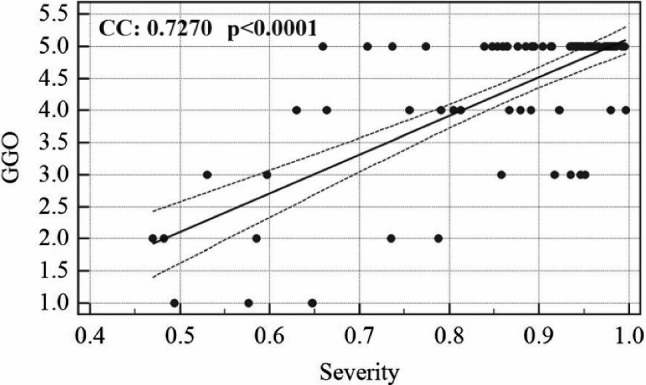
Association between GGO and COVID severity
Fig. 7.
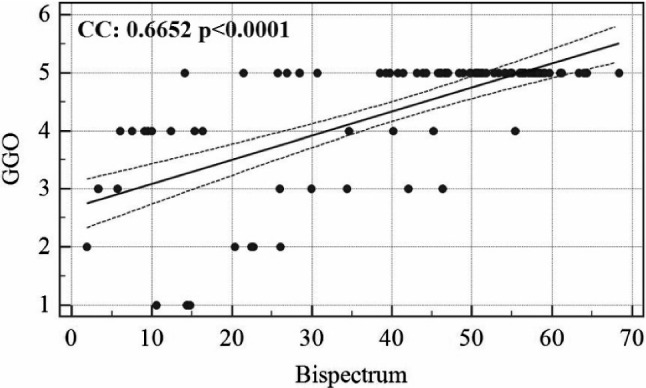
Association between GGO and bispectrum B values
Fig. 8.
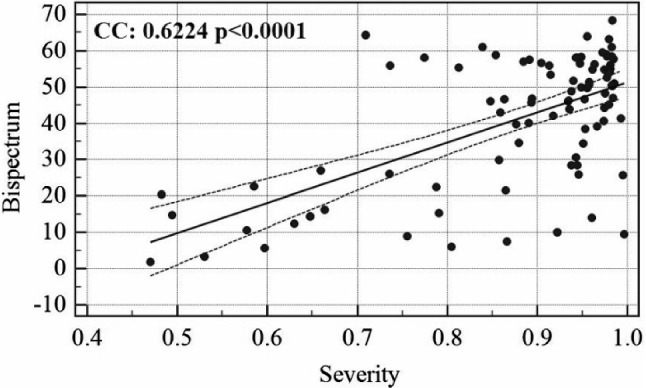
Association between COVID severity and bispectrum B values
Discussion
In this study, we tested our two custom DL models against two state-of-the-art TL models, using two popular ML models as baselines to resolve the CoP vs NCoP classification problem. We used the K10 protocol and compared these models’ accuracy. We used COVID-19 data that we collected from patients, following specific privacy laws. Our relatively simple nine-layered iCNN model was the most accurate among the investigated models, and it achieved the highest AUC score of 0.993 (P < 0.0001). Surprisingly, we found that architectures that are even more straightforward compared to iCNN model (e.g., RF) can match which are comparable to the state-of-the-art TL models (e.g., InceptionV3) in terms of accuracy and AUC score when used for COVID-19 classification. TL models’ unremarkable performance could be because these models were not trained on CT images or any other radiology data. Moreover, the high separability in training data, which is being caught by other AI models, is not noticed by TL models.
The COVID risk stratification for each patient was validated by showing a strong correlation with ground-glass opacity values of the patient’s CT scans. Similarly, bispectrum was also validated against GGO values. The clinical tests also show the AI models which are having similar classification capabilities and which are significantly differing in accuracy values. This is more clear than visual inspection of accuracy and standard deviation values of each AI-model.
Benchmarking
Table 3 presents benchmarking data to compare the six AI models examined in our research with those considered in existing work on COVID classification. We have shortlisted four criteria for benchmarking: (1) the COVID-19 dataset used, (2) the AI model used by the researchers, (3) the accuracy of their proposed models, and (4) any other performance measures used by the authors. Rows R1 to R5 present the research done by other researchers, and row R6 represents our research. It can be observed that the performance of our custom iCNN model is on par with models proposed by other researchers.
Table 3.
Benchmarking of six AI models with the existing work on COVID-19 classification
| Row# | Authors | Dataset | Model | Accuracy | Performance |
|---|---|---|---|---|---|
| R1 | Polsinelli et al. [29] | 360 CT scans of COVID-19 subjects and 397 CT scans of other kinds of illnesses | SqueezeNet | 0.83 | 0.8333 of F1 Score |
| R2 | Hasan et al. [30] | 321 chest CT scans (118-COVID, 96, pneumonia, 107 healthy) | LSTM | 1.00 | X |
| R3 | Jaiswal et al. [24] | 1262 CT COVID-19-positive CT images, 1230 CT images of non-COVID patients | DenseNet201 | 0.962 | 0.97 AUC |
| R4 | Loey et al. [31] | 345 images—COVID, 397 images—non-COVID CT scans | ResNet50 | 0.829 | Sensitivity of 77.66% and specificity of 87.62% |
| R5 | Apostolopoulos et al. [32] | 224 images—COVID-19, 714—bacterial pneumonia, 504—normal patients X-ray | MobileNet v2 | 0.967 | Sensitivity of 98.66% and specificity of 96.46% |
| R6 | Proposed Study |
2788 CoP/990 NCoP CT scans |
iCNN | 1.00 | 0.993 AUC |
3D validation
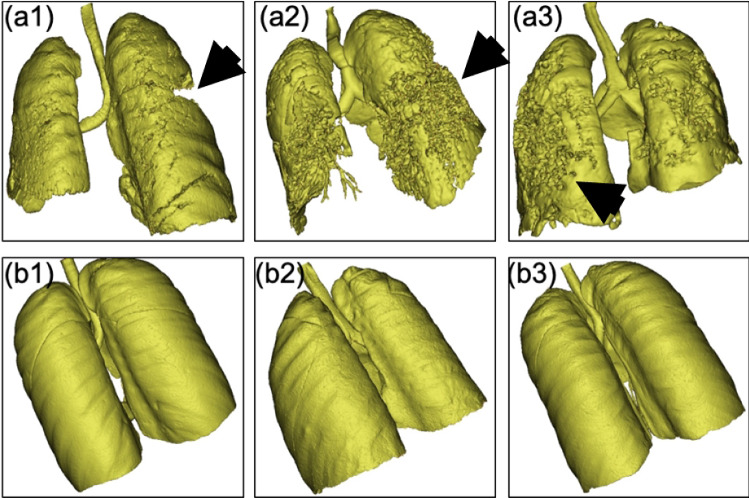
The lung CT data of our Italian cohort was processed so that we could evaluate the degradation and fibrosis of lung parenchyma of CoP vs NCoP patients (Fig. 9). We used the image segmentation tool to process data in DICOM format. Using profile lining, we applied segmentation based on the Hounsfield value (grey value) of the pixels belonging to the lung section [33]. A stacking process [34] was then applied to obtain a union, forming a 3D volume of the segmented region of interest [35]. This process was followed by region growing to develop the region of interest (in this case, the lung). The 3D volume was computed for the grown region to evaluate the volume and spatial distribution of lung parenchyma. We computed the spatial distribution of parenchyma associated with the rear end of the lung because the influence of spike proteins of COVID-19 is more significant in the deeper volume of the lung parenchyma [36].
Fig. 9.
(a1), (a2), and (a3): CoP lung samples showing the degradation and fibrosis of lung parenchyma; (b1), (b2), and (b3): three NCoP lung samples
Interpretation
DL models, particularly the CNN model that we used, are very good at recognising the spatial features of images without human intervention, which supports our hypothesis. Both of our custom models ran well likely because of the visual features of COVID-19 in the lung CT images (e.g., ground-glass opacities, consolidations, and pleural effusions). These features are very distinct for CoP when compared to NCoP. This notion is supported by the data representing the baselines characteristics of patients. If traditional ML classifiers are to work efficiently, their features need to be handcrafted, and their performance depends on the ingenuity of the model’s designer. TL models work better than DL models when there are relatively little data and training time. However, they must be pre-trained using similar dataset for which they are expected to be used. This limits the application of TL models in medical imaging unless such a model has been pre-trained on similar data.
Strengths, weakness, and extensions
Strengths: The architectures that we designed and developed in this work are relatively simple and easy to use in research and clinical settings. Even without augmentation, we demonstrated that their classification accuracies are high enough to be considered within the clinical range according to recent publications. Although the pilot trials were successful, the data sets that we used could be more balanced and could be multi-ethnic.
Weakness: Due to lack of non-COVID pneumonia data sets, the current models could not be tried. We intend to extend this to multiclass paradigms in future research [37]. Due to the limitation on the data sets regarding the “censorship” and “survival”, it was not possible to compute the survival analysis such as hazard curves and survival curves. However, in future, we will be collecting this information even though vaccines distributions have started.
Extensions: Even though the pilot study showed powerful results, one can design more robust automated segmentation step using stochastic segmentation strategies [38–40]. Extensive ML features can be computed under ML framework in future [41,42]. More validations using multimodality spatial images can be conducted such as PET and CT based on registration methods [43,44]. Superior lung CAD models can be designed to improve scientific validation [12,45]. Since AI has fast developed and more transfer learning approaches have been developed, one can try extending the TL models using the pre-trained weights [37]. While six AI models were tried on a single set of data, multi-centre study could be conducted using the same models to avoid any bias. Thus, the current study can be a launching pad for multi-centre, multimodality, multi-ethnic, and multi-regional analysis.
Conclusion
We presented six types of AI-based models for CoP vs NCoP classification via CT lung scans taken from an Italian cohort. The proposed CNN-based AI-model outperformed the TL and ML systems that were investigated. Further, we showed that when using higher-order spectra, bispectrum could differentiate CoP patients from NCoP patients, thus further validating our hypothesis. As part of clinical validation, a novel COVID risk factor calculation was introduced using CNN output probability values and validated against GGO values of all patients.
Our AI system was implemented on a multi-GPU system such that the online system was a few seconds per scan. The system can be extended to multiclass data sets where data can also be taken from community pneumonia or interstitial viral pneumonia. The system was validated against the well-accepted existing data sets (e.g., a biometric data set and a DL animal data set).
Supplementary information
Supplementary material 1 (DOCX 3,996 kb)
Compliance with ethical standards
Conflict of interest
The authors declare that they have no conflict of interest.
Ethical Approval
The COVID dataset was created and anonymised during March and April 2020 with due approval from the Institutional Ethics Committee, Azienda Ospedaliero Universitaria (AOU), “Maggiore d.c.” University of Eastern Piedmont, Novara, ITALY. We followed the ethical standards of the institution and/or national research committee for all the procedures related to human participation. Later amendments or comparable ethical standards were according to the 1964 Helsinki declaration. All participants gave informed consent to be included in the study.
Informed Consent
Informed consent was obtained from all individual participants included in the study.
Footnotes
Publisher's Note
Springer Nature remains neutral with regard to jurisdictional claims in published maps and institutional affiliations.
References
- 1.Who emro—about covid-19—covid-19—health topics (2020) [Online]. Available: http://www.emro.who.int/health-topics/corona-virus/about- covid-19.html
- 2.Coronavirus update (live) (2020) [Online]. Available: https://www.worldometers.info/coronavirus/
- 3.Wang HY, Li XL, Yan ZR, Sun XP, Han J, Zhang BW. Potential neurological symptoms of COVID-19. Therap Adv Neurol Disorders. 2020;13:1756286420917830. doi: 10.1177/1756286420917830. [DOI] [PMC free article] [PubMed] [Google Scholar]
- 4.Cascella M, Rajnik M, Cuomo A, Dulebohn SC, Di Napoli R (2020) Features, evaluation and treatment coronavirus (COVID-19). InStatpearls [internet] 2020, StatPearls Publishing: Treasure Island (FL) [PubMed]
- 5.Pan C, Chen L, Lu C, Zhang W, Xia JA, Sklar MC, Du B, Brochard L, Qiu H. Lung recruitability in COVID-19–associated acute respiratory distress syndrome: a single-center observational study. Am J Respir Crit Care Med. 2020;201(10):1294–1297. doi: 10.1164/rccm.202003-0527LE. [DOI] [PMC free article] [PubMed] [Google Scholar]
- 6.Meng L, Qiu H, Wan L, Ai Y, Xue Z, Guo Q, Deshpande R, Zhang L, Meng J, Tong C, Liu H. Intubation and ventilation amid the COVID-19 outbreak: Wuhan’s experience. Anesthesiology. 2020;132(6):1317–1332. doi: 10.1097/ALN.0000000000003296. [DOI] [PMC free article] [PubMed] [Google Scholar]
- 7.Huang C, Wang Y, Li X, Ren L, Zhao J, Hu Y, Zhang L, Fan G, Xu J, Gu X, Cheng Z. Clinical features of patients infected with 2019 novel coronavirus in Wuhan. China Lancet. 2020;395(10223):497–506. doi: 10.1016/S0140-6736(20)30183-5. [DOI] [PMC free article] [PubMed] [Google Scholar]
- 8.Devaux CA, Rolain JM, Raoult D (2020) ACE2 receptor polymorphism: susceptibility to SARS-CoV-2, hypertension, multi-organ failure, and COVID-19 disease outcome. J Microbiol Immunol Infect [DOI] [PMC free article] [PubMed]
- 9.Zaim S, Chong JH, Sankaranarayanan V, Harky A. COVID-19 and multi-organ response. Curr Probl Cardiol. 2020;28:100618. doi: 10.1016/j.cpcardiol.2020.100618. [DOI] [PMC free article] [PubMed] [Google Scholar]
- 10.Saba L, Suri JS. Multi-Detector CT imaging: principles, head, neck, and vascular systems. Boca Raton: CRC Press; 2013. [Google Scholar]
- 11.El-Baz A, Suri J. Lung Imaging and CADx. Boco Raton: CRC Press; 2019. [Google Scholar]
- 12.El-Baz A, Suri JS. Lung imaging and computer aided diagnosis. Boco Raton: CRC Press; 2011. [Google Scholar]
- 13.Use of chest imaging in covid-19 (2020) [Online]. Available: https://www.who.int/publications-detail-redirect/use-of-chest-imaging-in-covid-19
- 14.Hatamabadi H, Shojaee M, Bagheri M, Raoufi M (2020) Lung ultrasound findings compared to chest CT scan in patients with COVID-19 associated pneumonia: a pilot study. Adv J Emerg Med
- 15.Revel MP, Parkar AP, Prosch H, Silva M, Sverzellati N, Gleeson F, Brady A (2020) COVID-19 patients and the Radiology department–advice from the European Society of Radiology (ESR) and the European Society of Thoracic Imaging (ESTI). Eur Radiol 30(9):4903–4909 [DOI] [PMC free article] [PubMed]
- 16.Yan C, Hui R, Lijuan Z, Zhou Y. Lung ultrasound vs. chest X-ray in children with suspected pneumonia confirmed by chest computed tomography: a retrospective cohort study. Exp Therap Med. 2020;19(2):1363–1369. doi: 10.3892/etm.2019.8333. [DOI] [PMC free article] [PubMed] [Google Scholar]
- 17.Hu S, Gao Y, Niu Z, Jiang Y, Li L, Xiao X, Wang M, Fang EF, Menpes-Smith W, Xia J, Ye H. Weakly supervised deep learning for covid-19 infection detection and classification from ct images. IEEE Access. 2020;29(8):118869–118883. doi: 10.1109/ACCESS.2020.3005510. [DOI] [Google Scholar]
- 18.Li Z, Zhong Z, Li Y, Zhang T, Gao L, Jin D, Sun Y, Ye X, Yu L, Hu Z, Xiao J. From community acquired pneumonia to COVID-19: a deep learning based method for quantitative analysis of COVID-19 on thick-section CT scans. Eur Radiol. 2020;30(12):6828–6837. doi: 10.1007/s00330-020-07042-x. [DOI] [PMC free article] [PubMed] [Google Scholar]
- 19.Chen J, Wu L, Zhang J, Zhang L, Gong D, Zhao Y, Chen Q, Huang S, Yang M, Yang X, Hu S. Deep learning-based model for detecting 2019 novel coronavirus pneumonia on high-resolution computed tomography. Sci Rep. 2020;10(1):1–1. doi: 10.1038/s41598-019-56847-4. [DOI] [PMC free article] [PubMed] [Google Scholar]
- 20.Ctangel (2020) [Online]. Available: http://121.40.75.149/znyx-ncov/index
- 21.Chaganti S, Grenier P, Balachandran A, Chabin G, Cohen S, Flohr T, Georgescu B, Grbic S, Liu S, Mellot F, Murray N. Automated quantification of CT patterns associated with COVID-19 from chest CT. Radiol Artificial Intell. 2020;2(4):200048. doi: 10.1148/ryai.2020200048. [DOI] [PMC free article] [PubMed] [Google Scholar]
- 22.Ahuja S, Panigrahi BK, Dey N, Rajinikanth V, Gandhi TK. Deep transfer learning-based automated detection of COVID-19 from lung CT scan slices. Applied Intelligence: Springer; 2020. [DOI] [PMC free article] [PubMed] [Google Scholar]
- 23.Das NN, Kumar N, Kaur M, Kumar V, Singh D. Automated deep transfer learning-based approach for detection of COVID-19 infection in chest X-rays. Irbm. 2020 Jul 3. [DOI] [PMC free article] [PubMed]
- 24.Jaiswal A, Gianchandani N, Singh D, Kumar V, Kaur M. Classification of the COVID-19 infected patients using DenseNet201 based deep transfer learning. J Biomol Struct Dyn. 2020;2:1–8. doi: 10.1080/07391102.2020.1788642. [DOI] [PubMed] [Google Scholar]
- 25.Caldwell M, Griffin LD. Limits on transfer learning from photographic image data to X-ray threat detection. J X-ray Sci Technol. 2019;27(6):1007–1020. doi: 10.3233/XST-190545. [DOI] [PubMed] [Google Scholar]
- 26.Kuppili V, Biswas M, Sreekumar A, Suri HS, Saba L, Edla DR, Marinhoe RT, Sanches JM, Suri JS. Extreme learning machine framework for risk stratification of fatty liver disease using ultrasound tissue characterization. J Med Syst. 2017;41(10):152. doi: 10.1007/s10916-017-0797-1. [DOI] [PubMed] [Google Scholar]
- 27.Team k. keras documentation: Keras applications (2020) [Online]. Available: https://keras.io/api/applications/
- 28.Singh BK, Verma K, Thoke AS, Suri JS. Risk stratification of 2D ultrasound-based breast lesions using hybrid feature selection in machine learning paradigm. Measurement. 2017;1(105):146–157. doi: 10.1016/j.measurement.2017.01.016. [DOI] [Google Scholar]
- 29.Polsinelli M, Cinque L, Placidi G. A light CNN for detecting COVID-19 from CT scans of the chest. Pattern Recogn Lett. 2020;140:95–100. doi: 10.1016/j.patrec.2020.10.001. [DOI] [PMC free article] [PubMed] [Google Scholar]
- 30.Hasan AM, AL-Jawad MM, Jalab HA, Shaiba H, Ibrahim RW, AL-Shamasneh AA. Classification of Covid-19 coronavirus, pneumonia and healthy lungs in CT scans using Q-deformed entropy and deep learning features. Entropy. 2020;22(5):517. doi: 10.3390/e22050517. [DOI] [PMC free article] [PubMed] [Google Scholar]
- 31.Loey M, Manogaran G, Khalifa NE. A deep transfer learning model with classical data augmentation and cgan to detect covid-19 from chest ct radiography digital images. Neural Comput Appl. 2020;26:1–3. doi: 10.1007/s00521-020-05437-x. [DOI] [PMC free article] [PubMed] [Google Scholar]
- 32.Apostolopoulos ID, Mpesiana TA. Covid-19: automatic detection from x-ray images utilizing transfer learning with convolutional neural networks. Phys Eng Sci Med. 2020;3:1. doi: 10.1007/s13246-020-00865-4. [DOI] [PMC free article] [PubMed] [Google Scholar]
- 33.Wang Y, Wang H, Shen K, Chang J, Cui J. Brain CT image segmentation based on 3D slicer. J Complex Health Sci. 2020;3(1):34–42. doi: 10.21595/chs.2020.21263. [DOI] [Google Scholar]
- 34.Chattopadhyay H, Bit A, Ghagare D, Rizvanov A. Assessment of influences of stenoses in right carotid artery on left carotid artery using wall stress marker. Biomed Res Int. 2017;2017:2935195. doi: 10.1155/2017/2935195. [DOI] [PMC free article] [PubMed] [Google Scholar]
- 35.AlZu’bi S, Shehab M, Al-Ayyoub M, Jararweh Y, Gupta B. Parallel implementation for 3d medical volume fuzzy segmentation. Pattern Recognit Lett. 2020;130:312–318. doi: 10.1016/j.patrec.2018.07.026. [DOI] [Google Scholar]
- 36.Salehi S, Reddy S, Gholamrezanezhad A. Long-term pulmonary consequences of coronavirus disease 2019 (COVID-19): what we know and what to expect. J Thorac Imag. 2020;35(4):W87–W89. doi: 10.1097/RTI.0000000000000534. [DOI] [PubMed] [Google Scholar]
- 37.Tandel GS, Balestrieri A, Jujaray T, Khanna NN, Saba L, Suri JS. Multiclass magnetic resonance imaging brain tumor classification using artificial intelligence paradigm. Comput Biol Med. 2020;30:103804. doi: 10.1016/j.compbiomed.2020.103804. [DOI] [PubMed] [Google Scholar]
- 38.El-Baz A, Jiang X, Suri JS. Biomedical image segmentation: advances and trends. Boco Raton: CRC Press; 2016. [Google Scholar]
- 39.El-Baz A, Gimel’farb G, Suri JS. Stochastic modeling for medical image analysis. Boca Raton: CRC Press; 2015. [Google Scholar]
- 40.Suri JS, Wilson DL, Laxminarayan S. Handbook of Biomedical Image Analysis: Segmentation models part B. Amsterdam: Kluwer Academic/Plenum Publishers; 2005. [Google Scholar]
- 41.Wu DH, Chen Z, North JC, Biswas M, Vo J, Suri JS. Machine learning paradigm for dynamic contrast-enhanced MRI evaluation of expanding bladder. Front Biosci (Landmark Edition) 2020;1(25):1746–1764. doi: 10.2741/4876. [DOI] [PubMed] [Google Scholar]
- 42.Roberts M, Driggs D, Thorpe M, Gilbey J, Yeung M, Ursprung S, Aviles-Rivero AI, Etmann C, McCague C, Beer L, Weir-McCall JR (2020) Machine learning for COVID-19 detection and prognostication using chest radiographs and CT scans: a systematic methodological review
- 43.Suri JS, Wilson D, Laxminarayan S. Handbook of biomedical image analysis. Berlin: Springer; 2005. [Google Scholar]
- 44.Narayanan R, Kurhanewicz J, Shinohara K, Crawford ED, Simoneau A, Suri JS (2009) MRI-ultrasound registration for targeted prostate biopsy. In: 2009 IEEE international symposium on biomedical imaging: from nano to macro. IEEE, pp 991–994
- 45.Acharya R, Ng YE, Suri JS. Image modeling of the human eye. New York: Artech House; 2008. [Google Scholar]
Associated Data
This section collects any data citations, data availability statements, or supplementary materials included in this article.
Supplementary Materials
Supplementary material 1 (DOCX 3,996 kb)


