Abstract
Microglia are the resident immune cells of the central nervous system (CNS). In the last year, the improvements in the transgenic mouse technologies and imaging techniques have shed light on microglia functions under physiological conditions. Microglia continuously scan the brain parenchyma with their highly motile processes, maintaining tissue homeostasis and participating in neuronal circuits refinement. Here, we describe a protocol that enables us to perform time-lapse imaging of microglial cells in acute hippocampal slices, making image acquisition possible on an electrophysiology rig equipped with a standard imaging system. Using this ex vivo approach, we investigated microglial processes scanning abilities under physiological condition in hippocampus.
Keywords: Neuroscience, Mouse, Cell Biology, Cell imaging, Live-cell imaging, Cell-based analysis, Microglia, Hippocampus, Physiology
Background
Microglia are the immunocompetent cells of the brain. They have been classically described as defenders of the CNS under pathological conditions. Indeed, they are able to detect pathological stimuli or brain insults and rapidly switch to an activated phenotype migrating toward the site of injury (Hanisch and Kettenmann, 2007). However, in the last years this interpretation has been challenged. Through time-lapse imaging techniques, it has been demonstrated that, in physiological conditions, microglia engage minimal overlapping territories and continuously scan brain microenvironment, extending and retracting their thin processes ( Davalos et al., 2005 ; Nimmerjahn et al., 2005 ). This dynamic reorganization of microglial processes may be considered a housekeeping function by which microglia monitor the environment, physically interact with other cells, remove tissue debris and apoptotic cells, and sense neuronal activity and structural alterations, in order to preserve and organize neuronal networks (reviewed in Hristovska and Pascual, 2016).
The CX3CR1-GFP mouse model ( Jung et al., 2000 ) provides an exceptional tool for the visualization in vivo and ex vivo of microglia morphology, including the distal processes and fine protrusions. The heterozygous Cx3cr1 mouse model has been previously used in several studies in order to highlight the dynamic behavior of microglial cells in different brain regions ( Lee et al., 2008 ; Wake et al., 2009 ; Tremblay et al., 2010 ). However, it should be also considered that different studies have highlighted a slightly different microglial function in heterozygous mice compared to wild type ( Lee et al., 2010 ; Rogers et al., 2011 ; Sellner et al., 2016 ).
The current protocol allows investigating the scanning ability of microglial cells, providing a deep analysis of the fine movement of microglial processes at rest. Using this approach, we highlighted an impairment in microglia patrolling ability of mice lacking the CX3CR1, in which neuron-microglia crosstalk mediated by the fractalkine/CX3CR1 signaling is disrupted ( Basilico et al., 2019 ).
Moreover, this protocol can be easily adapted to study the acute effect of drugs, possibly applied through the perfusion system, on microglial processes rearrangement.
Materials and Reagents
Double edge razor blades (Ted Pella, catalog number: 121-6)
Pasteur pipette
Halotane (Sigma-Aldrich, catalog number: B4388)
-
CX3CR1-GFP mice (The Jackson Laboratory, catalog number: 005582)
Note: Data showed in the present protocol have been collected from young heterozygous Cx3cr1+/GFP male mice (6 weeks old).
Sodium chloride (NaCl) (Sigma-Aldrich, catalog number: 71376)
Potassium chloride (KCl) (Sigma-Aldrich, catalog number: P9333)
Magnesium chloride (MgCl2) (Sigma-Aldrich, catalog number: M8266)
Calcium chloride dehydrate (CaCl2) (Sigma-Aldrich, catalog number: C3881)
Sodium phosphate monobasic monohydrate (NaH2PO4) (Sigma-Aldrich, catalog number: S9638)
HEPES (Sigma-Aldrich, catalog number: H4034)
Glucose (Sigma-Aldrich, catalog number: G5767)
Sodium bicarbonate (NaHCO3) (Sigma-Aldrich, catalog number: S6014)
Super Glue (Loctite, catalog number: 234796)
Stock ACSF solution 10x (see Recipes)
ACSF 1x (see Recipes)
Equipment
25 ml Pyrex beaker
250 ml Pyrex beaker
Set of dissection tools (scissors, tweezers, spatula, blade)
95% O2, 5% CO2 tank
Chemical hood
Vibratome (Dosaka microslicer, model: DKT-1000)
Custom-made recovery chamber for slices
Compressed air tank
Anti-vibration table
Upright light microscope (Carl Zeiss, model: Axioscope)
3.2x (or a 4x or 10x) objective (Carl Zeiss, model: Achroplan)
40x water-immersion objective (Carl Zeiss, model: Achroplan)
Filter D480/D510 (Chroma Technology corp, model: 31001)
Digital 12 bit CCD camera system (Sensi Cam, PCO AG)
Computer with time-lapse imaging system
Custom-made perfusion/suction system (gravity or pump-operated) using flexible plastic tubing
4 °C refrigerator
monochromator
Software
Image-acquisition software (e.g., Tillvision, Metamorph, Metavue, etc.)
Fiji (https://imagej.net/Fiji/Downloads) or ImageJ (ver. 1.49v or later) (https://imagej.nih.gov/ij/download.html)
Microsoft Excel or Origin 8.1 software
Procedure
-
Preparation of acute hippocampal slices from mouse
On the day of the experiment, prepare the ACSF (1 L) early in the morning. Place two beakers on ice and subsequently pour ~150 ml and ~20 ml of ACSF respectively in each beaker. Oxygenate (95% O2, 5% CO2) the solutions for all the duration of slicing procedure.
Fill the recovery slice chamber with ~100 ml of ACSF at room temperature and oxygenate.
Under the chemical hood, anesthetize the mouse. Check for the absence of reflex by pinching the paw. Quickly decapitate the mouse with large scissors. Expose the skull and, using a small scissor, open the skull along the midline from the cerebellum to the olfactory bulbs. This procedure should be quick and care should be taken while cutting in order to not damage the brain.
Remove the brain with a spatula and place it in the small beaker, allowing it to recover for 10 min at 0 °C in ice-cold oxygenated (95% O2, 5% CO2) ACSF.
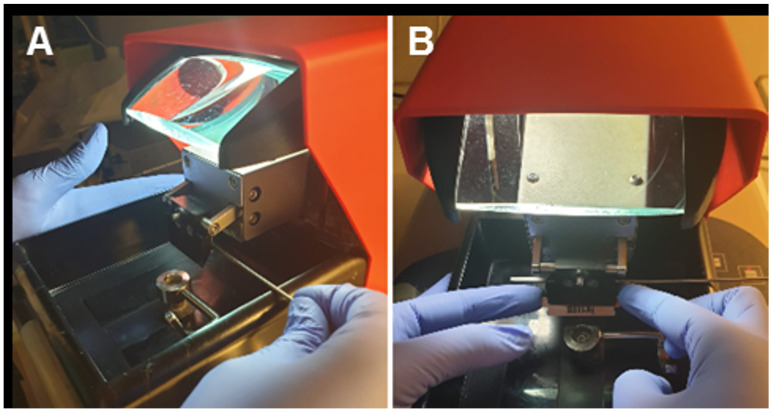
Prepare the vibratome by placing ice and water to surround the slicing chamber. Cut a razor blade in half and place one half in the blade holder of the vibratome (Figure 1).
With the blade, remove the cerebellum and divide the hemispheres.
Rapidly, put one drop of super glue on the plate of the slice chamber and locate the hemispheres with the ventral part side up. Pour the ice-cold ACFS in the slice chamber and oxygenate.
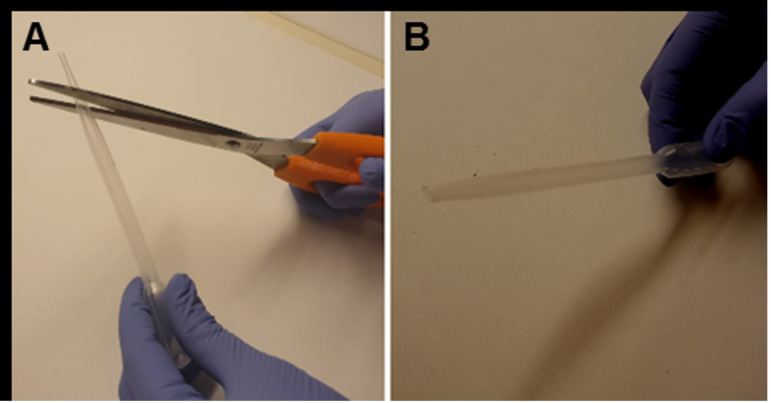
The vibratome allows to set both the blade vibration frequency, from 0 (corresponding to 0 Hz) to 10 (corresponding to 55 Hz), and the cutting-speed, from 0 (slowest speed corresponding to 0 mm/min) to 10 (highest speed corresponding to 68 mm/min). Start slicing setting the cutting-speed at 3 and the vibration frequency at 10 to obtain 250 µm horizontal hippocampal slices. Transfer them in the recovery chamber using a Pasteur pipette (with the tip previously cut; Figure 2).
-
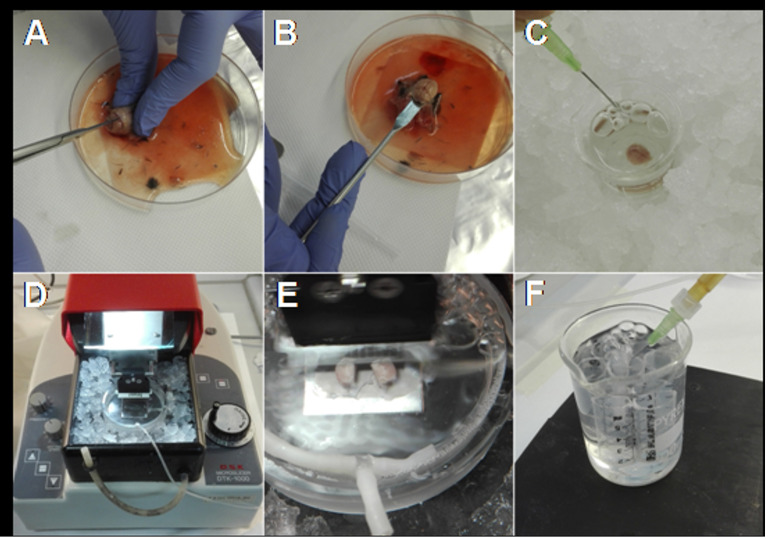
Before starting experiments, allow the slices to recover for at least 2 h in oxygenated ACSF at room temperature (Figure 3).
Note: Slices can recover both at room (~ 25 °C) and warmer temperature (30-37 °C).
-
Imaging acquisition
Place the slice in the recording chamber under the microscope. Check that the oxygenated ACSF solution is continuously exchanged through the perfusion/suction system. Set the ACSF perfusion at 1.5-2 ml/min.
Use the 3.2x magnification (or a 4x or 10x magnification) to identify the hippocampal regions by bright field observation.
Change magnification to 40x and identify the stratum radiatum (between the dentate gyrus and the CA1 region) by bright field observation.
-
Select the filter for the excitation of GFP at 488 nm and visualize microglia. Excitation light sources can be a monochromator equipped with a xenon lamp or a led launched through a laser launcher box.
Note: Imaging experiments should be performed in a dark environment.
Choose a fluorescent field with a good signal-to-background ratio and avoid superficial fields (estimate depth from the surface 30-40 µm).
Monitor microglial processes movement by acquiring a fluorescent image every 10 s for 25 min, setting light time exposure at 50-100 ms with a camera binning of 2 (Video 1).
At the end of the acquisition, save the file as an image sequence (.avi or .tif format).
Figure 1. Blade setup into the blade holder.
A. Using a screw, open the blade holder laterally. B. Carefully, place the half-blade into the open holder and block it.
Figure 2. Modified Pasteur pipette.
A. Using big scissors, make a transverse cut removing the tip of a plastic Pasteur pipette. B. Plastic Pasteur pipette after the tip got removed.
Figure 3. Main steps for obtaining acute brain slices.
A. After decapitation, expose the skull and cut from the caudal towards the rostral side of the brain. B. Using a spatula remove the brain. C. Place the brain in ice-cold ACSF and oxygenate. D. Prepare the vibratome surrounding the slice chamber with ice and water. E. Fix the hemispheres, with the ventral part side up, on the plate of the slice chamber, pour the ice-cold ACSF and start slicing. F. Allow the slices to recover at room temperature in oxygenated ACSF.
Video 1. Time-lapse imaging of microglial processes motility.
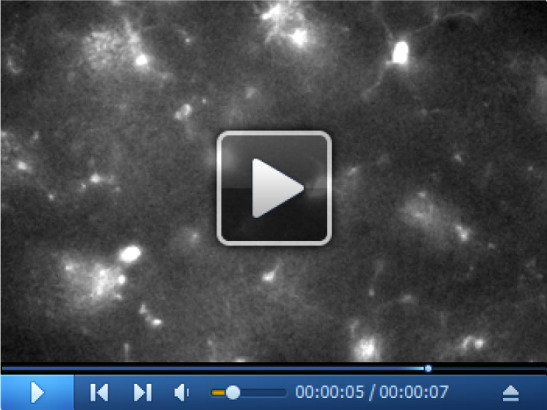
The video is a 25 min time-lapse of microglial processes motility at rest.
Data analysis
Download and install ImageJ from https://imagej.nih.gov/ij/download.html. MTrackJ is an ImageJ or Fiji plug-in.
Upload the images, or stack of images (.tif or .avi) in ImageJ. If the images are single images create a stack or movie by importing a folder of images with the command File > Import > Image Sequence.
Depending on the gray values and overall intensity, you might need to find optimal settings, therefore adjust the brightness and contrast of the movie by using the tool Image > Adjust > Brightness and Contrast > Auto > Apply.
Calibrate the stack according to your objective by setting the pixel calibration and frame time interval in the Image > Properties dialog.
Run the MTrackJ plug-in and start tracking the moving microglial processes according to the software guidelines ( Meijering et al., 2012 ). The online manual of MTrackJ is very detailed and contains all the information to create and modify tracks. Briefly, to create a track use the command Add and start following your process by pressing the mouse button at the position of the moving process. The program will automatically move to the next frame. Once completed processing the track of the moving microglial process, terminate it by double clicking the mouse or by pressing the Esc key. Check that the tracks actually follow the process over time.
Save your processed tracks as a .mdf file by using Save.
Once completed tracking all microglial processes in the stack, use the command Measure. The software generates 2 files with quantitative output: one file contains data of all individual points of each track, the other contains average values of each track (Video 2).
Save the quantitative data of the trajectories (i.e., positions of processes at each frame) as the Comma-Separated Values (CSV) or any format for spreadsheet software.
Separate the single trajectories for each track and condition to be analyzed.
Generally, the Y coordinate values are inverted, convert the Y coordinate by multiplying each Y component by (-1).
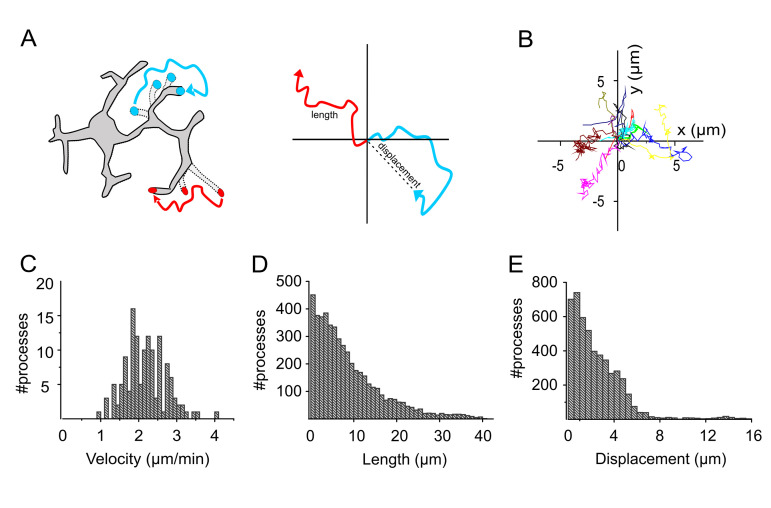
To plot the movement of each trajectory starting at the center (x = 0, y = 0), subtract the initial position from each trajectory before plotting (see Figures 4A and 4B).
Pool the length, instantaneous trajectory speed profiles and instantaneous displacement from the MtrackJ point output.
For each given condition, convert and plot the parameters into an empirical distribution function (Figures 4C-4E).
Video 2. Tracking of microglial processes.
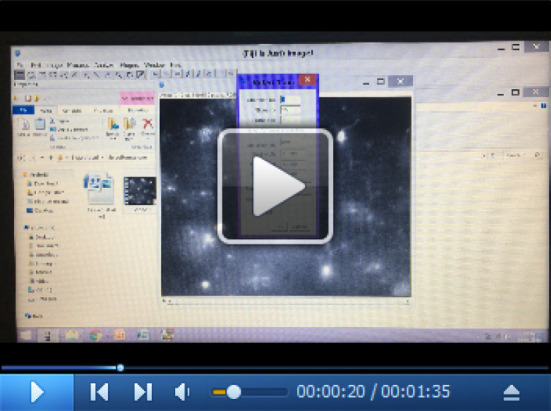
In the video, we report an example of tracking analysis of microglial process movement using the MTrackJ plug-in.
Figure 4. Analysis of microglia movement in Cx3cr1+/GFP mice.
A. Schematic showing the length and displacement of a moving process. B. Representative images of trajectory plots, plotted starting at the center. C-E. Plots representing the distribution of velocity (C), length (D) and displacement (E) of the individual tracks shown in B (adapted from Basilico et al., 2019 ).
Notes
Important considerations:
To visualize microglia in brain slices it is essential to use transgenic mouse lines in which microglial cells are fluorescent. In our case, we used mice in which the Cx3cr1 gene (specifically expressed by microglia in the nervous system) has been replaced by the green fluorescent protein (GFP) construct.
-
Image drift might occur during image acquisition. If videos slightly drift during acquisition this movement can be corrected and/or eliminated by aligning consecutive frames using StackRegplug-in of ImageJ. To do so:
Install the following Plug-Ins:StackReg: http://bigwww.epfl.ch/thevenaz/stackreg/ (written by Philippe Thévenaz)TurboReg: http://bigwww.epfl.ch/thevenaz/turboreg/ (written by Philippe Thévenaz)
Open the video in FIJI and perform the following steps: Plugins > StackReg > Transformation > Rigid body > ok.
Recipes
-
Stock ACSF solution 10x (500 ml, store at 4 °C)
NaCl 1,250 mM
KCl 25 mM
CaCl2 20 mM
MgCl2 10 mM
NaH2PO4 12.5 mM
-
ACSF 1x (1 L; for slicing, recovery and experiment)
Stock ACSF
Glucose 11 mM
NaHCO3
Verify osmolarity to 295-305 mOsm
Acknowledgments
This protocol was adapted from Basilico et al. (2019). The work leading to this protocol was supported by AIRC (MFAG 2015, ID. 16803 project, to B.C.), the CrestOptics-IIT JointLab for Advanced Microscopy (to S.D.A.), the MARBEL Life 2020 grant (to S.D.A.); the SynaNet H2020 Program (to S.D.A. and D.R.).
The authors wish to thank PhD V. de Turris at the Center for Life Nano Science Imaging Facility, Istituto Italiano di Tecnologia, for support and technical advice on microscopy and image analysis.
Competing interests
The authors declare no competing interests.
Ethics
Procedures using laboratory animals were in accordance with the Italian and European guidelines and were approved by the Italian Ministry of Health in accordance with the guidelines on the ethical use of animals from the European Communities Council Directive of September 20, 2010 (2010/63/UE). All efforts were made to minimize suffering and number of animals used.
Citation
Readers should cite both the Bio-protocol article and the original research article where this protocol was used.
References
- 1. Basilico B., Pagani F., Grimaldi A., Cortese B., Di Angelantonio S., Weinhard L., Gross C., Limatola C., Maggi L. and Ragozzino D.(2019). Microglia shape presynaptic properties at developing glutamatergic synapses. Glia 67(1): 53-67. [DOI] [PubMed] [Google Scholar]
- 2. Davalos D., Grutzendler J., Yang G., Kim J. V., Zuo Y., Jung S., Littman D. R., Dustin M. L. and Gan W. B.(2005). ATP mediates rapid microglial response to local brain injury in vivo. Nat Neurosci 8(6): 752-758. [DOI] [PubMed] [Google Scholar]
- 3. Hanisch U. K. and Kettenmann H.(2007). Microglia: active sensor and versatile effector cells in the normal and pathologic brain. Nat Neurosci 10(11): 1387-1394. [DOI] [PubMed] [Google Scholar]
- 4. Hristovska I. and Pascual O.(2016). Deciphering resting microglial morphology and process motility from a synaptic prospect. Front Integr Neurosci 9: 73. [DOI] [PMC free article] [PubMed] [Google Scholar]
- 5. Jung S., Aliberti J., Graemmel P., Sunshine M. J., Kreutzberg G. W., Sher A. and Littman D. R.(2000). Analysis of fractalkine receptor CX(3)CR1 function by targeted deletion and green fluorescent protein reporter gene insertion. Mol Cell Biol 20(11): 4106-4114. [DOI] [PMC free article] [PubMed] [Google Scholar]
- 6. Lee J. E., Liang K. J., Fariss R. N. and Wong W. T.(2008). Ex vivo dynamic imaging of retinal microglia using time-lapse confocal microscopy. Invest Ophthalmol Vis Sci 49(9): 4169-4176. [DOI] [PMC free article] [PubMed] [Google Scholar]
- 7. Lee S., Varvel N. H., Konerth M. E., Xu G., Cardona A. E., Ransohoff R. M. and Lamb B. T.(2010). CX3CR1 deficiency alters microglial activation and reduces beta-amyloid deposition in two Alzheimer's disease mouse models. Am J Pathol 177(5): 2549-2562. [DOI] [PMC free article] [PubMed] [Google Scholar]
- 8. Meijering E., Dzyubachyk O. and Smal I.(2012). Methods for cell and particle tracking. Methods Enzymol 504: 183-200. [DOI] [PubMed] [Google Scholar]
- 9. Nimmerjahn A., Kirchhoff F. and Helmchen F.(2005). Resting microglial cells are highly dynamic surveillants of brain parenchyma in vivo. Science 308(5726): 1314-1318. [DOI] [PubMed] [Google Scholar]
- 10. Rogers J. T., Morganti J. M., Bachstetter A. D., Hudson C. E., Peters M. M., Grimmig B. A., Weeber E. J., Bickford P. C. and Gemma C.(2011). CX3CR1 deficiency leads to impairment of hippocampal cognitive function and synaptic plasticity. J Neurosci 31(45): 16241-16250. [DOI] [PMC free article] [PubMed] [Google Scholar]
- 11. Sellner S., Paricio-Montesinos R., Spiess A., Masuch A., Erny D., Harsan L. A., Elverfeldt D. V., Schwabenland M., Biber K., Staszewski O., Lira S., Jung S., Prinz M. and Blank T.(2016). Microglial CX3CR1 promotes adult neurogenesis by inhibiting Sirt 1/p65 signaling independent of CX3CL1. Acta Neuropathol Commun 4(1): 102. [DOI] [PMC free article] [PubMed] [Google Scholar]
- 12. Tremblay M. E., Lowery R. L. and Majewska A. K.(2010). Microglial interactions with synapses are modulated by visual experience. PLoS Biol 8(11): e1000527. [DOI] [PMC free article] [PubMed] [Google Scholar]
- 13. Wake H., Moorhouse A. J., Jinno S., Kohsaka S. and Nabekura J.(2009). Resting microglia directly monitor the functional state of synapses in vivo and determine the fate of ischemic terminals. J Neurosci 29(13): 3974-3980. [DOI] [PMC free article] [PubMed] [Google Scholar]


