Abstract
Mitochondria generate 90% of the energy required to sustain life. As a result, loss of mitochondrial function compromises almost every facet of human physiology. Accordingly, most mitochondrial diseases tend to present themselves as complex, multi-systemic disorders that can be difficult to diagnose. Depending on the severity of the mitochondrial dysfunction, the pathology can range from mild discomfort to severe epilepsy, blindness and paralysis. To develop therapies to these diseases, it will be important to optimize experimental techniques that can reliably quantify mitochondrial function, particularly in live cells or intact organisms. Here, we describe how a Seahorse XF24 Analyzer can be used to measure both basal and maximal respiration in the nematode Caenorhabditis elegans, and how this data can be interpreted to evaluate mitochondrial function.
Keywords: Oxygen consumption, Mitochondria, C. elegans, Seahorse XF24, Maximal respiration capacity, FCCP
Background
Energy animates life. Most of the energy that fuels our bodies is generated by mitochondria, small double-membraned organelles that are frequently called the powerhouses of our cells. Along the inner membrane of these organelles, mitochondria house all of the machinery required for energy production. Part of this machinery is encoded by the mitochondrial genome (mtDNA), a small, circular molecule that encodes various subunits of the electron transport chain. Since the discovery of this genome, it has been found that various insults, including exposure to toxins and age-related stress can result in genetic mutations that perturb mitochondrial function (Wallace, 2005). Typically, these genetic anomalies result in decreased energy production, which can drive pathology in a wide variety of tissues and manifest itself at different ages with varying degrees of severity (Wallace, 2005). For example, inherited mtDNA mutations can result in premature deafness, myopathy, or severe encephalomyopathy in children (Saneto and Sedensky, 2013), while age-related mutations contribute to neurodegeneration ( Kraytsberg et al., 2006 ) and muscle wasting ( Wanagat et al., 2001 ) in aging adults. Unfortunately, there are currently no cures for any disease that are caused by mtDNA mutation or depletion.
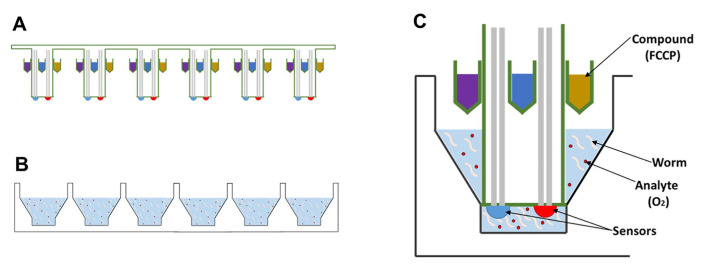
In order to develop therapies for these diseases, and to better understand the basic biology that underlies mitochondrial function, it will be essential to develop tools that can accurately assess mitochondrial health. Ideally, these tools would be able to measure mitochondrial function in whole cells or animals, so that the effect of pharmacological manipulations can be observed in real time. One of the most successful instruments for the analysis of live cells is the Seahorse XF Analyzer. This instrument was originally designed to record the oxygen consumption rate (OCR) of adherent cells, which serves as a proxy for mitochondrial respiration. In addition, it can record the extracellular acidification rate (ECAR) of the cells, which is a proxy for their glycolytic flux. Both of these parameters can be monitored in real-time in an 8, 24 or 96-well plate, so that multiple cell lines can be tested simultaneously. Moreover, each well of the 8, 24 and 96-well plates is equipped with 4 ports, each of which can hold a separate solution (Figure 1). Each of these solutions can be injected into the wells on demand and subsequently mixed into the solution, so that the cells can be exposed to multiple reagents in succession. This setup is ideal for interrogating individual components of the electron transport chain with oligomycin, FCCP and rotenone. Finally, all of these steps can be pre-programmed, so that the entire protocol can be ran with a single touch of a button.
Figure 1. Schematic of the Seahorse XF bio-analyzer plates.
Side-view of the (A) sensor cartridge and the (B) cell culture microplate, which will house the animals, are packaged separately. C. Each probe contains 4 injection ports which can be used to add compounds, such as FCCP, and two sensors for oxygen levels and the pH of the solution.
Therefore, we decided to adapt the Seahorse XF bio-analyzer to measure oxygen consumption in C. elegans. Theoretically, other tools might be adapted for this purpose as well, including the Clark electrode; however, these tools tend to be more labor intensive and a better fit for experiments on high-quality mitochondrial extracts. There is one important drawback to the Seahorse XF bio-analyzer as well though. Oxygen consumption measurements with this instrument require a solid-state sensor to be lowered into the wells containing the samples. The proximity of this probe to the samples creates a transient microchamber in which changes in the concentration of oxygen (OCR) and protons (ECAR) can be measured (Figure 1C), which means that these measurements are only accurate if the samples are directly underneath the probe. This requirement creates a problem in the context of worm biology, because the worms are highly mobile, and actively swimming in and out of the microchamber. As a result, it is important for a substantial amount of worms to be present in the well, to ensure that one, or a few worms are always present in the microchamber. To compensate for the remaining variation, multiple replicates must be used of each sample, and numerous measurements must be made for each condition or timepoint. Because the 24-well format of the Seahorse provides a good balance between the number of worms that can be assayed, as well as the number of replicates that can be monitored, we decided to use the Seahorse XF24 instrument for our experiments. Here, we provide a protocol to determine the basic and maximum oxygen consumption rate of mitochondria in intact worms using the XF24 Seahorse Analyzer. This protocol can be used by any researcher with access to the instrument, because it only requires tools to manipulate worms and a microscope equipped with a camera to count them. In doing so, researchers will be able to marry the genetic flexibility of the nematode C. elegans to a powerful screening tool for mitochondrial health and bio-energetic flux. This combination provides a great opportunity to identify novel genetic, biochemical and pharmacological modifiers of mitochondrial function.
Materials and Reagents
1,000 μl pipette tips (Neptune, catalog number: 89425-640)
200 μl pipette tips (Neptune, catalog number: 89140-900)
10 μl pipette tips (Neptune, catalog number: 89140-900)
1.5 ml microcentrifuge tubes (VWR, catalog number: 20170-650)
60 mm Petri dish (Santa Cruz Biotechnology, catalog number: 351863)
25 ml serological pipet (VWR, catalog number: 89130-900)
0.22 μm filter (Corning, catalog number: 430767)
Caenorhabditis elegans (N2, wildtype from CGC)
Triton X-100 (Fisher Scientific, catalog number: AC327371000)
NaCl (Fisher Scientific, catalog number: BP358-1)
Yeast Extract (BD, catalog number: 212750)
Tryptone (BD, catalog number: 211705)
Peptone (BD, catalog number: 211677)
Agar (BD, catalog number: 214530)
Ethyl Alcohol 200 proof (Greenfield Global, catalog number: 111000200)
Cholesterol (5 mg/ml in 200 proof ethyl alcohol) (Sigma-Aldrich, catalog number: C8667-1G)
CaCl2 (1 M, filter sterile) (VWR, catalog number: 97062-590)
MgSO4 (1 M, filter sterile) (VWR, catalog number: IC191422.5)
KH2PO4 (1 M, filter sterile) (VWR, catalog number: 71003-456)
K2HPO4 (1 M, filter sterile) (VWR, catalog number: 470009-788)
Na2HPO4 (VWR, catalog number: 470302-662)
Dimethyl Sulfoxide (DMSO) (VWR, catalog number: 97061-250)
Carbonyl cyanide-p-trifluoromethoxyphenylhydrazone (FCCP) (192 μM in DMSO) (Sigma-Aldrich, catalog number: C2920-10MG)
Potassium phosphate buffer (see Recipes)
M9 Buffer (see Recipes)
LB Broth for OP50 bacteria (see Recipes)
NGM plates (see Recipes)
Equipment
1 ml pipetman (Eppendorf, catalog number: 3123000063)
200 μl pipetman (Eppendorf, catalog number: 3124000083)
20 μl pipetman (Eppendorf, catalog number: 3124000032)
Seahorse Extracellular Flux Analyzer (XFe24 Analyzer) (Agilent)
-
Seahorse XF24 FluxPak (Agilent, catalog number: 100850-001)
Note: It contains 18 XF24 sensor cartridges, 20 XF24 cell culture microplates, and 1 bottle of Seahorse XF Calibrant Solution 500 ml.
20 °C Incubator (VWR, catalog number: 10753-894)
Pipette Controller (Brandtech Scientific Inc., catalog number: 26333)
Software
Seahorse XF24 Analyzer Software (Agilent)
Microsoft Excel or any other spreadsheet program required for post-experimental analysis.
Procedure
Note: To measure oxygen consumption, we adapted a published protocol (Dancy et al., 2016).
Grow worms at 20 °C on NGM plates spotted with OP50. Pick 300 L4-staged worms per condition to synchronize the experimental animals and age them as desired. The experimental animals should be at least in their second generation of being grown in an uncrowded, unstarved and uncontaminated environment.
-
Prior to the day of the experiment
-
Calibrate the sensor cartridges
The sensor cartridge has three parts: the lid, the cartridge itself containing probes on the bottom and ports for adding drugs on top, and the 24-well plate where the cartridge is placed in. Add 1 ml of calibrant solution into each well of the 24-well plate and incubate the plate at 37 °C overnight.
Make sure the heater on the Seahorse XF24 is turned off. Ideally, the temperature of the room where the experiment will be performed in should ideally not exceed 20 °C, and certainly not higher than 23 °C, to prevent the worms from receiving a heat-shock.
-
-
On the day of the experiment
If assessing basal respiration only, start with Step B2. To assess maximal respiration, use the mitochondrial oxidative phosphorylation uncoupler FCCP, no other drugs are necessary. Pipet 75 μl of 192 μM FCCP into one of the 4 ports available for each well (Figure 2). For simultaneous release of FCCP into each well, distribute FCCP into the same port for each well (Figure 2). While wild-type worms will respond to this dose of FCCP, some optimization may be required for mutant strains.
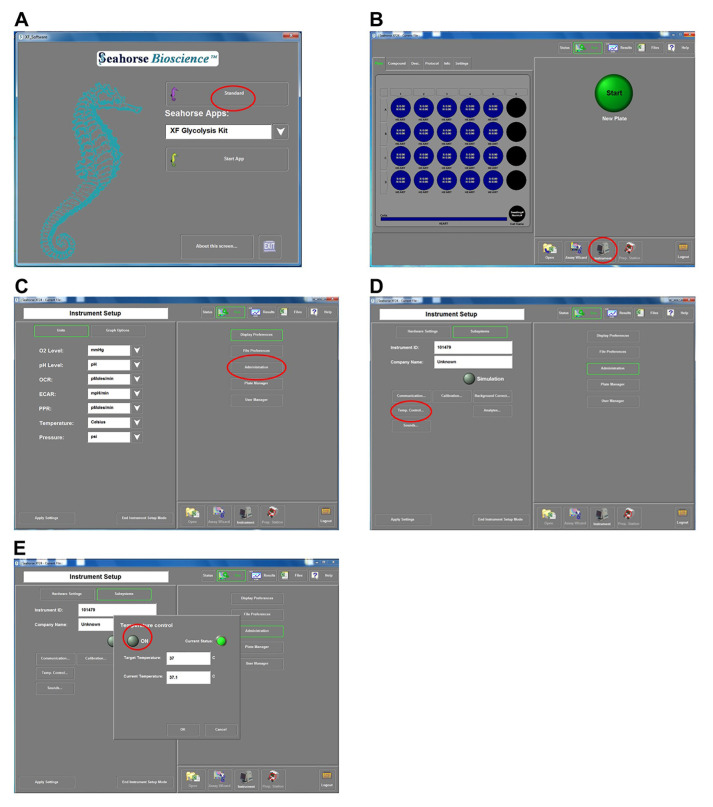
Make sure the equipment is at room temperature and the heater is turned off (Figure 3).
Run the calibration program with the cartridge.
Prepare the XF24 cell culture microplates by adding 450 μl of M9 into each well.
-
Prepare worms:
Worms tend to stick to plastics, so it is always necessary to wash the plastic pipet tips and centrifuge tubes with 0.1% Triton X-100 in M9 prior to aspirating and ejecting worms.
Pre-wash centrifuge tube by adding 1 ml 0.1% Triton X-100 in M9. Remove the solution and replace it with 1 ml M9 using 1000 μl plastic pipette tips.
Pick 300 worms into a microcentrifuge tube.
Gently pipet the worms to dissolve bacterial clumps that were transferred with the worms.
Let the worms settle by gravity to the bottom of the 1.5 ml microcentrifuge tube and remove as much of the M9 buffer and bacteria as possible.
Add 1 ml M9 buffer and repeat Steps B5c and B5d twice. Keep the supernatant of the last wash which will be used as control for Step B5i.
Add 600 μl of M9 buffer to the worms.
Cut off the end of a 200 μl tip to create a wide bore tip. Rinse it in 0.1% Triton M9 buffer by pipetting up and down in the solution.
Flick the tube gently to mix worms. Pipet 50 μl into a well of the XF24 cell culture microplates. Remember to flick the worms every time prior to pipetting them into the well. Each sample should be divided into 5 wells containing approximately 50 worms each.
-
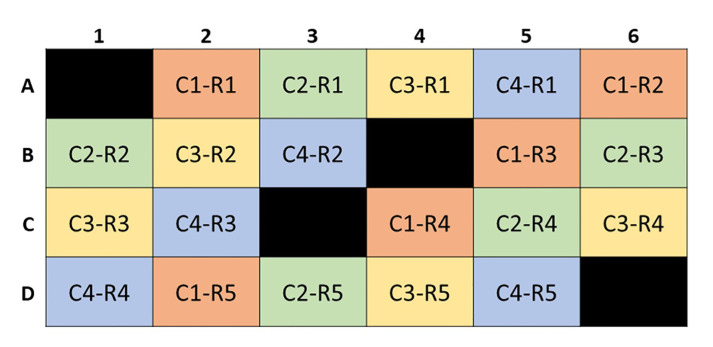
Arranging the samples in the XF24-well plate.
Take an image of each well with worms to register the exact number of worms in each well at 20x magnification. Ideally, there should be between 50 and 70 worms. Less than 50 worms may result in greater variability and more than 70 worms in a well may result in an inaccurate assessment of the number of worms per well.
Leave the worms at 20 °C for one hour.
-
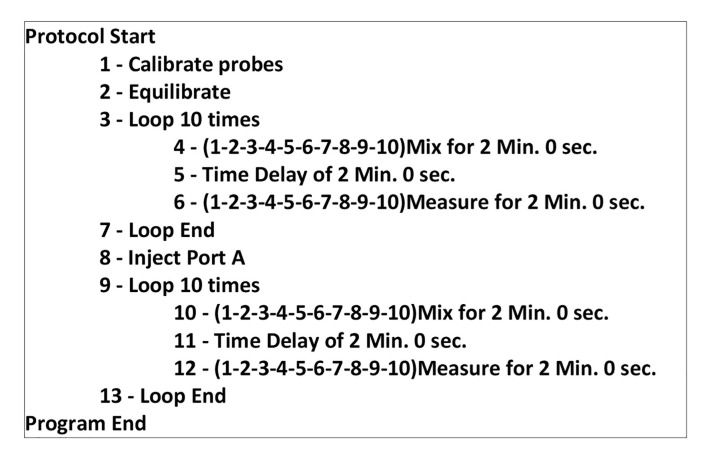
Set up the program on the XF24 Analyzer as follows (Figure 5):
Ten cycles of 2 min mixing, 2 min resting, 2 min reading.
When assessing maximal capacity, add a step to inject the ports and add 10 cycles of 2 min mixing, 2 min resting, 2 min reading.
Figure 2. Schematic of the probe plate.
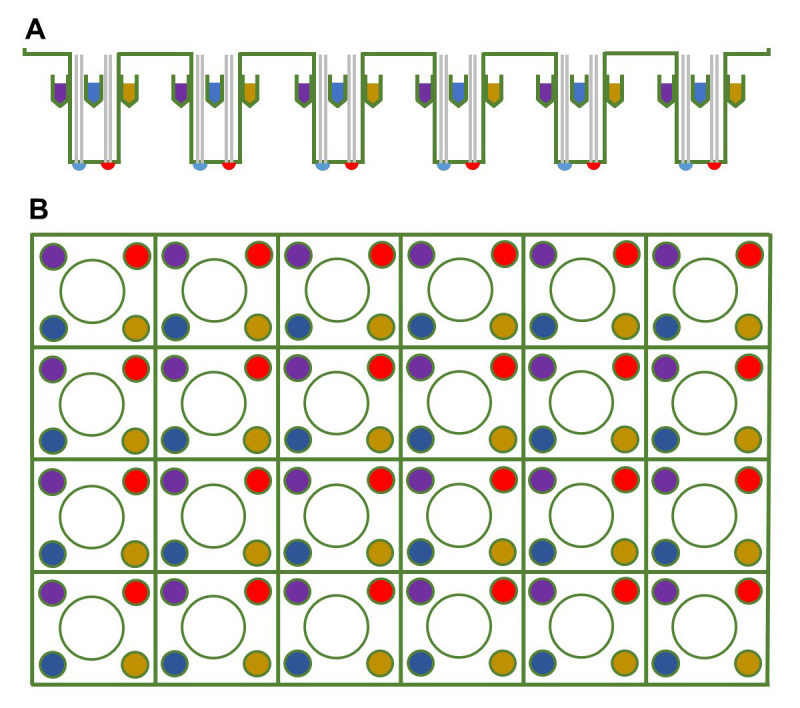
The (A) side-view and (B) top-view of the 24-well sensor cartridge, where the sensor is in the center and the injection ports for compounds are in the periphery of each well. Pick the same injection port, which would be the ports of the same color, for each well when adding a compound.
Figure 3. Instructions to turn off the heater in the Seahorse X24.
A. This screen appears once the program opens. Select the “Standard” mode (red circle), which opens the screen in (B). B. Select “Instrument” (red circle), which opens the screen in (C). C. Select “Administration” (red circle), which opens the screen in (D). D. Select “Temp. Control” (red circle), which opens the screen in (E). In this final screen, the circle next to “ON” should be clicked until it appears dim, similar to the figure, and then select “ok” on that screen.
Figure 4. A sample XF24 well plate with empty control wells A1, B4, C3 and D6.
This mock plate contains 4 different conditions [C1 (orange), C2 (green), C3 (yellow), and C4 (orange)] with 5 replicates each (R1, R2, R3, R4, R5).
Figure 5. Seahorse XF24 protocol for acquiring maximal respiratory capacity.
Note that when assessing basal respiration only, steps 8-13 should be removed.
Data analysis
In order to analyze the data from the XF24 Analyzer Software, export the results into Microsoft Excel format and perform the following steps below in Microsoft Excel:
Normalize oxygen consumption values per well that is generated by the software to the number of worms for each time-point per well.
-
To obtain the basal respiration rate:
-
For each well, average the oxygen consumption rate per well per worm (as calculated in step 1 of Data Analysis) for cycles 3 or 4 to 10.
Note: The first two to three readings may be skipped because as worms adjust to their new environment, the initial readings may be noisy.
Average the basal respiration rate of all 5 wells per condition.
The data can be represented as bar graphs with the mean ± SEM when at least three technical replicates are included. Unpaired t-test can be performed to determine significance.
-
-
To obtain the maximal respiration capacity:
For each well, average the oxygen consumption rate for cycles 3 or 4 to 10.
Then for each well, identify the peak response in the ten readings after addition of FCCP.
Average the oxygen consumption rate of the peak reading and the two readings before and after it.
Divide the average oxygen consumption rate obtained in the previous step with the oxygen consumption rate obtained in step (a).
Average the maximal respiration capacity of all 5 wells per condition. The data can be represented as bar graphs with the mean ± SEM when at least three technical replicates are done. Unpaired t-test can be performed to determine significance.
-
Control to measure the effects of the residual bacteria on oxygen consumption rates.
-
Effects of the bacteria on oxygen consumption rates determined by the XF24 Analyzer software.
The second wash from the preparation of worms in step B5e was collected and run on wells to compare to the respiration of the animals that were washed.
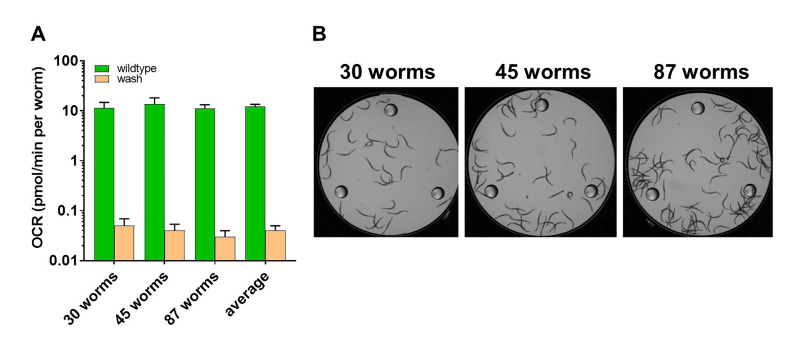
Figure 6 shows that the basal rate of oxygen consumption in the wells with the residual bacteria in the second wash is less than 0.003% of the oxygen consumption of individual worms in the wells. The figure shows the oxygen consumption rate of the worms and the residual bacteria in the second wash on a logarithmic scale in order to make the values visible.
-
Effects of varying number of animals per well:
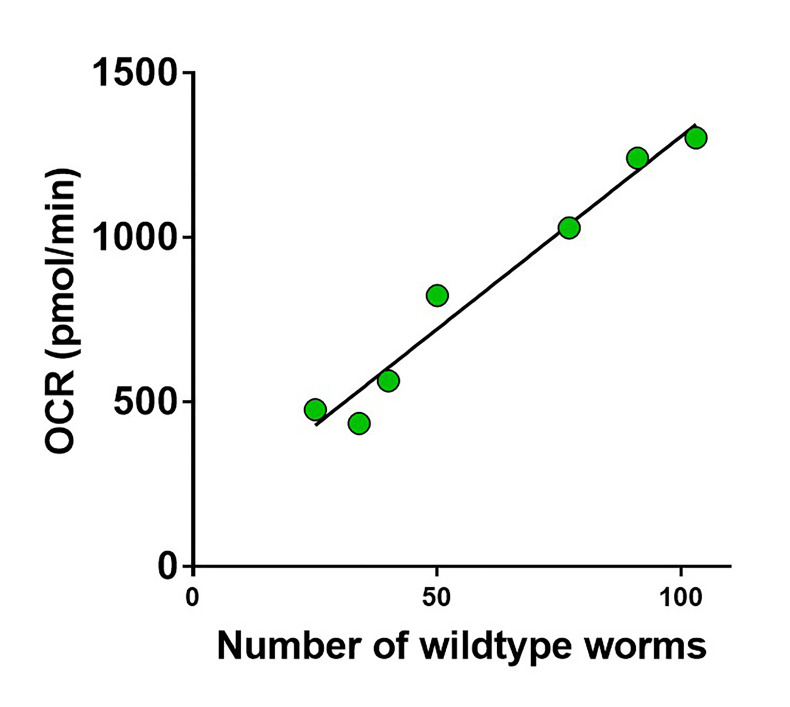
Varying number of animals were placed in the wells and the basal oxygen consumption rate was determined.
Figure 7 shows that there is a strong correlation between the oxygen consumption rate and the number of animals per well.
-
Figure 6. Residual bacteria in the preparation of worms have minor impact on respiration measurements.
A. A logarithmic scale was used to visualize the oxygen consumption rate per worm (OCR) in the wells containing worms (green) and the wells containing residual bacteria (orange). The average of ten readings per well and the standard deviation is represented. The last columns indicate the average of the data from the three wells containing 30, 45 and 87 worms. B. Image of the wells containing the worms that were assayed in (A).
Figure 7. The basal respiration is linearly related to the number of 5-day old wildtype worms per well.
Recipes
-
Potassium phosphate buffer
Add enough 1 M K2HPO4 to 400 ml of 1 M KH2PO4 to obtain a pH 6.0 solution
Note: The amount of 1 M K2HPO4 may vary each time the solution is made.
-
M9 Buffer
Add 3 g KH2PO4, 6 g Na2HPO4, 5 g NaCl, 1 ml 1 M MgSO4 and bring up the solution to 1 L with distilled water
Filter sterilize the solution using 0.22 μm filter (Corning)
-
LB Broth for OP50 bacteria (OP50 from CGC)
Add 10 g NaCl, 5 g Yeast Extract, 10 g Tryptone to 1 L of distilled water
Sterilize by autoclaving for 20 min
Do not use any antibiotics
-
NGM plates
Add 3 g of NaCl, 2.5 g peptone, 17 g of agar to 1 L of distilled water
Sterilize by autoclaving for 20 min
Cool the media to 55 °C
Add 1 ml of 5 mg/ml cholesterol, 1 ml of 1 M CaCl2, 1 ml of 1 M MgSO4, and 25 ml of phosphate potassium buffer
Mix and pour 10 ml into 60 mm dishes
Start overnight cultures of OP50 in LB broth shaking at 200 rpm in a 37 °C incubator with NO antibiotics
The next day, spot 4-5 drops of the overnight cultures of OP50 using a 25 ml serological pipet
Acknowledgments
This work was supported by grants from the NIH (R01-GM124532 to M.V.; CA204894 and ES026222 to J.H.B.), a grant from NIEHS (T32-ES019851 to C.F.), and a pilot award from UPenn (FP20457 to M.V.).
Competing interests
The contents of this publication do not necessarily represent the official views of the NIH.
Citation
Readers should cite both the Bio-protocol article and the original research article where this protocol was used.
References
- 1. Dancy B. M., Brockway N., Ramadasan-Nair R., Yang Y., Sedensky M. M. and Morgan P. G.(2016). Glutathione S-transferase mediates an ageing response to mitochondrial dysfunction. Mech Ageing Dev 153: 14-21. [DOI] [PMC free article] [PubMed] [Google Scholar]
- 2. Kraytsberg Y., Kudryavtseva E., McKee A. C., Geula C., Kowall N. W. and Khrapko K.(2006). Mitochondrial DNA deletions are abundant and cause functional impairment in aged human substantia nigra neurons. Nat Genet 38(5): 518-520. [DOI] [PubMed] [Google Scholar]
- 3. Saneto R. P. and Sedensky M. M.(2013). Mitochondrial disease in childhood: mtDNA encoded. Neurotherapeutics 10(2): 199-211. [DOI] [PMC free article] [PubMed] [Google Scholar]
- 4. Wallace D. C.(2005). A mitochondrial paradigm of metabolic and degenerative diseases, aging, and cancer: a dawn for evolutionary medicine. Annu Rev Genet 39: 359-407. [DOI] [PMC free article] [PubMed] [Google Scholar]
- 5. Wanagat J., Cao Z., Pathare P. and Aiken J. M.(2001). Mitochondrial DNA deletion mutations colocalize with segmental electron transport system abnormalities, muscle fiber atrophy, fiber splitting, and oxidative damage in sarcopenia. FASEB J 15(2): 322-332. [DOI] [PubMed] [Google Scholar]


