

Abstract
Mitochondrial function and dysfunction are at the core of aging and involved in many age-dependent diseases. Rate of oxygen consumption is a measure of mitochondrial function and energy production rate. The nematode Caenorhabditis elegans (C. elegans) offers an opportunity to study “living” mitochondria without the need for mitochondrial extraction, purification and associated artifacts. Oxygen consumption rate (OCR) is traditionally measured using single-chamber Clark electrodes with or without the addition of metabolic modulators. More recently, multi-well oxygen electrodes with automated injection system have been developed to enable rapid measurement of OCR under different conditions. Here, we describe a detailed protocol that we have adapted from existing protocols to measure coupled and uncoupled mitochondrial respiration (with and without metabolic modulators) in live respiring nematodes using a Seahorse XFe96 extracellular flux analyzer. We present details on our protocol, including preparation of nematode culture, use of metabolic modulators, execution of Seahorse XF assay as well as post-experimental data analysis. As a reference, we provide results of a series of experiments in which the metabolic activity of N2 wild-type nematodes was compared to N2 nematode treated with paraquat, a compound that generates reactive oxygen species (ROS), thus causing oxidative damage and mitochondrial dysfunction. These data illustrate the kind of insights that can be obtained even using a low number of nematodes (10 animals only per well).
Keywords: C. elegans, Nematodes, Mitochondrial respiration, Mitochondrial metabolism, Seahorse XF analyzer, Oxygen consumption rate, Oxidative phosphorylation, Metabolic modulators
Background
One key function of mitochondria is to produce adenosine triphosphate (ATP) via oxidative phosphorylation. Electrons are transferred along mitochondrial respiratory chain complexes with oxygen being the terminal electron acceptor ( Voet et al., 2002 ). OCR is often used as proxy for energy production rate ( Braeckman et al., 2002 ; Gruber et al., 2011 ; Fong et al., 2017 ). The development of multi-well oxygen electrodes with an automated injection system permits the study of up to 96 samples with automated addition of metabolic modulators during a single run. Due to the small volume of the chambers, OCR can also be established in live respiring C. elegans with only a small number of nematodes (10 animals per well), e.g., using the Seahorse XFe96 analyzer. Automated addition of mitochondrial uncoupler can be used to short-circuit mitochondrial membrane potential and accelerate transport of protons across the membrane thus permitting the observation of maximal respiratory capacity ( Koopman et al., 2016 ; Fong et al., 2017 ; Huang and Lin, 2018). However, unlike in isolated cells, ATP synthase inhibitor does not have effect in C. elegans, at least in our case. Therefore, there is no measurement of ATP-linked respiration and proton leak, although others have suggested it may work in C. elegans but we cannot make this to work consistently ( Luz et al., 2015 ). Temperature is another technical limitation in this assay as there is no temperature control in the Seahorse XF analyzer; the experiment has to be dependent on the environmental temperature where the XF analyzer is placed. Below, we will discuss details of the protocol used in our laboratory and also present our post-experimental data analysis and normalization workflow.
Materials and Reagents
Pipette tips
XFe96 sensor cartridges and tissue culture microplates (Agilent Technologies, Seahorse Bioscience, catalog number: 101085-004)
50 ml centrifuge tube (Greiner Bio-One, catalog number: 210261)
Parafilm (Bemis, catalog number: HS234526C)
C. elegans N2 Bristol (Caenorhabditis Genetics Center)
OP50-1 E. coli bacteria (Caenorhabditis Genetics Center)
Paraquat (Sigma-Aldrich, catalog number: 36541)
Carbonyl cyanide 4-(trifluoromethoxy) phenylhydrazone (FCCP) (Sigma-Aldrich, catalog number: C2920)
Sodium azide (Sigma-Aldrich, catalog number: C2002)
Dimethyl Sulfoxide (DMSO) (Sigma-Aldrich, catalog number: D2650)
XF calibrant (Agilent Technologies, Seahorse Bioscience, catalog number: 100840-000)
XFe96 Extracellular Flux Assay Kit (Agilent Technologies, Seahorse Bioscience, catalog number: 101085-004)
NaCl (Sigma-Aldrich, catalog number: S5886)
Bacto agar (BD Biosciences, catalog number: 214010)
Bacteriological peptone (Sigma-Aldrich, catalog number: 91249)
MgSO4 (Sigma-Aldrich, catalog number: M2643)
CaCl2 (Sigma-Aldrich, catalog number: C5670)
Cholesterol (Sigma-Aldrich, catalog number: C8667)
Streptomycin (Sigma-Aldrich, catalog number: S9137)
K2HPO4 (Sigma-Aldrich, catalog number: P3786)
KH2PO4 (Sigma-Aldrich, catalog number: P5655)
Na2HPO4 (Sigma-Aldrich, catalog number: S7907)
NaOH (Sigma-Aldrich, catalog number: S8045)
Nematode growth medium (NGM) agar (see Recipes)
M9 buffer (see Recipes)
Hypochlorite solution for worm synchronization (see Recipes)
1 M KPO4 (see Recipes)
Equipment
Extracellular Flux Analyzer (Agilent Technologies, Seahorse Bioscience, model: XFe96)
Non-CO2 incubator (Aqualytic, model: TC445S)
Software
Seahorse Wave controller software (Agilent Technologies, Seahorse Bioscience)
Prism 8 (GraphPad Software, www.graphpad.com)
Procedure
-
Synchronization of nematode population (Day 0)
Synchronize a plate of young adult nematodes with eggs (about 500 animals) using standard hypochlorite approach (Stiernagle, 2006).
-
Growth of nematode population (Days 1 to 3)
Maintain synchronized cohort consisting about 500 larvae in a 94 mm NGM agar plate in a 20 °C incubator until they reached adulthood (the synchronized wild-type L1 animals will reach young adult stage in about 50 h at 20 °C).
The day before transferring the young adult nematodes to the paraquat treatment plate, prepare the 10 mM paraquat treatment plate in advance by adding paraquat to the sterile NGM agar at 55 °C, and pour the NGM agar into a 94 mm plate and let the agar solidify. Seed the NGM agar plate with OP50-1 mixed with paraquat, dry the bacteria and keep the plate at 4 °C.
-
Paraquat treatment (Day 3)
Transfer half of the young adults (about 250 nematodes) to paraquat treatment plate.
-
Pick worms for assay (Day 4)
Pick the adult worms from control and treatment plates for oxygen measurement.
-
Mitochondrial metabolic flux measurement
Hydrate an XFe96 sensor cartridge (Day 3):
Aliquot 20 ml of Seahorse XF Calibrant into a 50 ml centrifuge tube.
Place the centrifuge tube containing 20 ml of Seahorse XF calibrant in a non-CO2 37 °C incubator.
-
To hydrate the sensor cartridge of the XFe96 Extracellular Flux Assay Kit (Refer to Figure 1A)
Remove the sensor cartridge from the utility plate and place the sensor cartridge upside down to make sure that the sensors do not contact with the surface of the lab bench.
Add 200 μl of sterile water into each well of the utility plate.
Lower the sensor cartridge onto the utility plate to submerge the sensors in water.
Place the assembled sensor cartridge and utility plate in non-CO2 37 °C incubator overnight. If sensor cartridge is being hydrated more than 24 h, wrap parafilm around it to prevent evaporation. Hydrated sensor cartridge can be kept up to 72 h only.
Turn on the XFe96 controller (computer), XFe96 analyzer and start the wave controller software. Make sure the heater for the instrument is off and let the machine stabilize at room temperature or lower temperature overnight.
Day of Assay (Day 4)
-
Hydrate an XFe96 sensor cartridge (continue from Day 3)
Remove the assembled sensor cartridge and the tube containing 20 ml of the aliquoted XF Calibrant from the incubator.
Discard the water from the utility plate.
Add 200 μl of the overnight per-warmed XF Calibrant into each well of the utility plate.
Lower the sensor cartridge onto the utility plate to submerge the sensors in water.
Place the assembled sensor cartridge and utility plate back to the non-CO2 37 °C incubator for 45 min.
-
Preparation of drugs and loading of drugs into sensor cartridge injection ports
-
a
During the 45 min incubation time, prepare the carbonyl cyanide p-(trifluoromethoxy) phenylhydrazone (FCCP) and sodium azide to be loaded into the drug ports. The FCCP and sodium azide concentrations have been optimized as stated in Fong et al. (2017) .
-
b
Prepare a 2.5 mM stock of FCCP in 100% DMSO.
Prepare 500 μl of FCCP dilution in M9 buffer to 90 μM.
Refer to Table 1 for FCCP stock concentration and dilutions.
-
c
Prepare 5 M stock of sodium azide in MilliQ-H2O.
Prepare 500 μl of sodium azide dilution in MilliQ-H2O to 500 mM.
Refer to Table 2 for sodium azide stock concentration and dilutions.
-
d
After 45 min, load the compounds into the injection ports by using the A/D and B/C compound loading guide plates to dispense the compound into the injection port of the hydrated cartridge to prevent cross-contamination of compounds.
-
e
To load 25 μl of 90 μM FCCP into injection port A, place the A/D compound loading guide plate on top of the hydrate sensor cartridge. Make sure the letter A on the compound loading guide plate is located in the top left-hand corner. Use your thumb and index finger to hold the loading guide plate to secure it during loading so that the pipette tips do not dislodge from the loading guide plate. Refer to Figures 1B and 2 for the compound loading guide plates and the layout of the drug injection ports, respectively.
-
f
Similarly, use B/C compound loading guide plate to load 25 μl of 500 mM Sodium Azide into injection port B. Refer to Figures 1B and 2 for the compound loading guide plates and the layout of the drug injection ports, respectively.
-
g
Load the hydrated cartridge with 25 μl of 90 μM FCCP into port A and 25 μl of 500 mM Sodium Azide into Port B. Do not load the drugs into port A or B for well A1, A12, H1 and H12. Refer to Figures 1B and 2 for the compound loading guide plates and the layout of the drug injection ports, respectively.
Notes:
Ports A and B must be filled with the same volume of drugs or buffer. Ports C and D that are not in use can be kept empty.
Avoid creating air bubbles in the injection ports.
Do not tap the cartridge after loading the compounds to the injection ports as this will cause compound leakage from the injection port.
-
h
Load 25 μl of M9 buffer into Port A of well A1, A12, H1 and H12 and 25 μl of MilliQ H2O into Port B of well A1, A12, H1 and H12. Well A1, A12, H1 and H12 are blank wells used for background correction.
-
i
Place the hydrated cartridge onto the utility plate filled with XF calibrant.
-
j
Set up the protocol using the “Wave controller” software.
-
k
Carefully load the hydrated cartridge filled with compounds to the XFe96 seahorse analyzer.
-
l
Start the protocol to calibrate the hydrated sensor cartridge (approximately 40-50 min of calibration time).
-
a
-
Transferring of C. elegans
During the calibration time, pipette 200 μl of M9 buffer into each well of a fresh utility plate.
Transfer 10 worms using worm pick into each well. The experiment must be done with at least 6 replicates for each condition.
For each plate, include 6 wells with the same amount of OP50 (food for worms) only. This serves as the control to measure baseline OCR derived from bacteria inside the worm gut.
Refer to Figure 3 for plate layout below for the design of our experiment using N2 and N2 treated with 10 mM Paraquat.
-
Running the seahorse XF assay
Once the sensor cartridge calibration is completed, remove the calibration plate and replace with the utility plate containing worms in 200 μl of M9 buffer.
Remove the lid of the utility plate and place the plate into the XFe96 analyzer.
Start the equilibration.
After completing the equilibration, the assay will automatically begin to acquire baseline measurement according to the protocol that has been set earlier.
-
Use the protocol below to measure the mitochondrial respiration in C. elegans.
Basal Respiration measurement:
Loop 6 times
Mix for 3 min
Time delay for 2 min
Measure for 3 min
Loop end
Inject Port A:
Loop 6 times
Mix for 3 min
Time delay for 2 min
Measure for 3 min
Loop end
Inject Port B:
Loop 6 times
Mix for 3 min
Time delay for 2 min
Measure for 3 min
Loop end
At the end of the run, save the data in the default XF cell energy phenotype assay result file (*.asyr) which can only be viewed using the XF wave software. Export the data to excel file (*.xlsx) and GraphPad (.pzfx) file for further analysis.
Figure 1. Seahorse XFe96 sensor cartridge.

(A) Top green plate is the sensor cartridge and bottom transparent plate is the utility plate. (B) To load the compound, place the compound loading guide plate on top of the sensor cartridge submerged in the utility plate filled with XF calibrant. Directly pipette the compound into the desired column of the compound loading guide plate to load the compounds into the sensor cartridge. Switch to the B/C loading guide plate when loading injection Port B or C.
Table 1. FCCP stock and final concentration.
| FCCP | ||
| Stock Concentration | Concentration of diluent to add into the drug port |
Final Concentration in drug port |
| 2.5 mM | 90 μM | 10 μM |
Table 2. Sodium azide stock and final concentration.
| sodium azide | ||
| Stock Concentration | Concentration of diluent to add into the drug port |
Final Concentration in drug port |
| 5 M | 500 mM | 50 mM |
Figure 2. Layout of the drug injection ports in the XF sensor cartridge.
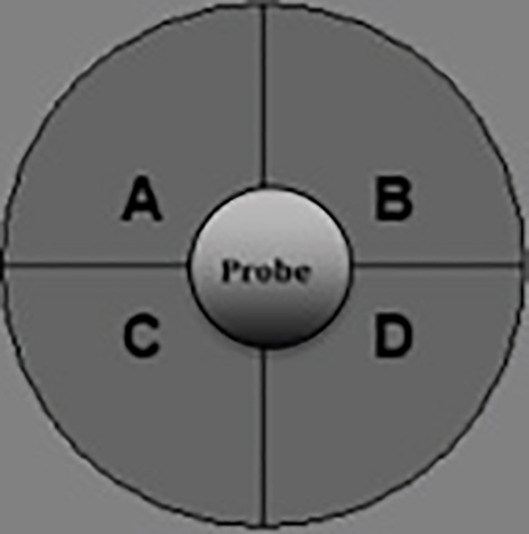
Figure 3. Plate layout for the design of our experiment using N2 and N2 treated with 10 mM Paraquat.

Data analysis
Results were initially viewed in the type of kinetic graph from the XFe Analyser, Figure 4.
Use the area under the curve of oxygen consumption rate (OCR), before and after the addition of compounds (FCCP followed by sodium azide) to determine basal respiration, maximal respiration and spare respiratory capacities.
Determine the basal respiration by determining the area under the curve (total OCR) from measurements 1 to 6 (prior to FCCP injection) by subtracting the non-mitochondrial respiration, area under the curve (total OCR) from measurements 13 to 18 (after sodium azide injection). Refer to Figure 5.
Determine the maximal respiration by determining the area under the curve (total OCR) from measurements 7 to 12 (prior to sodium azide injection) with subtracting the non-mitochondrial respiration 13 to 18 (after sodium azide injection). Refer to Figure 5.
Determine the spare respiration by determining the area under the curve (total OCR) from measurements 6 to 18 (prior to sodium azide injection) with subtracting the basal respiration at measurements 1 to 6. Refer to Figure 5.
Normalize the basal respiration, maximal respiration and spare respiratory capacities to the number of worms in each well (10 worms per well).
Normalize the actual basal respiration, maximal respiration and spare respiratory capacities to the bacterial respiration rate.
Plot the acquired data in bar graph to compare the respiration rate between treated and non-treated nematodes (Figures 6A-6C).
Figure 4. Kinetic OCR graph.

This experiment investigated mitochondrial metabolism in wild type N2, N2 treated with 10 mM Paraquat and oxygen consumption of bacteria used to culture the nematodes.
Figure 5. Typical example of OCR profiles from a Seahorse experiment performed with C. elegans, replotted from OCR of N2 in Figure 3.

Basal respiration rate was measured initially followed by FCCP injection, which allows the determination of the maximal and spare respiration rate.
Figure 6. Bar graph comparing basal (A), maximal (B) and spare respiration (C) of wild type N2 and N2 treated with 10 mM Paraquat after our normalization workflow and post-experimental analysis.

Data were plotted as means ± SEM, analyzed using Student’s t-test. In the figures, P values ≤ 0.01 are summarized as two asterisks, P values ≤ 0.0001 are summarized as four asterisks.
Notes
OCR values can differ between different runs due to different experimental conditions: time of worms in the buffer, changes in the temperature of the seahorse analyzer, different sensor cartridges, therefore, the experiment must be performed on the same plate.
There is no temperature control in the Seahorse XF analyzer, the heater has to be turned off and the analyzer has to be placed in a room with lower temperature. The experiment is now dependent on the environmental temperature and typically the temperature will increase by 2 to 4 °C during the run. We have tested the increase in the temperature and found that it does not cause significant effect in the OCR of the nematodes.
Recipes
-
Nematode growth medium (NGM) agar
For 1 L medium:
3.0 g NaCl
17.0 g Bacto agar
2.5 g Bacteriological peptone
Autoclave to sterilize the agar, cool to 55 °C then add:
1 ml 1 M MgSO4 (filter to sterilize)
1 ml 1 M CaCl2 (filter to sterilize)
1 ml 5 mg/ml cholesterol in absolute ethanol (filter to sterilize)
1 ml 200 mg/ml streptomycin (filter to sterilize)
25 ml 1 M KPO4 (Recipe 4)
-
M9 buffer (1 L)
3 g KH2PO4
6 g Na2HPO4
5 g NaCl
Autoclave, then add:
1 ml 1 M MgSO4 (filter to sterilize)
-
Hypochlorite solution for worm synchronization
Prepare household bleach (5% solution of sodium hypochlorite) and 5 N NaOH in the ratio of 2:1
-
1 M KPO4 (1 L)
108.3 g KH2PO4
35.6 g K2HPO4
H2O to 1 L
Filter to sterilize
Acknowledgments
We thank the Caenorhabditis Genetics Centre for the provision of worm strains. Financial assistance from the Grant IG17-LR005 and IG17-BS101 is also acknowledged.
Competing interests
The authors declare that there are no conflicts of interest or competing interests.
References
- 1. Braeckman B. P., Houthoofd K., De Vreese A. and Vanfleteren J. R.(2002). Assaying metabolic activity in ageing Caenorhabditis elegans . Mech Ageing Dev 123(2-3): 105-119. [DOI] [PubMed] [Google Scholar]
- 2. Fong S., Ng L. F., Ng L. T., Moore P. K., Halliwell B. and Gruber J.(2017). Identification of a previously undetected metabolic defect in the Complex II Caenorhabditis elegans mev-1 mutant strain using respiratory control analysis . Biogerontology 18(2): 189-200. [DOI] [PubMed] [Google Scholar]
- 3. Gruber J., Ng L. F., Fong S., Wong Y. T., Koh S. A., Chen C. B., Shui G., Cheong W. F., Schaffer S., Wenk M. R. and Halliwell B.(2011). Mitochondrial changes in ageing Caenorhabditis elegans--what do we learn from superoxide dismutase knockouts? PLoS One 6(5): e19444. [DOI] [PMC free article] [PubMed] [Google Scholar]
- 4. Huang S. H. and Lin Y. W.(2018). Bioenergetic health assessment of a single Caenorhabditis elegans from postembryonic development to aging stages via monitoring changes in the oxygen consumption rate within a microfluidic device . Sensors(Basel) 18(8). [DOI] [PMC free article] [PubMed] [Google Scholar]
- 5. Koopman M., Michels H., Dancy B. M., Kamble R., Mouchiroud L., Auwerx J., Nollen E. A. and Houtkooper R. H.(2016). A screening-based platform for the assessment of cellular respiration in Caenorhabditis elegans . Nat Protoc 11(10): 1798-1816. [DOI] [PMC free article] [PubMed] [Google Scholar]
- 6. Luz A. L., Rooney J. P., Kubik L. L., Gonzalez C. P., Song D. H. and Meyer J. N.(2015). Mitochondrial morphology and fundamental parameters of the mitochondrial respiratory chain are altered in Caenorhabditis elegans strains deficient in mitochondrial dynamics and homeostasis processes . PLoS One 10(6): e0130940. [DOI] [PMC free article] [PubMed] [Google Scholar]
- 7. Stiernagle T.(2006). Maintenance of C. elegans . In: Fay, D and Ambros, V(Eds.) WormBook: the online review of C. elegans biology. [DOI] [PMC free article] [PubMed] [Google Scholar]
- 8. Voet D., Voet J. G. and Pratt C. W.(2002). Fundamentals of Biochemistry: Life at the Molecular Level, 5th EditionVol.2John Wiley. [Google Scholar]