Abstract
It has been well-established that malondialdehyde (MDA), which is generated during the process of lipid peroxidation, is a commonly known biomarker for oxidative stress. Therefore, the serum levels of MDA are detected by using the lipid peroxidation assay with commercially available kit to determine the induction of oxidative stress in rat models.
Keywords: Oxidative stress, Malondialdehyde, Lipid peroxidation, Thiobarbituric acid, MDA-TBA adduct, Serum
Background
As lipid peroxidation is the degradation of lipids that occurs as a result of oxidative damage and contributes to the pathology of many diseases, some end-products of the chain reaction of lipid peroxidation such as malondialdehyde (MDA), 4-Hydroxynonenal (4-HNE) and 8-iso-Prostaglandin F2alpha (8-isoprostane) in serum samples have been detected and quantified for the identification of oxidative damage ( Marrocco et al., 2017 ). In the current lipid peroxidation assay protocol, the serum levels of MDA could be specifically and reliably quantified based on the condensation reaction between MDA and thiobarbituric acid (TBA) by modifying a commercially available kit (MAK085D; Sigma, St Louis, MO) without n-butanol precipitation step ( Tang et al., 2019 ).
Materials and Reagents
Pipette tips
96-well flat bottom microplate (Sigma-Aldrich, catalog number: CLS3610)
Separate tube (Corning, catalog number: CLS430791)
Double-distilled water (ddH2O)
Ice
60 μl freshly collected rat serum
TBA (Sigma-Aldrich, catalog number: MAK085D)
Glacial acetic acid (Sigma-Aldrich, catalog number: A6283)
4.17 M MDA standard (Sigma-Aldrich, catalog number: MAK085E)
42 mM Sulfuric acid solution (Sigma-Aldrich, catalog number: 84736)
Phosphotungstic acid solution (PTA) (Sigma-Aldrich, catalog number: MAK085B)
Butylated hydroxytoluene (BHT) (Sigma-Aldrich, catalog number: MAK085C)
MDA standard (see Recipes)
Equipment
Pipettes (Bio-rad, P10, P200 and P1000)
Vortexer (Ratek, catalog number: VM1)
Centrifuge (Thermoline, model: K1015 Pro)
Incubator (Robbins Scientific, catalog number: 2000)
Microplate reader (Perkin Elmer, catalog number: 1420 Victor3)
Software
Microsoft Excel 2010
Procedure
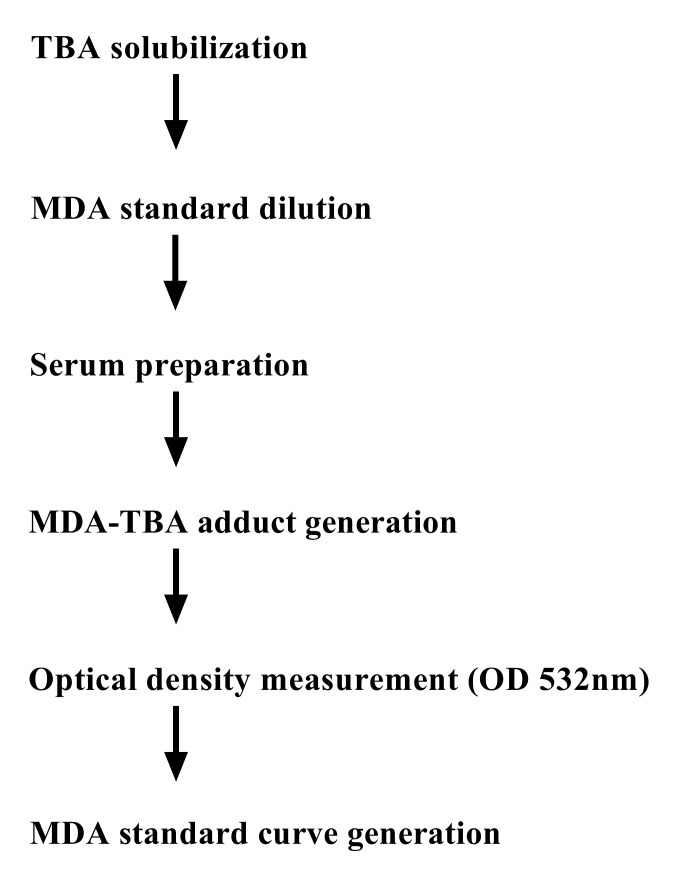
The flow chart in Figure 1 shows all the steps described in this protocol.
Figure 1. Schematic diagram of the assay procedure.
Reconstitute a bottle of TBA with 7.5 ml glacial acetic acid followed by adjusting with ddH2O to make 25 ml TBA solution.
Dilute 10 μl of 4.17 M MDA standard in 407 μl of ddH2O to make 0.1 M MDA standard.
Dilute 10 μl of 0.1 M MDA standard in 490 μl of ddH2O to make 2 mM MDA standard.
Use 2 mM MDA standard to generate MDA standard curve dilutions (Recipe 1).
Mix 20 μl of serum with 500 μl of 42 mM sulfuric acid.
Add 125 μl of PTA followed by vortexing.
Centrifuge at 13,000 × g at room temperature for 5 min.
Add 200 μl of BHT to 10 ml of ddH2O in a separate tube followed by vortexing.
Collect and resuspend serum pellet with 102 μl of BHT/ddH2O on ice.
Adjust the final volume to 200 μl with ddH2O followed by vortexing.
Incubate at 37 °C for 2 h.
Mix 600 μl of TBA solution with 200 μl MDA standard/serum sample to generate 800 μl of MDA-TBA adduct.
Incubate at 95 °C for 1 h and then place on ice bath for 15 min.
Pipette 200 μl of MDA-TBA adduct into a 96-well microplate in duplicate.
Measure the absorbance at a wavelength of 532 nm on the microplate reader.
Establish the standard curve using the serial dilutions of MDA standard.
Calculate MDA concentrations in serum samples.
Data analysis
Average the duplicate values for each reading.
Set the mean value of the blank (Standard #1) as the background.
Correct for the background by subtracting the blank value from all readings.
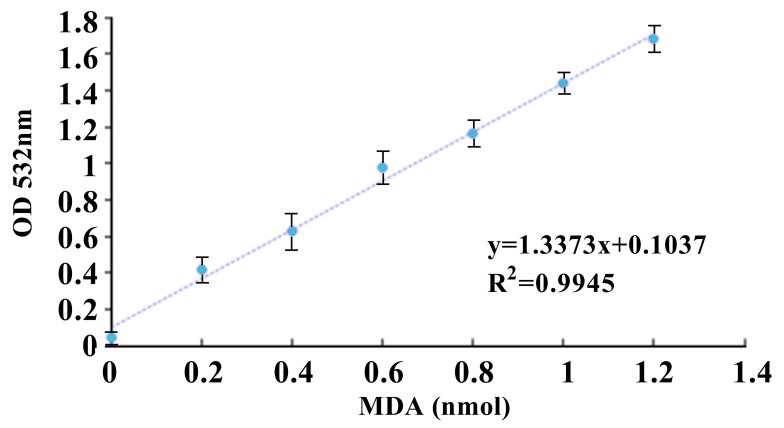
Use the corrected values of MDA standards to plot a standard curve by using Microsoft Excel 2010 (Figure 2).
Obtain MDA amount in the sample wells based on the standard curve by using linear regression.
-
Concentration of MDA in the test serum samples is calculated as:
MDA concertation = (A /0.02 ml) x 4 x D
where,
A = Amount of MDA in sample calculated from the standard curve (nmol).
0.02 ml = Original serum volume used (200 μl).
4 = Correction for using 200 μl of reaction mix from 800 μl of MDA-TBA adduct.
D = Sample dilution factor (if sample is diluted to fit within the standard curve range).
Figure 2. MDA standard curve.
The standard curve was generated by using linear regression in Microsoft Excel 2010.
Notes
Equilibrate all materials and prepared reagents to room temperature just prior to use and gently agitate.
Under the current experimental settings, the whole blood sample was centrifuged at 2,000 × g at 4 °C for 10 min to collect serum. The serum was then immediately apportioned into 0.5 ml aliquots and stored at -20 °C.
A new standard curve must be set up each time the assay is run.
N-butanol precipitation step could be performed to enhance assay sensitivity where MDA-TBA adduct concentration is low in plasma samples.
Recipes
-
MDA standard
Standard#2 mM MDAstandard volume (μl)ddH2O volume(μl)Final MDA standard concertation (μM) Final MDA standard amount (nmol/well) 1 0 600 0 0 2 6 594 20 0.4 3 12 588 40 0.8 4 18 582 60 1.2 5 24 576 80 1.6 6 30 570 100 2.0
Acknowledgements
CJX is supported by National Health and Medical Research Council of Australia (No. 1127396) and Natural Science Foundation of China (No. 81671928).
Competing interests
The authors declared that they have no conflict of interests to this work.
Citation
Readers should cite both the Bio-protocol article and the original research article where this protocol was used.
References
- 1. Marrocco I., Altieri F. and Peluso I.(2017). Measurement and clinical significance of biomarkers of oxidative stress in humans. Oxid Med Cell Longev 2017: 6501046. [DOI] [PMC free article] [PubMed] [Google Scholar]
- 2. Tang Q., Su Y. W., Fan C. M., Chung R., Hassanshahi M., Peymanfar Y. and Xian C. J.(2019). Release of CXCL12 from apoptotic skeletal cells contributes to bone growth defects following dexamethasone therapy in rats. J Bone Miner Res 34(2): 310-326. [DOI] [PubMed] [Google Scholar]


