Abstract
Dissolved oxygen and its availability to cells in culture is an overlooked variable which can have significant consequences on experimental research outcomes, including reproducibility. Oxygen sensing pathways play key roles in cell growth and behavior and pericellular oxygen levels should be controlled when establishing in vitro models. Standard cell culture techniques do not have adequate control over pericellular oxygen levels. Slow diffusion through culture media limits the precision of oxygen delivery to cells, making it difficult to accurately reproduce in vivo-like oxygen conditions. Furthermore, different types of cells consume oxygen at varying rates and this can be affected by the density of growing cells. Here, we describe a novel in vitro system that utilizes hypoxic chambers and oxygen-permeable culture dishes to control pericellular oxygen levels and provide rapid oxygen delivery to adherent cells. This procedure is particularly relevant for protocols studying effects of rapid oxygen changes or intermittent hypoxia on cellular behavior. The system is inexpensive and easily assembled without highly specialized equipment.
Keywords: Cell culture, Oxygen, Tissue oxygenation, Normoxia, Hypoxia
Background
Oxygen availability can impact on many signaling pathways and small changes to the level of pericellular oxygen can alter growth rate, metabolism, free radical production, and general cell behavior ( Place et al., 2017 ; Bordt, 2018). Therefore, to preserve normal cellular function, oxygen levels need to be maintained within a relatively narrow ‘normoxic’ range. This applies both to cells in vivo and to cell lines used in cell culture (Hunyor and Cook, 2018).
In most cell culture models, experimental ‘normoxic’ values are based on the oxygen levels supplied in cell culture incubators. In dry air at sea level, atmospheric oxygen is ~20.9% v/v (Hunyor and Cook, 2018). In standard humidified cell culture incubators maintained at 5% CO2, oxygen levels are equal to 18.6% O2 (v/v), equivalent to an oxygen tension or oxygen partial pressure (pO2) of 138 mmHg ( Wenger et al., 2015 ). However, cells are maintained at much lower pO2 levels in vivo ( Carreau et al., 2011 ). Under normal ventilatory conditions, pO2 in the arterial blood ranges from 80-100 mmHg (10.8-13.5% O2 v/v) and this is further lowered as oxygen molecules diffuse through tissue and are consumed by cells ( Carreau et al., 2011 ). Moreover, different tissues have unique ranges of physiological normoxia, depending on the specific oxygen demands of individual tissues. Using a single oxygen concentration to represent physiological normoxia for a range of cell types is not representative of the in vivo environment ( Carreau et al., 2011 ). When studying pathological oxygen conditions (such as in ischemia or in tumor hypoxia) cells should be exposed to oxygen tensions that appropriately model the specific pathological state of the tissue. In brain ischemia, pO2 levels can decrease below 10 mmHg (1% v/v) ( Hoffman et al., 1999 ). In tumors, pO2 levels can range from 15 mmHg (2.1% v/v) to as low as 2 mmHg (0.3% v/v) and this can also depend on the tissue of origin ( Byrne et al., 2014 ).
The concentration of oxygen used to represent hypoxia is important because oxygen-sensing proteins have optimal pO2 ranges for which they operate. Hypoxia inducible factor (HIF) is a transcription factor activated by low oxygen. HIF is thought to control the expression of up to 1,000 genes and it has important roles in health and disease including embryogenesis (Dunwoodie, 2009), angiogenesis (Cook and Figg, 2010), cancer ( Cook et al., 2009 ), diabetes ( Thangarajah et al., 2010 ), inflammation and immune function ( Palazon et al., 2014 ). HIF-1α and HIF-2α have been found to be stabilized under different oxygen tensions (Holmquist- Mengelbier et al., 2006 ; Lin et al., 2011 ). In neuroblastoma, HIF-2α is stabilized in 5% O2 and can be strongly expressed even in well-vascularized areas, while HIF-1α is stabilized below 1% O2 in extremely hypoxic regions of the tumor (Holmquist- Mengelbier et al., 2006 ). A small change in oxygen levels can therefore alter the balance of HIF-1α and HIF-2α, which affects what genes are expressed and ultimately how the cells behave. As we build better in vitro systems to accurately model in vivo conditions, oxygen levels are a key experimental variable to consider.
A common method used to modulate oxygen conditions in cell culture involves the use of a CO2 incubator with variable oxygen control (Wu and Yotnda, 2011). The major drawback of this method when using traditional cell culture techniques is that long exposure periods are required for the oxygen present in the gas phase to diffuse to cells attached at the bottom of the culture dish. Depending on the volume and depth of media, this can take hours due to poor oxygen diffusivity in aqueous media ( Allen et al., 2001 ). Oxygen conditions at the pericellular level therefore do not immediately match the oxygen conditions supplied in the incubator air. One method to counteract this is to pre-equilibrate media/reagents to the desired pO2 levels prior to culturing. The major issue with this is that unless the cell culture is handled within a closed compartment (such as in an airtight glove box), oxygen from the ambient air is constantly diffusing into media and reagents, preventing the precise control over the oxygen concentrations being delivered to cells ( Byrne et al., 2014 ). Many laboratories are not readily equipped with oxygen-controlled incubators or glove boxes due to their high costs.
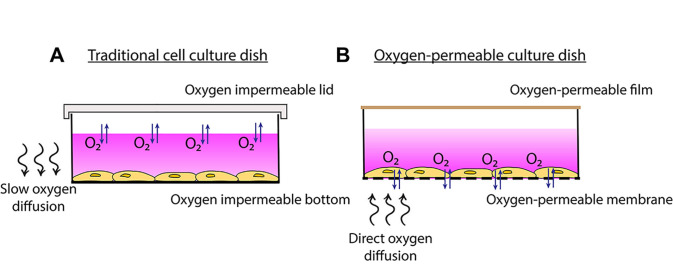
As a more cost-effective alternative, we have designed a cell culture system that utilizes commercially available oxygen-permeable cultureware. The culture dishes are composed of a thin membrane surface that is highly permeable to oxygen. Cells adhere to the membrane and are covered in media as with normal cell culture methods. However, due to the extremely high oxygen permeability of the membranes, cells have access to oxygen almost instantly from ambient air through the membrane rather than through the media (Figure 1). This enables faster oxygen equilibration rates to be achieved at the cellular level. These fast rates of oxygen cycling therefore make this model particularly useful for protocols aimed at studying rapid changes in oxygenation or intermittent hypoxia, relevant to diseases such as cancer ( Michiels et al., 2016 ), obstructive sleep apnea ( Minoves et al., 2017 ; Martinez et al., 2019 ), cardiovascular disease and ischemia ( Savla et al., 2018 ).
Figure 1. Traditional cell culture dish vs. oxygen-permeable culture dish.
A. Traditional cell culture dishes are impermeable to oxygen so more time is required for oxygen to diffuse through the media to the cells. B. Plating cells onto oxygen-permeable membranes enables gas-phase oxygen to be sourced directly through the membrane.
Materials and Reagents
T75 flask
Pipette tips
15 ml sterile tube
1.5 ml microtubes
Oxygen-permeable culture plate (commercially available plates are shown in Table 1). This protocol uses a 2-well slide plate from Coy Lab Products
AeraSealTM film sterile (Sigma-Aldrich, catalog number: A9224-50EA)
-
Acrylic hypoxic chamber (Custom-made)
Clear Acrylic Round Cylinder Display Riser (Plymor, available through Amazon, USA)
1 cm thick flat piece of acrylic (Plymor, available through Amazon, USA)
Tubing adaptors
Silicone grease
Epoxy or silicone glue
BlutackTM
McCoy’s modified media (Thermo Fisher, Gibco, catalog number: 36600-021)
DMEM/F12 media (Thermo Fisher, Gibco, catalog number: 11320-033)
DMEM media (Thermo Fisher, Gibco, catalog number: 10313-039)
Foetal bovine serum (Thermo Fisher, Gibco, Australian FBS, catalog number: 26140-079)
Penicillin-Streptomycin (Thermo Fisher, Gibco, catalog number: 15070-063)
GlutaMAX (Thermo Fisher, Gibco, catalog number: 35050-061)
Dulbecco’s phosphate buffered saline (Gibco, catalog number: 14190-144)
TrypLE (Thermo Fisher, Gibco, catalog number: 12605-028)
RNeasy Mini Kit (Qiagen, catalog number: 74104)
Tris-HCl (Sigma-Aldrich, catalog number: T3253)
NaCl (Omnipur, catalog number: 7710)
EDTA (Sigma-Aldrich, catalog number: EDS)
Na4P2O7 (Chem Supply, catalog number: TA045)
SDS (Sigma-Aldrich, catalog number: L3771)
Sodium deoxycholate (Sigma-Aldrich, catalog number: D6750)
Triton X (VWR, catalog number: ICNA04807426)
Glycerol (Sigma-Aldrich, catalog number: G5516)
HEPES (Sigma-Aldrich, catalog number: H3375)
KCl (Sigma-Aldrich, catalog number: P9333)
Nonidet-P40 Substitute solution (Sigma-Aldrich, catalog number: 98379)
DTT (Pierce, Thermo Fisher Scientific, catalog number: 20291)
RIPA lysis buffer (see Recipes)
Cytoplasmic extraction buffer (see Recipes)
Nuclear extraction buffer (see Recipes)
Table 1. List of commercially available oxygen-permeable membranes.
| Membrane | Manufacturer |
| Fluorocarbon | Zell-Kontakt/Coy Lab Products (catalog number: 8602003) |
| Polydimethylsiloxane (PDMS) | Specialty Silicone Products Inc. (catalog number: SSP-M823) |
| Lumox | Sarstedt (catalog number: 94.6077.331) |
Equipment
Laminar flow hood
Standard humidified cell culture incubator maintained at 5% CO2
Water bath (37 °C)
Hemocytometer
Microscope (Zeiss Primovert, 5x and 10x objective lenses)
Centrifuge (Eppendorf, model: 5810R)
Gas blender (3 channel GB100, MCQ Instruments, version GB1E43120240)
N2, CO2 and O2 gas sources
Pre-mixed gas cannisters (BOC, catalog number: CCS15388E)
Tubing (provided by MCQ instruments, or can be purchased from Saint-Gobain T3)
Clamp stand
Profiling oxygen microsensor (PM-PSt7, PreSens) connected to a compact oxygen transmitter (OXY-1 ST, PreSens)
Microcentrifuge (Thermo Fisher Scientific, Heraeus Fresco 21 [4 °C])
Software
MCQ Gas Mixture Creator PRO (MCQ Instruments, version 1)
PreSens Measurement Studio 2
Microsoft Excel
GraphPad Prism
Procedure
Any of the commercially available cultureware listed in Table 1 can be used in this cell culture system (thinner membranes will provide more rapid exchange with the ambient air). This procedure uses a 2-well slide plate (Coy Lab Products). This procedure can also be conducted using any adherent cell line. We have used this model system on HCT116 colorectal cancer cells ( Martinez et al., 2019 ), U251 glioblastoma cells, PC3 prostate cancer cells, and MDA-MB-231 and MCF7 breast cancer cells. Others have used a related system on endothelial cells, astrocytes and breast cancer cells ( Minoves et al., 2017 ). In our experience, all cell lines successfully attached onto oxygen-permeable membrane without need for an extracellular matrix protein coating. Some cell lines may require extracellular matrix coating of the membrane to facilitate attachment.
Note: Ensure all cell culture handling is conducted using sterile technique in a laminar flow hood.
-
Prepare cell culture
Depending on the cell line, prepare the appropriate media supplemented with 1x GlutaMAX and 10% FBS, as listed in Table 2. (Optional: add 50 IU/ml penicillin and 50 µg/ml streptomycin to the media).
Pre-warm the media to 37 °C in a water bath.
Seed cells onto a T75 flask in ~15 ml pre-warmed media.
Culture cells in a standard humidified incubator maintained at 5% CO2 at 37 °C.
-
Seed cells onto oxygen-permeable membranes
Aspirate the media from the T75 flask, wash cells with sterile PBS and dissociate with 2.5 ml TrypLE dissociation reagent in the 37 °C incubator for approximately 2 min (until cells detach from the flask).
Add 2.5 ml pre-warmed media to the flask and gently pipet cells to ensure even suspension before counting.
Transfer cells to a 15 ml sterile tube and count cells using a hemocytometer.
Centrifuge cells (using the Eppendorf 5810R) at 300 × g for 5 min at room temperature.
Aspirate and discard the supernatant.
Add fresh, pre-warmed media to the pellet and resuspend cells, gently pipetting to ensure even suspension.
Prepare a 2-well oxygen-permeable slide plate and seed cells in 1.5 ml media (see Figure 2A) at a density that enables cells to reach close to 100% confluency after 24 h incubation + the total duration in the treatment conditions (Optimal seeding densities for an 18 h experiment are shown in Table 2). For an 18 h experiment, the cells should be approximately 70-80% confluent before the dish is placed in the hypoxic chamber to be exposed to the treatment conditions (see Figure 2B).
Culture cells in a standard humidified incubator maintained at 5% CO2 at 37 °C for 24 h.
-
Set up hypoxic chamber
This procedure uses a custom-made, cylindrical acrylic hypoxic chamber. To construct a simple customized hypoxic chamber, we purchased various sizes of preassembled Clear Acrylic Round Cylinder Display Risers (Plymor, available through Amazon, USA). The dimensions of this cylinder-shaped hypoxic chamber are: 7 cm in diameter (internal) and 3.5 cm in height, with a total volume of 140 cm3 (Figure 3B). Flat pieces of acrylic (1 cm thick) can also be purchased from Plymor for use as the lid. The acrylic can be cut to a diameter slightly bigger than the diameter of the chamber. The lid of the chamber used in this protocol has a diameter of 8 cm (Figure 3A).
To ensure a tight seal, a groove can be sculpted into the underside of the lid so that it fits snugly onto the cylinder (see Figure 3C). Alternatively, the addition of ~200 µl-500 µl of silicone grease on the rim of the hypoxic chamber at the start of the experiment should be enough to hold the lid in place to ensure an airtight fit. A weight can be added on top of the lid to ensure the lid stays in place (Figure 4D).
The hypoxic chamber should have inlet and outlet holes for flowing gases (Figure 3 and 4), which can be drilled in the lid. Tubing adaptors (see Figures 4A and 4B) can be purchased from the local hardware store and placed in the holes drilled in the lid (~1 cm in diameter). The adaptors can be secured in place using epoxy or silicone glue.
After 24 h incubation in the incubator, discard the media and replace with 1.5 ml pre-warmed media supplemented with 0.5% FBS.
Seal the wells with sterile AeraSealTM film (see Figure 2A).
-
Place the slide plate within a hypoxic chamber, ensuring that the underside of the oxygen-permeable membrane is elevated off the floor of the chamber.
Note: Use pipette tips and BlutackTM to prop the plate up and use a spirit level to ensure the plate is level with the floor–see Figures 4A-4C.
Place the lid on top of the chamber, ensuring that the inlet is positioned away from the culture plate to prevent gas from flowing directly onto cells (Figure 4A).
-
Immerse the chambers in a 37 °C water bath within the CO2 incubator. The warm water bath assists in maintaining the chamber walls and internal gases at 37 °C.
Note: If the chamber is prone to floating, use a weight to hold down the chamber in the water bath–see Figure 4D.
-
Define gas compositions to mimic tissue oxygenation (Examples/suggestions)
-
Defining normoxia
Oxygen concentrations to represent physiological normoxia may vary depending on the tissue of interest. There have been studies that have measured oxygenation in various tissues in vivo using an oxygen sensor (see Table 1 in [Hunyor and Cook, 2018]). Estimations can therefore be made based on these measurements. Alternatively, a good starting point is to use an oxygen concentration that represents oxygenation of cells located close to major blood vessels (~90 mmHg or 12% v/v).
-
Defining hypoxia
Hypoxic concentrations should be set according to the type of disease being modeled. In tumors, oxygen values can range from 2 to 15 mmHg, depending on the size, location and tissue type. 4 mmHg is a good starting point to reflect severe hypoxia in tumors.
-
Defining intermittent hypoxia
Protocols of intermittent hypoxia will also depend on the type of disease being modeled. This procedure has been used in a previous study that modeled obstructive sleep apnea in tumors ( Martinez et al., 2019 ). Oxygen concentrations for intermittent hypoxia were based on measurements taken in a mouse tumor (subcutaneous melanoma) model of obstructive sleep apnea. Oxygen fluctuations in the tumor alternated between ~5 mmHg (0.6% v/v) to ~50 mmHg (7% v/v) ( Almendros et al., 2013 ), so protocols of oxygen cycling were modified to produce fluctuations between 5 and 50 mmHg in the pericellular media ( Martinez et al., 2019 ) (see Figure 6G).
-
-
Expose cells to the desired mixed gases
For exposures to one oxygen condition (i.e., continuous normoxia or continuous hypoxia), the inlet of the chamber can be connected to a gas canister pre-mixed to the desired gas composition (If this step was used, skip to Procedure G).
Alternatively, the inlet of the chamber can be connected to a gas blender connected to N2, O2 and CO2 gas sources. This step is particularly useful for changing oxygen conditions over time (i.e., for modeling intermittent hypoxia). See Procedure F for instructions on how to program the gas blender.
-
Program the gas blender to the desired gas composition
Turn on the MCQ Gas Blender box.
Open the MCQ Gas Mixture Creator PRO software (Figure 5).
Select ‘Edit Program’.
-
Enter the desired percentage (%) fractions of each gas component on the corresponding channel (CH) (See Figure 5B). For example:
To program for physiological normoxia at 12% O2 (v/v) to mimic well-oxygenated cells near major blood vessels, set values for each channel to: N2 (CH1) = 83%, O2 (CH2) = 12%, CO2 (CH3) = 5% (buffer).
To program for hypoxia at 0.5% O2 (v/v) to mimic severe tumor hypoxia, set values for each channel to: N2 (CH1) = 94.5%, O2 (CH2) = 0.5%, CO2 (CH3) = 5% (buffer).
To program for intermittent hypoxia, set values in one line to: N2 (CH1) = 87%, O2 (CH2) = 8%, CO2 (CH3) = 5%. Select add line and set values of the second line to: N2 (CH1) = 95%, O2 (CH2) = 0%, CO2 (CH3) = 5% (buffer), etc.
Set ‘FLOW’ (SCCM; equivalent to ml/min) to the desired flow rate.
Set ‘TIME WORK’ to the desired duration of exposure in each condition.
Save the protocol.
Select ‘OK’.
Select ‘Run program’ to begin exposure to the programmed oxygen conditions.
Note: When modeling intermittent hypoxia, ‘TIME WORK’ duration may need to be extended to allow for oxygen concentrations in the pericellular media to reach the desired level. Oxygen concentrations in the pericellular media can be measured using an oxygen electrode (see Procedure G).
-
Measure oxygen concentrations (to verify oxygen levels in the pericellular media)
Preparation: drill an extra hole in the lid of the chamber to enable insertion of an oxygen or temperature probe. When not in use, seal the hole with foil adhesive. The size of the hole drilled should be appropriate for the size of the oxygen probe being used, which is brand and model dependent (typically 5 mm-1 cm in diameter).
Insert the needle of the oxygen sensor through the hole in the lid of the chamber, through the AeraSeal film and twist the top of the sensor to extract the oxygen-sensing tip (see Figure 6A).
Use a clamp stand to hold the electrode in place.
Open the PreSens Measurement Studio 2 software.
Select the OXY-1 channel.
Select the ‘Measurements’ tab.
Select ‘New’. Name the new measurement file.
Click on the measurement file and select ‘Assign to’.
Select the ‘Live View’ tab and click ‘Start’ to begin taking measurements.
Export data Excel or GraphPad Prism and graph measurements (see Figures 6B-6G for examples).
Note: Oxygen equilibration in the air is much faster than through media, so it is also useful to take initial measurements in the air within the chamber to ensure the oxygen probe is working correctly. Oxygen concentrations will also vary depending on the placement of the oxygen probe (oxygen concentrations at the pericellular level will not be accurate if the probe is not placed directly on the membrane (cell side)). The volume of the culture media added to the well will also affect oxygen concentrations (Minoves et al., 2017). Take care when handling the oxygen probe to prevent damage of the sensor and piercing of the membrane of the culture dish.
-
Harvest cells and analyze expression
Cells can be analyzed by microscopy (1), by protein expression (2) or by mRNA expression (3).
-
Microscopy
Commercially available oxygen-permeable dishes were originally developed for imaging purposes. Cells can be probed with fluorescent dyes or transfected with protein-specific green fluorescent proteins (GFPs) and analyzed by fluorescence microscopy.
-
Protein expression
Cells can be harvested to extract total protein by scraping cells in RIPA lysis buffer or harvested to separate nuclear and cytoplasmic proteins in the following procedure:
Add 300 µl ice-cold cytoplasmic extraction buffer to each well of the culture plate.
Scrape cells well and transfer the lysate to a pre-chilled 1.5 ml microtube.
Vortex the microtube for 15 s and incubate on ice for 5 min.
Centrifuge for 5 min at 4 °C (using the Fresco 21 at 21,100 × g).
Aspirate the supernatant (cytoplasmic protein extract) and transfer to a pre-chilled 1.5 ml microtube. Place the microtube on ice or store at -30 °C until use.
Resuspend the pellet in 100 µl ice-cold nuclear extraction buffer.
Vortex the microtube for 15 s and incubate on ice for 10 min. Repeat Step H2c more times for a total duration of 40 min.
Centrifuge for 10 min at 4 °C (using the Fresco 21 at 21,100 × g).
Aspirate the supernatant (nuclear protein extract) and transfer to a pre-chilled 1.5 ml microtube. Place the microtube on ice or store at -30 °C until use. Discard the pellet.
Protein expression can then be analyzed by western blotting.
-
mRNA expression
Cells can be harvested by scraping to extract total RNA. Use the RNeasy mini kit (Qiagen) and follow procedure according to the manufacturer’s instructions. Convert purified mRNA to cDNA by reverse transcription. Quantify expression by qPCR.
-
Table 2. List of cell lines which have been tested in this model, the corresponding media, and the optimal seeding densities for a 6 h experiment.
| Cell line | Media - supplement with 1x GlutaMAX and 10% FBS | Approximate seeding densities for an 18 h experiment (cells/cm2) |
| HCT116 | McCoy’s | 1.5 x 10⁵ |
| PC3 | DMEM/F12 | 5.0 x 10⁴ |
| U251 | DMEM | 5.0 x 10⁴ |
| MDA-MB-231 | DMEM | 7.0 X 10⁵ |
| MCF7 | DMEM | 2.0 x 10⁵ |
Figure 2. Oxygen-permeable dish containing adherent HCT116 cells.
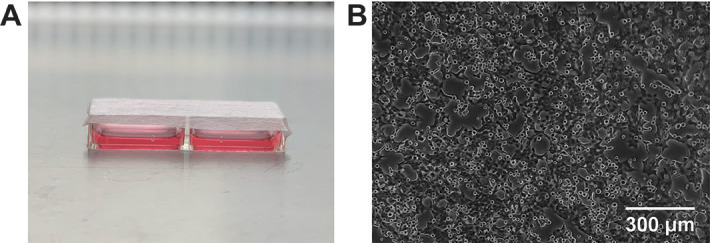
A. 2-well slide dish sealed with sterile AeraSeal film. B. Microscope image of HCT116 cells attached to the oxygen-permeable membrane 24 h after seeding.
Figure 3. Construction of a hypoxic chamber.
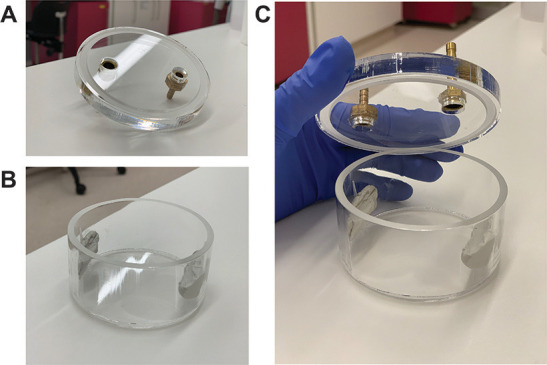
A. The lid of the chamber is a flat piece of acrylic (purchased from Plymor, 1 cm thick) with a groove sculpted about 1 mm into the underside of the lid. The lid also contains two holes (1 cm in diameter) as an inlet and an outlet for flowing gases. Tubing adapters can be secured into these holes using epoxy or silicone glue. B. The hypoxic chamber is an acrylic cylinder with a flat bottom (purchased from Plymor). The cylinder is 7 cm in diameter, 3.5 cm in height and has a total volume of 140 cm3. C. The groove in the lid of the chamber nicely slots into the rim of the cylindrical hypoxic chamber to ensure an airtight fit.
Figure 4. Hypoxic chamber setup.
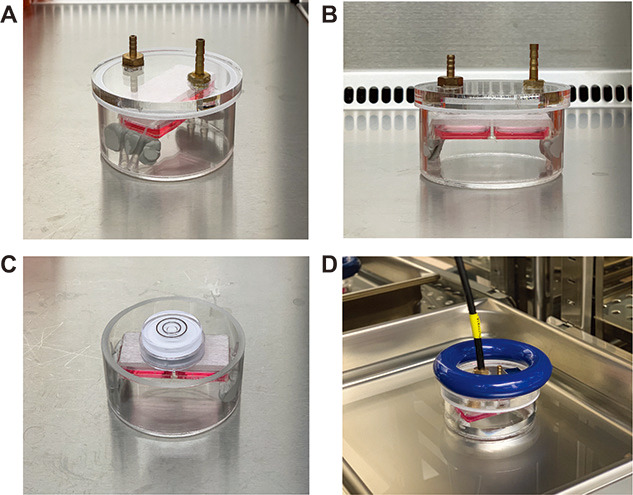
A. Top view of the hypoxic chamber containing the 2-well slide plate. The 2-well plate is elevated by BlutackTM to the inner walls of the chamber. The lid of the chamber consists of an inlet hole and an outlet hole for flowing gases. The inlet hole is positioned away from the culture dish. B. Front view of the hypoxic chamber containing the 2-well slide plate. C. A spirit level placed on top of the plate to ensure that it is level. D. Hypoxic chamber containing the plate, immersed in a water bath within a 37 °C, CO2 incubator. The input tube is connected to the hypoxic chamber via the inlet. For input tubing, use the tubing provided by MCQ for the gas mixer. Saint-Gobain T3 tubing is also acceptable. The chamber is held down by a weight.
Figure 6. Oxygen measurements in the pericellular media using the PreSens Oxygen Microsensor (graphed on GraphPad Prism).
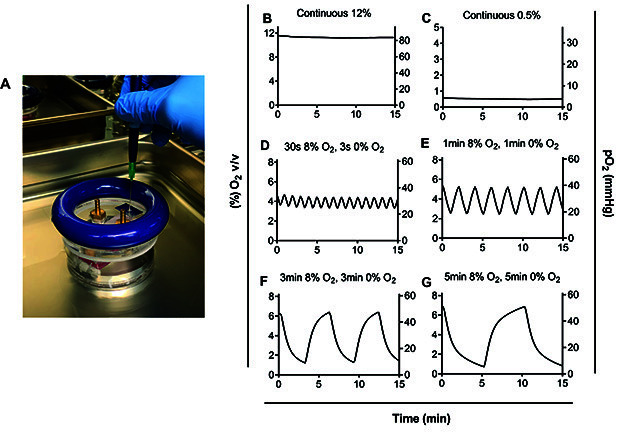
A. Insertion of the needle of the oxygen probe through the hole in the lid of the hypoxic chamber. B. Exposure to 12% O2 continuously, C. Exposure to 0.5% O2 continuously, D. Exposure to 30 s of 8% O2 followed by 30 s of 0% O2, E. Exposure to 1 min of 8% O2 followed by 1 min of 0% O2, E. Exposure to 3 min of 8% O2 followed by 3 min of 0% O2, and G. Exposure to 5 min of 8% O2 followed by 5 min of 0% O2. D-G. Time in each condition needed to be extended to 5 min in order for pericellular levels to reach the desired oxygen tension of 50 mmHg at the peak of cycles and 5 mmHg at the nadir or trough of cycles. Different oxygen concentrations can be modeled (see [ Minoves et al., 2017 ]) depending on oxygen requirements for the tissue of interest.
Figure 5. Programming gas compositions using the MCQ Gas Mixture Creator PRO software.
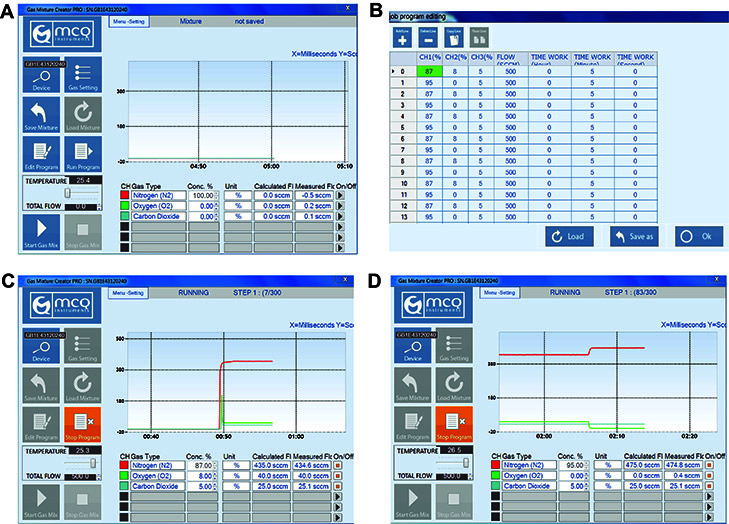
A. Opening page of MCQ Gas Mixture Creator PRO software. B. The job program editing page (after selecting ‘Edit Program’). To model intermittent hypoxia, N2 (CH1) was set to 87% or 95% per line, O2 (CH2) was set to 8% or 0% per line, and CO2 (CH3) was set to 5%. Flow rate was set to 500 SCCM (equivalent to ml/min). Time work was set to 5 min per line. C. The running program after selecting ‘Run Program’, starting with 87% N2, 8% O2, and 5% CO2. D. The running program when oxygen conditions alternate to 95% N2, 0% O2, and 5% CO2.
Recipes
-
RIPA lysis buffer
10 mM Tris HCl pH 7.5
100 Mm NaCl
1 mM EDTA
1 mM Na4P2O7
0.1% SDS
0.5% Sodium deoxycholate
1% Triton X
10% Glycerol
-
Cytoplasmic extraction buffer
10 mM HEPES pH 7.5
10 mM KCl
0.5 mM EDTA
0.5% Nonidet-40
1 mM DTT
-
Nuclear extraction buffer
20 mM HEPES pH 7.5
400 mM NaCl
1 mM EDTA
1 mM DTT
Acknowledgments
KMC is funded by a Cancer Institute NSW Early Career Research Fellowship, a University of Sydney Fellowship and a Sydney Medical Foundation grant. She has also received funding from the AMP Foundation. This protocol has been modified and adapted from ( Minoves et al., 2017 ) and ( Martinez et al., 2019 ).
Competing interests
The authors have no competing interests to declare.
Citation
Readers should cite both the Bio-protocol article and the original research article where this protocol was used.
References
- 1. Allen C. B., Schneider B. K. and White C. W.(2001). Limitations to oxygen diffusion and equilibration in in vitro cell exposure systems in hyperoxia and hypoxia . Am J Physiol Lung Cell Mol Physiol 281(4): L1021-L1027. [DOI] [PubMed] [Google Scholar]
- 2. Almendros I., Montserrat J. M., Torres M., Dalmases M., Cabanas M. L., Campos-Rodriguez F., Navajas D. and Farre R.(2013). Intermittent hypoxia increases melanoma metastasis to the lung in a mouse model of sleep apnea. Respir Physiol Neurobiol 186(3): 303-307. [DOI] [PubMed] [Google Scholar]
- 3. Bordt E. A.(2018). The importance of controlling in vitro oxygen tension to accurately model in vivo neurophysiology . Neurotoxicology 66: 213-220. [DOI] [PubMed] [Google Scholar]
- 4. Byrne M. B., Leslie M. T., Gaskins H. R. and Kenis P. J. A.(2014). Methods to study the tumor microenvironment under controlled oxygen conditions. Trends in Biotechnol 32(11): 556-563. [DOI] [PMC free article] [PubMed] [Google Scholar]
- 5. Carreau A., El Hafny-Rahbi B., Matejuk A., Grillon C. and Kieda C.(2011). Why is the partial oxygen pressure of human tissues a crucial parameter? Small molecules and hypoxia. J Cell Mol Med 15(6): 1239-1253. [DOI] [PMC free article] [PubMed] [Google Scholar]
- 6. Cook K. M. and Figg W. D.(2010). Angiogenesis inhibitors: current strategies and future prospects. CA Cancer J Clin 60(4): 222-243. [DOI] [PMC free article] [PubMed] [Google Scholar]
- 7. Cook K. M., Hilton S. T., Mecinović J., Motherwell W. B., Figg W. D. and Schofield C. J.(2009). Epidithiodiketopiperazines block the interaction between hypoxia-inducible factor-1α(HIF-1α) and p300 by a zinc ejection mechanism. J Biol Chem 284(39): 26831-26838. [DOI] [PMC free article] [PubMed] [Google Scholar]
- 8. Dunwoodie S. L.(2009). The role of hypoxia in development of the mammalian embryo. Dev Cell 17(6): 755-773. [DOI] [PubMed] [Google Scholar]
- 9. Hoffman W. E., Charbel F. T., Gonzalez-Portillo G. and Ausman J. I.(1999). Measurement of ischemia by changes in tissue oxygen, carbon dioxide, and pH. Surg Neurol 51(6): 654-658. [DOI] [PubMed] [Google Scholar]
- 10. Holmquist-Mengelbier L., Fredlund E., Löfstedt T., Noguera R., Navarro S., Nilsson H., Pietras A., Vallon-Christersson J., Borg A., Gradin K., Poellinger L. and Påhlman S.(2006). Recruitment of HIF-1α and HIF-2α to common target genes is differentially regulated in neuroblastoma: HIF-2α promotes an aggressive phenotype. Cancer Cell 10(5): 413-423. [DOI] [PubMed] [Google Scholar]
- 11. Hunyor I. and Cook K. M.(2018). Models of intermittent hypoxia and obstructive sleep apnea: molecular pathways and their contribution to cancer. Am J Physiol Regul Integr Comp Physiol. 315(4): R669-R687. [DOI] [PubMed] [Google Scholar]
- 12. Lin Q., Cong X. and Yun Z.(2011). Differential hypoxic regulation of hypoxia-inducible factors 1α and 2α. Mol Cancer Res 9(6): 757-765. [DOI] [PMC free article] [PubMed] [Google Scholar]
- 13. Martinez C. A., Kerr B., Jin C., Cistulli P. A. and Cook K. M.(2019). Obstructive sleep apnea activates HIF-1 in a hypoxia dose-dependent manner in HCT116 colorectal carcinoma cells. Int J Mol Sci 20(2). pii: E445. [DOI] [PMC free article] [PubMed] [Google Scholar]
- 14. Michiels C., Tellier C. and Feron O.(2016). Cycling hypoxia: A key feature of the tumor microenvironment. Biochim Biophys Acta 1866(1): 76-86. [DOI] [PubMed] [Google Scholar]
- 15. Minoves M., Morand J., Perriot F., Chatard M., Gonthier B., Lemarié E., Menut J. B., Polak J., Pépin J. L., Godin-Ribuot D. and Briançon-Marjollet A.(2017). An innovative intermittent hypoxia model for cell cultures allowing fast Po2 oscillations with minimal gas consumption. Am J Physiol cell Physiol 313(4): C460-C468. [DOI] [PubMed] [Google Scholar]
- 16. Palazon A., Goldrath A. W., Nizet V. and Johnson R. S.(2014). HIF transcription factors, inflammation, and immunity. Immunity 41(4): 518-528. [DOI] [PMC free article] [PubMed] [Google Scholar]
- 17. Place T. L., Domann F. E. and Case A. J.(2017). Limitations of oxygen delivery to cells in culture: An underappreciated problem in basic and translational research. Free Radic Biol Med 113: 311-322. [DOI] [PMC free article] [PubMed] [Google Scholar]
- 18. Savla J. J., Levine B. D. and Sadek H. A.(2018). The effect of hypoxia on cardiovascular disease: friend or foe? High Alt Med Biol 19(2): 124-130. [DOI] [PubMed] [Google Scholar]
- 19. Thangarajah H., Vial I. N., Grogan R. H., Yao D., Shi Y., Januszyk M., Galiano R. D., Chang E. I., Galvez M. G., Glotzbach J. P., Wong V. W., Brownlee M. and Gurtner G. C.(2010). HIF-1α dysfunction in diabetes. Cell Cycle 9(1): 75-79. [DOI] [PubMed] [Google Scholar]
- 20. Wenger R. H., Kurtcuoglu V., Scholz C. C., Marti H. H. and Hoogewijs D.(2015). Frequently asked questions in hypoxia research. Hypoxia(Auckl) 3: 35-43. [DOI] [PMC free article] [PubMed] [Google Scholar]
- 21. Wu D. and Yotnda P.(2011). Induction and testing of hypoxia in cell culture. J Vis Exp (54). pii: 2899. [DOI] [PMC free article] [PubMed] [Google Scholar]


