Abstract
Protein analysis in bone marrow samples from patients with multiple myeloma (MM) has been limited by the low concentration of proteins obtained after CD138+ cell selection. A novel approach based on capillary nano-immunoassay could make it possible to quantify dozens of proteins from each CD138+ purified MM sample in an automated manner. Up to now, the knowledge of protein level in those cells was limited because a relatively small quantity of sample is available after the diagnostic procedure. Moreover, the sample often is required for nucleic acids analysis. We have developed the procedure for obtaining proteins from bone marrow samples preserved in RLT+ buffer, and we have successfully applied this approach for the quantification of proteins in the setting of patients with MM. Proteins are extracted from RLT+ buffer, the content is quantified by total protein assay with WES machine and finally, the particular protein expression level is evaluated using specific antibodies by capillary nano-immunoassay with WES machine. The present protocol enables us to quantify many proteins from a limited amount of sample, without losing the opportunity to obtain nucleic acids at the same time. Proteins are quantified automatically in an assay with a low probability of human errors, which makes it a useful tool for biomarkers development.
Keywords: Protein, Capillary electrophoresis, RLT+ extraction, Antibodies, Biomarkers, Myeloma, Hematology
Background
Multiple myeloma (MM) is a clear prototype of a bone marrow-infiltrating tumor for which a relatively small quantity of sample is available after the diagnostic procedure that involves morphological evaluation, immunophenotypic characterization by flow cytometry, and CD138+ plasma cell separation for routine fluorescence in situ hybridization analysis. Protein analysis in bone marrow samples from patients with MM has been limited by the low concentration of proteins obtained after CD138+ cell selection. In the last decades, genomics has dominated biomedical research. In fact, multiple myeloma has been comprehensively analyzed using high-throughput genomic technologies. Particularly, gene expression profiling has provided a molecular classification of MM, which is widely used in biological research. Despite the huge and relevant information obtained from this kind of analysis, it is surprising the very low number of biomarkers subsequently validated. The technological developments that have revolutionized the field of cancer genomics, and in particular of MM, have not progressed to the same extent in proteomics, mostly because the proteome is not as static as the genome, and can differ greatly between individuals and even cell to cell. A novel approach based on capillary nano-immunoassay could make it possible to quantify dozens of proteins from each myeloma sample in an automated manner. We have recently presented a method for the accurate and robust quantification of the expression of multiple proteins extracted from CD138-purified MM samples frozen in RLT+ buffer (QIAGEN), which is commonly used for nucleic acid preservation and isolation (Misiewicz- Krzeminska et al., 2018 ). Although previous data suggested the possibility of simultaneously extracting proteins and nucleic acids from those kinds of buffer (Chomczynski, 1993; Mathieson and Thomas, 2013; Vorreiter et al., 2016 ), this strategy has not been applied in the clinical setting. The capillary electrophoresis nano-immunoassay (CNIA) platform has the advantage of measuring protein expression with higher sensitivity and reproducibility compared to traditional Western blot. In addition, the high-throughput screening of samples, using low sample inputs, will allow detecting the relative abundance of protein isoforms in almost all MM patients with the consequent broad applications in MM biomarker discovery. Accordingly, we have demonstrated the biological and clinical value of this analysis for a panel of 12 proteins essential for MM pathogenesis (aiolos, calnexin, cereblon, c-myc, cyclin D1, cyclin D2, DDX21, HSP90, ikaros, PSME1, RIPK1 and XAF1) (Misiewicz- Krzeminska et al., 2018 ). Moreover, DEPTOR protein level in MM samples was successfully evaluated using this technique ( Quwaider et al., 2017 ). Because of the low sample requirements, low complexity and rapidity of the protocol, these assays can be introduced in almost any laboratory with WES machine in order to evaluate potential protein biomarkers.
Materials and Reagents
Pipette tips (for instance, 0.1-10 μl, Daslab, catalog number: 162222; 5-200 μl, Daslab, catalog number: 200024; and 100-1,000 μl, Daslab, catalog number: 162001)
Syringes 1 ml (BD Pastipak, catalog number: 303173)
Needles 21 G x 1” (Terumo, catalog number: AN*2125R1)
1.5 ml and 2 ml Eppendorf tubes (for instance, Sarstedt, catalog numbers: 72.695.500 and 72.690.000)
JJN3 cell line (DMSZ, catalog number: ACC-541)
Anti-GAPDH antibody (Cell Signaling, catalog number: 12118), store at -20 °C
Anti-aiolos antibody (Cell Signaling, catalog number: 12720), store at -20 °C
DNA/RNA Allprep, including RLT+ buffer (QIAGEN, catalog number: 80204), store at RT
Acetone (Merck, catalog number: 1000141011), store at RT
NaCl (Merck, catalog number: 1064041000), store at RT
Ethanol (Merck, catalog number: 1009832511), store at RT
NaOH (Merck, catalog number: 1064981000), store at RT
SDS (Merck, catalog number: 8220501000), store at RT
Tris-Base (Merck, catalog number: 648310-500GM), store at RT
Protease inhibitors (Santa Cruz Biotechnology, catalog number: sc29130)
Anti-Rabbit detection module, includes Luminol-S, Peroxide, Antibody Diluent 2, Anti-Rabbit Secondary Antibody, Streptavidin-HRP (ProteinSimple, Biotechne, catalog number: DM-001) store at 4 °C
12-230 kDa Wes Separation Module, 8 x 25 capillary cartridges (ProteinSimple, Biotechne, catalog number: SM-W004), store at RT
RIPA buffer system (Santa Cruz Biotechnology, catalog number: sc-24948)
PMSF solution in DMSO, 200 mM (Santa Cruz Biotechnology, catalog number: sc-482875)
SodProteium orthovanadate in water, 100 mM (New England Biolabs, catalog number: P0758)
UltraCruz® Protease Inhibitor Cocktail Tablet (Santa Cruz Biotechnology, catalog number: sc-29130)
Deionized water
DTT (Promega, catalog number: V3155), store at -20 °C
Ethanol 70% (see Recipes)
5 M NaCl (see Recipes)
0.2 M NaOH (see Recipes)
1 M Tris, pH 6.8 (see Recipes)
Protease inhibitors (see Recipes)
Sample buffer (see Recipes)
Equipment
Pipettes (volumes needed–10 μl, 2-20 μl, 10-200 μl and 100-1,000 μl)
WESTM (ProteinSimple, Biotechne, catalog number: 004-600)
Centrifuge for microtubes (Eppendorf, model: 5415R)
Freezer -80 °C (Sanyo, model: Vip series 86)
Freezer -20 °C
Thermoblock (Grant, catalog number: QB02)
Vortex (VWR, catalog number: 1444-1372)
Benchtop centrifuge (VWR, Galaxy MiniStar)
Centrifuge with the plate adapter (Eppendorf, model: 5810R)
Software
CompassTM (Protein Simple, San Diego, CA, USA, https://www.proteinsimple.com/software_compass_simplewestern.html)
Excel (Microsoft)
Procedure
-
Proteins extraction
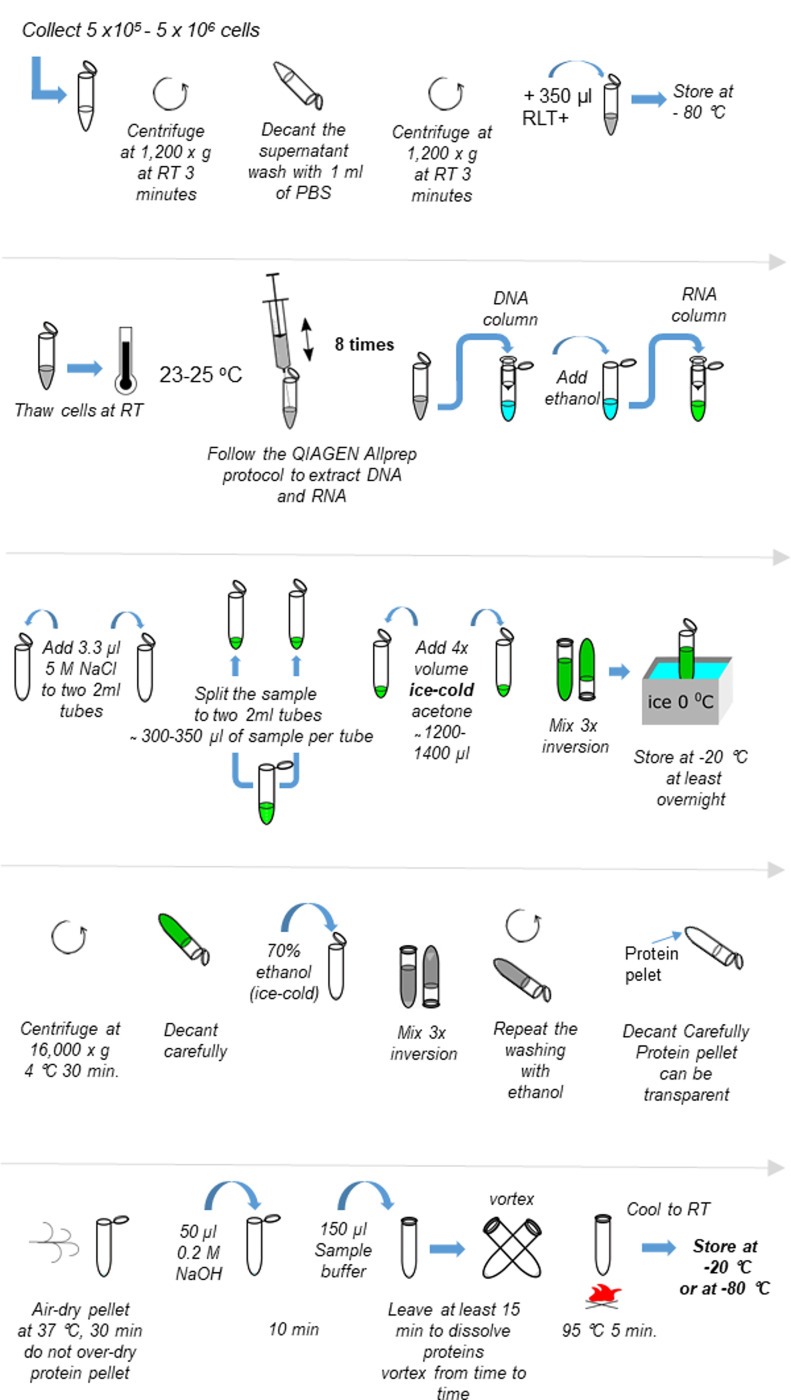
The scheme of the procedure is provided in Figure 1.
Collect 5 x 10⁵-5 x 10⁶ cells in one 1.5 ml Eppendorf tube.
Centrifuge at 1,200 × g at RT, 3 min.
Decant the supernatant and wash with 1 ml of PBS.
Centrifuge at 1,200 × g at RT, 3 min.
Decant the supernatant
Resuspend in 350 μl of RLT+.
Store at -80 °C, cells can be maintained there for several years.
Thaw cells at RT.
Pass the cell suspension through the syringe and needle 8 times.
Spin at max speed for 5 s in a benchtop centrifuge to eliminate foam.
Follow the QIAGEN Allprep protocol to extract DNA and RNA. Pass the sample through DNA column, add ethanol to the flow-through according to the procedure, and pass the sample through RNA column. The eluate is the protein sample. In this protocol the first flow-through from RNA column is used (approx. volume 600-700 μl).
Add 3.3 μl of 5 M NaCl to each 2 ml Eppendorf tube, previously prepared.
Add half of the through-flow from RNA column to each tube from the previous point (300-350 μl of sample per Eppendorf tube).
-
Add 4x volume of ice-cold acetone to each 2 ml Eppendorf from the previous Step (approx. 1,200 μl).
Note: The temperature of acetone is extremely important. Place it at -20 °C at least overnight.
Mix by inversion 3 times and put on ice immediately until stored.
Store at -20 °C, at least overnight.
Centrifuge at 16,000 × g at 4 °C for 30 min.
Decant the supernatant carefully.
Fill the tube with 70% ethanol (ice-cold) to wash, mix by inversion 3 times. It is not necessary to vortex.
Centrifuge at 16,000 × g at 4 °C for 10 min, decant the supernatant.
Repeat the washing with ethanol.
Carefully decant ethanol without losing the pellet, which could be transparent at this point.
Air-dry pellet at 37 °C, 30 min (the time depends on the amount of ethanol remained). At this point it is important not to over-dry protein pellet, since it will become insoluble.
Rehydrate proteins in 50 μl of 0.2 M NaOH, leave 10 min at RT, carefully vortex from time to time avoiding pellet to be moved to the upper part of the tube.
Add 150 μl of sample buffer containing DTT (final DTT concentration 50 mM), and protease-phosphatase inhibitors (10 μl PMSF solution, 10 μl sodium orthovanadate solution and 10 μl protease inhibitor cocktail solution per ml). Leave at least 15 min to dissolve proteins. The volume and time depend on the pellet. Can be vortexed, or mixed.
Boil samples at 95 °C for 5 min.
-
Cool to RT. Samples can be stored at -20 °C or at -80 °C (recommended).
Note: When the sample is thawed for the subsequent applications, some precipitation can occur. In this case mix the sample well, or heat to 35 °C in a thermoblock for 30-60 min.
-
Preparation of the sample for analysis in WES
Note: The following procedure is valid for sample preparation both for total protein assay (TPA) as well as for capillary nano-immunoassay (CNIA).
-
Prepare the 5x Master Mix according to the manufacturer’s procedure. It contains 1 kDa, 29 kDa and 230 kDa fluorescent standards. All reagents, except deionized water are provided in the Wes Separation Module.
Open the standard pack clamshell.
Pierce the foil of the clear tube with DTT and add 40 μl of deionized water, mix gently.
Pierce the foil of the pink tube and add 20 μl of 10x sample buffer and 20 μl of DTT solution from Step B1b, mix gently.
Prepare biotinylated ladder (included in the Wes Separation Module) by piercing foil of the white tube and adding 20 μl of deionized water. Mix gently and transfer to a 1.5 ml Eppendorf tube.
-
Prepare 3 μl of each sample to be quantified in a new 1.5 ml Eppendorf tube.
Note: Analyze samples without dilution in TPA assay. In case of CNIA dilute them either in deionized water or in 0.1x sample buffer provided in the Wes Separation Module kit. For CNIA, the final concentration of the sample should be at 0.2 mg/ml.
Add 0.75 μl of the 5x master mix to each tube prepared in the previous step.
Mix by pipetting.
Collect the samples by spinning at max speed for 5 s.
Preheat the thermoblock to 95 °C. Place both standard and samples to be analyzed in the thermoblock. Heat at 95 °C for 5 min.
Cool to the RT at the bench.
-
-
Total protein quantification
In this assay all proteins are biotinylated and detected with streptavidin-HRP chemiluminescent substrate.
-
Prepare the assay template using Compass software according to the Figure 2.
Run the Compass software and create new assay (File → New assay → WES → size type: Total Protein Assay → Size range 12-230 kDa → cartridge 25).
In a first row label the samples.
Save the assay.
Prepare the samples for standard curve using cell line sample extracted by the conventional protein extraction with RIPA buffer (example of the standard protocol https://www.abcam.com/protocols/sample-preparation-for-western-blot). Here, the JJN3 cell line is used (5 x 10⁶ cells). Standard curve should be prepared with 5 serial dilutions at concentrations of 0.25 mg/ml, 0.125 mg/ml, 0.0625 mg/ml, 0.03125 mg/ml, 0.0156 mg/ml and 0 mg/ml. Mix them with the Master Mix from Procedure B.
Prepare the protein labeling reagent; bring the Reconstitution Reagent 1 and 2 to the RT before use and follow the producer protocol.
Prepare the chemiluminescent substrate by mixing in a 1.5-ml Eppendorf tube 200 μl of Luminol-S with 200 μl of Peroxidase, both supplied in the detection module.
Remove the upper part of the foil from the plate and pipette the plate according to the template designed in Step C1; add wash buffer according to the separation module leaflet.
Centrifuge plate at 1,100 × g for 10 min, at RT, to remove any bubbles. Check for bubbles, if some are still present pinch them with a needle. Make sure that the centrifuge is set at RT (18-25 °C).
Open the WES machine. Insert the cartridge with capillaries (included in the Wes Separation Module) to the cartridge holder in the WES machine. The light inside the holder should change from orange to blue.
Remove the lower part of the foil from the plate and place it inside the WES machine. Close the machine and click the start button in Compass.
After finishing the run retrieve the data and analyze it according to the Data analysis point 1 to calculate the protein concentration in each sample.
-
-
Antibody optimization
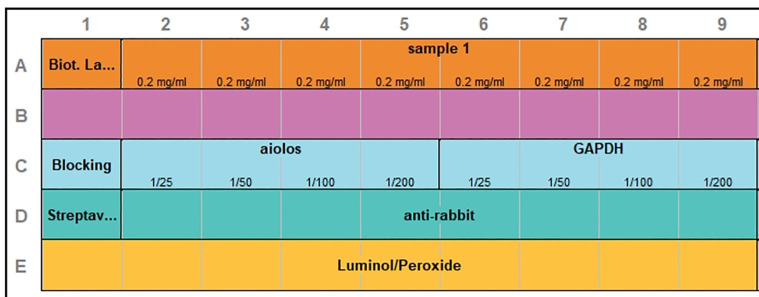
This step consists of running the assays in the cell line samples at concentration 0.2 mg/ml at four antibody dilutions (1/25; 1/50; 1/100 and 1/200). In the example two antibodies are shown, anti-GAPDH and anti-Aiolos, and the example of the plate layout is presented in Figure 3.
Create a new assay template using Compass software according to the Figure 3.
Run the Compass software and create new assay (File → New assay → WES → size type: Size → Size range 12-230 kDa → cartridge 25).
Prepare antibody in antibody diluent by serial dilution method, diluted antibody volume in each well is 8 μl.
Pipette the plate according to the template prepared, proceed further as indicated in Steps C4-C8. The standard volumes in each well are: the sample 3 μl; antibody diluent, primary and secondary antibodies 8 μl each; luminol/peroxidase solution 15 μl.
Analyze results, according to point 2 in Data analysis.
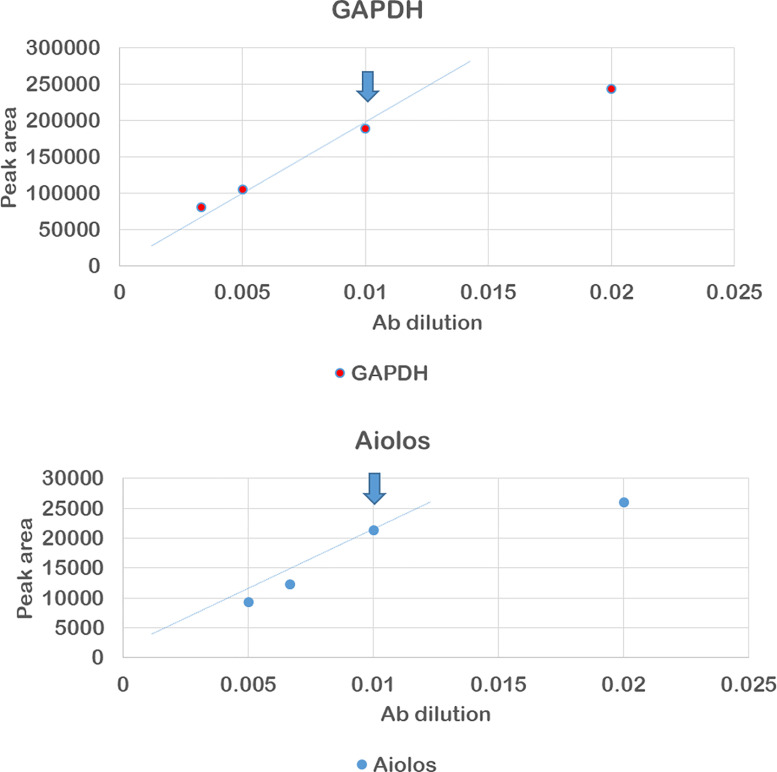
Plot the peak area vs. antibody dilution and find the last antibody concentration at which the curve follows the linear trend line, which means the antibody saturation was reached, like in the example in Figure 4, where in both cases the dilution of 1/100 is considered the optimal.
Standard curves need to be generated for each protein to evaluate the range of linearity over which the expression of each protein could be quantified. The details with the example of standard curve are provided in Haematologica “Optimization of protein quantification by capillary nano-electrophoresis with immunoassay” section and Figure 3 of Misiewicz-Krzeminska et al. (2018) .
-
Quantification of protein level in the sample is performed using previously set antibody dilution
Note: It is generally advised to measure the level of the protein of interest and the reference protein in the same run.
Prepare samples to analyze the protein of interest and the reference protein. In the example, one protein of interest is analyzed and one reference, thus in one run 12 samples are evaluated. Mix 8 μl of sample and 2 μl of Master Mix (when preparing sample for more than one measurement at once, add 10% excess of the sample and master mix). Proceed like described in Procedure B.
To analyze the data, proceed like in point 2 of Data analysis section.
Figure 1. Scheme of the procedure of protein extraction from RLT+ buffer.
Refer to Procedure A for detailed description.
Figure 2. Assay template for total protein assay with standard curve and 18 samples of unknown protein content.
The recommended volume of each sample and reagents in each well are marked with arrows. The rows correspond to: (A) samples, (B) total protein biotin labeling reagent, (C) antibody diluent, (D) total protein streptavidin HRP, (E) Luminol/peroxidase. First well in the row (A) contains biotinylated ladder, and in the row (B) antibody diluent.
Figure 3. Plate layout for anti-aiolos and anti-GAPDH antibody optimization.
The rows correspond to: (A) samples, (B) antibody diluent (C) antibody at distinct dilutions (1/25 to 1/200), (D) secondary antibody (E) Luminol/peroxidase. First well in the row (A) contains biotinylated ladder, in the rows (B) and (C) antibody diluent and in the row (D) streptavidin HRP.
Figure 4. Result of anti-aiolos and anti-GAPDH antibody optimization.
The arrows indicate the selected antibody dilution.
Data analysis
-
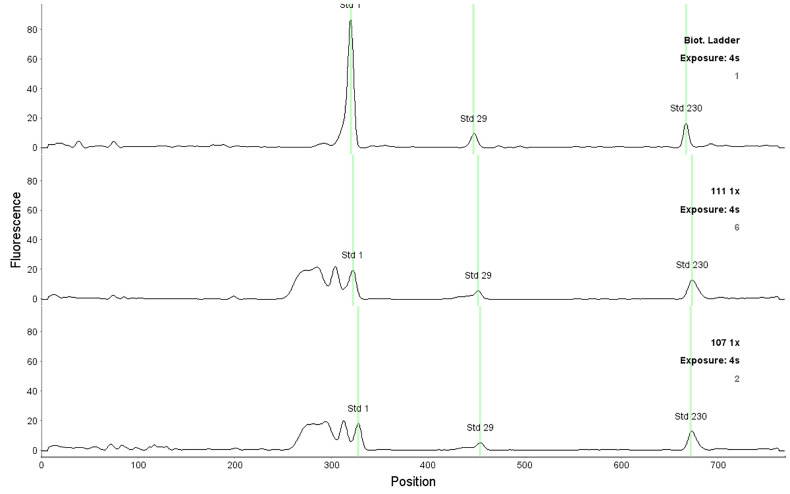
After each run, check the fluorescent standards position and adjust them if necessary, according to Figure 4. Assure that all standards positions are correct in all capillaries. To adjust the fluorescent standard, point the place with the mouse, click the right button and select “force standards” option.
Note: The position of fluorescent standards is used by the system to assign the molecular weight to the detected peaks. If the analyzed sample contains SDS or bromophenol blue, an intense peak before the fluorescent standard 1 kDa appears and is detected by the system as a false positive 1 kDa fluorescent standard. In that case it is necessary to correct the fluorescent standard 1 kDa position, using as a reference position of the one detected in a biotinylated ladder (Figure 5).
-
TPA analysis can be found in Haematologica, Figure 2. (See http://www.haematologica.org/content/103/5/880)
To generate the standard curve, copy the total area under the curve for the capillaries that contain standard curve sample, by selecting “Capillaries” option. To copy the data to excel press the right mouse button and select “copy” option.
Plot the total area vs. protein known concentration in each sample. Generate the equation in Excel.
Calculate the concentration in analyzed samples from the equation using total area of each sample as “x” variable.
-
CNIA analysis: level of protein expression in the sample.
Name the peak with the protein name and the molecular weight (For example, aiolos, 85 kDa GAPDH, 42 kDa). To name the peak select “Edit” → “analysis” → “peak names” option.
-
Check signal to noise ratio (S/N) in the results for each capillary for each protein peak.
Note: It should be above 10 to be able to quantify it. The limit of quantification could be lowered if experimental validation proves the linearity of signal with lower S/N ratio.
Check if there is no negative value of chemiluminescence, if this occurs the sample cannot be quantified. It means that the signal is too high and the chemiluminescent substrate has been all consumed by the HRP.
The area corresponds to the level of the protein evaluated.
-
To normalize data against GAPDH use the formula, as in the example:
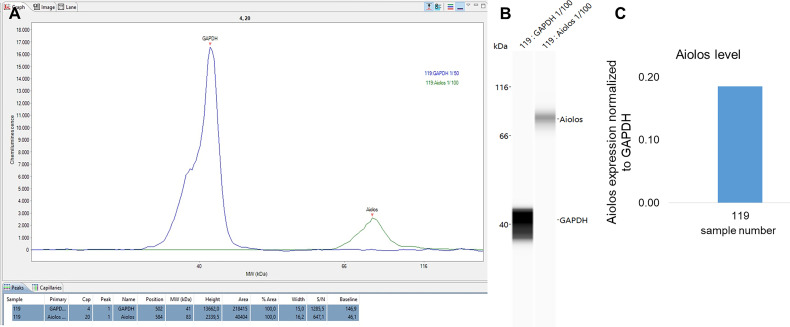
The results can be visualized as peaks (Figure 5A), as virtual blots (Figure 5B) and the result of the formula (Figure 6C).
Figure 5. Correct position of the fluorescent standards in the analysis of samples (1, 29 and 230 kDa).
The upper graph corresponds to the biotinylated ladder and two lower graphs to the MM samples.
Figure 6. Result of aiolos and GAPDH quantification in an MM sample.
A. The assigned peaks and result of the peak analysis including area and s/n ratio. B. Virtual blot visualization of the results. C. Result of the quantification of the aiolos level normalized to GAPDH protein.
Note: The details of limits of detection settings have also been provided in “Optimization of protein quantification by capillary nano-electrophoresis with immunoassay” section and Figure 3 of the paper (Misiewicz-Krzeminska et al., 2018).
Notes
The variability of the assay should be checked before evaluating each set of samples by at least 3 replicates of the same sample using the same antibody. In our previous studies, we reported variability between 5.8% and 15.5 % (Misiewicz- Krzeminska et al., 2018 ).
The appropriate positive and negative controls should be considered. As a negative control, cells with previously described lack of the tested protein expression, on contrary as a positive control cells with described expression of that protein should be used. To search appropriate negative and positive controls, search the literature data, or refer to the antibody leaflet.
The temperature is a critical point in the assay. Make sure that the working environment maintains a standard room temperature of 18-25 °C.
Recipes
-
Ethanol 70%
Dilute 35 ml of ethanol with 15 ml of deionized water, mix by inverting several times
-
5 M NaCl
Dissolve 175.3 g NaCl in 600 ml of distilled water
-
0.2 M NaOH
-
Prepare 5 M NaOH by dissolving 40 g of NaOH in 200 ml of deionized water
Note: Wear gloves and lab coat protection.
Dilute to 0.2 M NaOH: 2 ml of 5 M NaOH and 48 ml of deionized water
-
-
1 M Tris pH 6.8
Dissolve Tris-Base 30.29 g in 200 ml deionized water
Adjust pH to 6.8, then volume to 250 ml
Need approximately 20 ml of concentrated HCl
-
Protease inhibitors
Dissolve one tablet in 2 ml deionized water
-
Sample buffer
Mix 20 ml of Tris (pH 6.8, 1 M), 8 g of SDS, 50 mg of bromophenol blue, 40 ml of glycerol and volume to 100 ml
Weigh 7.7 mg of DTT and dissolve in 1 ml of buffer from the above step
Add 10 μl of protease inhibitors, 10 μl PMSF solution and 10 μl sodium orthovanadate solution
Mix well
Acknowledgments
The authors would like to thank Patryk Krzeminski for his help with graphic Figure 1. IMK was supported by “Sociedad Española de Hematología y Hemoterapia”. This study was supported by a grant from the International Myeloma Foundation's Black Swan Research Initiative®, “Gerencia Regional de Salud, Junta de Castilla y León” (BIO/SA35/14) and by project “PI16/01074” from ISCIII (co-funded by FEDER). WESTM platform was acquired thanks to INNOCAMPUS Program (CEI10-1-0010).
The details of the clinical sample analysis is provided in Misiewicz-Krzeminska et al. (2018). The procedure has been also employed in Quiwaider et al. (2017).
Competing interests
The authors declare no competing interests.
Ethics
All patients gave written informed consent in accordance with the declaration of Helsinki and Ethical Committee of University Hospital of Salamanca approved the study.
Citation
Readers should cite both the Bio-protocol article and the original research article where this protocol was used.
References
- 1. Chomczynski P.(1993). A reagent for the single-step simultaneous isolation of RNA, DNA and proteins from cell and tissue samples. Biotechniques 153: 532–534., 536-537. [PubMed] [Google Scholar]
- 2. Mathieson W. and Thomas G. A.(2013). Simultaneously extracting DNA, RNA, and protein using kits: is sample quantity or quality prejudiced? Anal Biochem 433(1): 10-18. [DOI] [PubMed] [Google Scholar]
- 3. Misiewicz-Krzeminska I., Corchete L. A., Rojas E. A., Martinez-Lopez J., Garcia-Sanz R., Oriol A., Blade J., Lahuerta J. J., Miguel J. S., Mateos M. V. and Gutierrez N. C.(2018). A novel nano-immunoassay method for quantification of proteins from CD138-purified myeloma cells: biological and clinical utility. Haematologica 103(5): 880-889. [DOI] [PMC free article] [PubMed] [Google Scholar]
- 4. Quwaider D., Corchete L. A., Misiewicz-Krzeminska I., Sarasquete M. E., Perez J. J., Krzeminski P., Puig N., Mateos M. V., Garcia-Sanz R., Herrero A. B. and Gutierrez N. C.(2017). DEPTOR maintains plasma cell differentiation and favorably affects prognosis in multiple myeloma. J Hematol Oncol 10(1): 92. [DOI] [PMC free article] [PubMed] [Google Scholar]
- 5. Vorreiter F., Richter S., Peter M., Baumann S., von Bergen M. and Tomm J. M.(2016). Comparison and optimization of methods for the simultaneous extraction of DNA, RNA, proteins, and metabolites. Anal Biochem 508: 25-33. [DOI] [PubMed] [Google Scholar]


