

Abstract
Although germline de novo copy number variants are known causes of autism spectrum disorder (ASD), the contribution of mosaic (early-developmental) copy number variants (mCNVs) has not been explored. Here, we assessed the contribution of mCNVs to ASD by ascertaining mCNVs in genotype array intensity data from 12,077 ASD probands and 5,500 unaffected siblings. We detected 46 mCNVs in probands and 19 mCNVs in siblings affecting 2.8–73.8% of cells. Probands carried a significant burden of large (>4 Mb) mCNVs, which were detected in 25 probands but only 1 sibling (OR=11.4, 95% CI=1.5–84.2, P=7.4×10⁻⁴). Event size positively correlated with severity of ASD symptoms (P=0.016). Surprisingly, we did not observe mosaic analogues of the short de novo CNVs recurrently observed in ASD (e.g. 16p11.2). We further experimentally validated two mCNVs in post-mortem brain tissue from 59 additional probands. These results indicate that mosaic CNVs contribute a previously unexplained component of ASD risk.
Introduction
The genetic architecture of ASD is complex. Common variants, rare variants, and germline de novo variants contribute substantially to risk1–3. Germline de novo CNVs (dnCNVs) play a central role with such events observed in 5–10% of ASD probands4–6. Archetypal dnCNVs are recurrently observed in ASD probands including duplications of 15q11–13, duplications and deletions of 16p11.2, and focal deletions of NRXN16. However, despite substantial progress understanding the genetic risk of ASD, a large portion of ASD susceptibility cannot be explained by known risk variants7,8.
Early-developmental (mosaic) mutations have been proposed as a possible source of some unexplained ASD susceptibility9. Unlike de novo variants which occur in parental germ cells and are thus present in all cells of the body, mosaic mutations arise after fertilization – sometimes during embryonic development10 – and are present in only a fraction of cells. Nonetheless, both de novo and mosaic variants arise free from the reproductive pressures of natural selection, and thus the hypothesis that mosaic variants contribute to sporadic disease is an attractive one. Several studies have linked mosaic single nucleotide variants to ASD11–13 and causally implicated them in several other neurological disorders14–16. Mosaic CNVs have recently been linked to developmental disorders17; however, the contribution of mCNVs to ASD risk is currently unknown.
Here, we systematically analyzed mCNVs (gains, losses, and copy-number neutral losses of heterozygosity; CNN-LOH) in 11,457 ASD-affected families using genotype array data from the SSC18 and SPARK datasets19, drawing upon recent advances in statistical phasing20 and the pedigree structure of the data to sensitively detect mCNVs21. In both cohorts, we found a significant burden of mCNVs in probands relative to their unaffected siblings. This burden was driven by the presence of large (>4 Mb) mCNVs in probands, and increased event size significantly associated with increased severity of ASD symptoms. We additionally computationally detected and experimentally validated two mCNVs present in whole-genome sequencing of brain tissue from an additional 59 probands. These results provide strong evidence that mosaic CNVs contribute to ASD risk.
Results
Detection of mosaic copy number variants in ASD cohorts
We sought to characterize the contribution of mCNVs arising during early development to ASD risk. We analyzed blood-derived genotype array intensity data from 2,591 autism-affected families in the Simons Simplex Collection (SSC) cohort18 and saliva-derived genotype intensity data from 8,866 autism-affected families in the Simons Powering Autism Research for Knowledge (SPARK) cohort19. All SSC probands and siblings were 3–18 years old at enrollment; most SPARK probands and siblings were in or near the same age range, with a small fraction of older probands (1.2% between the ages 30–40 and 0.3% over the age of 40; Supplementary Fig. 1a). After data quality control (Methods), 12,077 probands and 5,500 siblings remained (Table 1). On average 900,935 genotyped variants remained in SSC samples and 579,300 in SPARK samples due to differences in genotyping density between arrays.
Table 1: Counts of samples carrying mosaic CNVs.
The modestly increased rate of detection in SSC is consistent with the higher density of genotyped variants in SSC relative to SPARK samples. No difference in rates was observed when restricting to mCNVs >4 Mb (Fig. 1).
| Total samples |
Samples with mCNV (# events) |
% occurrence | Samples with gain (# events) |
Samples with loss (# events) |
Samples with CNN-LOH (# events) |
||
|---|---|---|---|---|---|---|---|
| SSC | Probands | 2594 | 15 (16) | 0.58 | 3 (3) | 12 (13) | 0 (0)† |
| Siblings | 2424 | 13 (17) | 0.54 | 9 (11) | 4 (6) | 0 (0) | |
| SPARK | Probands | 9483 | 29 (29) | 0.31 | 20 (20) | 4 (4) | 5 (5) |
| Siblings | 3076 | 2 (2) | 0.07 | 1 (1) | 1 (1) | 0 (0) | |
The absence of CNN-LOH events in SSC was unsurprising given the smaller sample size of SSC compared to SPARK (P = 0.33 two-sided Fisher’s exact test for comparing CNN-LOH frequency in SSC vs. SPARK; P = 0.59 two-sided Fisher’s exact test for a comparison restricted to probands).
We performed haplotype phasing using both a population reference panel and the pedigree structure of the data to obtain near-perfect long-range phase information in offspring. We leveraged the phase information to sensitively detect mCNVs in autosomes of probands and siblings using MoChA22 and checked parental genotypes to ensure events were not germline (Methods; see URLs); we excluded sex chromosomes to avoid confounding from the imbalanced sex ratio between probands and siblings (9,776:2,301 males:females in probands versus 2,718:2,782 in siblings). Following previous studies21,23, we filtered mCNV calls that exhibited evidence of DNA contamination, and we restricted our analysis to events for which copy number state could be confidently determined (Methods, Supplementary Fig. 2). We further excluded mCNVs frequently observed in age-related clonal hematopoiesis (specifically, focal deletions at IGH and IGL and low-cell-fraction CNN-LOH events21,23–25), which we expected to be present in a very small fraction of samples (<1%, given the young ages of participants) and unrelated to ASD status. We verified that genotyping intensity deviations within the remaining mCNVs were consistent with estimated mosaic cell fraction and copy number state (Supplementary Fig. 3).
We detected 64 mCNVs in 59 individuals (35 gains, 24 losses, and 5 CNN-LOH in 0.34% of SSC and SPARK samples; Table 1 and Supplementary Table 1) ranging in cell fraction – i.e., proportion of cells harboring a mosaic event – from 2.8% to 73.8% (median = 27.1%) and in size from 49.3 kb to 249.2 Mb (median = 2.5 Mb) (Fig. 1a). All but one carrier was younger than 28 years old (oldest: 47 y.o.; median: 12 y.o.). Of the 64 detected mCNVs, 45 events were present in 44 unique probands (0.36%) and 19 events were present in 15 unique siblings (0.27%), with one sibling carrying five events on a single chromosome, reminiscent of chromothripsis (Supplementary Fig. 4, Supplementary Note 1). Consistent with our filtering of age-related clonal hematopoiesis events, we did not observe a significant increase in mCNV detection rate with increasing age in SPARK samples (Supplementary Fig. 1b; individual age-information was not available for SSC samples). We also did not observe a bias in the parental haplotype on which mCNVs were located (Supplementary Table 1, Supplementary Fig. 5, Methods).
Figure 1: ASD probands carry a burden of large mosaic CNVs.
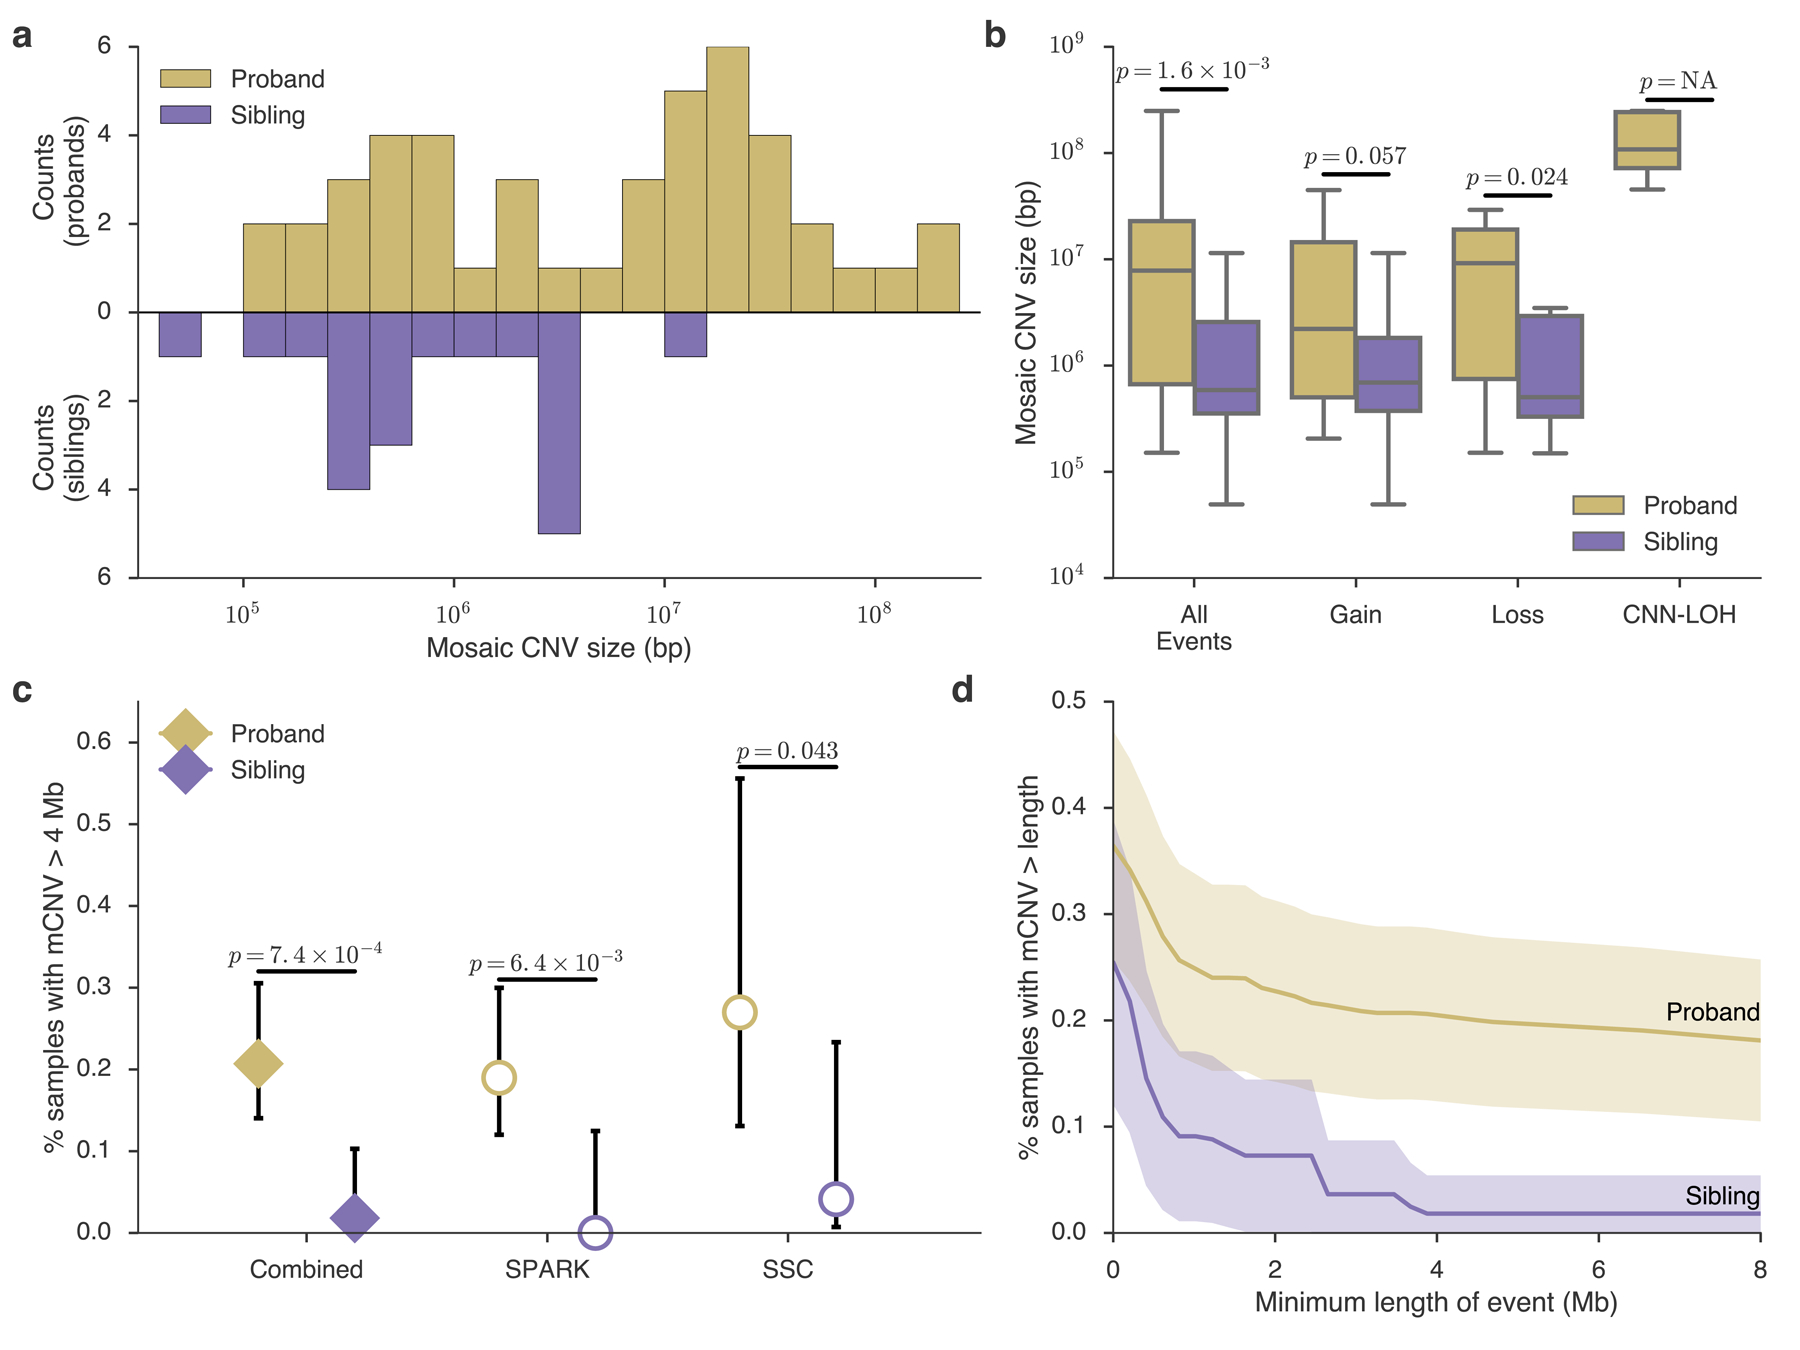
a, Histogram of mosaic CNV sizes in probands (gold) and siblings (purple). b, Box-and-whisker plots of mCNV sizes in probands versus siblings across all events and stratified by copy-number state (Gain, Loss, or CNN-LOH); see Methods for box plot definitions. P-values, one-sided Mann-Whitney U-test. No CNN-LOH events were detected in siblings. c, Percent of probands and siblings carrying a mCNV >4 Mb in size combined across cohorts (filled diamonds) and stratified by cohort (unfilled circles); data presented are rate ± 95% CI (Wilson score interval). d, Percent of probands and siblings carrying a mCNV of length at least L, with L varying from 0–8 Mb; mean (solid lines) ± approximate 95% CI (shaded regions). The burden is robust to the choice of size threshold (Supplementary Figure 11, Supplementary Note 5).
Due to the higher genotyping density in SSC, we had slightly greater power to detect short events in this cohort. To ensure that results were not driven by this sensitivity difference, we recalled events in SSC after randomly subsampling genotyped variants to the density of the SPARK arrays. We found mCNV discovery was robust to genotype density, with perfect recall for mCNVs >1 Mb in size (Supplementary Fig. 6, Supplementary Table 2, Supplementary Note 2).
ASD probands carry a burden of large mosaic CNVs
We investigated whether mCNVs in probands had properties distinguishing them from mCNVs in siblings. The size distribution of mCNVs was markedly different between the two groups (Fig. 1a, Supplementary Fig. 7a): probands carried mCNVs that were an order of magnitude longer on average than those in siblings (median length = 7.8 Mb vs. 0.59 Mb, P = 1.6×10⁻³ Mann-Whitney U-test, Fig. 1a,b), a trend apparent at the cohort level, consistent across copy number states, and robust to genotyping density and the exclusion of CNN-LOH events (Fig. 1b, Supplementary Fig. 7b, Supplementary Fig. 8, Supplementary Note 3). We did not observe a significant difference between mosaic cell fractions of mCNVs in probands and siblings (Supplementary Fig. 9), although this may reflect our limited power to detect mCNVs present in small proportions of cells (Supplementary Note 4, Supplementary Fig. 10)
In both cohorts, we observed a significant burden in probands of mCNVs >4 Mb (P = 0.043 in SSC and P = 6.6×10⁻³ in SPARK, one-sided Fisher’s exact test; Fig. 1c, Supplementary Fig. 7c), a conclusion further strengthened by meta-analysis of the two cohorts (Liptak’s combined P = 1.2 ×10⁻³). We thus pooled events from both cohorts to maximize our statistical power26.
Of mCNVs >4 Mb long, 25 were carried by probands and only 1 was found in a sibling. This significant burden in probands of mCNVs >4 Mb (odds ratio (OR) = 11.4, 95% confidence interval (CI) = 1.5–84.2, one-sided Fisher’s exact P = 7.4×10⁻⁴) was robust to the exclusion of CNN-LOH events (P = 4.0×10⁻³); robust to the exclusion of carriers >20 y.o. (P = 1.7×10⁻³); unaffected by sensitivity differences to small CNVs between SSC and SPARK (Supplementary Figure 7c); and robust to the choice of the 4 Mb length threshold (P = 1.9×10⁻³ after multiple hypothesis correction to adjust for considering all possible thresholds; Methods). The burden was technically significant for smaller choices of threshold as well (e.g. events >1 Mb and >2 Mb; P = 0.018, and P = 0.013, respectively; Fig. 1d; Supplementary Fig. 7d; Supplementary Figure 11). However, these results were driven almost exclusively by events >4 Mb in size (Supplementary Note 5). These results imply an excess of large mCNVs in ~0.2% of ASD cases (95% CI=0.08–0.29%; Methods). Coupled with the observation that such CNVs appear to be extremely rare in unaffected individuals, this finding suggests that large mCNVs contribute substantial ASD risk to a small number of carriers.
We wondered whether some mCNVs <4 Mb in probands might contribute to ASD by altering dosages of specific genes previously implicated in autism susceptibility (“ASD genes”). We analyzed overlap of mCNVs with a curated set of 222 high-confidence ASD genes from the SFARI Gene database (Methods). Smaller (<4 Mb) mCNVs in probands overlapped ASD genes more often than expected by chance (Expected = 1.42, Observed = 4; P = 0.044), in contrast to smaller mCNVs in unaffected siblings (Expected = 1.69, Observed = 1; P = 0.84), suggesting that some smaller mCNVs may also contribute to the etiology of ASD. (This analysis was uninformative for large mCNVs, most of which are expected to overlap at least one ASD gene by chance.)
When possible, we verified that probands carrying an mCNV did not carry other high-risk germline genetic mutations. Of 15 SSC probands with mosaic CNVs, four also carried previously reported dnCNVs6; only one was >1 Mb in size and none overlapped ASD genes. One proband with a mCNV also carried a previously reported de novo loss-of-function (dnLoF) variant in AFM27, a gene with no known connection to ASD (Supplementary Table 3). Compared to other probands in SSC, this group also did not carry excess risk from common variants significantly associated with ASD28 (P = 0.46, Mann-Whitney U-test; Methods), though our power was limited. (We were unable to perform an equivalent analysis for SPARK probands as curated sets of de novo germline CNVs and LoF variants are not yet available for this cohort). These results indicate that mCNVs comprise orthogonal genetic aberrations that independently contribute ASD risk.
Differences between germline and mosaic CNVs
Interestingly, mCNVs in probands had characteristics different from germline dnCNVs previously reported in SSC probands. Mosaic CNVs were significantly larger than dnCNVs (median length = 7.8 Mb vs. 0.92 Mb, P = 7.3×10⁻⁵; Fig. 2a; we limited this comparison to dnCNVs >100 kb, the approximate detection threshold of our mCNV identification algorithm). This trend was consistent when mCNVs were compared to dnCNVs previously reported in the Autism Genome Project29 (AGP) and putative dnCNVs we identified in SPARK (Supplementary Figure 12, Supplementary Note 6). Moreover, mCNVs did not exhibit focal recurrence in any genomic location, though we did observe three events with breakpoints near NTNG1 (encoding netrin G1), in which rare mutations have been identified in individuals with ASD30. (Supplementary Fig. 13 and Supplementary Note 7). Moreover, mosaic versions of ASD-associated dnCNVs recurrently observed in ASD probands6 (ASD-dnCNVs; e.g., 16p11.2 deletion/duplication, 22q11.2 deletion/duplication) were notably absent from ASD probands compared to rates of ASD-dnCNVs (0 of 40 mosaic events vs. 55 of 132 de novo CNVs as reported in Sanders et al. 2015 (ref 6) Table 1; P = 4.2×10⁻⁶ one-sided Fisher’s exact test; Fig 2b, Supplementary Note 8).
Figure 2: Mosaic and germline CNVs have different properties and effects.
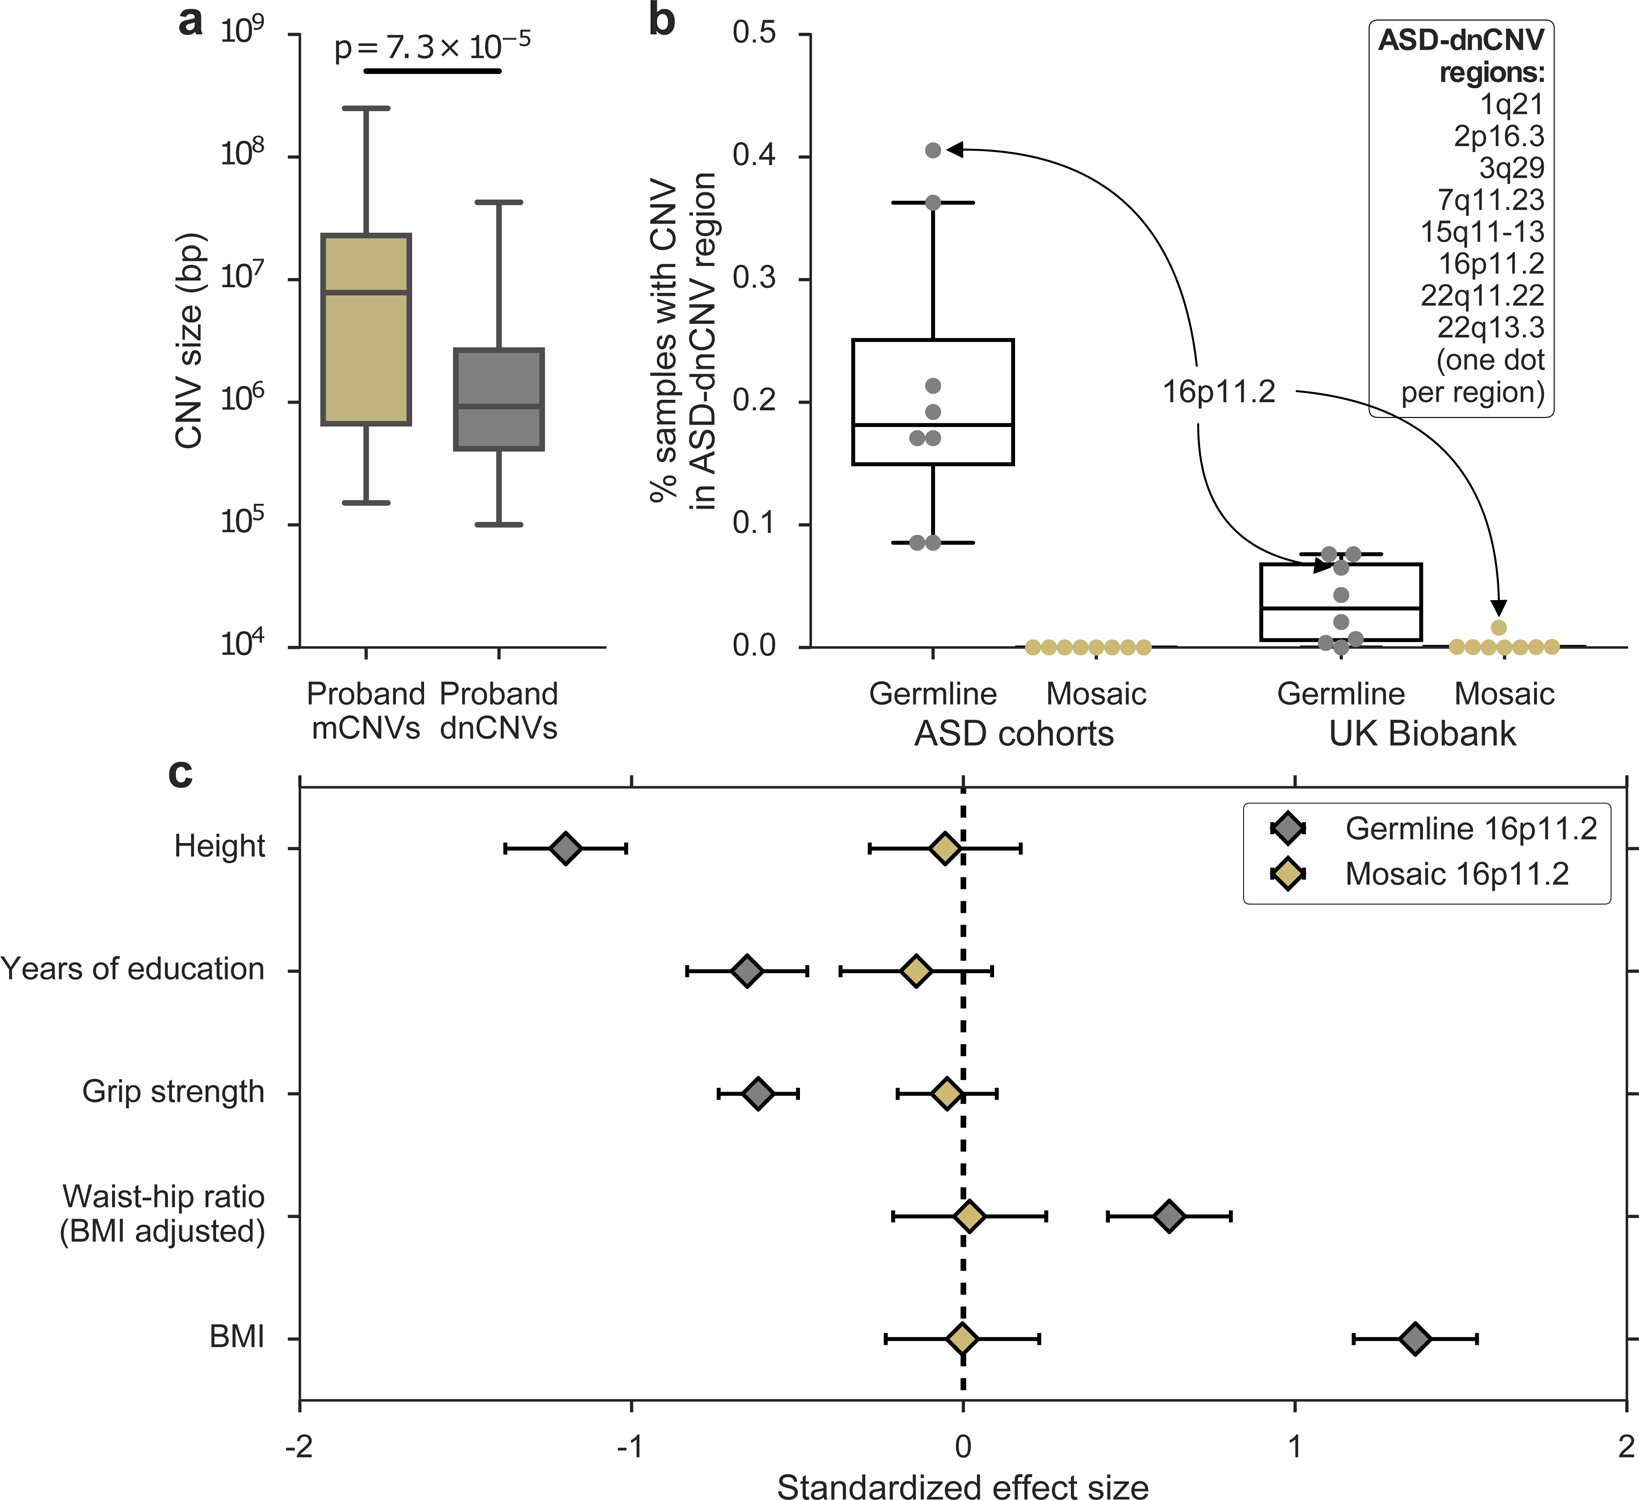
a, Sizes of mCNVs compared to sizes of de novo CNVs (dnCNVs) identified by Ref. 6 in SSC probands. De novo CNVs <100 kb in size were removed to account for our limited sensitivity to detect mosaic CNVs <100 kb in size; p-value from one-sided Mann-Whitney U-test. b, Percent of samples carrying a germline or mosaic CNV (gain or loss) in each of eight ASD-dnCNV regions in ASD cohorts (SSC + Autism Genome Project for germline; SSC + SPARK for mosaic) or the UK Biobank. Each marker indicates the percent of carriers of a specific ASD-dnCNV; markers corresponding to 16p11.2 CNVs are indicated with callouts. c, Effects of germline (n = 111) and mosaic (n = 71) 16p11.2 deletions on phenotypes previously associated with 16p11.2 deletions (units, s.d.). Phenotypes were missing for some samples; see Supplementary Table 6 for exact sample sizes for each association. See Methods for box plot definitions.
We hypothesized that such mosaic analogues of ASD-dnCNVs 1) may be very rare or 2) may confer little or no ASD risk. To obtain further insight into both questions, we examined mosaic events previously detected in a population sample of 454,993 individuals of European ancestry in the UK Biobank (UKB)22. Mosaic analogues of ASD-dnCNVs occurred much more rarely than their germline counterparts (Fig 2b, Supplementary Table 4); among eight previously-reported ASD-dnCNVs6, only 16p11.2 deletions were detected recurrently in the mosaic state (in 73 UKB samples comprising 0.016% of the cohort; Supplementary Note 9). Mosaic status was not associated with mental health conditions (Supplementary Table 5), although our power was very limited by the sparsity of reported mental health diagnoses.
To better understand the phenotypic relationship between germline ASD-dnCNVs and mosaic analogues, we identified carriers of germline 16p11.2 deletions in the UK Biobank (Supplementary Fig. 14, Methods) and compared their phenotypes to those of mosaic 16p11.2 deletion carriers. While we were underpowered to directly measure ASD risk conferred by 16p11.2 deletions, we could compare the effects of germline and mosaic 16p11.2 deletions on quantitative traits measured in UKB. Consistent with previous reports31–33, germline 16p11.2 deletions were strongly associated with several traits including fewer years of education, increased BMI, and decreased height. However, mosaic 16p11.2 deletions were not associated with any of these traits (Fig. 2c) even when restricting to events at high cell fractions (Supplementary Table 6). These data reinforce our observation that the burden of mCNVs in ASD probands was driven by large mCNVs that disrupted large swaths of the genome; smaller mosaic CNVs may generally have limited phenotypic consequences, even when disrupting ASD-associated regions.
Mosaic CNV length associates with ASD phenotype severity
We next determined whether properties of mCNVs carried by probands were associated with ASD severity in these probands. ASD phenotypes were assessed with three measures common to both the SSC and SPARK cohorts, of which one measure – the Social Communication Questionnaire (SCQ) – was available for the majority of proband mCNV carriers in both cohorts (13 of 17 SSC carriers and 20 of 29 SPARK carriers; Supplementary Table 1). The SCQ is a standardized evaluation form completed by a parent rating an individual’s symptomatic severity throughout his or her developmental history; higher scores reflect a more severe ASD phenotype. Larger mCNV size significantly correlated with increased ASD severity as quantified by SCQ score (Fig. 3; Pearson correlation R = 0.43, P = 0.016). The longest mCNVs were CNN-LOH events; such events can both modify gene expression within imprinted regions and convert heterozygous gene-disrupting variants to the homozygous state (Supplementary Table 7, Supplementary Note 10). These results further highlight the important role of size when considering the potential pathogenicity of a mosaic event: larger mCNVs appear to be both more likely to result in ASD and to produce more severe phenotypes. We did not observe an association between mCNV cell fraction and phenotypic severity (Fig. 3, Supplementary Fig. 15).
Figure 3: Mosaic CNV size positively correlates with ASD severity.
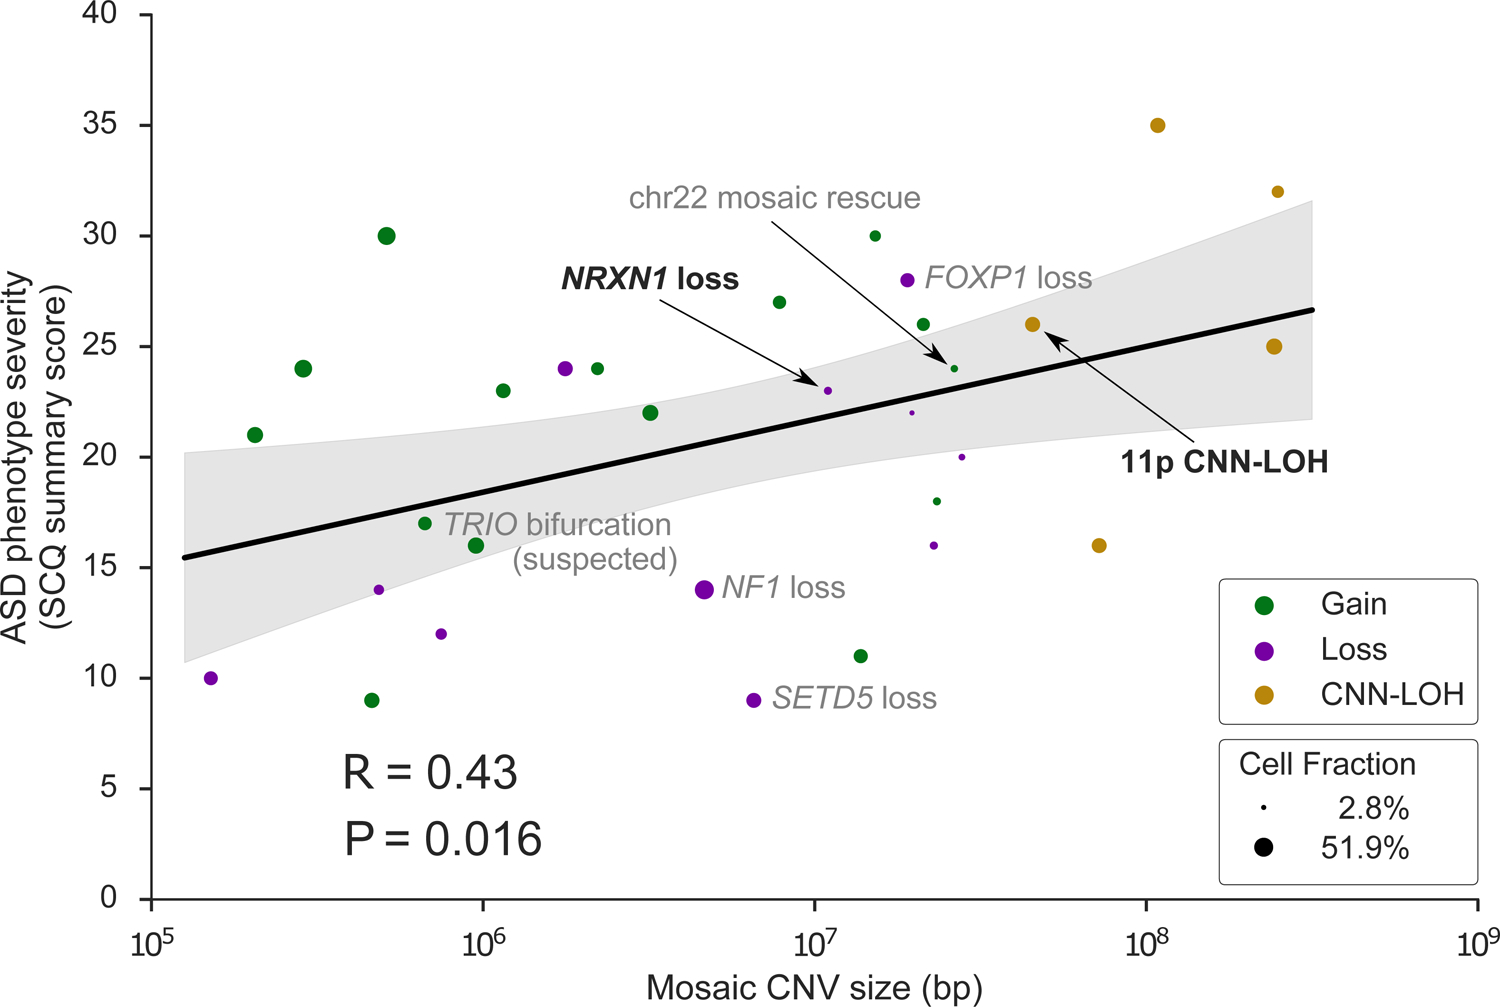
ASD severity (quantified by the Social Communication Questionnaire (SCQ) summary score) versus mCNV size (n = 31 probands with reported SCQ score). For probands with more than one mCNV, the longest event size is used. Marker color indicates mosaic copy number state; marker size indicates mosaic cell fraction. Events discussed in the main text are labeled with black text; events discussed in Supplementary Notes are labeled with grey text. R, Pearson correlation coefficient. Data are presented as regression mean (solid line) ± 95% CI (shaded region). The association was robust to the scale used for CNV size (Spearman rank correlation Rs = 0.42, P = 0.019).
Identification of a complex mosaic CNV in brain tissue
Although mosaic CNVs are uncommon, they have been previously identified in subsets of single neurons in both normal and diseased brain tissue34,35. Their presence in a subset of cells presents the opportunity to identify essential cell types for a phenotype; thus we sought to computationally identify and experimentally validate mCNVs directly in brain tissue, although we reasoned that the mCNVs we ascertained from blood- and saliva-derived DNA were likely present throughout the body given their moderate-to-high cell fractions36 and the young ages of carriers. We performed whole-genome sequencing of post-mortem brain tissue from an additional 60 probands obtained through the NIH Neurobiobank and Autism BrainNet (Supplementary Table 8). We genotyped germline variants using GATK HaplotypeCaller best practices37 and identified mCNVs using MoChA (Methods).
We found two mosaic events (Supplementary Table 9): a mosaic 10.3 Mb gain of 2pcen-2q11.2 in sample AN09412 (Fig. 4a) and a mosaic loss of Y in ABN_XVTN. We also discovered 9 germline CNVs overlapping ASD genes in other individuals, revealing potential causes of disease in several previously unresolved cases (Supplementary Table 10, Supplementary Fig. 16, Supplementary Note 11).
Figure 4: A complex mosaic chromosomal rearrangement present in neurons.
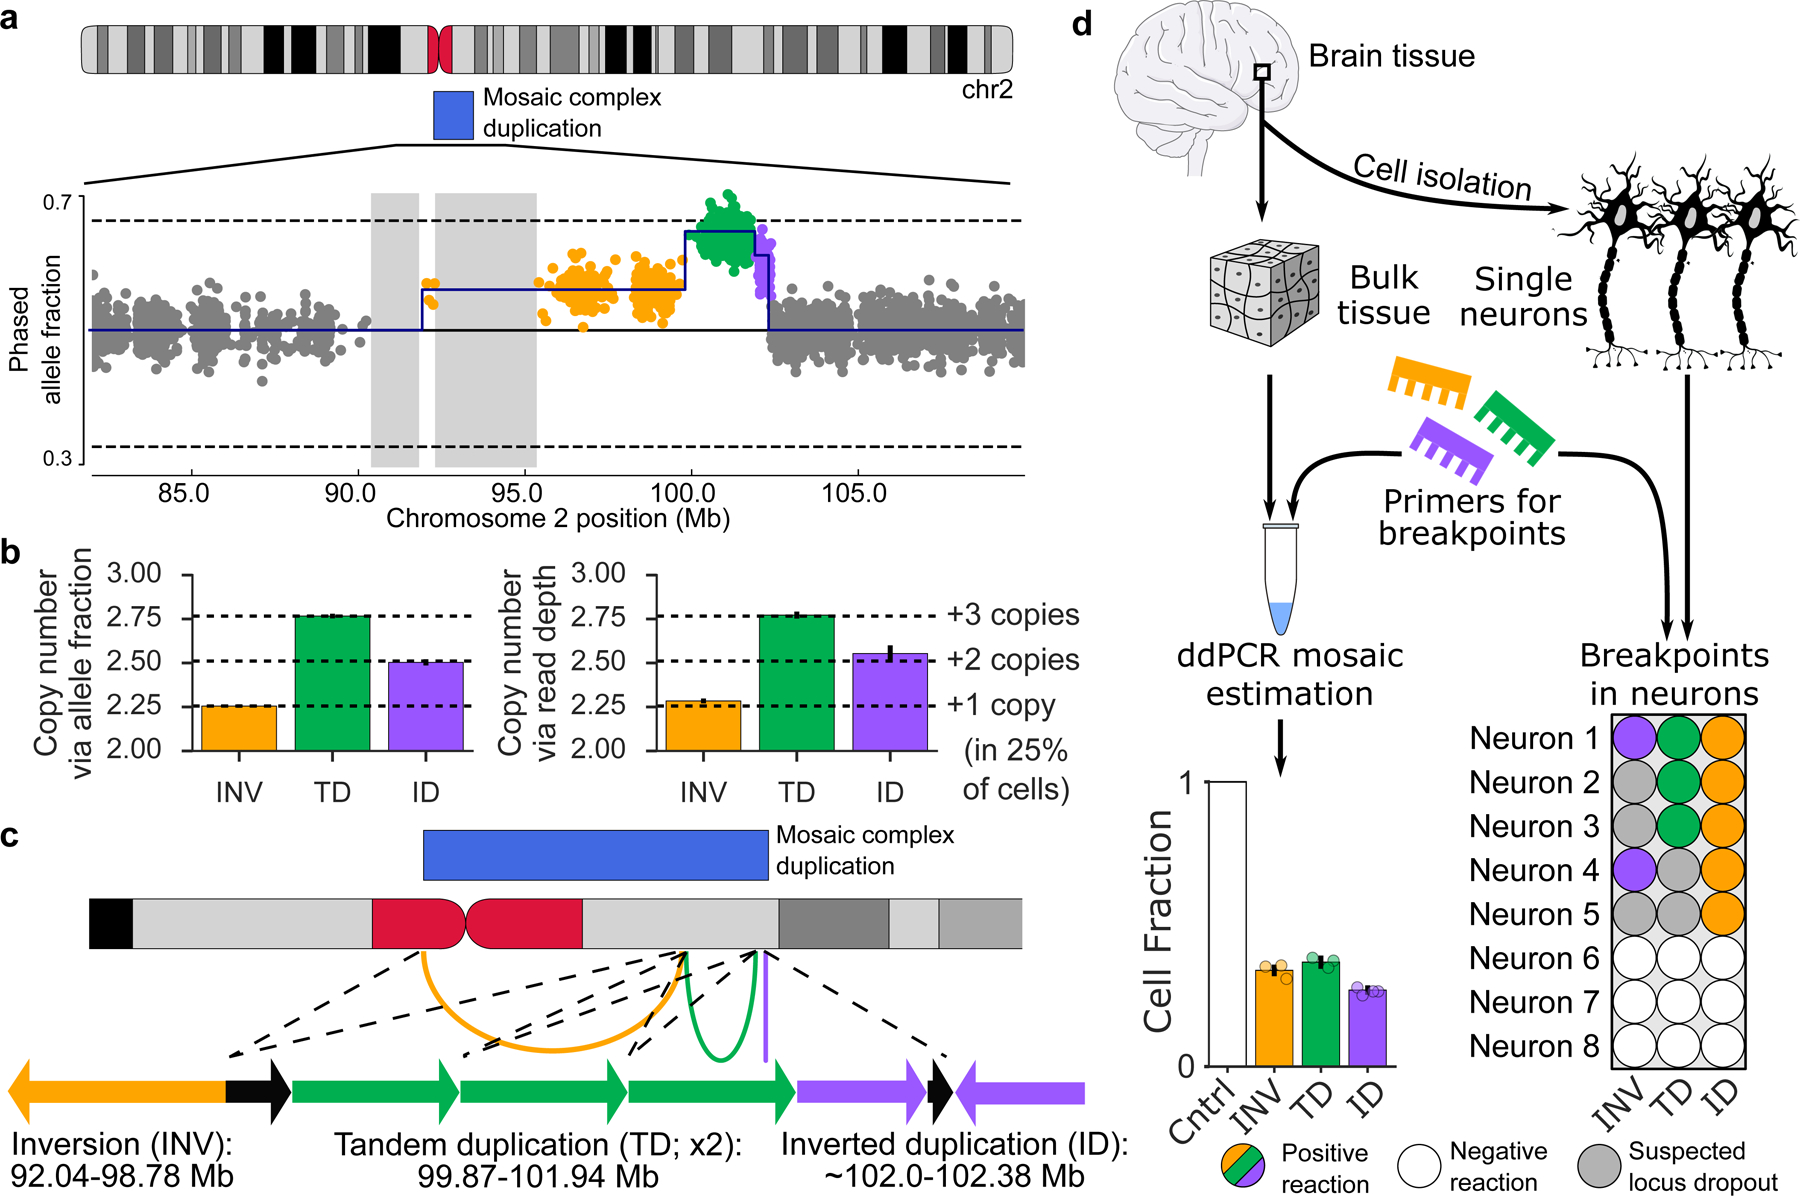
a, Phased allele fraction at heterozygous SNPs on chromosome 2, binned into groups of four adjacent SNPs. SNPs within the mCNV are highlighted, with distinct copy-number states indicated in different colors. Assembly gaps >1 Mb are shaded. b, Estimated mean copy number in each mCNV region as inferred from phased allele fractions (left) and sequencing read depths (right) at heterozygous SNPs; mean ± 95% CI (n INV=876, n TD=1170, n ID=375). Confidence intervals on allele fraction-based estimates are very narrow. c, Inferred structure of a complex duplication consistent with the observed data. Arcs on the ideogram indicate fusions supported by breakpoint analysis. Arrows are a schematic reconstruction of the event (not to scale); each arrow points in the 3’ direction relative to the GRCh37 reference genome. Black arrows indicate genomic regions with a single copy in the proper orientation within the duplicated region. The left breakpoint of the inverted duplication is approximate. d, Experimental validation of the three breakpoints, labeled according to their corresponding segment (inversion, INV; tandem duplication, TD; inverted duplication, ID). Left, fractions of cells containing each breakpoint estimated using digital droplet PCR (ddPCR) on DNA extracted from bulk brain tissue; mean ± approximate 95% CI (# experimental replicates: INV=3, TD=3, ID=4; replicates are shown as individual points). Right, validation of co-occurrence of breakpoints in single neurons. Observation of some but not all breakpoints in some neurons is probably explained by locus dropout, a common feature of single cell whole-genome amplification50.
The gain event on chromosome 2 in AN09412 was unique in that it appeared to exhibit three segments with varying degrees of mosaicism (Fig. 4a). Using phased allele fractions of germline heterozygous SNPs and depth-of-coverage of sequencing reads, we estimated that the three segments were present in a ratio of 1:3:2 (Fig. 4b). Breakpoint analysis using split reads and discordantly mapped reads revealed three breakpoints (Supplementary Table 11): a tail-to-tail (T2T) inversion of 92.03–99.78 Mb, a tandem duplication (TD) of 99.87–101.94 Mb, and a head-to-head inversion (H2H) located at 102.38 Mb, each of which corresponded to one of the three segments. Using this information, we reconstructed a parsimonious linear structure of the event (Fig. 4c, Methods) consistent with gain of a single complex rearrangement present in 26% of cells (Fig. 4b).
Using quantitative digital droplet PCR (ddPCR), we confirmed that the three breakpoints were present in both neurons and non-neurons at a 26–36% mosaic cell fraction (Fig. 4d), indicating the mCNV arose in a fetal progenitor that gave rise to both neurons and glial cells. (Non-brain tissue was not available for this sample, so we could not investigate the presence of the CNV elsewhere.) We further confirmed that all three breakpoints occur within individual neurons using single cell ddPCR (Fig. 4d) and that none of the breakpoints were present in DNA from a control brain using gel electrophoresis (Supplementary Fig. 17), suggesting that the CNV arose from a single event, likely at a very early stage of development. While the clinical significance of this complex mosaic CNV is uncertain, it disrupts the same region as multiple pathogenic events reported in the DECIPHER database that are associated with intellectual and developmental disability38,39 (Supplementary Fig. 18).
We also validated the mosaic loss of Y in ABN_XVTN (Supplementary Fig. 17) and determined that the loss was limited to non-neuronal cell populations. This finding was unsurprising given that the ABN_XVTN donor was 74 y.o. (the oldest in the cohort) and age-related loss of Y has been reported extensively in blood40 and more recently in aging brain tissue41.
These results complement our analyses of mCNVs in large ASD cohorts, in which we analyzed DNA derived from blood and saliva under the assumption that mCNVs detected at moderate-to-high cell fractions were likely present throughout the body. Our validation of a mCNV in post-mitotic neurons of AN09412 indicates that mCNVs can arise during early development and propagate to multiple cell lineages in the adult body.
Discussion
Here we demonstrate that large mosaic CNVs contribute a modest but important component to ASD risk, at a rate about 20X lower than germline de novo CNVs (~0.2% vs. ~5% excess in probands), which are strongly associated with increased risk of ASD4–6. Whereas very large (>4 Mb) germline CNVs are rare in both affected and unaffected individuals6,42, very large mosaic CNVs accounted for a substantial proportion of mosaic chromosomal aberrations we observed. While the threshold of >4 Mb is larger than those generally used in clinical interpretation of germline CNVs43, our power to assess a burden below this threshold was extremely limited (as we only observed 5 mCNVs of size 1–4 Mb in probands and 4 in siblings). We thus selected 4 Mb as the size threshold for our primary analyses.
Large mosaic CNVs significantly increased ASD risk, and increasing mosaic CNV size correlated with increasing ASD severity in affected individuals. In contrast, smaller, ASD-associated CNVs (such as 16p11.2 deletion) appeared to have limited phenotypic consequences in the mosaic state, suggesting that mosaic and germline CNVs may result in autism by fairly different mechanisms: the recurrent ASD CNVs (e.g., 16p11.2, 22q11.2) appear to be required in most cells to create disability, whereas the mosaic events are typically larger and hence likely more toxic, but limited to a fraction of cells. We hypothesize that these events are not observed as germline ASD events because large mosaic CNVs are more survivable than very large germline CNVs, which commonly cause spontaneous miscarriage44.
Assessing the clinical significance of the identified mosaic CNVs was challenging not only because of their large size and lack of analogous germline CNVs but also because of the phenotypic heterogeneity of ASD45 and the limited phenotype data provided for each proband. Nonetheless, we observed several mosaic CNVs with possible connections to the individual’s phenotype (Supplementary Fig. 19–22, Supplementary Notes 12–14). These included 1) an individual with a mosaic 18q distal deletion who had no verbal communication at 47 years of age, a common feature of germline 18q distal deletions46; 2) a proband with a germline-mosaic compound heterozygous knockout of NRXN1: the proband carried a mosaic NRXN1 deletion on the paternal haplotype and an inherited rare start-lost germline variant on the maternal allele; and 3) a proband with an acquired paternal uniparental disomy (UPD) of 11p and reported growth delays reminiscent of germline disruption of the 11p15.5 imprinted region. These anecdotes hint at possible molecular mechanisms and clinical consequences of mosaic CNVs, which are likely to be even more complex and heterogeneous. For example, we discovered an apparent partial mosaic rescue in which a mosaic duplication appeared to revert an 8 Mb de novo germline deletion of distal 22q. We also observed mosaic UPD and CNN-LOH of chromosome 1 and 2 (two events on each chromosome), each of which converted heterozygous gene-disrupting variants to the homozygous state, but their clinical relevance was of unknown significance.
While our results provide strong evidence that large mosaic CNVs confer ASD risk, our study does have limitations that suggest avenues for future exploration. The modest number of mosaic CNVs we detected precluded investigating properties of mosaic CNVs such as burdens at smaller length scales (e.g. 1–4 Mb), recurrence patterns, effects of mosaic cell fraction on phenotype, and genetic or environmental factors that predispose an individual to mosaic copy number variation. These factors limited our ability to precisely estimate the ASD risk that mosaic CNVs confer. As deeply phenotyped ASD case-control cohorts continue to expand, we believe these questions will become answerable and risk estimates will be further refined.
Moreover, our analysis of mosaic analogues of ASD-associated de novo CNVs in the UK Biobank provides useful, though incomplete insight into the phenotypic consequences of mosaic CNVs. As a population-level resource, the UK Biobank has some ascertainment bias for healthy individuals47, and thus affected carriers may be underrepresented. We believe this is unlikely to strongly bias our results because carriers of large-effect variants are not fully excluded, as verified by the presence of 121 carriers of 16p11.2 germline deletions with the expected phenotypes (e.g., mean height reduced by 1.2 s.d.). In addition, the cell fraction of a mosaic event is likely associated with phenotypic outcome, although the nature of this relationship remains an open question. While we did not observe significant effect-sizes when restricting to carriers of high cell-fraction 16p11.2 mosaic deletions, our statistical power was limited by the small number of carriers (N = 35). Indeed, distinguishing between germline CNVs and very high cell-fraction mosaic CNVs is extremely difficult, and it is likely that germline analyses have inadvertently included some high cell-fraction mosaic CNVs and that our analysis may have inadvertently excluded some of these events.
Additionally, while we demonstrated the existence of mosaic CNVs in a small set of post-mortem brain tissue samples, our primary analyses relied on mosaic CNVs computationally ascertained from blood and saliva genotyping available in large cohorts. We believe most of these mosaic CNVs represent true early-developmental mutations present across tissues (based on high cell fractions, young ages of participants, and conservative filters to exclude clonal hematopoiesis events), but caution is nonetheless warranted in interpreting our results and similar analyses of peripheral tissues. As efforts to directly assay the genome of the brain expand48,49, we expect the risk contribution and molecular mechanisms of mosaic CNVs to be further refined for both ASD and other neurodevelopmental disorders.
Methods
Genotyping intensity data
Genotyping intensity data for probands, siblings and parents in SSC and SPARK were obtained from SFARI Base. For each genotyped position, the data included the genotype call, the B allele frequency (BAF; proportion of B allele), and Log-R ratio (LRR; total genotyping intensity of A and B alleles) as provided by SSC and SPARK. Further information is available in the Life Sciences Reporting Summary.
Three types of genotyping arrays were used for SSC samples: Illumina 1Mv1 (n=1,354 individuals), Illumina 1Mv3 (n=4,626 individuals), and Illumina Omni2.5 (n=4,240 individuals). Details of data generation have been previously described in Sanders et al. 2015 (ref. 6). SPARK samples (n=27,376 individuals) were genotyped on the Illumina Infinium Global Screening Array-24 v.1.0. Details were previously described in Feliciano et al. 2018 (ref. 51). We did not analyze SPARK samples which had been previously genotyped on a different array as part of a pilot study (n=1,361 individuals).
We defined probands to be individuals with a diagnosis of ASD. We defined “unaffected siblings” as family members without an ASD diagnosis in the same generation as a proband (most of which were siblings). We defined parents as unaffected individuals with a proband as a biological child.
Converting Illumina Final Reports to BCF format
Genotyping intensity data for SSC were distributed in the Illumina Final Report format with genotyped positions reported with respect to the hg18 human reference genome. Positions were lifted over to hg19 coordinates based on rsID number. Positions without a rsID were discarded. Final Reports were converted to the BCF format and genotypes were converted from Illumina TOP-BOT format to dbSNP REF-ALT format using custom in-house scripts (positions for which TOP-BOT format could not be unambiguously converted to REF-ALT format were discarded). Samples from each of the three arrays were processed as separate batches.
Genotyping intensity data for SPARK were converted from PLINK PED format to BCF format using the recode option in plink1.9. Genotypes were converted from Illumina TOP-BOT format to dbSNP REF-ALT format using a modified version of the bcftools plugin fixref (URLs). Only single-nucleotide variants were retained for analysis.
LRR denoising for SPARK samples
We observed genome-wide spatial autocorrelation “wave” patterns52 in numerous SPARK samples. Since the wave pattern was consistent across samples for each chromosome, we corrected the bias using the following algorithm based on principal components analysis:
Determine the mean LRR per chromosome per sample. For each sample, mean-shift the LRR signal genome-wide by the median of chromosome means for that sample.
- For chromosome i:
- Determine the cohort-wide LRR deviation for the chromosome as the median of mean chromosome LRR signal across samples. Mean-shift each sample’s chromosome LRR signal by the cohort-wide LRR deviation.
- To prevent confounding due to sex, this correction is performed independently for males and females.
- For each chromosome i:
- Project the LRR matrix (number of samples by number of genotyped positions on chromosome i) onto the space spanned by its top k principal components. Subtract the projected matrix from the full LRR matrix.
Steps 1–2 of the algorithm mean-center the LRR signal genome-wide across an individual and per chromosome across the cohort. This is necessary to prevent PCA from projecting away mean-shifts due to large mosaic CNVs. Step 3 removes the variance explained by the top principal components. In practice, we found effectively removed the wave pattern (Supplemental Fig. 23).
PCA analysis was performed using the PCA method from the python package sklearn53, which implements efficient PCA using randomized singular-value decomposition. LRR values were extracted from BCF files using `bcftools query` and corrected values were incorporated into BCF files using `bcftools annotatè. One sample with >5% genotype missingness was excluded from the correction procedure. On average across autosomes, the top 10 PCs explained 57.1% of LRR variance in the SPARK cohort.
Variant-level quality control
We excluded genotyped variants with high levels of genotype missingness (>2%), evidence of excess heterozygosity (P < 1e–6, one-sided Hardy-Weinberg equilibrium test), and unexpected genotype correlation with sex (P < 1e–6, Fisher exact test comparing number of 0/0 genotypes vs. number of 1/1 genotypes in males and in females). We also exclude genotyped variants falling within segmental duplications with low divergence (<2%). Variant-level QC was performed for each array independently. The number of genotyped variants and number of variants excluded by QC are listed in Supplementary Table 12.
Sample-level quality control
We calculated two statistics to detect sample contamination: BAF concordance and BAF autocorrelation. Given a heterozygous SNP has BAF >0.5 (<0.5), BAF concordance is the probability that the following heterozygous SNP is >0.5 (<0.5). BAF autocorrelation is the correlation of the BAF at a heterozygous SNP with BAF at the neighboring (downstream) heterozygous SNP. For each sample, we calculated the statistic for each chromosome independently and took the median across all chromosomes as the sample value.
Neighboring positions with heterozygous genotypes in the genome are expected to have uncorrelated genotype intensity measures on an array. BAF concordance and BAF autocorrelation significantly higher than, respectively, 0.5 and 0, could reflect sample contamination with DNA from another individual because allelic intensities will be correlated at variants within haplotypes shared between the sample DNA and contaminating DNA. In SSC, we removed samples with BAF concordance > 0.51 or BAF autocorrelation >0.03, resulting in the exclusion of 11 probands and 9 siblings. We also excluded an additional proband (array ID: 7306256088_R02C01) with evidence of a large amplitude LRR wave pattern. In total, 2,594 probands and 2,424 siblings from SSC passed quality control (Supplementary Table 13).
In SPARK, we observed genome-wide evidence of BAF correlation between contiguous genotyped positions in high-quality samples. Thus, BAF concordance and BAF autocorrelation were not informative measures of contamination. Instead, we excluded samples with evidence of multiple very low cell-fraction CNN-LOH events (<10 % of cells and LRR deviation from zero < 0.2) because the probability of observing two or more true CNN-LOH events in a sample is exceedingly small given the young age of the individuals. We further removed any samples from individuals that had also participated in SSC (n=352) and one additional proband (SP0072755) that had an uncorrected LRR wave pattern after LRR denoising, resulting in exclusion of 622 probands and 54 siblings. Finally, we removed 37 siblings with a reported genetic diagnosis (of which one carried a mCNV; see main text). In total, 9,483 probands and 3,076 siblings from SPARK passed quality control (Supplementary Table 13).
Haplotype phasing
We used Eagle2 (ref. 20) (default settings) and the Haplotype Reference Consortium54 phasing panel to perform statistical haplotype phasing of SSC samples. We performed phasing for each genotyping array independently. For probands and siblings we additionally used parental genotypes to correct phase-switch errors using the bcftools plugin trio-phase included with MoChA. Given the size of the SPARK cohort (>27,000 samples), we performed within-cohort statistical phasing using Eagle2. We additionally corrected proband and sibling phase estimates using parental genotyping data when available (at least one parent was also genotyped for the vast majority of probands and siblings). The combination of statistical haplotype phasing and pedigree-based phasing resulted in nearly perfect long-range phase information without phase-switch errors.
Discovery of mosaic CNVs
We applied MoChA to each genotyping array batch independently to detect mosaic CNVs. The general statistical approach implemented in MoChA has been previously described21. In brief, mCNVs result in allelic imbalance between the maternal and paternal haplotypes. Thus, the BAF of heterozygous SNPs within an mCNV will consistently deviate from the expected value of 0.5 toward either the paternal allele or the maternal allele. Such deviations can be sensitively detected even at low cell-fractions using long-range phase information provided the event is long enough to contain multiple genotyped heterozygous SNPs. Formally, MoChA uses a hidden Markov model (HMM) to search for consistent deviations. Gains (losses) also result in an increase (decrease) of total LRR signal with magnitude proportional to the cell fraction of the event; an HMM can also be used to detect LRR deviations from zero. Incorporation of phase information particularly increases sensitivity to detect large, low-cell fraction CNVs relative to previous models21.
The details of MoChA differ from the previously described approach in two ways. First, MoChA uses two independent models to search for mCNVs: a haplotype-phase model (BAF+phase) as described in Loh et al. 2018 (ref. 21) and an LRR and (unphased) BAF model (LRR+BAF) similar to previous models for the detection of germline CNVs55. A CNV is reported if it is discovered by either model. The introduction of the LRR+BAF model enables detection of germline (or very high cell fraction mosaic) losses and germline duplications including more than two haplotypes. Second, MoChA uses the Viterbi algorithm to search for deviations in either the phased BAF signal or the LRR signal instead of computing total likelihoods and applying a likelihood ratio test. The Viterbi algorithm is more direct, but its calibration is less precise when detecting very low cell fraction events. However, since we were interested in higher-cell-fraction mCNVs arising during early embryogenesis, such sensitivity was not necessary for this study.
Central to the sensitivity of MoChA is the quality of the long-range phase information. As discussed above, the combination of statistical haplotype phasing and pedigree phasing using parental genotypes resulted in near-perfect long-range phase information without phase-switch errors.
Classification of mosaic copy-number state
We needed to sensitively distinguish age-related and early-developmental mCNVs in a way that was robust to LRR signal noise due to e.g. GC content. Previous work on mosaic CNVs have not typically distinguished between age-related and early-developmental events. Thus we developed a new statistical method to classify events as gains, losses, CNN-LOH, or unknown using an Expectation-Maximization (EM) algorithm similar to K-means clustering where each cluster is defined by a line instead of a centroid. Let X = |ΔBAF| be the absolute deviation from 0.5 of phased BAF estimated across an event; let Y = |ΔLRR| be the absolute deviation from 0 for LRR estimated across an event, and let denote the copy-number state of the mosaic mutation. Then for gains, and will linearly increase according to , where ; for losses, Y will linearly decrease as X increases according to , where ; and for CNN-LOH, , where is Gaussian noise in the estimation of X and Y.
Given a set of events, the parameters of the linear models and the copy-number state for each event are unknown. We thus iteratively apply the following custom expectation-maximization algorithm:
Randomly initialize and and set
- Assign each event a copy-number state using least-squares classification:
- Estimate the linear model parameters for using univariate linear regression without an intercept term applied to all events assigned to class in step 2:
- Since is known, it is not re-estimated.
Repeat 2–3 until convergence.
Estimate and using univariate linear regression on the events classified as gains and losses, respectively.
To classify mCNV copy-number states in probands and siblings, the model was first trained on mCNVs in parents (after removal of germline CNVs). Events in probands and siblings were then classified using the linear model parameters estimated from the parents. The method implicitly accounts for error in LRR and BAF measures and thus is robust to noise in these signals.
We applied an additional step to improve classification of events extending to telomeres, given that CNN-LOH events generally arise due to mitotic recombination and therefore terminate at a telomere. To ensure apparent gains and losses terminating at a telomere were not misclassifications, we calculated the Bayes factor to compare the likelihood the event arose under the Gain or Loss model against the likelihood under the CNN-LOH model:
where and is the standard deviation estimated from fitting the model on parental data. If for a putative gain or loss terminating at a telomere, the copy-number state was reclassified as unknown.
Filtration of mosaic CNV calls
In probands and siblings
Following Sanders et al. 2011 (ref. 56), we required all potential mCNVs to overlap at least 20 heterozygous SNP sites. We then excluded germline events and events likely to arise due to age-related clonal hematopoiesis. To remove germline events, we filtered all events designated as a “copy number polymorphism” by MoChA; given a panel of known CNV polymorphisms (1000 Genomes Project in this case), for each sample and each segment in the list of polymorphisms MoChA checks for evidence of 1) germline copy number alteration within the segment and 2) diploid copy number in the regions on either side of the segment. A segment within a sample satisfying both conditions is classified as a copy number polymorphism.
We additionally excluded any event which reciprocally overlapped an event found in an individual’s biological parents by >85% or reciprocally overlapped any CNV reported in the 1000 Genomes Project42 by >75%. When calculating overlap, we accounted for copy-number state: overlaps between gains and losses were not considered. Finally, we removed any event with an estimated cell fraction >1. For gains, we additionally removed any events with to ensure germline gains were not misclassified as mosaic, following previous work21,23.
To filter mCNVs likely to have arisen due to clonal hematopoiesis, we excluded mCNVs contained within loci commonly altered within the immune system, specifically IGH (chr14:105,000,000–108,000,000) and IGL (chr22:22,000,000–24,000,000). We also excluded CNVs within the extended MHC region (chr6:19,000,000–40,000,000) due to the known propensity to call false-positive mosaic CNN-LOH events within this locus21. We also removed events whose copy-number state could not be determined, and, following Vattathil et al.23, we classified and removed CNN-LOH events in less than 20% of cells (i.e.,) as likely clonal hematopoiesis. The filtration of low cell-fraction CNN-LOH removed 73 calls in probands (34 in SSC and 39 in SPARK) and 48 calls in siblings (28 in SSC and 20 in SPARK). The rate of low cell-fraction CNN-LOH (<1% in probands and siblings) is consistent with rates observed in individuals <45 years old in the UK Biobank21. We further excluded one CNN-LOH event in a proband >20 years old because his age (43 y.o.) increased the probability the event could have arisen due to clonal hematopoiesis.
In parents
We also called mCNVs in parents for the purpose of fitting the EM model (described above) that we subsequently used to infer copy-number state of mCNVs in probands and siblings. Prior to fitting the EM model on events called in parents, we filtered events labeled as copy number polymorphisms by MoChA, reciprocally overlapping 1000 Genomes Project CNVs by >75%, reciprocally overlapping events in other adults by >80%, or reciprocally overlapping events in non-biological children by >80%.
Determination of haplotype-of-origin
For mosaic gains and losses, the parental haplotype-of-origin was defined to be the haplotype carrying the mCNV. For CNN-LOH the parental haplotype-of-origin was defined to be the haplotype that was duplicated. To assign haplotype-of-origin, we calculated the average ALT allele frequency of heterozygous SNPs at which the ALT allele was unambiguously inherited from the father and the average ALT allele frequency of heterozygous SNPs at which the ALT allele was unambiguously inherited from the mother. For losses, the haplotype-of-origin was paternal if the average allele fraction of paternal SNPs was less than that of maternal SNPs; otherwise the haplotype-of-origin was maternal. For gains and CNN-LOH, the haplotype of origin was paternal if the average allele fraction of paternal SNPs was greater than that of maternal SNPs; otherwise the haplotype-of-origin was maternal.
Burden analysis
The statistical significance of the hypothesis that probands carry more mCNVs > 4 Mb than their unaffected siblings was quantified using a one-sided Fisher’s Exact Test. 95% confidence intervals for the percent of samples carrying an mCNV were calculated using Wilson’s score interval. To adjust the burden p-value for multiple possible choices of the size threshold for defining “large mCNVs,” we performed the following permutation analysis: proband and sibling labels of mosaic CNVs were randomly permuted based on the total number of probands and siblings in our study. We then determined the p-value of the most significant burden across all size thresholds for the permutation. This procedure was repeated 100,000 times. We calculated the threshold-adjusted p-value as
where is the uncorrected p-value from the observed data, Pi is the maximum burden p-value from permutation i, and 1 is the indicator function.
The excess burden of large (> 4 Mb) mosaic CNVs in ASD probands was estimated as the difference between the percent of probands carrying a large mCNV and the percent of siblings carrying a large mCNV. The 95% CI between proportions was estimated using Wilson’s score interval as modified by Newcombe57.
Overlap of mCNVs with ASD genes
We downloaded all genes included in the SFARI Gene database of genes implicated in ASD. We restricted the list to the 222 genes that are classified as “Category 1” (high confidence), “Category 2” (strong candidate), or “S” (syndromic). We refer to this restricted list of genes as “ASD genes”. We determined whether mosaic CNVs overlapped ASD genes by annotating their overlap with all genes in the RefSeq database and intersecting the name of the RefSeq genes with the ASD gene list.
To determine whether a set of mCNVs overlapped ASD genes more often than expected by chance, we randomly permuted the mCNVs in probands around the genome K times, excluding assembly gaps >1 Mb in size in the hg19 reference. After each permutation we determined the number of segments overlapping an ASD gene. Let be the number of mCNVs overlapping ASD genes in the observed data. Let Ni be the number of permuted segments overlapping ASD genes in permutation . The P-value of observing or more overlaps by chance is where is the indicator function. When testing ASD gene overlap for short events (<4 Mb), we used K=10,000. For long events, we used K=1,000 for computational efficiency. We excluded CNN-LOH events when testing long events because they were too large to be randomly permuted.
Risk from common ASD-associated variants
We obtained variant effect sizes for common variants significantly associated with ASD at the genome-wide level (P < 5×10⁻⁸) from Table 1 of Grove et al. 2019 (ref 28), the largest ASD GWAS published to date. We obtained genotypes for SSC samples from whole-genome sequencing, available for most of the cohort, and we calculated each individual’s risk as a linear combination of genotypes weighted by variant effects. We excluded one variant (rs71190156) because it had >50% missingness across individuals, and we excluded any individual with missing genotypes for any other variant. In total, we examined risk from 11 variants in 2310 probands and 1868 siblings. Of these, 10 probands and 6 siblings carried mCNVs, so our statistical power to compare between groups was very limited.
Counts of germline CNVs
Counts of germline ASD-associated CNVs in ASD cohorts were obtained from Sanders et al.6, Table 2 (which included samples from SSC and the Autism Genome Project, AGP). Counts of germline ASD-associated CNVs in UK Biobank individuals were obtained from Crawford et al.32.
Identification of 16p11.2 germline deletion carriers in the UK Biobank
We extracted LRR and genotype calls from the 16p11.2 ASD-associated region listed in Table 2 of Sanders et al.6 for individuals in the UK Biobank. Germline carriers of 16p11.2 deletions were defined as individuals with average LRR < −0.5 and <5 heterozygous SNP calls across the region (Supplementary Fig. 10).
Phenotype associations of germline and mosaic CNVs in ASD-associated regions
We defined high-confidence ASD-associated CNV regions as those listed in Table 1 and 2 in Sanders et al.6 expanded by ~1.5 Mb on either side (Supplementary Table 4 lists the exact expanded regions). We identified carriers of mosaic CNVs in the UK Biobank reported by Loh et al.22 falling within the ASD regions. We refer to these individuals as ASD-dnCNV-analogue carriers. We used self-reported responses to the UK Biobank Mental Health Questionnaire to count the number of ASD-dnCNV-analogue carriers with a diagnosis of ASD, SCZ, BP, depression, or anxiety.
Following Owens et al.31, we quantified the association between carrier status of germline or mosaic 16p11.2 deletions and phenotypes using the following linear regression model for continuous phenotypes:
where is the phenotype of individual i, is the 16p11.2 CNV carrier status of individual , is the age of individual i, is the sex of individual i, is the array used to genotype individual i, is the genetic principal component of individual i, are the corresponding effect sizes and is the remaining phenotypic variance. For binary phenotypes, we applied logistic regression with the same covariates. Continuous phenotypes were inverse-normal transformed within sex strata after adjusting for relevant covariates prior to analysis58. We restricted to individuals passing quality control filters from ref. 22 and of self-reported European ancestry.
We identified a set of quantitative traits and medical outcomes previously associated with 16p11.2 germline deletions31–33,59. The association results for mosaic 16p11.2 deletions, high cell-fraction mosaic 16p11.2 deletions (CF > 0.3), and germline 16p11.2 deletions for all tested traits are reported in Supplementary Table 5. Medical phenotypes were coded as binarized versions of the following data fields from the UK Biobank Data Showcase: Renal failure: 132030, 132032, and 132034; Obesity: 130792; Heart failure: 131354.
Determining carriers of high-risk germline de novo variants
Curated germline de novo CNVs and LoF variants in SSC individuals6,27,60 were obtained from ref. 6. We cross-referenced our list of mCNV carriers with carriers of de novo CNVs and LoF variants. For any mCNV carriers that also carried a de novo CNV, we determined whether the dnCNV overlapped an ASD gene as described above. The list of high confidence germline de novo CNVs was also used to estimate the size distribution of de novo CNVs in Fig. 2a; we removed de novo CNVs <100 kb in size to account for our limited sensitivity to detect mosaic CNVs below that size threshold.
Genotype-phenotype associations
We obtained phenotype data for individuals in SSC and SPARK from SFARI Base (SSC version 15 and SPARK version 2). Of the three ASD severity measures shared between SSC and SPARK (Development Coordination Disorder Questionnaire, DCDQ; Repetitive Behavior Scale-Revised, RBS-R; and Social Communication Questionnaire, SCQ) only SCQ was missing in less than 50% of SSC and SPARK samples. We measured association between SCQ score and mosaic CNV properties (size and cell fraction) using both Pearson and Spearman rank correlation. Z-normalizing SCQ scores independently in SSC and SPARK prior to association did not qualitatively change the results.
Identification of putative damaging variants within mCNVs in SPARK individuals
We obtained from SFARI Base exonic SNPs and indels detected in whole-exome sequencing data of SPARK individuals. In carriers of mosaic losses and CNN-LOH, we identified rare, putative damaging variants within the mCNV, defined as 1) variants with cohort variant allele frequency <1%; and 2) annotated as “High Impact” (start-lost, stop-lost, stop-gain, frameshift, splice-acceptor, splice-donor) or annotated as missense with CADD >20 (ref. 61) by Variant Effect Predictor62.
Analysis of brain tissue
Human Tissue:
Postmortem human brain specimens were obtained from the Lieber Institute for Brain Development, the Oxford Brain Bank, and the University of Maryland Brain and Tissue Bank through the NIH Neurobiobank, and from Autism BrainNet. All specimens were de-identified and all research was approved by the institutional review board of Boston Children’s Hospital.
DNA Extraction and Sequencing:
DNA was extracted from prefrontal cortex where available (or generic cortex in a minority of cases) using lysis buffer from the QIAamp DNA Mini kit (Qiagen) followed by phenol chloroform extraction and isopropanol clean-up. Samples UMB4334, UMB4899, UMB4999, UMB5027, UMB5115, UMB5176, UMB5297, UMB5302, UMB1638, UMB4671, and UMB797 were processed at New York Genome Center using TruSeq Nano DNA library preparation (Illumina) followed by Illumina HiSeq X Ten sequencing to a minimum 200x depth. All remaining samples were processed at Macrogen using TruSeq DNA PCR-Free library preparation (Illumina) followed by minimum 30x sequencing of 7 libraries on the Illumina HiSeq X Ten sequencer, for a total minimum coverage of 210x per sample. All paired-end FASTQ files were aligned using BWA-MEM version 0.7.8 to the GRCh37 reference genome including the hs37d5 decoy sequence from Broad Institute63.
SV Validation:
For germline events with known breakpoints, standard PCR was designed with primers spanning the breakpoint. For mosaic events with known breakpoints, custom Taqman assays (Thermo) were designed to span the breakpoint and subsequently used in digital droplet PCR with RNAseP as a reference. For events without known breakpoints, pre-designed Taqman copy number assays for the region of interest were ordered and optimized with known positive and negative controls when possible. Digital droplet PCR was performed according to the manufacturer’s instructions (BioRad).
Single-Cell Sorting:
Nuclear preparation and sorting were performed as previously described64. Single NeuN+ cells as well as pools of 100 NeuN+ (neuronal) and NeuN- (non-neuronal) cells were collected and amplified using GenomePlex DOP-PCR WGA according to a published protocol65, and samples were purified using a QIAquick PCR purification kit (Qiagen) prior to ddPCR analysis. Locus dropout is a common feature of whole-genome amplification with GenomePlex DOP-PCR WGA.
Detection of mCNVs
Mosaic CNVs were detected using MoChA. When running on WGS data, MoChA explicitly models read counts of the ALT allele and the REF allele using a binomial distribution, where the expected counts are a function of the total sequencing depth and the allele balance of the hidden state.
Mosaic copy number estimation
For each segment of the mosaic complex duplication, we estimated mosaic copy number from allelic sequencing read fractions using the following relationship. Let be the average absolute deviation from 0.5 of phased allele frequency estimated across a segment. Then for a gain, the estimated mosaic cell fraction in the bulk sample is:
This corresponds to a mosaic copy number of in a diploid genome.
Let be the average read depth (or log-R ratio) at SNPs within a segment and let be the average read depth (log-R ratio) at SNPs genome-wide. Then the estimated average copy number in the bulk sample is:
When estimating the read-depth based copy number of the complex mosaic duplication, we estimated the genome-wide copy read-depth using the average read depth across all SNP sites on chromosome 1. To account for read depth biases (e.g. GC content), we inferred the segment’s copy number in each of the other 59 post-mortem brain samples. We then estimated the copy-number bias as the average deviation from CN=2 and subtracted this estimate from to get a corrected copy number estimate, . These are the values shown in Fig 4b. Estimator variance is the sum of the estimated variance of and the estimated variance of the bias estimate.
Inferred structure of a complex duplication
We inferred a linear structure of the complex duplication consistent with the following observations: three segments with relative abundance of +1 copy, +3 copies, and +2 copies; a tail-to-tail (T2T) inversion fusing 92.04 Mb to 98.78 Mb; a tandem duplication (TD) of 99.87–101.94 Mb; and a head-to-head (H2H) inversion fusing 102.382 Mb to 102.383 Mb. We first observed that each breakpoint corresponded to a segment with unique copy state: T2T inversion corresponded to +1 copy state; TD to +3 copy state, and H2H to a +2 copy state. We thus concluded that the tandem duplication must result in an additional three copies of 99.87–101.94 Mb and the H2H inversion is likely the result of an inverted duplication resulting in two copies of ~102.0–102.382 Mb separated by a 1 kb segment (102.382–102.383 Mb) in the proper orientation (where the left breakpoint at ~102.0 Mb is approximate because it is estimated based on discontinuity in allele fraction and read depth estimates rather than direct observation); we estimated via read depth that the segment 102.382–102.383 Mb is present in a +1 copy state. We further concluded that the duplication carries one copy of 92.04–98.78 in an inverted 3’–5’ orientation and one copy of 99.78–99.87 Mb in the proper 5’–3’ orientation.
Plotting mosaic CNV events
Mosaic CNV events with ideograms and gene / region annotations were plotted using a modified version of pyGenomeTracks66.
Description of box plots
All box plots have the following properties: center line is the median, box limits are upper and lower quartile, and whiskers are 1.5x interquartile range. Outliers are not included in Figure 2a for clarity.
Statistical analysis
We did not pre-determine sample size but rather obtained all samples currently available from SSC, SPARK, and the UK Biobank; the resulting sample sizes were similar to or larger than those reported in previous publications11,12,17,21,31–33. Data were collected by SSC and SPARK without input from the authors; we did not perform randomization beyond that performed by SSC and SPARK during sample collection. Because data were received as curated by SSC and SPARK, we were not blind to covariates included with the data. Burden and association analyses were performed as described above. Comparisons of CNV sizes were performed using Mann-Whitney U-tests. Data met the assumptions for all statistical tests.
Data availability:
Data on individuals with Autism Spectrum Disorder and their families were collected by the Simons Foundation as part of the Simons Simplex Collection and Simons Powering Autism Research for Knowledge cohort. Mosaic events calls are available in Supplementary Data. Genotype array data and phenotype information for SSC and SPARK cohorts are available from SFARI Base (https://base.sfari.org) for approved researchers. Access to the UK Biobank Resource is available via application (http://www.ukbiobank.ac.uk/). Data from the Decipher Database is available from https://decipher.sanger.ac.uk/. Whole-genome sequencing data of post-mortem brain tissue is available from the National Institute of Mental Health Data Archive under accession number 1503337. Source data is provided for gels shown in Supplementary Figures 16c and 17a.
Accession codes
Accession number for Whole-genome sequencing data of post-mortem brain from the National Institute of Mental Health Data Archive: 1503337.
Code availability:
MoChA and custom BCFtools plugins are available on Github via URLs listed below. Custom analysis scripts are available from the authors upon request.
URLs:
MOsaic CHromosomal Alterations (MoChA) caller, https://github.com/freeseek/mocha
BCFtools https://samtools.github.io/bcftools/bcftools.html
Custom BCFtools plugins, https://github.com/freeseek/gtc2vcf
Eagle2 software, https://data.broadinstitute.org/alkesgroup/Eagle/
PLINK, https://www.cog-genomics.org/plink/1.9/
pyGenomeTracks, https://github.com/deeptools/pyGenomeTracks
1000 Genomes data set, http://www.1000genomes.org/
Haplotype Reference Consortium, http://www.haplotype-reference-consortium.org/.
UK Biobank, http://www.ukbiobank.ac.uk/
SFARI gene database, https://gene.sfari.org/
SFARI Base, https://base.sfari.org
Supplementary Material
Acknowledgements
We are grateful to all of the families at the participating Simons Simplex Collection (SSC) sites, as well as the principal investigators (A. Beaudet, R. Bernier, J. Constantino, E. Cook, E. Fombonne, D. Geschwind, R. Goin-Kochel, E. Hanson, D. Grice, A. Klin, D. Ledbetter, C. Lord, C. Martin, D. Martin, R. Maxim, J. Miles, O. Ousley, K. Pelphrey, B. Peterson, J. Piggot, C. Saulnier, M. State, W. Stone, J. Sutcliffe, C. Walsh, Z. Warren, E. Wijsman). We are grateful to all of the families in SPARK, the SPARK clinical sites and SPARK staff. We appreciate obtaining access to genotype and phenotype data on SFARI Base. Approved researchers can obtain the SSC and SPARK population dataset described in this study by applying at https://base.sfari.org/. We would like to thank the HMS Research Computing Consultant Group for their consulting services, which facilitated the computational analyses detailed in this paper. This research was conducted using the UK Biobank Resource under Application #19808. M.A.S. is supported by a grant from the NIMH under award number F31MH124393. R.E.R. is supported by the Stuart H.Q. and Victoria Quan Fellowship in Neurobiology and by the Harvard/MIT MD-PhD program (T32GM007753) from the NIGMS. G.G. was supported by NIH grant R01HG006855, NIH grant R01MH104964, and the Stanley Center for Psychiatric Research. C.M.D is supported by a NIMH Translational Post-doctoral Training Program in Neurodevelopment (T32MH112510). A.R.B. was supported by training grant T32HG229516 from NHGRI. R.E.M. is supported by NSF grant DMS-1939015 and NIH grant K25HL150334. B.B. is supported by grant R01GM108348 from NIGMS. P.J.P is supported by NIMH grant U01MH106883 and the Harvard Ludwig Center. C.A.W. is supported by the Allen Discovery Center program through The Paul G. Allen Frontiers Group, and grants from the NINDS (R01NS032457) and NIMH (U01MH106883) C.A.W. is an Investigator of the Howard Hughes Medical Institute. P.-R.L. is supported by US NIH grant DP2 ES030554, a Burroughs Wellcome Fund Career Award at the Scientific Interfaces, the Next Generation Fund at the Broad Institute of MIT and Harvard, a Glenn Foundation for Medical Research and AFAR Grants for Junior Faculty award, and a Sloan Research Fellowship. WGS data were generated as part of the Brain Somatic Mosaicism Network (BSMN) Consortium; a full list of supporting grants and consortium members are provided in Supplementary Information. The content is solely the responsibility of the authors and does not necessarily represent the official views of the National Institutes of Health.
Footnotes
Competing interests
The authors declare no competing interests.
Ethics statement
The first part of this study utilized existing and publicly available genomic datasets of families with autism spectrum disorder from the Simons Simplex Collection and SPARK. Collection of SSC samples were approved and monitored by the institutional review board of Columbia University Medical Center. SPARK samples were collected under a centralized review board protocol (Western IRB Protocol #20151664). The second part of the study generated and analyzed genomic data on de-identified postmortem human specimens obtained from brain tissue banks, including the AutismBrainNet, Lieber Institute for Brain Development, Oxford Brain Bank, and University of Maryland Brain and Tissue Bank through the NIH Neurobiobank. This study did not engage human subjects or collect their identifiable data; rather the individual tissue banks have their own approval and consent process. Our study was approved by the institutional review board of Boston Children’s Hospital.
References
- 1.Gaugler T et al. Most genetic risk for autism resides with common variation. Nature Genetics 46, 881–885 (2014). [DOI] [PMC free article] [PubMed] [Google Scholar]
- 2.De Rubeis S et al. Synaptic, transcriptional and chromatin genes disrupted in autism. Nature 515, 209–215 (2014). [DOI] [PMC free article] [PubMed] [Google Scholar]
- 3.Turner TN et al. Genomic Patterns of De Novo Mutation in Simplex Autism. Cell 171, 710–722.e12 (2017). [DOI] [PMC free article] [PubMed] [Google Scholar]
- 4.Sebat J et al. Strong Association of De Novo Copy Number Mutations with Autism. Science 316, 445–449 (2007). [DOI] [PMC free article] [PubMed] [Google Scholar]
- 5.Sanders SJ et al. Multiple Recurrent De Novo CNVs, Including Duplications of the 7q11.23 Williams Syndrome Region, Are Strongly Associated with Autism. Neuron 70, 863–885 (2011). [DOI] [PMC free article] [PubMed] [Google Scholar]
- 6.Sanders SJ et al. Insights into Autism Spectrum Disorder Genomic Architecture and Biology from 71 Risk Loci. Neuron 87, 1215–1233 (2015). [DOI] [PMC free article] [PubMed] [Google Scholar]
- 7.Yuen RKC et al. Whole genome sequencing resource identifies 18 new candidate genes for autism spectrum disorder. Nature Neuroscience 20, 602–611 (2017). [DOI] [PMC free article] [PubMed] [Google Scholar]
- 8.Iakoucheva LM, Muotri AR & Sebat J Getting to the Cores of Autism. Cell 178, 1287–1298 (2019). [DOI] [PMC free article] [PubMed] [Google Scholar]
- 9.McConnell MJ et al. Intersection of diverse neuronal genomes and neuropsychiatric disease: The Brain Somatic Mosaicism Network. Science 356, (2017). [DOI] [PMC free article] [PubMed] [Google Scholar]
- 10.Ju YS et al. Somatic mutations reveal asymmetric cellular dynamics in the early human embryo. Nature 543, 714–718 (2017). [DOI] [PMC free article] [PubMed] [Google Scholar]
- 11.Freed D & Pevsner J The Contribution of Mosaic Variants to Autism Spectrum Disorder. PLoS Genet 12, e1006245 (2016). [DOI] [PMC free article] [PubMed] [Google Scholar]
- 12.Lim ET et al. Rates, distribution and implications of postzygotic mosaic mutations in autism spectrum disorder. Nature Neuroscience 20, 1217–1224 (2017). [DOI] [PMC free article] [PubMed] [Google Scholar]
- 13.Krupp DR et al. Exonic Mosaic Mutations Contribute Risk for Autism Spectrum Disorder. The American Journal of Human Genetics 101, 369–390 (2017). [DOI] [PMC free article] [PubMed] [Google Scholar]
- 14.Jamuar SS et al. Somatic Mutations in Cerebral Cortical Malformations. New England Journal of Medicine 371, 733–743 (2014). [DOI] [PMC free article] [PubMed] [Google Scholar]
- 15.Baek ST, Gibbs EM, Gleeson JG & Mathern GW Hemimegalencephaly, a paradigm for somatic postzygotic neurodevelopmental disorders. Current Opinion in Neurology 26, 122 (2013). [DOI] [PubMed] [Google Scholar]
- 16.Poduri A, Evrony GD, Cai X & Walsh CA Somatic Mutation, Genomic Variation, and Neurological Disease. Science 341, 1237758 (2013). [DOI] [PMC free article] [PubMed] [Google Scholar]
- 17.King DA et al. Mosaic structural variation in children with developmental disorders. Hum Mol Genet 24, 2733–2745 (2015). [DOI] [PMC free article] [PubMed] [Google Scholar]
- 18.Fischbach GD & Lord C The Simons Simplex Collection: A Resource for Identification of Autism Genetic Risk Factors. Neuron 68, 192–195 (2010). [DOI] [PubMed] [Google Scholar]
- 19.Feliciano P et al. SPARK: A US Cohort of 50,000 Families to Accelerate Autism Research. Neuron 97, 488–493 (2018). [DOI] [PMC free article] [PubMed] [Google Scholar]
- 20.Loh P-R et al. Reference-based phasing using the Haplotype Reference Consortium panel. Nature Genetics 48, 1443–1448 (2016). [DOI] [PMC free article] [PubMed] [Google Scholar]
- 21.Loh P-R et al. Insights into clonal haematopoiesis from 8,342 mosaic chromosomal alterations. Nature 559, 350–355 (2018). [DOI] [PMC free article] [PubMed] [Google Scholar]
- 22.Loh P-R, Genovese G & McCarroll SA Monogenic and polygenic inheritance become instruments for clonal selection. bioRxiv 653691 (2019) 10.1101/653691. [DOI] [PMC free article] [PubMed]
- 23.Vattathil S & Scheet P Extensive Hidden Genomic Mosaicism Revealed in Normal Tissue. The American Journal of Human Genetics 98, 571–578 (2016). [DOI] [PMC free article] [PubMed] [Google Scholar]
- 24.Jacobs KB et al. Detectable clonal mosaicism and its relationship to aging and cancer. Nat Genet 44, 651–658 (2012). [DOI] [PMC free article] [PubMed] [Google Scholar]
- 25.Laurie CC et al. Detectable clonal mosaicism from birth to old age and its relationship to cancer. Nat Genet 44, 642–650 (2012). [DOI] [PMC free article] [PubMed] [Google Scholar]
- 26.Zaykin DV Optimally weighted Z-test is a powerful method for combining probabilities in meta-analysis. J Evol Biol 24, 1836–1841 (2011). [DOI] [PMC free article] [PubMed] [Google Scholar]
- 27.Iossifov I et al. The contribution of de novo coding mutations to autism spectrum disorder. Nature 515, 216–221 (2014). [DOI] [PMC free article] [PubMed] [Google Scholar]
- 28.Grove J et al. Identification of common genetic risk variants for autism spectrum disorder. Nature Genetics 51, 431 (2019). [DOI] [PMC free article] [PubMed] [Google Scholar]
- 29.Pinto D et al. Convergence of Genes and Cellular Pathways Dysregulated in Autism Spectrum Disorders. The American Journal of Human Genetics 94, 677–694 (2014). [DOI] [PMC free article] [PubMed] [Google Scholar]
- 30.O’Roak BJ et al. Sporadic autism exomes reveal a highly interconnected protein network of de novo mutations. Nature 485, 246–250 (2012). [DOI] [PMC free article] [PubMed] [Google Scholar]
- 31.Owen D et al. Effects of pathogenic CNVs on physical traits in participants of the UK Biobank. BMC Genomics 19, 867 (2018). [DOI] [PMC free article] [PubMed] [Google Scholar]
- 32.Crawford K et al. Medical consequences of pathogenic CNVs in adults: analysis of the UK Biobank. Journal of Medical Genetics 56, 131–138 (2019). [DOI] [PubMed] [Google Scholar]
- 33.Bracher-Smith M et al. Effects of pathogenic CNVs on biochemical markers: a study on the UK Biobank. 10.1101/723270 (2019) 10.1101/723270. [DOI]
- 34.McConnell MJ et al. Mosaic Copy Number Variation in Human Neurons. Science 342, 632–637 (2013). [DOI] [PMC free article] [PubMed] [Google Scholar]
- 35.Cai X et al. Single-Cell, Genome-wide Sequencing Identifies Clonal Somatic Copy-Number Variation in the Human Brain. Cell Reports 8, 1280–1289 (2014). [DOI] [PMC free article] [PubMed] [Google Scholar]
- 36.Bae T et al. Different mutational rates and mechanisms in human cells at pregastrulation and neurogenesis. Science 359, 550–555 (2018). [DOI] [PMC free article] [PubMed] [Google Scholar]
- 37.DePristo MA et al. A framework for variation discovery and genotyping using next-generation DNA sequencing data. Nature Genetics 43, 491–498 (2011). [DOI] [PMC free article] [PubMed] [Google Scholar]
- 38.Firth HV et al. DECIPHER: Database of Chromosomal Imbalance and Phenotype in Humans Using Ensembl Resources. The American Journal of Human Genetics 84, 524–533 (2009). [DOI] [PMC free article] [PubMed] [Google Scholar]
- 39.Riley KN et al. Recurrent deletions and duplications of chromosome 2q11.2 and 2q13 are associated with variable outcomes. Am. J. Med. Genet. A 167A, 2664–2673 (2015). [DOI] [PubMed] [Google Scholar]
- 40.Forsberg LA Loss of chromosome Y (LOY) in blood cells is associated with increased risk for disease and mortality in aging men. Hum Genet 136, 657–663 (2017). [DOI] [PMC free article] [PubMed] [Google Scholar]
- 41.Graham EJ et al. Somatic mosaicism of sex chromosomes in the blood and brain. Brain Res 1721, 146345 (2019). [DOI] [PMC free article] [PubMed] [Google Scholar]
- 42.Sudmant PH et al. An integrated map of structural variation in 2,504 human genomes. Nature 526, 75–81 (2015). [DOI] [PMC free article] [PubMed] [Google Scholar]
- 43.Nowakowska B Clinical interpretation of copy number variants in the human genome. J Appl Genet 58, 449–457 (2017). [DOI] [PMC free article] [PubMed] [Google Scholar]
- 44.van den Berg MMJ, van Maarle MC, van Wely M & Goddijn M Genetics of early miscarriage. Biochimica et Biophysica Acta (BBA) - Molecular Basis of Disease 1822, 1951–1959 (2012). [DOI] [PubMed] [Google Scholar]
- 45.Nazeen S, Palmer NP, Berger B & Kohane IS Integrative analysis of genetic data sets reveals a shared innate immune component in autism spectrum disorder and its co-morbidities. Genome Biology 17, 228 (2016). [DOI] [PMC free article] [PubMed] [Google Scholar]
- 46.Feenstra I et al. Genotype–phenotype mapping of chromosome 18q deletions by high-resolution array CGH: An update of the phenotypic map. American Journal of Medical Genetics Part A 143A, 1858–1867 (2007). [DOI] [PubMed] [Google Scholar]
- 47.Fry A et al. Comparison of Sociodemographic and Health-Related Characteristics of UK Biobank Participants With Those of the General Population. Am J Epidemiol 186, 1026–1034 (2017). [DOI] [PMC free article] [PubMed] [Google Scholar]
- 48.Akbarian S et al. The PsychENCODE project. Nature Neuroscience 18, 1707–1712 (2015). [DOI] [PMC free article] [PubMed] [Google Scholar]
- 49.Wang M et al. The Mount Sinai cohort of large-scale genomic, transcriptomic and proteomic data in Alzheimer’s disease. Scientific Data 5, 180185 (2018). [DOI] [PMC free article] [PubMed] [Google Scholar]
- 50.Sherman MA et al. PaSD-qc: quality control for single cell whole-genome sequencing data using power spectral density estimation. Nucleic Acids Res 46, e20 (2018). [DOI] [PMC free article] [PubMed] [Google Scholar]
References (methods-only)
- 51.Feliciano P et al. Exome sequencing of 457 autism families recruited online provides evidence for novel ASD genes. bioRxiv 516625 (2019) 10.1101/516625. [DOI] [PMC free article] [PubMed]
- 52.Diskin SJ et al. Adjustment of genomic waves in signal intensities from whole-genome SNP genotyping platforms. Nucleic Acids Res 36, e126 (2008). [DOI] [PMC free article] [PubMed] [Google Scholar]
- 53.Pedregosa F et al. Scikit-learn: Machine Learning in Python. Journal of Machine Learning Research 12, 2825–2830 (2011). [Google Scholar]
- 54.the Haplotype Reference Consortium et al. A reference panel of 64,976 haplotypes for genotype imputation. Nature Genetics 48, 1279–1283 (2016). [DOI] [PMC free article] [PubMed] [Google Scholar]
- 55.Wang K et al. PennCNV: An integrated hidden Markov model designed for high-resolution copy number variation detection in whole-genome SNP genotyping data. Genome Res 17, 1665–1674 (2007). [DOI] [PMC free article] [PubMed] [Google Scholar]
- 56.Sanders SJ et al. Multiple Recurrent De Novo CNVs, Including Duplications of the 7q11.23 Williams Syndrome Region, Are Strongly Associated with Autism. Neuron 70, 863–885 (2011). [DOI] [PMC free article] [PubMed] [Google Scholar]
- 57.Newcombe RG Interval estimation for the difference between independent proportions: comparison of eleven methods. Stat Med 17, 873–890 (1998). [DOI] [PubMed] [Google Scholar]
- 58.Loh P-R, Kichaev G, Gazal S, Schoech AP & Price AL Mixed-model association for biobank-scale datasets. Nature Genetics 50, 906 (2018). [DOI] [PMC free article] [PubMed] [Google Scholar]
- 59.Jacquemont S et al. Mirror extreme BMI phenotypes associated with gene dosage at the chromosome 16p11.2 locus. Nature 478, 97–102 (2011). [DOI] [PMC free article] [PubMed] [Google Scholar]
- 60.Dong S et al. De Novo Insertions and Deletions of Predominantly Paternal Origin Are Associated with Autism Spectrum Disorder. Cell Reports 9, 16–23 (2014). [DOI] [PMC free article] [PubMed] [Google Scholar]
- 61.Kircher M et al. A general framework for estimating the relative pathogenicity of human genetic variants. Nature Genetics 46, 310–315 (2014). [DOI] [PMC free article] [PubMed] [Google Scholar]
- 62.McLaren W et al. The Ensembl Variant Effect Predictor. Genome Biology 17, 122 (2016). [DOI] [PMC free article] [PubMed] [Google Scholar]
- 63.Genovese G, Handsaker RE, Li H, Kenny EE & McCarroll SA Mapping the Human Reference Genome’s Missing Sequence by Three-Way Admixture in Latino Genomes. The American Journal of Human Genetics 93, 411–421 (2013). [DOI] [PMC free article] [PubMed] [Google Scholar]
- 64.Evrony GD et al. Single-Neuron Sequencing Analysis of L1 Retrotransposition and Somatic Mutation in the Human Brain. Cell 151, 483–496 (2012). [DOI] [PMC free article] [PubMed] [Google Scholar]
- 65.Baslan T et al. Genome-wide copy number analysis of single cells. Nat Protoc 7, 1024–1041 (2012). [DOI] [PMC free article] [PubMed] [Google Scholar]
- 66. Ramírez F et al. High-resolution TADs reveal DNA sequences underlying genome organization in flies. Nat Commun 9, 1–15 (2018). [DOI] [PMC free article] [PubMed] [Google Scholar]
Associated Data
This section collects any data citations, data availability statements, or supplementary materials included in this article.
Supplementary Materials
Data Availability Statement
Data on individuals with Autism Spectrum Disorder and their families were collected by the Simons Foundation as part of the Simons Simplex Collection and Simons Powering Autism Research for Knowledge cohort. Mosaic events calls are available in Supplementary Data. Genotype array data and phenotype information for SSC and SPARK cohorts are available from SFARI Base (https://base.sfari.org) for approved researchers. Access to the UK Biobank Resource is available via application (http://www.ukbiobank.ac.uk/). Data from the Decipher Database is available from https://decipher.sanger.ac.uk/. Whole-genome sequencing data of post-mortem brain tissue is available from the National Institute of Mental Health Data Archive under accession number 1503337. Source data is provided for gels shown in Supplementary Figures 16c and 17a.