

Abstract
Purpose
Salivary gland adenoid cystic carcinoma (ACC) has heterogeneous clinical behavior. Currently, all patients are treated uniformly, and no standard of care systemic therapy exists for metastatic ACC. We conducted an integrated proteogenomic analyses of ACC tumors to identify dysregulated pathways and propose a classification with therapeutic implications.
Experimental Design
RNA/DNA sequencing of 54 flash-frozen salivary ACC and reverse-phase protein array (RPPA) in 38 specimens were performed, with validation by western blot and/or immunohistochemistry. Three independent ACC cohorts were used for validation.
Results
Both unbiased RNA-seq and RPPA analysis revealed two molecular subtypes; ACC-I (37%) and ACC-II (63%). ACC-I had strong upregulation of MYC, MYC target genes, and mRNA splicing, enrichment of NOTCH activating mutations and dramatically worse prognosis. ACC-II exhibited upregulation of TP63 and receptor tyrosine kinases (AXL, MET, EGFR), and less aggressive clinical course. TP63 and MYC were sufficient to assign tumors to ACC subtypes, which was validated in one independent cohort by IHC and two additional independent cohorts by RNAseq. Furthermore, immunohistochemical staining for MYC and P63 protein levels can be used to identify ACC subtypes, enabling rapid clinical deployment to guide therapeutic decisions. Our data suggests a model in which ACC-I is driven by MYC signaling through either NOTCH mutations or direct amplification, which in turn suppress P63 signaling observed in ACC-II producing unique therapeutic vulnerabilities for each subtype.
Conclusion
Co-occurrence of multiple actionable protein/pathways alterations in each subtype indicate unique therapeutic vulnerabilities and opportunities for optimal combination therapy for this understudied and heterogeneous disease.
Keywords: adenoid cystic carcinoma, proteogenomic analysis, ACC molecular subtypes, targeted therapies, NOTCH activation, MYC, P63
INTRODUCTION
Adenoid cystic carcinoma (ACC) is a biphasic tumor that typically originates in the salivary glands of the head and neck. A unique characteristic of this entity is the concurrent participation of myoepithelial and epithelial neoplastic cells in the formation of this tumor(1). Although the underlying events associated with the dual cellular formation are unknown, the presence of myoepithelial cells in part restrained malignant effect on tumor. Usually, loss of myoepithelial cells within a tumor is associated with emergence of a solid epithelial form and aggressive behavior, although solid subtype may be composed of myoepithelial cells(1). Treatment of progressive ACC remains a major challenge largely due to their high biological variability and the lack of biomarkers for targeted therapy (2,3).
Recently, DNA sequencing has led to major advances in understanding the genomic landscape of ACC. However, only a few therapeutic targets have been identified with this approach(4–6). RNA sequencing (RNA-seq) of paraffin-embedded ACC samples has revealed differential expression patterns based on predominant histological subtype (epithelial vs. myoepithelial) and MYB-MYBL1 expression(1,7). While these findings underscore the need for more personalized therapy for ACC patients, the direct therapeutic implications are unclear.
Our group has previously utilized reverse-phase protein array (RPPA) to identify altered pathways and new therapeutic targets in non-small cell lung cancer(8). Similar studies of ACC are lacking. Proteomic analysis can yield unique and complementary data to that provided by genomic analysis and can more directly guide therapeutic development.
In the current study, we performed RNA-seq, RPPA, and targeted DNA deep sequencing on flash-frozen clinically annotated ACC samples and conducted an integrative analysis to identify dysregulated pathways and druggable therapeutic targets.
METHODS
Patient Selection
The study population comprised 54 patients with salivary ACC and flash-frozen primary tumor samples available for RNA-seq, RPPA, and targeted DNA deep sequencing. This is a subset of a cohort of 102 patients previously characterized by whole-exome sequencing and various targeted sequencing panels from FFPE tissues as described (Figure S1) (9). This study was conducted in accordance with Declaration of Helsinki. Samples were obtained by either an institutional review board–approved waiver of informed consent (for deceased patients) or informed consent (front-door consent) for molecular and clinicopathologic analyses.
RNA-Seq and Data Processing
Total RNA was extracted from frozen tissue samples using RNeasy Plus Universal Kits (Qiagen) according to the manufacturer’s instructions. mRNA libraries were prepared using the KAPA Stranded mRNA-Seq Kit (Roche). The libraries were quantified using the Qubit dsDNA HS Assay Kit and assessed for size distribution using the 4200 Agilent Tapestation (Agilent Technologies), then multiplexed (6 libraries per pool). Pooled libraries were quantified by qPCR and sequenced on a HiSeq4000 sequencer (75 bp paired end read format) in the Sequencing and Microarray Facility at MD Anderson Cancer Center (MDACC).
Processing of sequencing reads produced by RNA-seq was done using computational pipelines developed in the Genomic Medicine department at MDACC. Reads were mapped to the hg19 reference using an RNA-seq aligner STAR(10) with default parameters, and then the HTSeq-count(11) was used to quantify gene transcript abundance in each sample as transcripts per million (TPM) mapped reads values. The derived gene transcripts were annotated by ANNOVAR(12). The median number of reads per sample was 124 millions (range 94–156). The median number of detected genes was 25460 (range 24047–26673) with a mean coverage per base of 54 (range 34–69). TPM values were log(2)-transformed and subjected to unsupervised hierarchical clustering using open source clustering software with default parameters(13).
RPPA
The expression of 174 total and phosphoproteins was assessed in 38 tumors as previously described(8). Briefly, each extracted protein lysate was diluted with 5 dilutions and arrayed onto nitrocellulose-coated slides by Aushon 2470 Arreyer (Aushon Biosystems, Billerica, MA). Each array was probed with extensively validated primary antibodies by Dako Autostainer Plus (Dako North America, Inc. Carpinteria, CA) and protein expression signals were measured by Dako Catalyzed Signal Amplification system according to the manufacturer’s recommendations. RPPA data processing was done using MicroVigene software (VigeneTech, Carlisle, MA) and an in-house R-package.
DNA Extraction and Targeted Sequencing
Genomic DNAs from flash-frozen tissue samples were extracted using the Gentra Puregene Tissue Kit (Qiagen) according to the manufacturer’s protocols. Deep-targeted exome sequencing of 263 genes (T200) was used to evaluate genomic alterations in 54 samples as described(14). Since matched normal tissue was not available, we used a common normal control sample to identify single nucleotide variants by MuTect and small insertions and deletions by Pindel (15,16). To reduce false positives, outputs generated by MuTect and Pindel were filtered by the following approaches: (1) removal of novel mutations with VAF>0.4 and documented mutations from COSMIC with VAF>0.6, (2) removal of known SNP and exon variants as well as polymorphic genes with VAF<0.4, and (3) sequencing depth of at least 100 reads for documented mutations and 300 reads for novel mutations. The filtering criterion for VAF was chosen after manual curation of mutations selected with different VAF thresholds. Hits found across many samples were manually curated to reduce the rate of false positive mutations.
Subtype Clustering
Optimal number of clusters was determined based on silhouette width metric(17). Consensus clustering of RNA-seq data was performed by k-means clustering using genes with a log2(TPM+1) standard deviation > 1.0 for 1000 iterations, using a random subset of 80% (n=43) of tumor samples for each iteration. For clustering based on targeted proteomics (RPPA) data, all proteins were used, and 90% (n=34) of tumor samples were used on each iteration.
Immunohistochemistry (IHC)
Cleaved NOTCH1 monoclonal antibody (D3B8; #4147; Cell Signaling, Danvers, MA) was used for NOTCH1 intracellular domain (NICD1) immunohistochemical staining in 50 of the 54 ACC specimens as previously described(18). P63 monoclonal (4A4; CM163C; Biocare) was used for detecting P63 expression in FFPE sections through Leica Bond III Staining platform and c-MYC polyclonal (790–4628; Roche) was used for c-MYC level through Ventana Benchmark Ultra Staining platform; 34 of the 54 available samples were assessed for these two IHC stainings. A tissue microarray with 58 additional samples with available survival information was also stained for MYC and P63 and used for validation. MYC/TP63/NICD1 expressions were scored in a binary fashion (positive; uniformly or diffuse strong nuclear staining in >70% tumor cells; negative: no staining in tumor cells or focal or faint nuclear staining in tumor cells). IHC scoring was done blind and independent from the person doing the RNAseq/computational analysis.
Additional data analysis
Gene Set Enrichment Analysis was performed using the Molecular Signatures Database (MSigDB) v6.2 with 1000 iterations ranked by gene fold change(19). Tumor mutation burden was quantified based on the total length of genes contained within the T200 targeted sequencing panel. Copy number values were inferred based on RNAseq data using inferCNV(20). Accuracy of subtype classification was assessed using receiver-operator characteristic curves. For classification by MYC and p63 IHC, a score was determined as +1.0 for MYC positive, +0.5 for focal MYC positive, −0.5 for focal p63 positive, and −1.0 for p63 positive. For classification by MYC and TP63 gene expression, final score was taken as log-transformed z-normalized expression value of MYC minus TP63. Youden’s J statistic was used to determine an optimal threshold value for classification in validation cohorts. The validation cohorts of RNA-seq data were acquired from SRA accession SRP067524(1) and NCBI BioProject PRJNA287156(7), excluding any overlapping samples. Files were quantified by TPM with Kallisto v0.43(21).
Western Blot
Western blot and quantification for NICD1, BCL2, AXL, IGFBP2, and ACTB was performed in 12 of the 54 ACC samples following the procedures as described in Supplementary Materials.
Data Availability.
Detailed patient clinical characteristics, IHC calls, subtype classifications, gene expression data, and clustering code are deposited at in Mendeley Data (doi:10.17632/6sbv7bpj5n.1).
Statistical Analysis
Association of categorical clinical and molecular data with ACC subgroups was evaluated using Fisher’s exact test (2 groups) or chi-squared test (3+ groups). Differences in gene and protein abundance between the two expression groups were assessed using the Mann-Whitney test. Relapse-free survival (RFS) and overall survival (OS) were estimated by the Kaplan-Meier method, with significance determined by log-rank test. Multivariate survival analysis was performed using Cox proportional hazards model. RFS was defined as the time from diagnosis to relapse or death, whichever occurred first, and was censored at the date of last contact for patients last known to be alive without relapse. OS was defined as the time from diagnosis to death as a result of disease. Survivors or patients who were lost to follow-up were censored at the last contact date. A two-sided p-value of ≤0.05 was considered significant. Analyses were performed in SAS 9.4, R 3.5.3, and Matlab R2016a.
RESULTS
Clinical Data and Genomic Analysis
The clinic-pathologic characteristics of our ACC cohort are depicted in Table S1. Most tumors (96%) arose in the head and neck salivary glands (Figure 1A) and were from minor salivary gland origin (74%). At diagnosis, 45% of patients were stage I-III and 50% had stage IV disease (Figure 1B). To dissect the drivers of different salivary gland ACC subsites and comprehensively identify prognostic markers and therapeutic targets, we performed detailed molecular characterization of these 54 ACC tumors as outlined in Figure 1C.
Figure 1. Study overview.
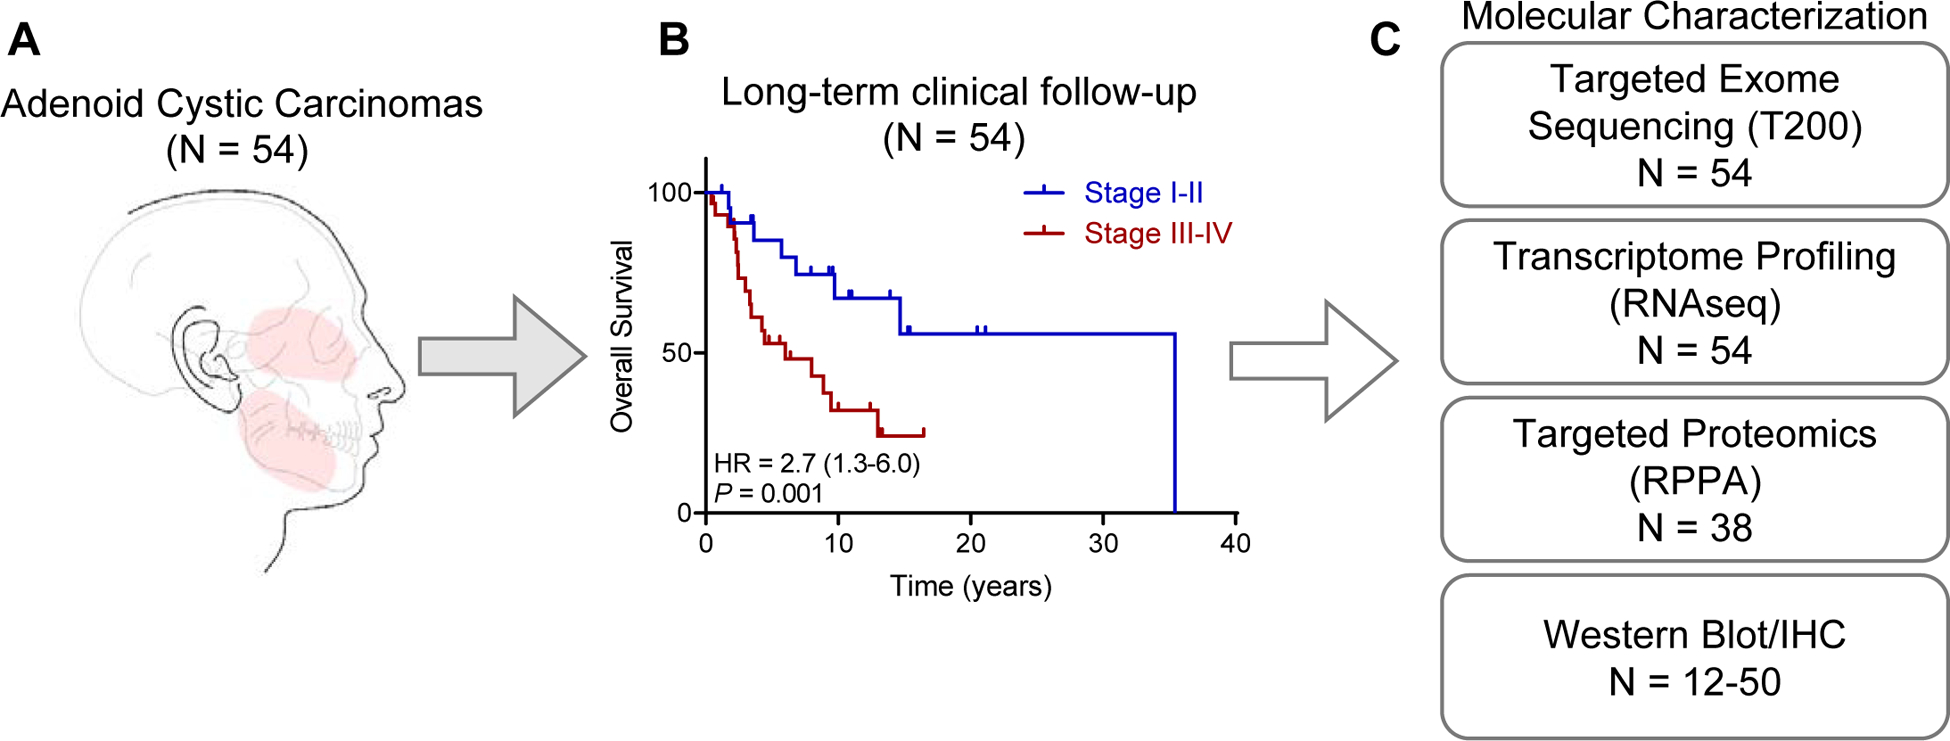
(A) A cohort of 54 patients with adenoid cystic carcinomas and available tumor was interrogated for proteogenomic characterization. Most tumors (52 out of 54 [96%], arose in the major and minor salivary glands (highlighted in red).
(B) Long-term overall survival is stratified by tumor stage, with a median overall survival of 13.0 years (95% CI 6.8–23.2 years) for the entire cohort.
(C) Description of assays used to characterize ACC tumors.
Consensus clustering identifies two distinct ACC molecular subtypes.
Analysis of both whole-transcriptome RNA-seq data and targeted RPPA proteomics indicated that ACC divides into two distinct subtypes (Figure S2A–B). Consensus clustering of highly variable genes (standard deviation > 1) identified two stable clusters, with lower stability observed with further subdivisions (Figure S2C–D). Cluster I (ACC-I) (20 of 54; [37%]) was enriched for tumors with any solid component (p = 4.0×10⁻⁷) and was more likely to be of palate and maxillary sinus minor salivary gland origin (p = 0.01). In contrast, samples in cluster II (ACC-II, 34 of 54; [63%]) contained more tumors with cribriform and tubular histology (p = 4.0×10⁻⁷) and were more likely to originate from the base of tongue and major salivary glands (parotid and sublingual, p = 0.01), (Figure 2A). No difference in tumor stage was noted between subtypes (Cochran–Armitage test for trend P= 0.10). As MYB/MYBL1-NFIB fusion are hallmark genetic events of ACC, we assessed if these fusions correlated to clustering. As analyzed by FISH (22–24), there was no difference in MYB/MYBL1-NFIB fusion events between ACC-I (65%, 13/20) and ACC-II (64%, 22/34) (Fisher’s test; p = 1.0). At the gene expression level neither MYBL1 nor NFIB were differentially expressed between ACC-I and ACC-II, but MYB showed moderately (p = 0.004) increased expression in ACC-I.
Figure 2. Consensus clustering identifies two distinct ACC subtypes.
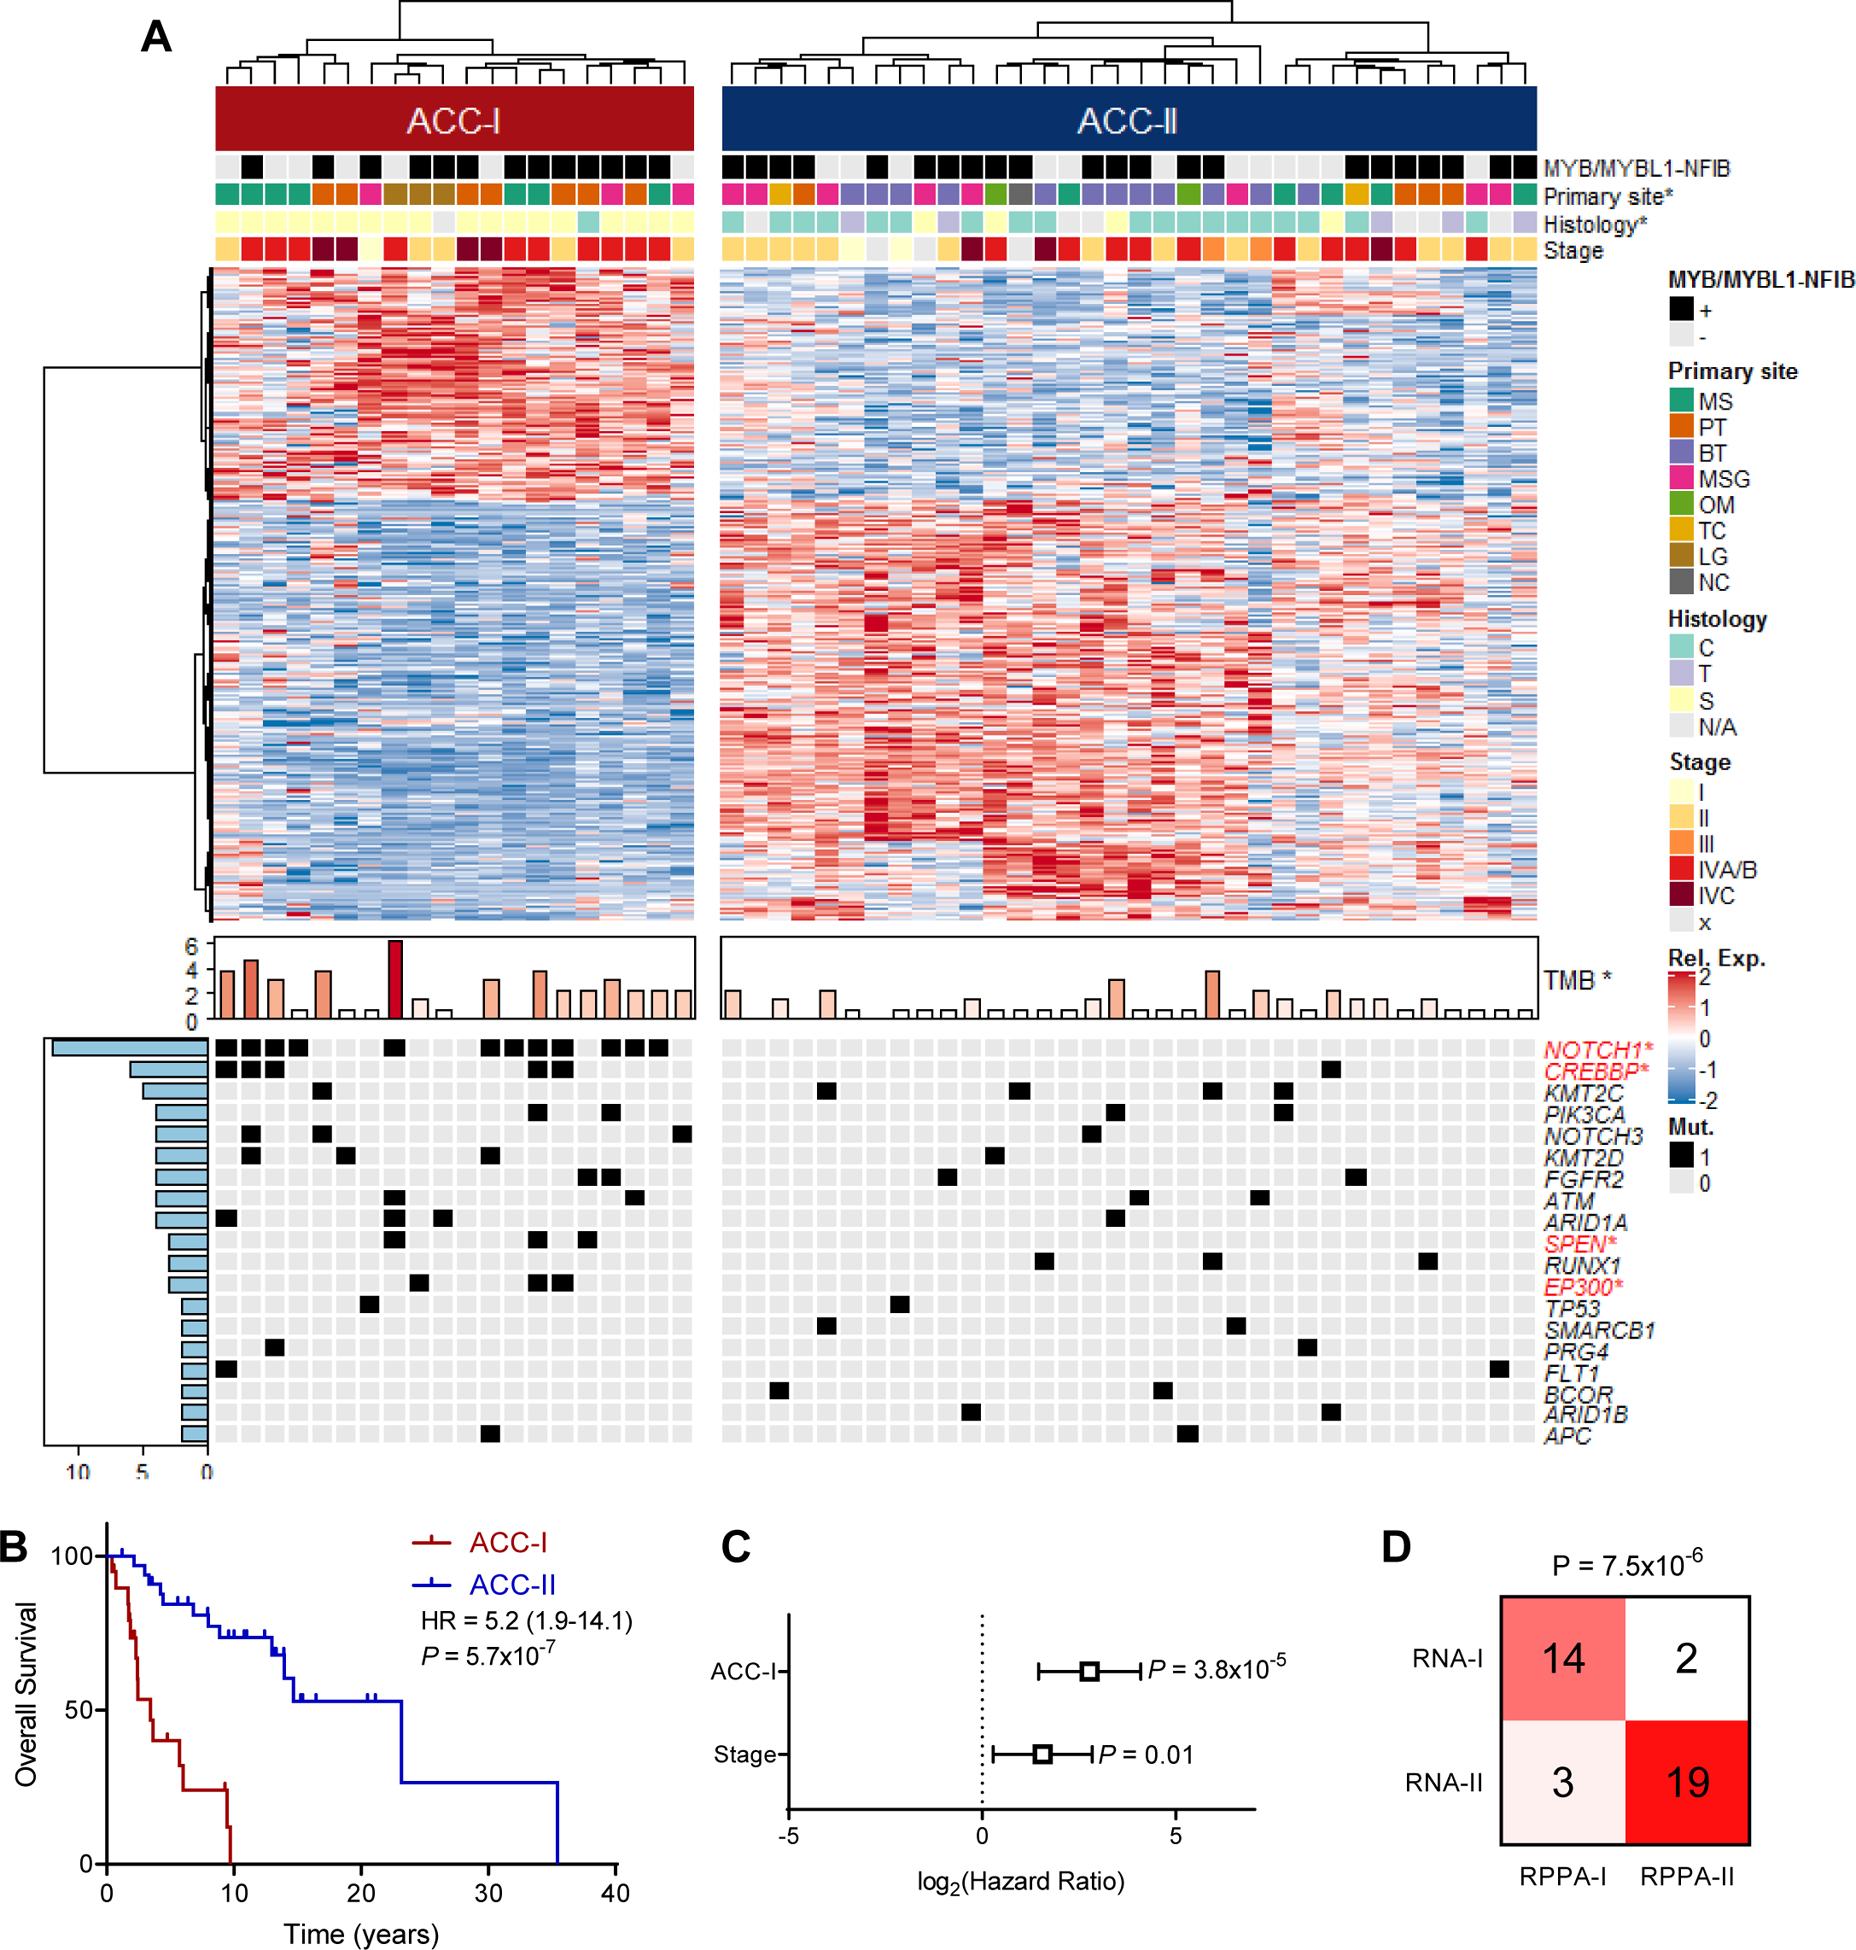
(A) Heatmap of differentially expressed (FDR<0.05, log2(FC)>0.75) genes between two ACC subtypes identified by consensus clustering with MYB/MYBL1-NFIB fusion status determined by FISH, primary site, tumor histology, and stage indicated on top and tumor mutation burden (TMB), as well as all mutations that occur in 2 or more patients indicated on bottom. Legend included to right of heatmap. *p<0.05. See Figure S2A. S: solid, C: cribriform, T: tubular, MS: maxillary sinus, PT: palate, BT: base of tongue, MSG: major salivary gland, OM: other minor salivary gland, TC: trachea, LG: lacrimal gland, NC: nasal cavity.
(B) Overall survival stratified by ACC subtype. Log-rank test.
(C) Multivariate Cox proportional hazards model for overall survival based on both subtype and tumor stage.
(D) Concordance between ACC subtypes based on gene expression (RNA) and targeted proteomics (RPPA). Fisher’s exact test.
At the genetic level, target DNA-sequencing revealed that ACC-I exhibited a higher tumor mutation burden (TMB) as compared to ACC-II (median mutations per megabase = 2.3 vs 0.7, p=0.004) with significantly more mutations in NOTCH1 (p = 3.7×10⁻⁷), CREBBP (p=0.02), SPEN (p=0.04), and EP300 (p=0.04) (Figure 2A and S3A–B). NOTCH1 was overall the most commonly mutated gene, mutated in 12 (22%) subjects (Table S2), with detection in an additional 5 subjects (Table S3) than what has been previously reported in this cohort (9) likely due to the deeper targeted sequencing, use of flash-frozen instead of FFPE tissue, and intratumoral heterogeneity (25,26). While NOTCH1 mutation frequency varies across ACC cohorts (average mutation rate 14.5%, Figure S3C) (4,6,9,24,25,27,28), the frequency of NOTCH1 mutations in this cohort is consistent with the largest ACC cohort published to date, which showed a 22.1% mutation frequency for NOTCH1 (232 out of 1049 tumors)(25). Most NOTCH1 mutations (11 of 12; 92%) occurred in the hotspot regions (heterodimerization or PEST domains) predicted to increase NOTCH activity. ACC-II contained all tumors with mutations in RUNX1, SMARCB1, BCOR, and ARID1B, along with an enrichment of KMT2C mutations. Notably, the expression groups were highly prognostic, with ACC-I subjects exhibiting markedly worse OS than ACC-II; specifically, median OS was 3.44 years (95% CI=2.31–6.00) for ACC-I, and 23.2 years (95% CI= 14.0-inf.) for ACC-II (p<0.001) (Figure 2B). No difference in treatment strategies were observed between subtypes (Figure S3D–E). Multivariate survival analysis correcting for tumor stage demonstrated this worsened prognosis is independent of tumor stage, with a hazard ratio for ACC-I tumors numerically greater than that observed for tumor stage (Figure 2C). ACC-I tumors also showed increased propensity to metastasize, specifically to the liver (Figure S3F). Similar trends were observed with recurrence free survival (Figure S3G–H). Clustering samples based on RPPA proteomics data revealed highly concordant clustering to that observed with gene expression data (p = 7.5×10⁻⁶, Figure 2D), and also recapitulated the prognostic difference observed between the two subtypes (Figure S3I–J).
Molecular alterations identify actionable subtype-specific therapeutic targets.
In order to better understand the differences in ACC subtypes, we performed an integrated analysis of RNA and protein expression. ACC-I tumors exhibited up-regulation of numerous genes including MYC, NOTCH3, and BCL2 (Figure 3A). Gene set enrichment analysis of RNA-seq data showed that samples in ACC-I (37%) exhibited strong upregulation of MYC target genes (FDR<0.0001) and mRNA-splicing pathway (FDR<0.0001) (Figure 3B). ACC-II tumors exhibited upregulation of growth factors-binding (FDR=0.0001), PI3K-AKT-mTOR signaling (FDR=0.007) and RAS signaling (FDR=0.009) (Figure 3C). TP63, EGFR, AXL, and MYL9 were among the genes highly expressed in this subgroup (Figure 3A).
Figure 3. Gene expression alterations between ACC subtypes.
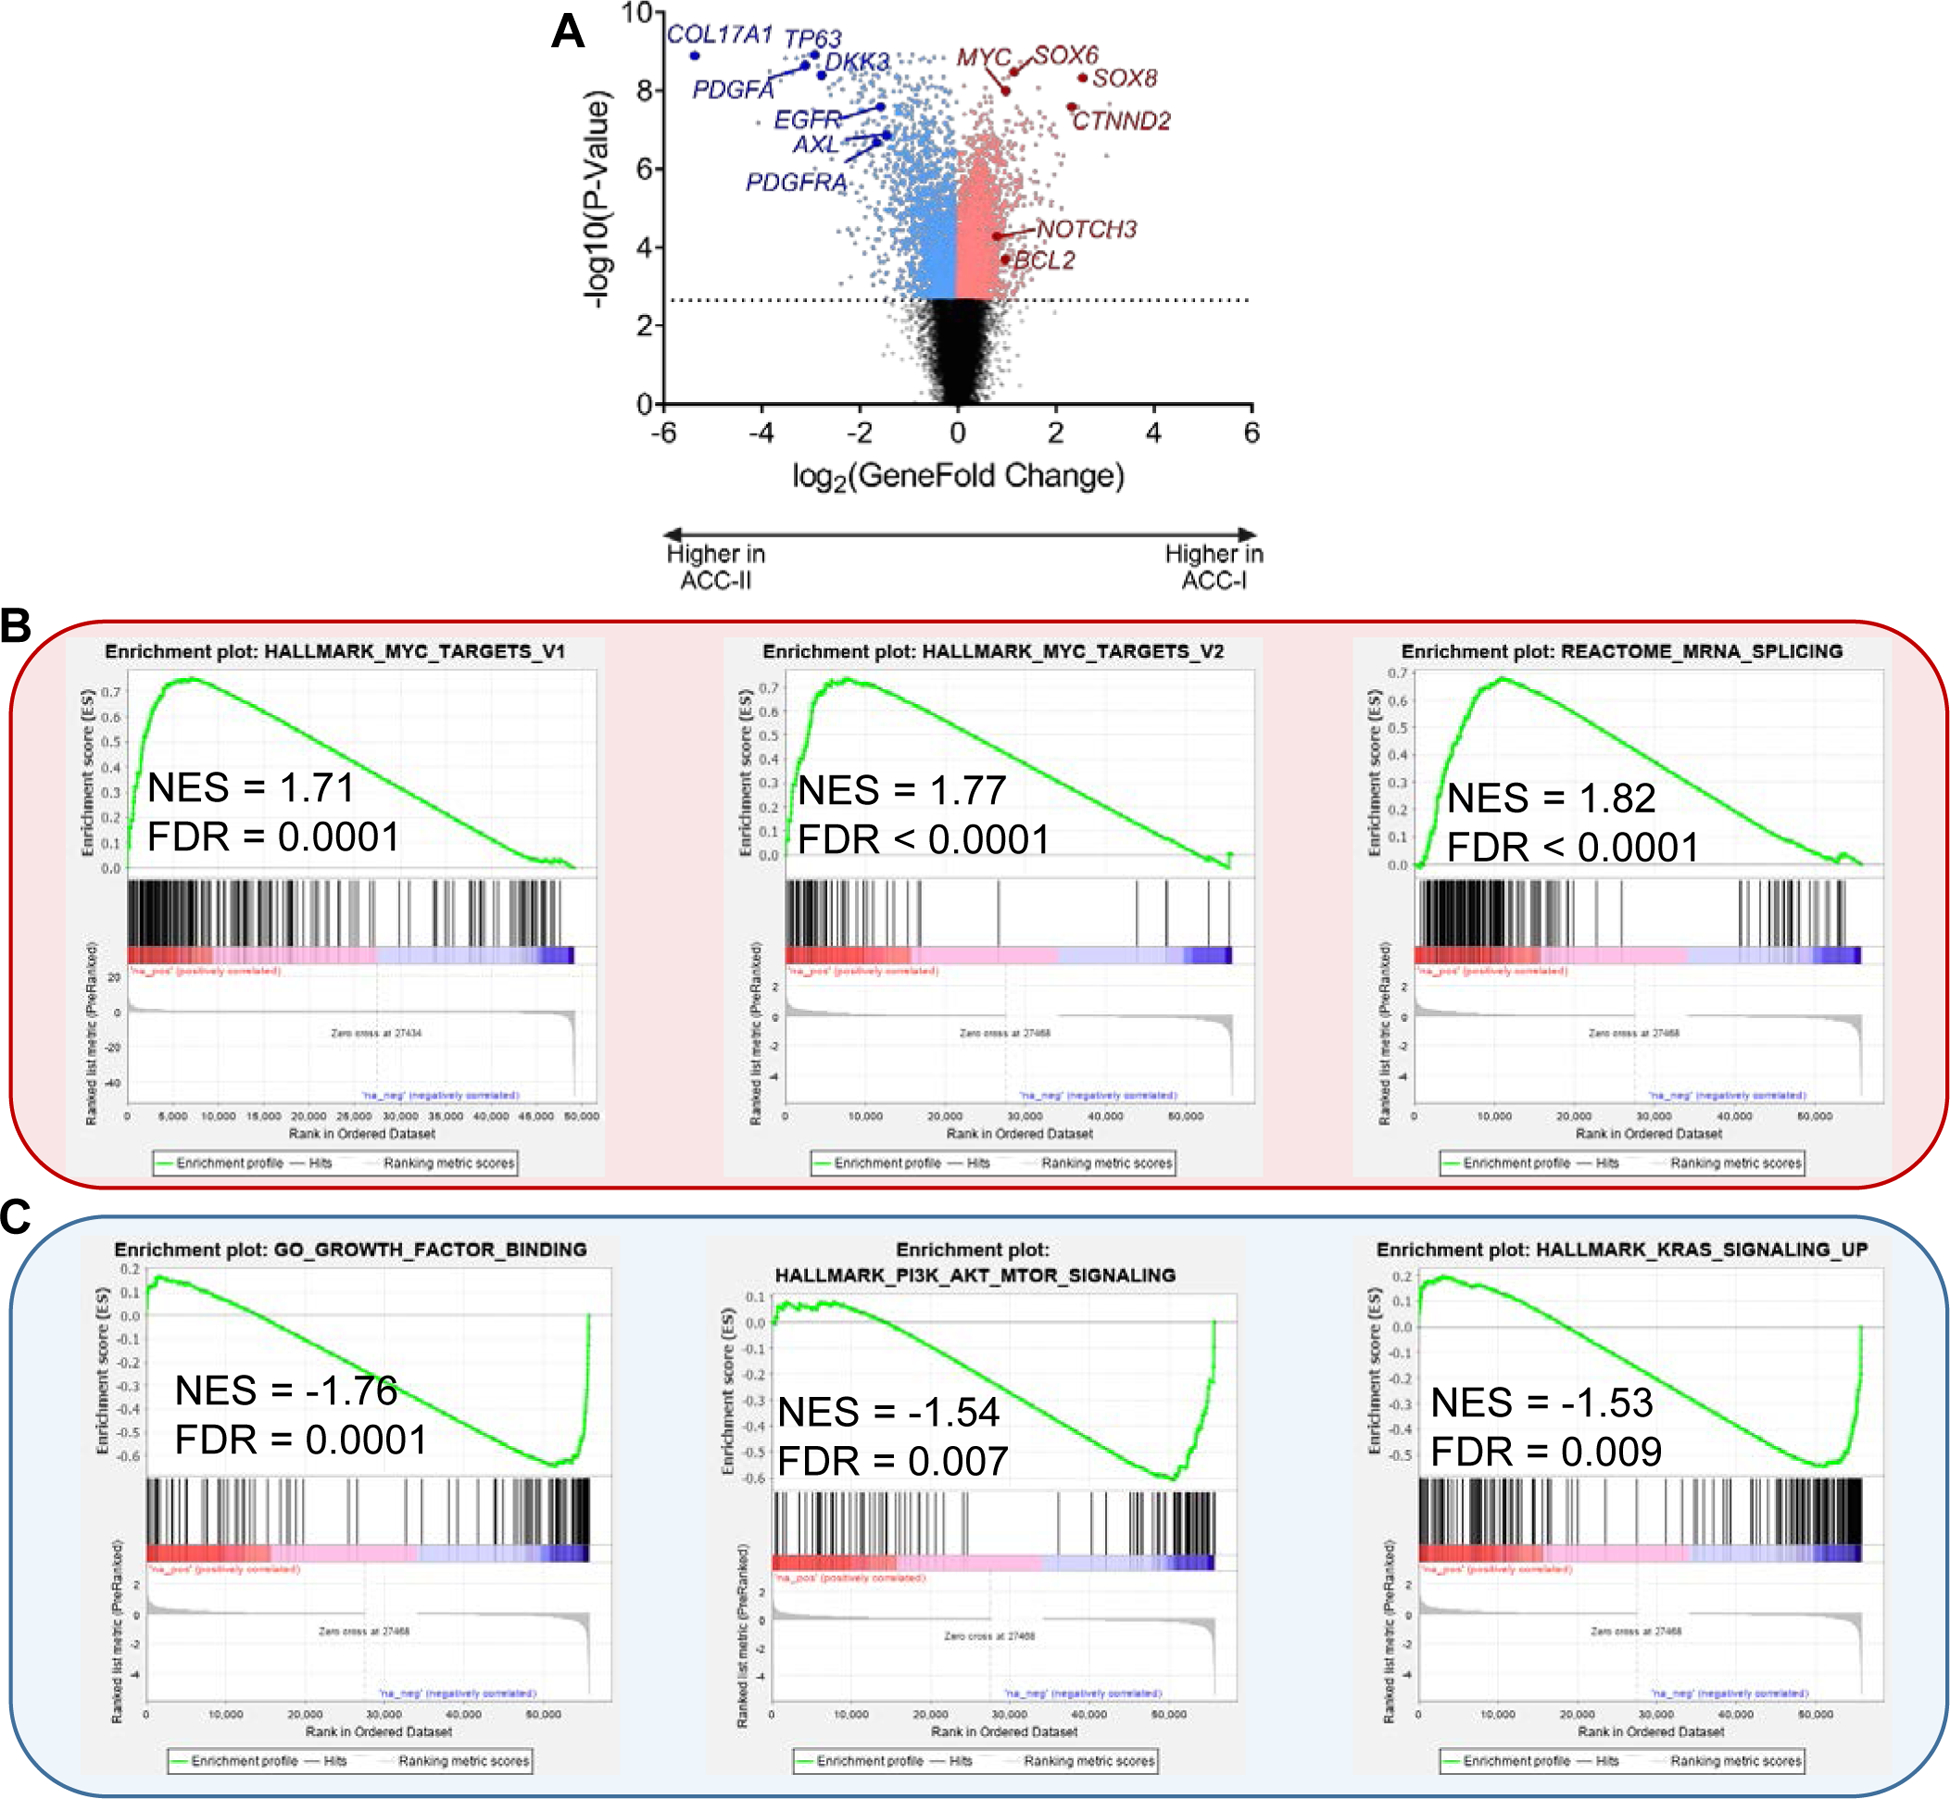
(A) Volcano plot showing genes with increased expression in ACC-I (positive fold changes, red) or ACC-II (negative fold changes, blue). Dotted line indicates 1% FDR.
(B) Pathways enriched in ACC-I by gene set enrichment analysis. NES, net enrichment score.
(C) Pathways enriched in ACC-II by gene set enrichment analysis. NES, net enrichment score.
We next sought to confirm the dichotomous classification based upon gene expression analysis with a phosphoproteomic approach by use of RPPA. Analyses of abundances of 174 cancer-associated proteins revealed the most differentially expressed proteins in ACC-I and ACC-II (Figure 4A). Proteins significantly more abundant and potentially targetable in the ACC-I subtype included the oncoprotein c-MYC, cell cycle regulators (PAR, CHK2, CHK1, CDK7), cleaved Notch1 (NICD1), markers of apoptosis (BLC2, BIM) and immune suppression (B7-H4) (Figure 4A–B). The increased abundance of c-Myc, a well-established NOTCH target(29), and of the transcriptionally active Notch1 intracellular domain (NICD1) in this subtype could be induced largely by the NOTCH1 activation mutation detected in 60% of ACC-I.
Figure 4. Protein expression alterations between ACC subtypes.
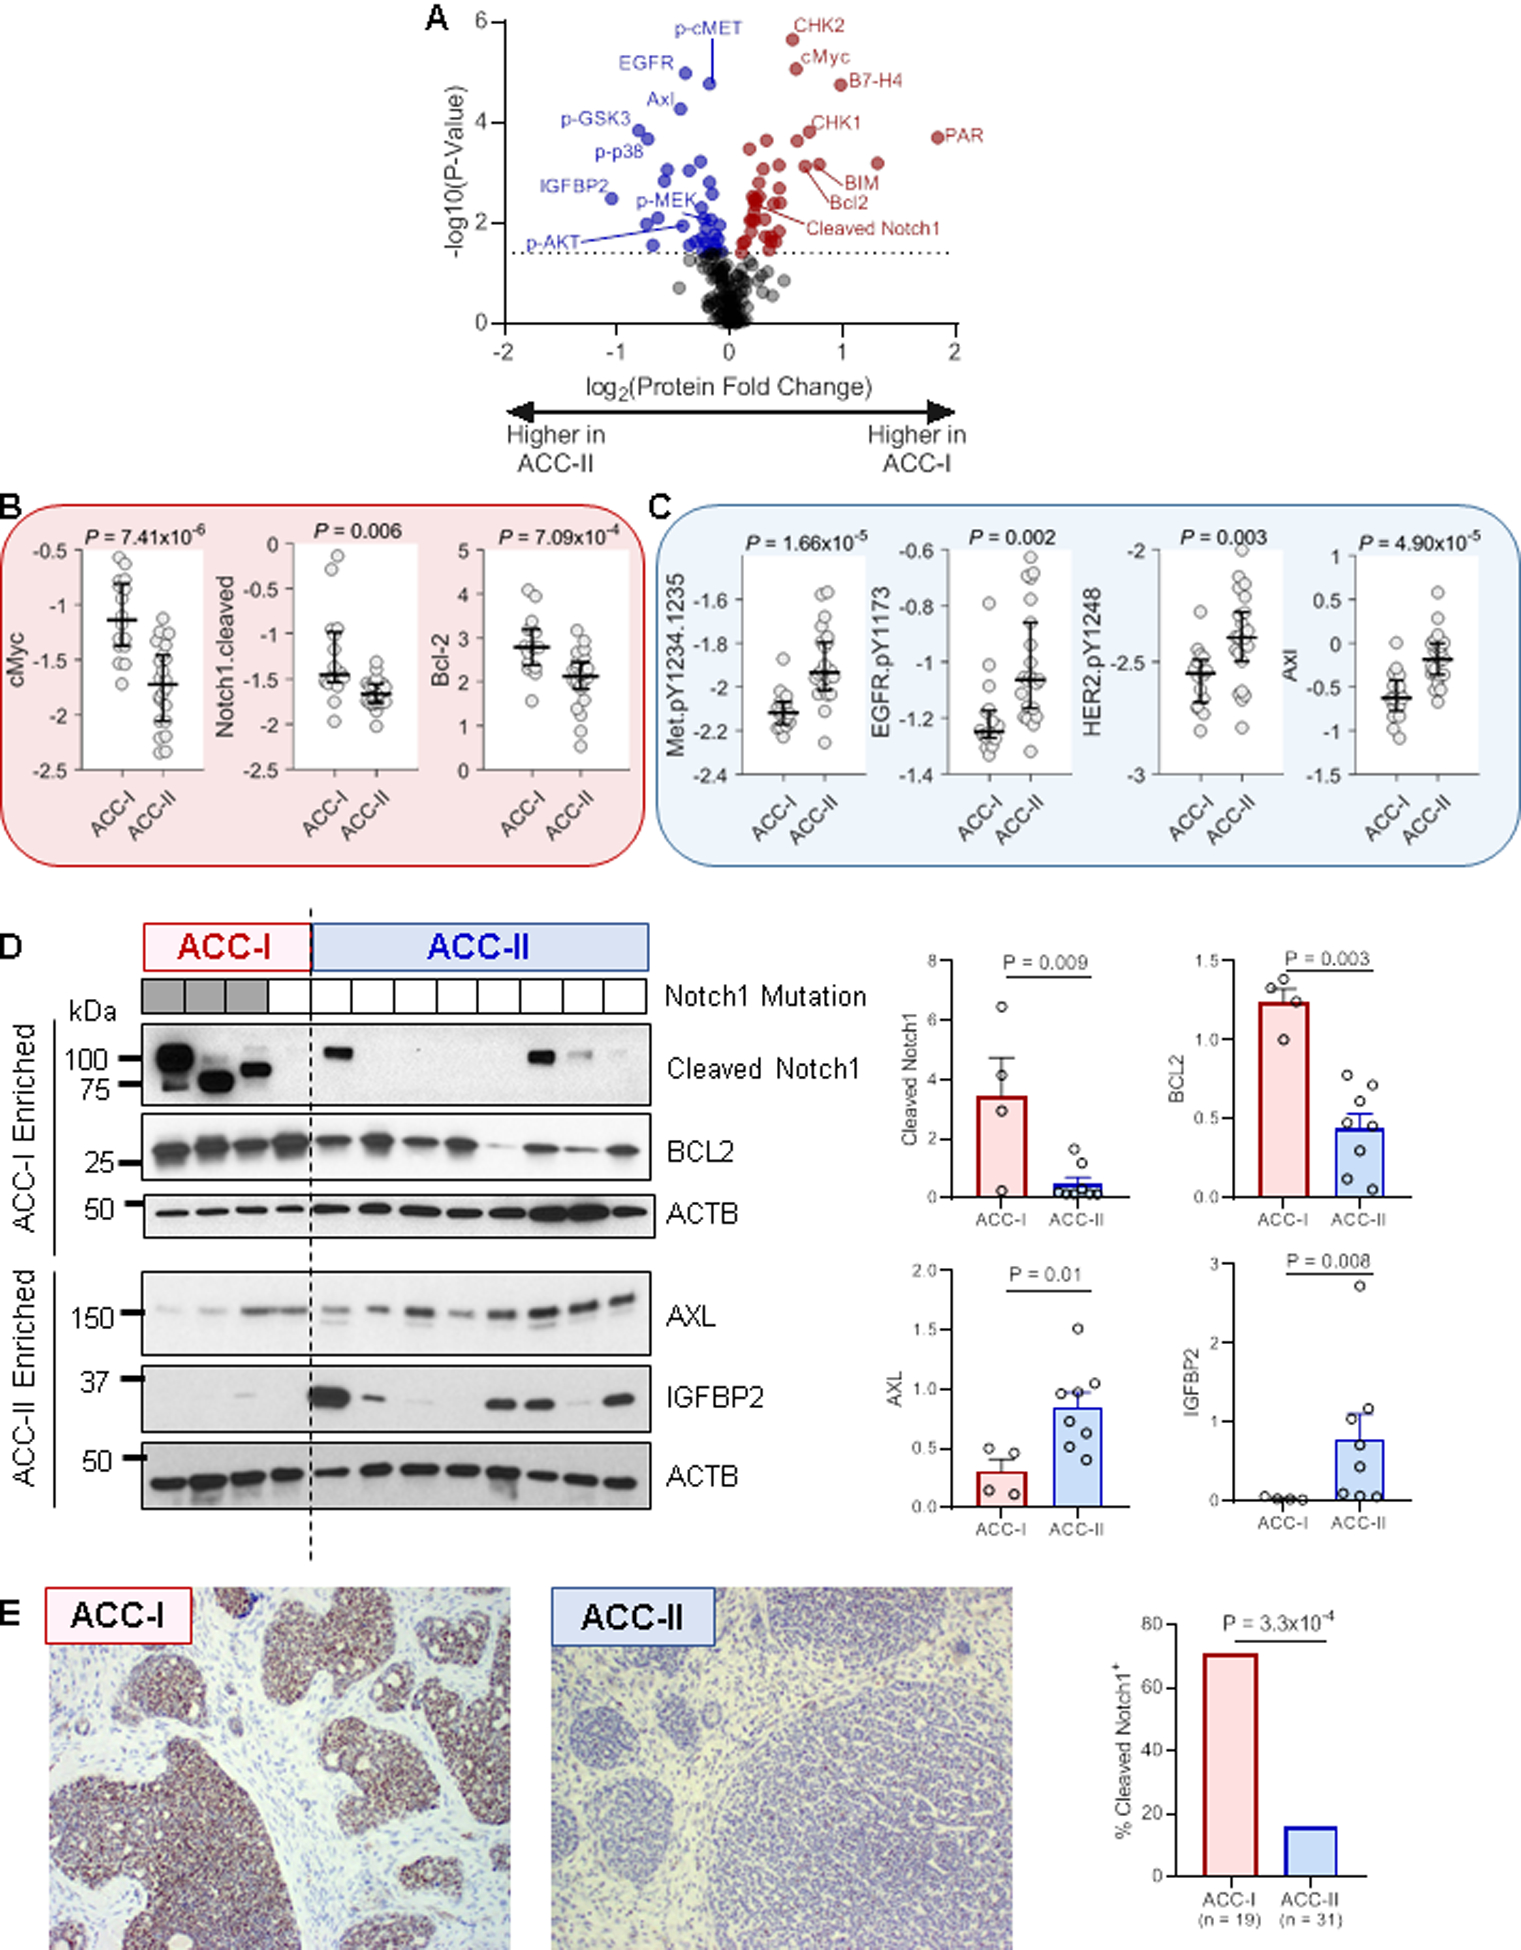
(A) Volcano plot showing proteins with increased expression in ACC-I (positive fold changes, red) or ACC-II (negative fold changes, blue) determined by RPPA. Dotted line indicates 5% FDR.
(B) Select up-regulated proteins in ACC-I. Y-axis indicates protein level determined by RPPA. Rank-sum test.
(C) Select up-regulated proteins in ACC-II. Y-axis indicates protein level determined by RPPA. Rank-sum test.
(D) Validation of select proteins by western blot. Values were normalized to beta actin (ACTB) for quantification. Note that altered cleaved Notch1 band sizes are likely due to mutations altering protein size (full length of NICD1 is 110 kD). Rank-sum test.
(E) Validation of cleaved Notch1 by IHC. Fisher’s exact test.
Proteins significantly more abundant in ACC-II included ERBB family members (EGFR [total and phosphorylated], phospho-HER2), total and phospho-MET, phospho-MEK, phospho-AKT, and phosphor-p38 (Figure 4A,C). The high levels of receptor tyrosine kinases (EGFR, HER2, AXL, and MET) are consistent with the upregulation of growth factor binding, PI3K/AKT and RAS signaling genes in ACC-II (Figure 3C). Notably, DLK1, a non-canonical NOTCH ligand implicated as an inhibitor of NOTCH(30), was overexpressed in the ACC-II subtype.
Western blot and IHC validate RNA and RPPA findings
To further confirm the differences in expression of key RNAs and proteins by subgroup, we performed western blot of four proteins (NICD1, BCL2, AXL, and IGFBP2) in 12 samples (4 ACC-I and 8 ACC-II). Consistent with the RNA-seq and RPPA data, NICD1 (p = 0.009) and BCL2 (p = 0.003) were significantly more abundant in ACC-I subtype, while AXL (p = 0.01) and IGFBP2 (p = 0.008) were significantly more abundant in the ACC-II subtype (Figure 4D). Cleaved/active Notch1 (NICD1) was also detected by IHC, with significantly more positive tumors in ACC-I (16/19) than ACC-II (9/31) (p = 3.3×10⁻⁴, Figure 4E).
NOTCH/MYC signaling as a genomic hallmark of the ACC-I subtype
Given the poor prognosis and major clinical unmet need of the ACC-I subtype, we decided to take a deeper dive into the genomic hallmarks of this subgroup. As previously stated, MYC was amongst the most upregulated gene in this subtype and NOTCH activating mutation, particularly NOTCH1, occurred frequently and solely in ACC-I (60%). Although NOTCH target genes are context and disease-specific, in addition to MYC, we assessed the expression of putative NOTCH targets such as HES1, HEYL, HEY1, HES4, NRARP, TFRC, and NOTCH3 in each subgroup using RNA-seq data. We found that NOTCH target genes were significantly overexpressed in the ACC-I subtype compared to the ACC-II subtype (Figure S4A–C), and a trend towards worse prognosis was observed in tumors positive for cleaved Notch1 (Figure S4D). Overexpression of MYC (p=7.3×10⁻⁸) and NOTCH3 (p=4.9×10⁻⁵) at the RNA level and MYC (p=7.4×10⁻⁶) and cleaved NOTCH1 (NICD1) (p=0.006), at the protein level, all putative NOTCH-targets, suggests that Notch signaling is one of the key drivers of ACC-I subtype tumors. Notably, mutations in CREBBP and its paralog EP300 tended to co-occur with NOTCH1 (Fisher p=0.001 and p=0.12, respectively). CREBBP and EP300 share several conserved domains and regulate the transcription of many genes, including MYC(31,32). Critically, we also observed that ACC-I tumors with wild-type NOTCH1 were significantly enriched for MYC amplification (p=0.01), with 90% of ACC-I tumors displaying either an activating NOTCH1 mutation or MYC amplification (Figure S5). Taken together, these results indicate that ACC-I genetic events converge to promote tumorigenesis via pro-oncogenic MYC signaling.
MYC and TP63 expression are sufficient to identify ACC subtypes.
Although the two subtypes we identified were associated with prognostic and potential therapeutic implications, a more refined set of genes is required for broad clinical application. After observing MYC activation in ACC-I, we next sought to identify a characteristic marker of ACC-II. While receptor tyrosine kinases activation was observed across ACC-II, it was highly heterogeneous. In contrast, we saw robust up-regulation of TP63 across ACC-II tumors (Figure 3A). MYC and TP63 gene expression levels were strongly negatively correlated (Figure 5A), and we found that using an expression score of two genes alone defined as (MYC-TP63) was sufficient to perfectly stratify patients into ACC-I and ACC-II (Figure 5B). Immunohistochemical detection of both MYC and P63 are commonly used in clinical histology laboratories making them ideal for clinical translation. To assess the clinical utility of these biomarkers, we performed IHC for both markers and found they could robustly stratify ACC tumors by subtype (AUROC = 0.99, Figure 5C–D). We validated this result by staining an additional 58 ACC tumor sample cohort for both MYC and p63, and found it was sufficient to accurately stratify patients by prognosis (Figure 5E).
Figure 5. MYC and p63 are sufficient to identify patients with poor prognosis across multiple independent ACC cohorts.
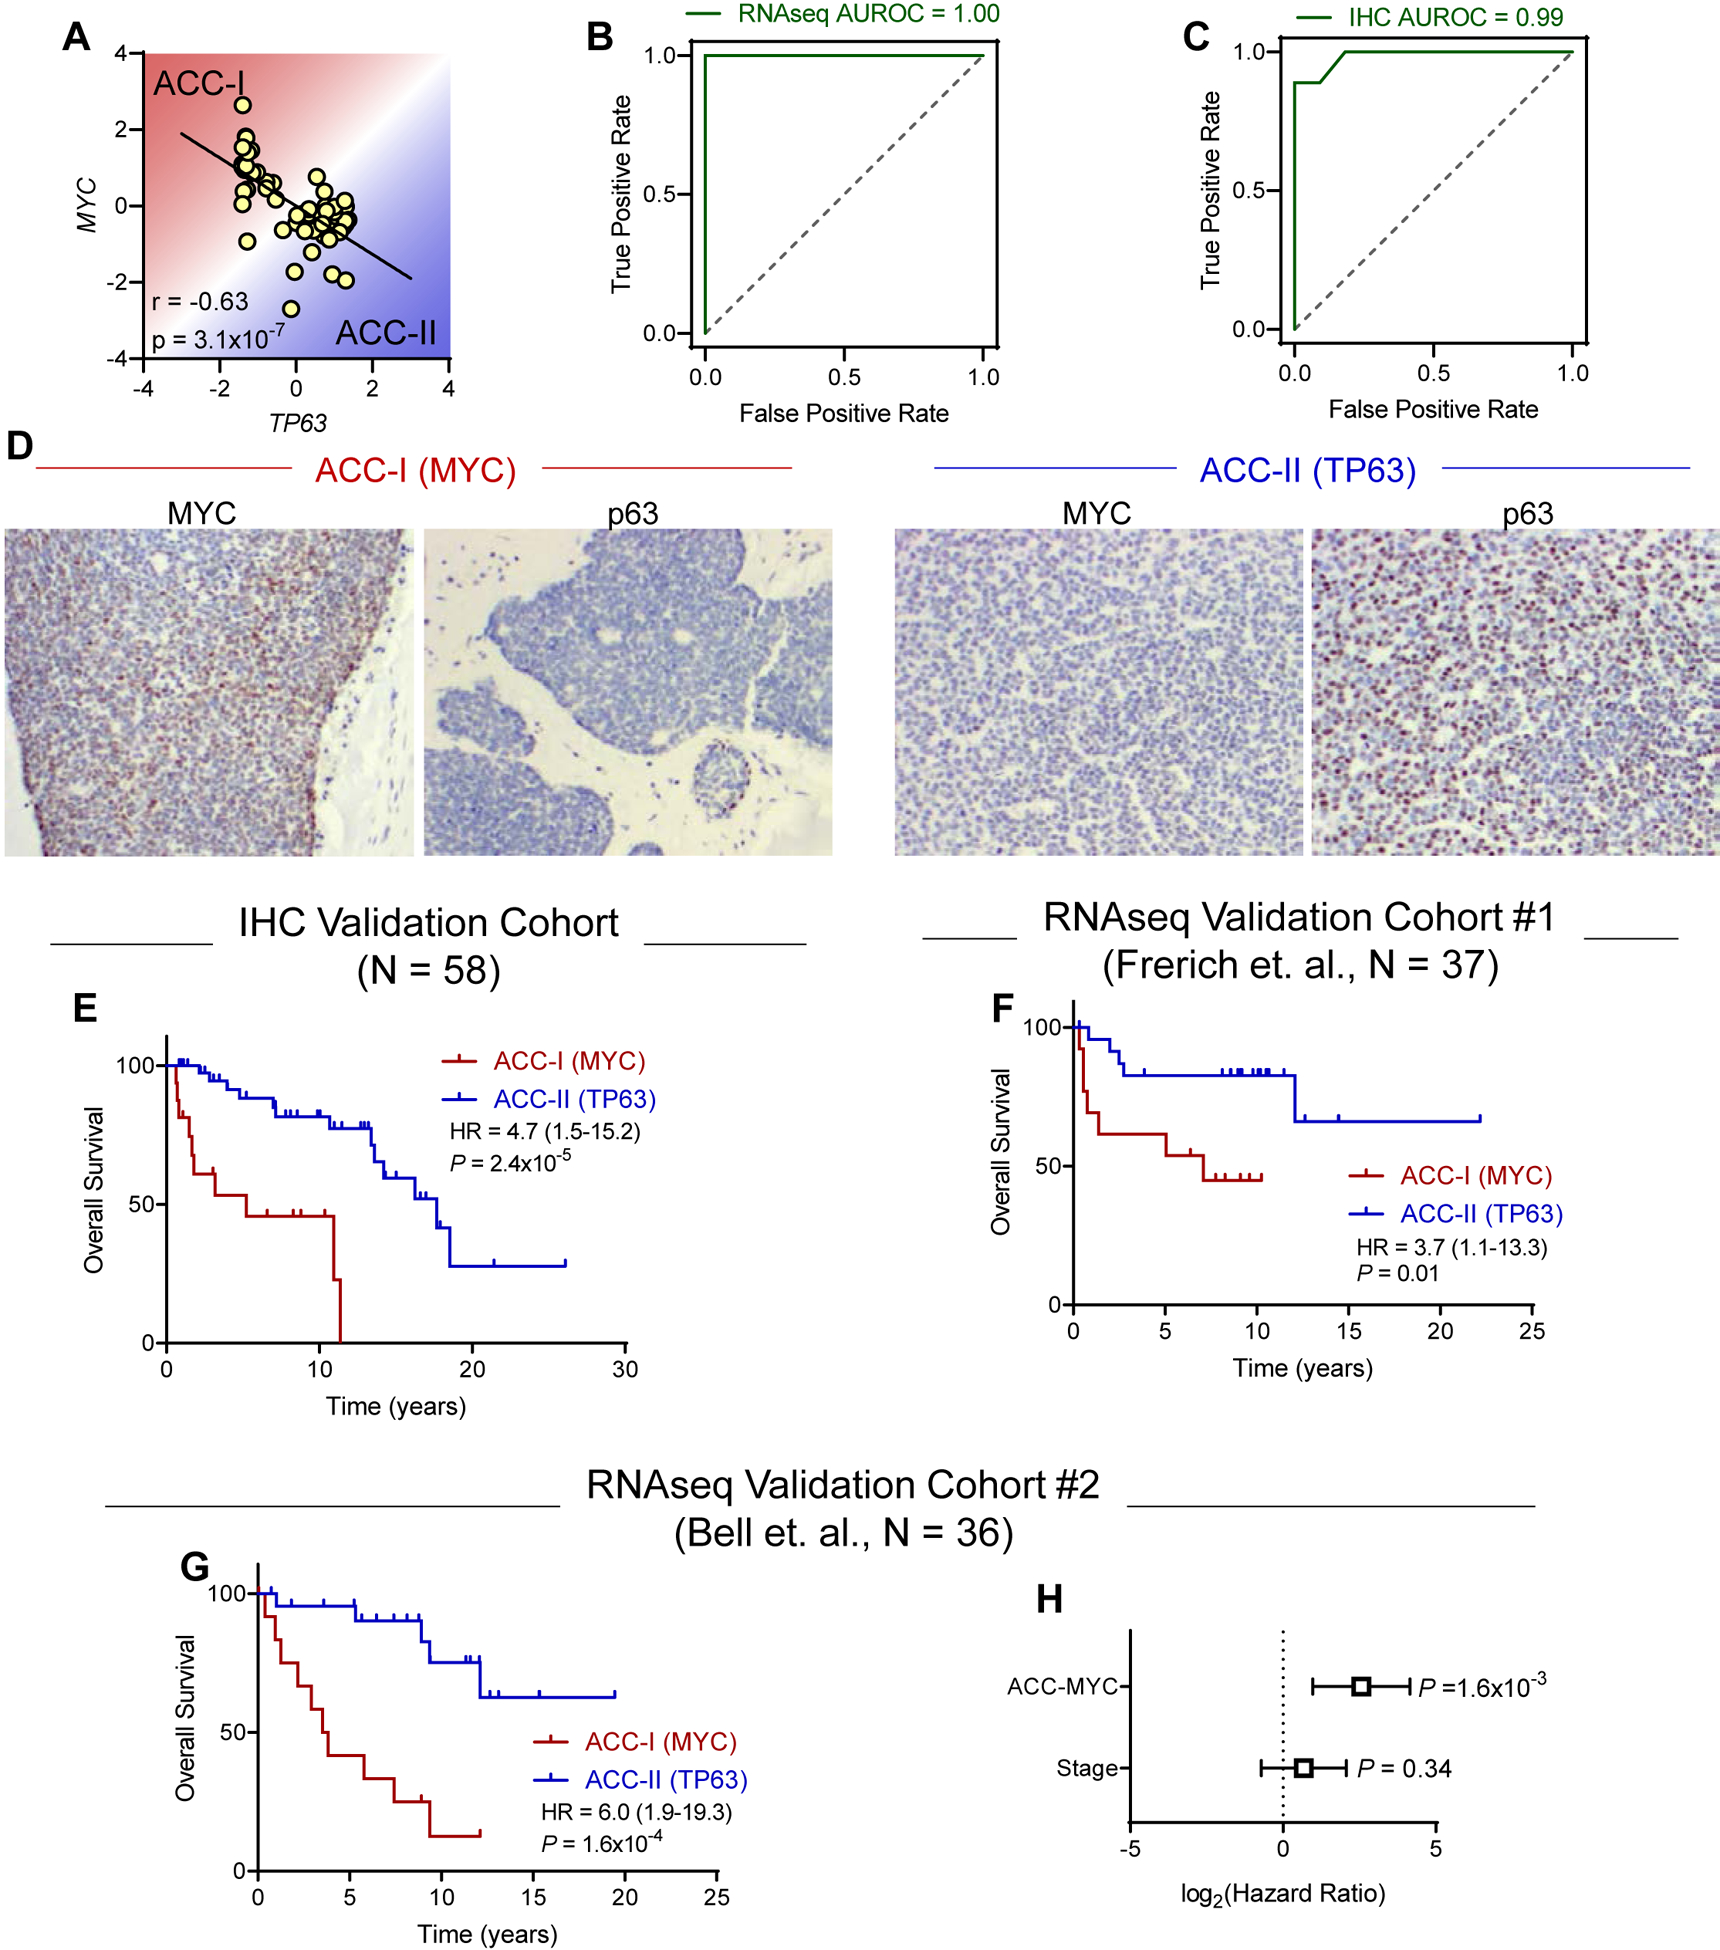
(A) Correlation of MYC and TP63 gene expression levels. Pearson correlation coefficient. N = 54.
(B-C) Receiver-operator characteristic (ROC) curve for the ability of MYC/TP63 gene expression (C) or IHC (D) levels to identify ACC subtypes. Area under ROC curve (AUROC) of 1.0 indicates perfect classification. Dotted line indicates random chance.
(D) Representative immunohistochemical staining for MYC and p63 in tumors from each subtype.
(E) Validation of MYC/TP63 IHC classification in independent cohort of ACC samples (N = 58). Log-rank test.
(F) Validation of MYC/TP63 classification in independent Frerich cohort (N = 37). Samples were divided based on optimal threshold value determined in the original cohort. Log-rank test.
(G) Validation of MYC/TP63 classification in independent Bell cohort (N = 36). Samples were divided based on optimal threshold value determined in the original cohort. Log-rank test.
(H) Multivariate survival analysis using Cox proportional hazards model in Bell validation cohort.
We next sought to further validate our two marker MYC/TP63 classification in independent ACC cohorts. Youden’s J statistic indicated optimal threshold value of 0.19 to stratify patients into ACC-I and ACC-II (Figure 5B). First, we acquired data for 37 tumors from Frerich et. al. (7) for stratification using this threshold. While this cohort was not mature enough to reach median survival and lacked tumor stage data, we still observed a significant difference in survival between ACC-I and ACC-II (HR = 3.7, P = 0.01, Figure 5F). To further validate this approach, we applied this two-gene signature to a third independent cohort (1) of 36 patients with longer survival follow-up and annotation of tumor stage. In this third cohort we again observed our MYC/TP63 score was sufficient to stratify patients by prognosis (Figure 5G), and this prognostic relevance was independent of tumor stage (Figure 5H). In total, after merging our cohort of 54 patients with the additional cohort of 36 patients with information on tumor stage/histology (Figure 5G–H) and classifying based on MYC/TP63, we found no difference in tumor stage between subtypes but observed ACC-I mainted enrichment for solid histologies and tumors arising from the palate and maxillary sinus minor salivary gland origin (Figure 6A). Overall, we found that the MYC-driven subtype exhibited significantly worse prognosis (Figure 6B). Equivalent results for univariate survival were obtained when including the 37 patients from Frerich et. al. and 58 patients analyzed by IHC for 185 patients total (Figure S6). As solid tumors also were associated with worse prognosis and higher stage (Figure S7), we performed multivariate survival analysis with both stage and histology and found ACC-MYC was still a prognostic factor independent of these other variables (Figure 6C). As shown in Figure 6D, taken together our data suggests a model where ACC-I and ACC-II can both be driven by MYB/MYBL1 fusions. In ACC-I, MYC hyperactivation either through amplification or activating Notch mutations suppresses p63 expression. In ACC-II tumors lacking MYC hyperactivation to drive proliferation, p63 can drive expression of pro-growth RTKs to support tumor proliferation. Understanding of these dichotomous ACC phenotypes may help identify specific targeted therapies for each tumor subtype.
Figure 6. Summary of proposed ACC subtypes.
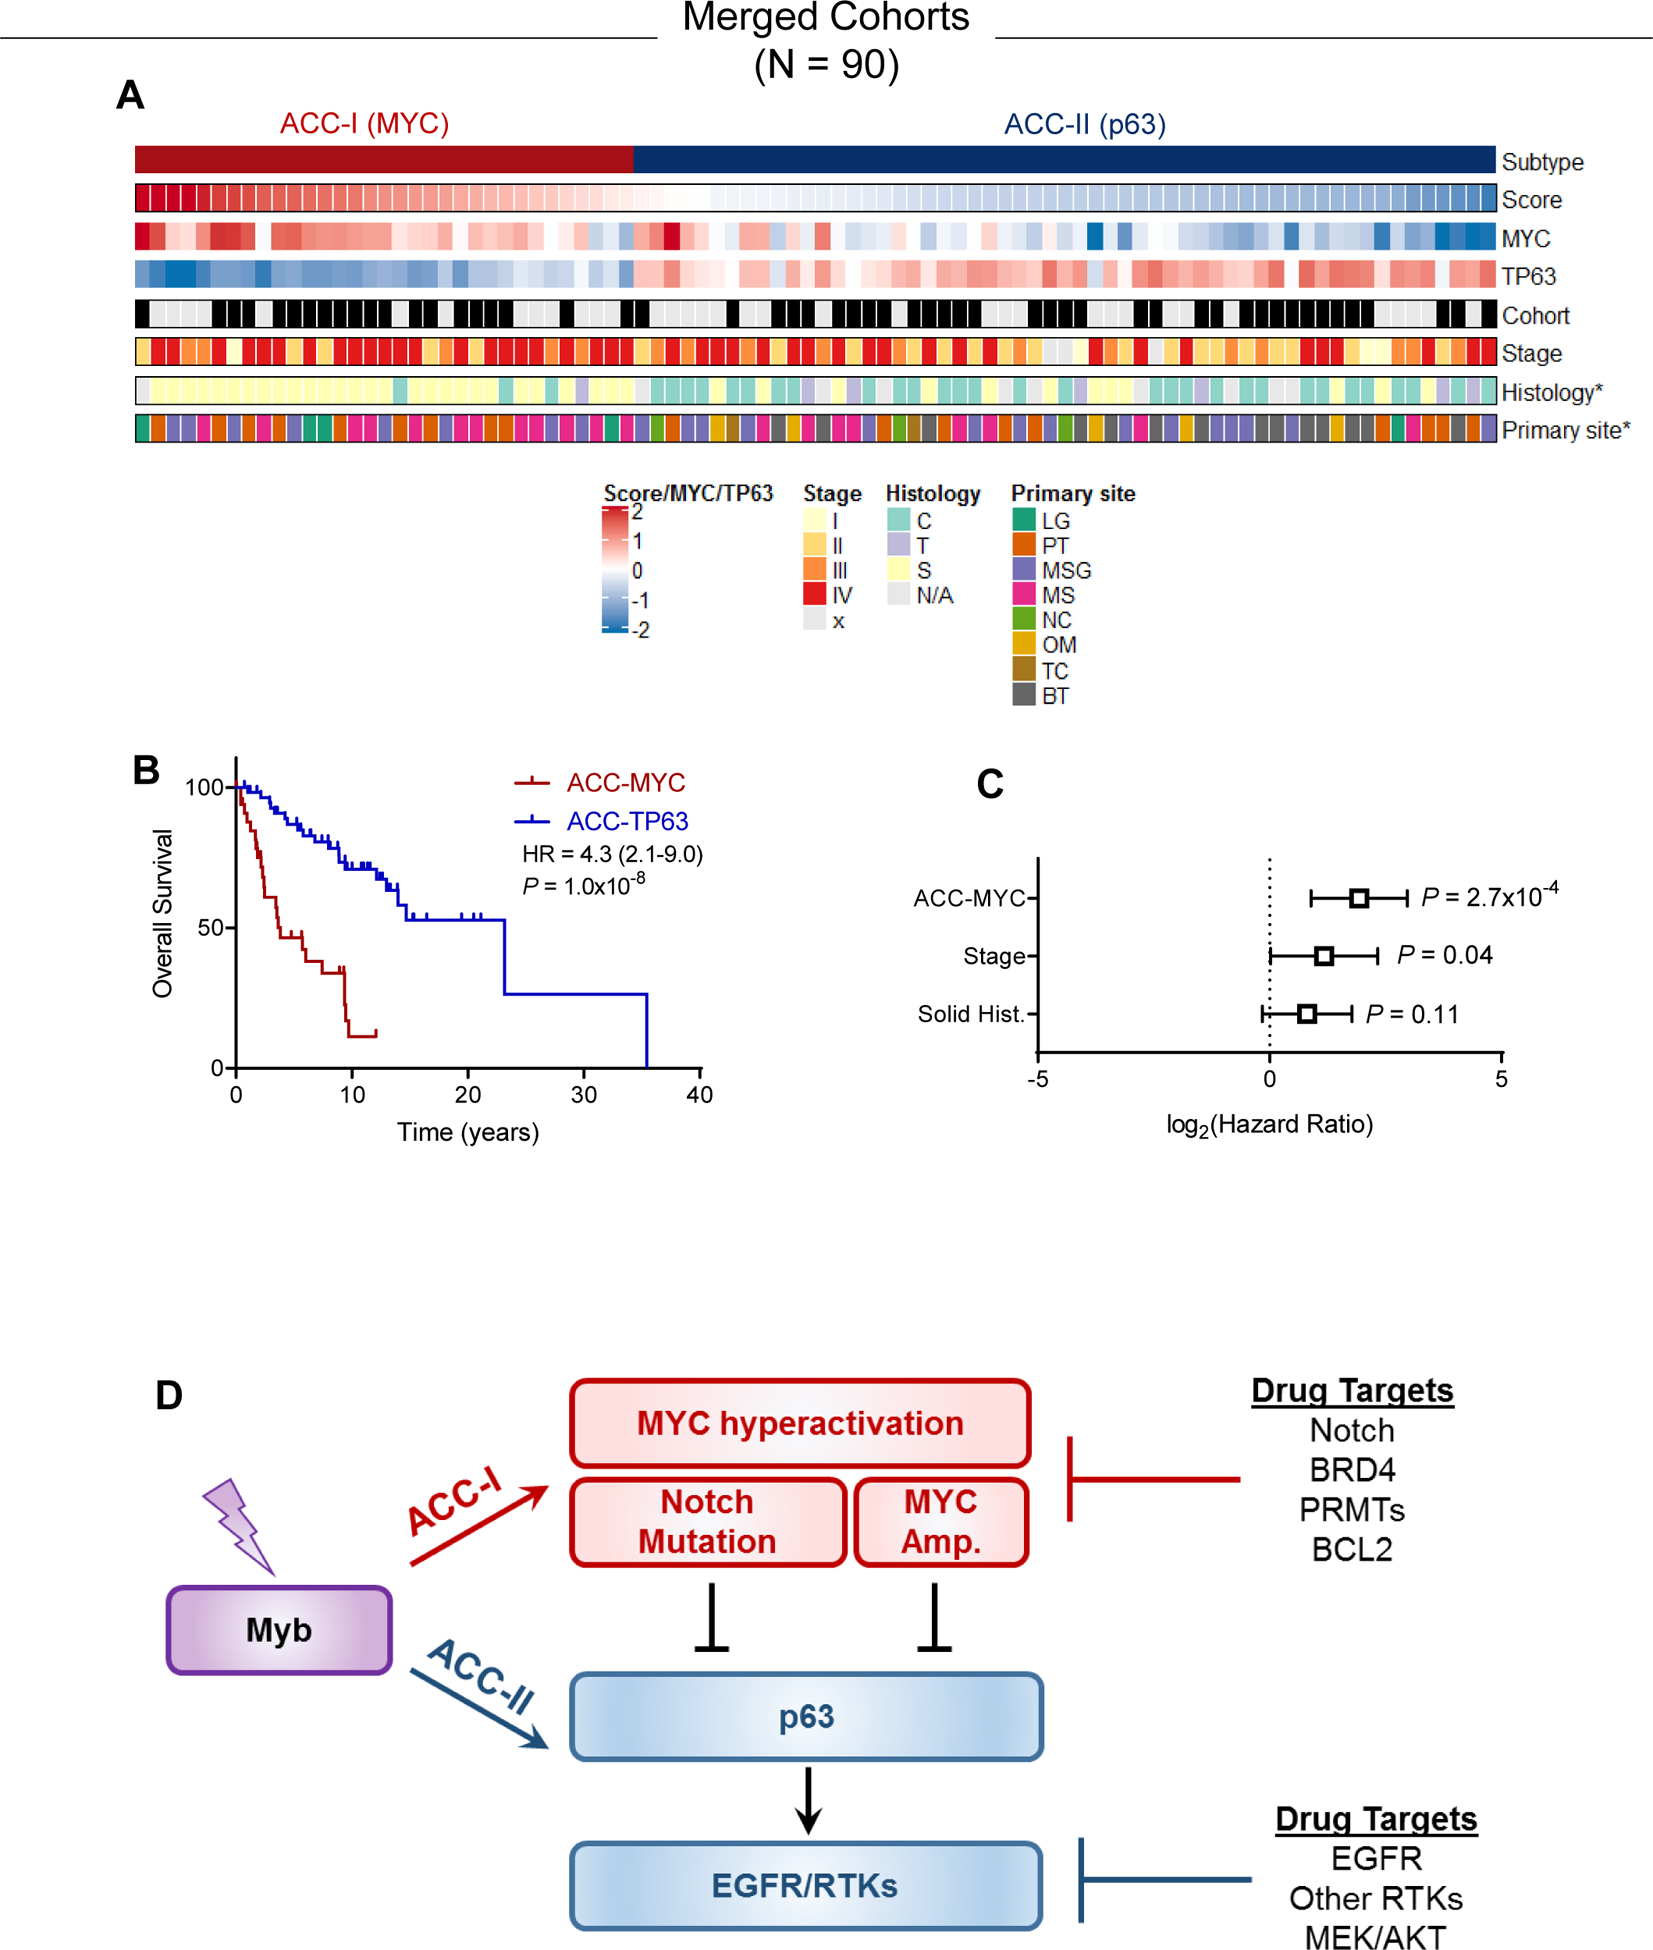
(A) Combination of the original and validation cohort showing subtype, score, MYC/TP63 gene expression levels, tumor stage, histology, and primary site. *p<0.05 association with subtype.
(B) Overall survival in combined cohort. Log-rank test.
(C) Multivariate survival analysis using Cox proportional hazards model in the combined cohort accounting for subtype, tumor stage, and tumor histology.
(D) ACC-I is characterized by MYC hyperactivation via Notch or direct amplification, both of which can suppress p63. In absence of these events, p63 drives EGFR or other RTKs to promote proliferation.
Discussion
Our study, the first comprehensive proteogenomic profiling of salivary ACC, identifies actionable protein markers linked to critical genomic pathways associated with ACC tumorigenesis. Through integrated clinical, genomic and proteomic analysis, we delineated two MYB-fusion agnostic subtypes, ACC-I and ACC-II with direct prognostic and therapeutic implications. In addition to validating previously identified markers and linking NOTCH1 mutations to cellular and structural phenotypes of ACC(9), the study reveals novel druggable therapeutic targets and proposes a new ACC classification to select patients for investigational therapy. While this study was able to stratify ACC tumors into two predominant subtypes using biopsies at a single time point, this classification system does not preclude intratumoral heterogeneity or evolution over time, in particular in response to chemotherapy that may produce dynamic genomic changes. Future studies analyzing multi-region sequencing to assess intratumoral heterogeneity as well as longitudinal analysis to assess tumor plasticity would be of interest to further understand the dynamics of ACC tumors.
The poor prognostic ACC-I subtype was associated with a solid histological component, minor salivary gland origin and enrichment for mutations in NOTCH1–4, SPEN, CREBPP and EP300. GSEA revealed an abundance of genes involved in proliferation and splicing, with MYC amongst the most highly expressed gene and abundant protein in this subgroup. Paradoxically, ACC-II subtype included predominantly cribriform-tubular forms of base of tongue or major salivary gland origin and had better prognosis. Our findings lend credence to the mitigated effect of myoepithelial participation in ACC progression and suggests an organ context association, implicating that both tumor intrinsic genome and its surrounding stroma and endothelial cells may be important in modulating ACC formation and progression (33). Of note, in spite of our unbiased approach for specimen selection, our patient population was over-represented by minor salivary gland primary sites; therefore, an association between primary disease site and biologic behavior needs to be validated in larger series with a more robust representation of major salivary gland primaries.
Our characterization of a NOTCH1/MYC axis in a subset of ACC, the first in the field, underscores a central role for MYC as a key driver in the ACC-I subtype (Figure 6D). An association between MYC gene activation and the loss of myoepithelial cells can be empirically deduced from the high expression of the MYC gene in the solid form and the lack of expression in normal and neoplastic myoepithelial cells as observed in the ACC-I subgroup. Previous studies have shown that MYC can be transcriptionally upregulated by the activation of various pathways including NOTCH1, MYB and beta-Catenin (29,34,35). NOTCH1–4’s activating mutations, as well as the mutation of their negative regulator (SPEN), occurred at high frequency solely in ACC-I tumors, indicating that NOTCH signaling activation may serve as one of the key alterations driving MYC overexpression in this subtype. Strikingly, besides transcriptional regulation, we discovered that ACC-I tumors with intact NOTCH1 were enriched for MYC gene amplification and 90% of ACC-I tumors exhibited either an activating NOTCH1 mutation or MYC amplification (Figure S5), indicating that direct gene amplification and Notch activation are two independent key mechanisms leading to the high level of MYC in ACC-I subtype (Figure 6D). In fact, these essential oncogenic roles of NOTCH1/MYC axis were well documented in T-cell acute lymphoblastic leukemia (T-ALL) studies(29). In line with the importance of MYC as a NOTCH1 target gene triggering tumorigenesis, transgenic expression of Myc in hematopoietic progenitors promotes the development of Notch-intact T-ALL in mice (29,36). Another line of evidence in support of MYC as an essential target of NOTCH1 signaling is that resistance to Notch inhibitors (GSIs) is associated with re-expression of MYC via NOTCH-independent mechanisms such as exploiting alternative enhancers(29). In an ongoing clinical trial evaluating a GSI for ACC, we noticed that only a subset of NOTCH mutated patients (~20%) responded to therapy(37), suggesting combinatorial therapy will be critical to overcome innate and acquired GSI resistance.
Recent studies show that the oncogenic overexpression of MYC confers a collateral stress on RNA splicing, making the spliceosome a therapeutic vulnerability in MYC-driven cancer(38). In line with that, our data revealed that MYC-driven ACC-I subtype exhibited high splicing activity (Figure 3), providing opportunity for co-targeting. In a clinical trial with a PRMT5 inhibitor (GSK3326595), which can potentially suppress splicing as well as MYC expression(39), 3 out of 14 unselected ACC patients achieved a partial response(40). Thus, PRMT5 inhibitors as single agent or combined with GSI can be exploited to treat aggressive ACC-I subtype. Lastly, while previously considered infeasible, directly inhibiting MYC with new agents such as the omomyc mini-protein (a dominant negative form of MYC) may be possible and will be entering clinical trials in the near future(41).
Another novel therapeutic target in ACC-I is BCL2. Our analyses demonstrated that BCL2 is substantially upregulated in ACC-I and co-overexpressed with MYC and NICD1, suggesting dual blocking apoptosis and activation of proliferation underlies the progressive nature of ACC-I subgroup. In that context, BCL2 inhibitor combined with GSI or PRMT5 inhibitor may be worth exploring in ACC-I patients. Pre-clinical testing of BCL2-inhibitors and GSI has shown synergistic effects in other solid tumors supporting this combinatorial strategy (42–45). Also noticeable in ACC-I is the significant overexpression of PAR, CHK1 and CHK2, suggesting PARP inhibitors may also be worth investigating.
In the ACC-II subtype, in contrast to ACC-I, P63 along with receptor tyrosine kinases (AXL, MET, and EGFR) were overexpressed at both the RNA and protein levels. Although the mechanisms leading to the overexpression of these RTKs remain unclear, P63 has been shown to augment EGFR and AXL expression(46,47), suggesting that P63 upregulation may propel the overexpression of these RTKs in ACC-II. A previous study has shown that MYC can repress TP63 expression via interacting with PRTM5 (48), thus we speculate that, in ACC-II tumors, with the absence of hyperactivation of MYC, TP63 levels are upregulated and drive AXL, EGFR or other RTKs to promote oncogenesis (Figure 6D). AXL overexpression is associated with resistance to chemotherapy, targeted therapy, and immunotherapy(49). Furthermore, increased MET expression is associated with poor prognosis and resistance to targeted therapies in many solid tumor types(50,51). Multi-kinase inhibitors such as cabozantinib, which targets AXL, MET, and VEGFR, is therefore a potential therapy for ACC and is being studied in a clinical trial (NCT03729297). Furthermore, AXL and MET mediate resistance to EGFR inhibitors in certain solid tumors(52–54). The combination of cabozantinib and the EGFR inhibitor erlotinib has shown activity in EGFR-refractory lung cancer and may be worth exploring in ACC-II (55). Additionally, the upregulated levels of phosphorylated MEK and its downstream target p38 (Figure 4A), points to MEK inhibitor combinations (56,57) as another option for targeting ACC-II subtype.
Recently, a study evaluating the mutational profile of a large ACC cohort confirmed our previous findings of enrichment for NOTCH1 mutation in metastatic ACC and its poor prognosis association (9) and proposed a classification based on MYB fusion, NOTCH mutation and TERT mutation; however, this classification only encompasses half of ACC (53%) and has limited therapeutic application since only NOTCH is currently directly targetable(25). Furthermore, it requires genomic profiling which is costly and not reimbursable for patients with loco-regional disease amenable to local therapy. A major strength of our study is that our proposed classification encompasses all ACCs, has a stronger prognostic value than disease stage and histological subtype, and of direct clinical relevance, the two biologically distinct subgroups can be largely differentiated by using standard immunohistochemistry staining available in any clinical pathology lab (P63/MYC) (Figure 5). Our findings adds to previous reports of gene expression in ACC which focused on predominant cell type (epithelial vs myoepithelial)(1) and MYB fusion status(7). Our ACC subtypes were enriched for predominantly epithelial (ACC-I) or myoepithelial (ACC-II) cells; however, our expression groups were more prognostic than an ACC classification based on histology (Figure 6C). In contrast to the findings of Frerich et al (7), MYB/MYB-L1 expression did not define distinct ACC subgroups in our cohort, nevertheless the authors report significantly higher expression of SOX4 and SOX8 in their poor prognosis subgroup and TP63 and EGFR in their good prognosis subgroup, which was also noted in our ACC-I and ACC-II subtypes, respectively. Critically, this manuscript reports the first translatable biomarker for stratification, a simple two-marker approach allowing for rapid clinical subtype assessment by staining for only p63 and MYC. Furthermore, integration of multi-omic molecular characterization allows for identification of novel therapeutic avenues to target each subtype (Figure 6D).
In conclusion, our comprehensive proteogenomic analysis of ACC samples identified two subtypes with distinct phenotypes and prognosis. Co-occurrence of multiple actionable protein/pathways alterations in each subtype indicated opportunities for optimal combination therapy. Our novel molecular classification could be valuable for selecting/stratifying ACC patients and development of therapies for this orphan disease. Immunohistochemistry testing for P63 and/or MYC should be considered for ACC patients for stratification in clinical trials and it may guide follow-up routine and therapeutic decisions.
Supplementary Material
Translational Relevance.
Our comprehensive unbiased proteogenomic analysis of adenoid cystic carcinoma (ACC) revealed two molecular subtypes; ACC-I (37%) and ACC-II (63%), with distinctive histological characteristics and prognosis. ACC-I was associated with worse prognosis and exhibited enrichment of NOTCH activating mutations, overexpression of MYC, and upregulation of mRNA splicing pathway. ACC-II was associated with better prognosis, and overexpression of potential therapeutic targets including AXL, phospho-MET, and phosph-EGFR. Notably, we established a two gene (MYC/TP63) signature that accurately segregates tumors into ACC-I and ACC-II subtypes. We validate the utility of this MYC/TP63 signature in three additional cohorts. Furthermore, we show that assessment of MYC and p63 by immunohistochemistry, which is routinely performed in many clinical laboratories, accurately stratifies tumors by subtype allowing for rapid implementation of ACC subtyping for clinical trials and other therapeutic decisions. Colletively, our novel molecular classification can be highly valuable for strategizing optimal targeted therapies for this orphan disease.
Acknowledgements
This work was supported by grants from the Conquer Cancer Foundation of the American Society of Clinical Oncology (to RF), Adenoid Cystic Carcinoma Research Foundation (to RF), Khalifa Bin Zayed Al Nahyan Foundation Khalifa Scholar fellowship program (to RF), the NIH National Institute of Dental and Craniofacial Research and the SGTB (Salivary Gland Tumor Biorepository, HHSN268200900039C 04), NCI grant K99CA240689 (to DJM), and by the NIH/NCI under award number P30 CA016672, which supports the Sequencing and Microarray Facility. Stephanie P. Deming of Scientific Publications, Research Medical Library, MD Anderson Cancer Center, for editorial assistance. The Adenoid Cystic Carcinoma Research Foundation (ACCRF) for critically reviewing the manuscript.
Footnotes
Conflict of Interest Disclosures: Dr. Ferrarotto reports personal fees from Regeneron-Sanofi, Ayala Pharma, Klus Pharma, Medscape, Cellestia Biotech, Carevive, and Prelude; grants from AstraZeneca, Merck, Gennentech, Pfizer, Oropharynx Program Stiefel clinical trials, ASCO Career Development Award, and MD Anderson Khalifa Award within the past two years.
References
- 1.Bell D, Bell AH, Bondaruk J, Hanna EY, Weber RS. In-depth characterization of the salivary adenoid cystic carcinoma transcriptome with emphasis on dominant cell type. Cancer 2016;122(10):1513–22 doi 10.1002/cncr.29959. [DOI] [PubMed] [Google Scholar]
- 2.Bell D, Roberts D, Kies M, Rao P, Weber RS, El-Naggar AK. Cell type-dependent biomarker expression in adenoid cystic carcinoma: biologic and therapeutic implications. Cancer 2010;116(24):5749–56 doi 10.1002/cncr.25541. [DOI] [PMC free article] [PubMed] [Google Scholar]
- 3.Ferrarotto R, Heymach JV, Glisson BS. MYB-fusions and other potential actionable targets in adenoid cystic carcinoma. Curr Opin Oncol 2016;28(3):195–200 doi 10.1097/CCO.0000000000000280. [DOI] [PubMed] [Google Scholar]
- 4.Stephens PJ, Davies HR, Mitani Y, Van Loo P, Shlien A, Tarpey PS, et al. Whole exome sequencing of adenoid cystic carcinoma. The Journal of clinical investigation 2013;123(7):2965–8 doi 10.1172/JCI67201. [DOI] [PMC free article] [PubMed] [Google Scholar]
- 5.Kulis M, Heath S, Bibikova M, Queiros AC, Navarro A, Clot G, et al. Epigenomic analysis detects widespread gene-body DNA hypomethylation in chronic lymphocytic leukemia. Nat Genet 2012;44(11):1236–42 doi 10.1038/ng.2443. [DOI] [PubMed] [Google Scholar]
- 6.Ho AS, Kannan K, Roy DM, Morris LG, Ganly I, Katabi N, et al. The mutational landscape of adenoid cystic carcinoma. Nat Genet 2013;45(7):791–8 doi 10.1038/ng.2643. [DOI] [PMC free article] [PubMed] [Google Scholar]
- 7.Frerich CA, Brayer KJ, Painter BM, Kang H, Mitani Y, El-Naggar AK, et al. Transcriptomes define distinct subgroups of salivary gland adenoid cystic carcinoma with different driver mutations and outcomes. Oncotarget 2018;9(7):7341–58 doi 10.18632/oncotarget.23641. [DOI] [PMC free article] [PubMed] [Google Scholar]
- 8.Byers LA, Wang J, Nilsson MB, Fujimoto J, Saintigny P, Yordy J, et al. Proteomic profiling identifies dysregulated pathways in small cell lung cancer and novel therapeutic targets including PARP1. Cancer discovery 2012;2(9):798–811 doi 10.1158/2159-8290.CD-12-0112. [DOI] [PMC free article] [PubMed] [Google Scholar]
- 9.Ferrarotto R, Mitani Y, Diao L, Guijarro I, Wang J, Zweidler-McKay P, et al. Activating NOTCH1 Mutations Define a Distinct Subgroup of Patients With Adenoid Cystic Carcinoma Who Have Poor Prognosis, Propensity to Bone and Liver Metastasis, and Potential Responsiveness to Notch1 Inhibitors. J Clin Oncol 2017;35(3):352–60 doi 10.1200/JCO.2016.67.5264. [DOI] [PMC free article] [PubMed] [Google Scholar]
- 10.Dobin A, Davis CA, Schlesinger F, Drenkow J, Zaleski C, Jha S, et al. STAR: ultrafast universal RNA-seq aligner. Bioinformatics 2013;29(1):15–21 doi 10.1093/bioinformatics/bts635. [DOI] [PMC free article] [PubMed] [Google Scholar]
- 11.Anders S, Pyl PT, Huber W. HTSeq--a Python framework to work with high-throughput sequencing data. Bioinformatics 2015;31(2):166–9 doi 10.1093/bioinformatics/btu638. [DOI] [PMC free article] [PubMed] [Google Scholar]
- 12.Wang K, Li M, Hakonarson H. ANNOVAR: functional annotation of genetic variants from high-throughput sequencing data. Nucleic Acids Res 2010;38(16):e164 doi 10.1093/nar/gkq603. [DOI] [PMC free article] [PubMed] [Google Scholar]
- 13.de Hoon MJL, Imoto S, Nolan J, Miyano S. Open source clustering software. Bioinformatics 2004;20(9):1453–4 doi 10.1093/bioinformatics/bth078. [DOI] [PubMed] [Google Scholar]
- 14.Chen K, Meric-Bernstam F, Zhao H, Zhang Q, Ezzeddine N, Tang LY, et al. Clinical actionability enhanced through deep targeted sequencing of solid tumors. Clin Chem 2015;61(3):544–53 doi 10.1373/clinchem.2014.231100. [DOI] [PMC free article] [PubMed] [Google Scholar]
- 15.Cibulskis K, Lawrence MS, Carter SL, Sivachenko A, Jaffe D, Sougnez C, et al. Sensitive detection of somatic point mutations in impure and heterogeneous cancer samples. Nat Biotechnol 2013;31(3):213–9 doi 10.1038/nbt.2514. [DOI] [PMC free article] [PubMed] [Google Scholar]
- 16.Raine KM, Hinton J, Butler AP, Teague JW, Davies H, Tarpey P, et al. cgpPindel: Identifying Somatically Acquired Insertion and Deletion Events from Paired End Sequencing. Curr Protoc Bioinformatics 2015;52:15 7 1–2 doi 10.1002/0471250953.bi1507s52. [DOI] [PMC free article] [PubMed] [Google Scholar]
- 17.Rousseeuw PJ. Silhouettes: A graphical aid to the interpretation and validation of cluster analysis. J Comput Appl Math 1987;20:53–65 doi 10.1016/0377-0427(87)90125-7. [DOI] [Google Scholar]
- 18.Kluk MJ, Ashworth T, Wang H, Knoechel B, Mason EF, Morgan EA, et al. Gauging NOTCH1 Activation in Cancer Using Immunohistochemistry. PLoS One 2013;8(6):e67306 doi 10.1371/journal.pone.0067306. [DOI] [PMC free article] [PubMed] [Google Scholar]
- 19.Subramanian A, Tamayo P, Mootha VK, Mukherjee S, Ebert BL, Gillette MA, et al. Gene set enrichment analysis: a knowledge-based approach for interpreting genome-wide expression profiles. Proc Natl Acad Sci U S A 2005;102(43):15545–50 doi 10.1073/pnas.0506580102. [DOI] [PMC free article] [PubMed] [Google Scholar]
- 20.Tirosh I, Izar B, Prakadan SM, Wadsworth MH 2nd, Treacy D, Trombetta JJ, et al. Dissecting the multicellular ecosystem of metastatic melanoma by single-cell RNA-seq. Science 2016;352(6282):189–96 doi 10.1126/science.aad0501. [DOI] [PMC free article] [PubMed] [Google Scholar]
- 21.Bray NL, Pimentel H, Melsted P, Pachter L. Near-optimal probabilistic RNA-seq quantification. Nat Biotechnol 2016;34(5):525–7 doi 10.1038/nbt.3519. [DOI] [PubMed] [Google Scholar]
- 22.Mitani Y, Rao PH, Futreal PA, Roberts DB, Stephens PJ, Zhao YJ, et al. Novel chromosomal rearrangements and break points at the t(6;9) in salivary adenoid cystic carcinoma: association with MYB-NFIB chimeric fusion, MYB expression, and clinical outcome. Clin Cancer Res 2011;17(22):7003–14 doi 10.1158/1078-0432.CCR-11-1870. [DOI] [PMC free article] [PubMed] [Google Scholar]
- 23.Mitani Y, Li J, Rao PH, Zhao YJ, Bell D, Lippman SM, et al. Comprehensive analysis of the MYB-NFIB gene fusion in salivary adenoid cystic carcinoma: Incidence, variability, and clinicopathologic significance. Clin Cancer Res 2010;16(19):4722–31 doi 10.1158/1078-0432.CCR-10-0463. [DOI] [PMC free article] [PubMed] [Google Scholar]
- 24.Mitani Y, Liu B, Rao PH, Borra VJ, Zafereo M, Weber RS, et al. Novel MYBL1 Gene Rearrangements with Recurrent MYBL1-NFIB Fusions in Salivary Adenoid Cystic Carcinomas Lacking t(6;9) Translocations. Clin Cancer Res 2016;22(3):725–33 doi 10.1158/1078-0432.CCR-15-2867-T. [DOI] [PMC free article] [PubMed] [Google Scholar]
- 25.Ho AS, Ochoa A, Jayakumaran G, Zehir A, Valero Mayor C, Tepe J, et al. Genetic hallmarks of recurrent/metastatic adenoid cystic carcinoma. The Journal of clinical investigation 2019;129(10):4276–89 doi 10.1172/JCI128227. [DOI] [PMC free article] [PubMed] [Google Scholar]
- 26.Liu B, Mitani Y, Rao X, Zafereo M, Zhang J, Zhang J, et al. Spatio-Temporal Genomic Heterogeneity, Phylogeny, and Metastatic Evolution in Salivary Adenoid Cystic Carcinoma. J Natl Cancer Inst 2017;109(10) doi 10.1093/jnci/djx033. [DOI] [PMC free article] [PubMed] [Google Scholar]
- 27.Drier Y, Cotton MJ, Williamson KE, Gillespie SM, Ryan RJ, Kluk MJ, et al. An oncogenic MYB feedback loop drives alternate cell fates in adenoid cystic carcinoma. Nat Genet 2016;48(3):265–72 doi 10.1038/ng.3502. [DOI] [PMC free article] [PubMed] [Google Scholar]
- 28.Rettig EM, Talbot CC Jr., Sausen, Jones S, Bishop JA, Wood LD, et al. Whole-Genome Sequencing of Salivary Gland Adenoid Cystic Carcinoma. Cancer Prev Res (Phila) 2016;9(4):265–74 doi 10.1158/1940-6207.CAPR-15-0316. [DOI] [PMC free article] [PubMed] [Google Scholar]
- 29.Aster JC, Pear WS, Blacklow SC. The Varied Roles of Notch in Cancer. Annual review of pathology 2017;12:245–75 doi 10.1146/annurev-pathol-052016-100127. [DOI] [PMC free article] [PubMed] [Google Scholar]
- 30.Van Limpt VA, Chan AJ, Van Sluis PG, Caron HN, Van Noesel CJ, Versteeg R. High delta-like 1 expression in a subset of neuroblastoma cell lines corresponds to a differentiated chromaffin cell type. Int J Cancer 2003;105(1):61–9 doi 10.1002/ijc.11047. [DOI] [PubMed] [Google Scholar]
- 31.Dai P, Akimaru H, Tanaka Y, Hou DX, Yasukawa T, Kanei-Ishii C, et al. CBP as a transcriptional coactivator of c-Myb. Genes Dev 1996;10(5):528–40 doi 10.1101/gad.10.5.528. [DOI] [PubMed] [Google Scholar]
- 32.Garcia-Carpizo V, Ruiz-Llorente S, Sarmentero J, Grana-Castro O, Pisano DG, Barrero MJ. CREBBP/EP300 bromodomains are critical to sustain the GATA1/MYC regulatory axis in proliferation. Epigenetics Chromatin 2018;11(1):30 doi 10.1186/s13072-018-0197-x. [DOI] [PMC free article] [PubMed] [Google Scholar]
- 33.Valkenburg KC, de Groot AE, Pienta KJ. Targeting the tumour stroma to improve cancer therapy. Nat Rev Clin Oncol 2018;15(6):366–81 doi 10.1038/s41571-018-0007-1. [DOI] [PMC free article] [PubMed] [Google Scholar]
- 34.Tang YL, Liu X, Gao SY, Feng H, Jiang YP, Wang SS, et al. WIP1 stimulates migration and invasion of salivary adenoid cystic carcinoma by inducing MMP-9 and VEGF-C. Oncotarget 2015;6(11):9031–44 doi 10.18632/oncotarget.3320. [DOI] [PMC free article] [PubMed] [Google Scholar]
- 35.Berge T, Matre V, Brendeford EM, Saether T, Luscher B, Gabrielsen OS. Revisiting a selection of target genes for the hematopoietic transcription factor c-Myb using chromatin immunoprecipitation and c-Myb knockdown. Blood Cells Mol Dis 2007;39(3):278–86 doi 10.1016/j.bcmd.2007.05.007. [DOI] [PubMed] [Google Scholar]
- 36.Felsher DW, Bishop JM. Reversible tumorigenesis by MYC in hematopoietic lineages. Mol Cell 1999;4(2):199–207 doi 10.1016/s1097-2765(00)80367-6. [DOI] [PubMed] [Google Scholar]
- 37.Ferrarotto R, Ho AS, Wirth LJ, Muzzaffar J, Rodriguez C, Dekel E, et al. ACCURACY a phase (P) 2 trial of AL101, a pan-Notch inhibitor, in recurrent/metastatic (R/M) adenoid cystic carcinoma (ACC) patients (pts) with Notc. 2019; Barcelona Spain. [Google Scholar]
- 38.Hsu TY, Simon LM, Neill NJ, Marcotte R, Sayad A, Bland CS, et al. The spliceosome is a therapeutic vulnerability in MYC-driven cancer. Nature 2015;525(7569):384–8 doi 10.1038/nature14985. [DOI] [PMC free article] [PubMed] [Google Scholar]
- 39.Bonnal SC, Lopez-Oreja I, Valcarcel J. Roles and mechanisms of alternative splicing in cancer - implications for care. Nat Rev Clin Oncol 2020;17(8):457–74 doi 10.1038/s41571-020-0350-x. [DOI] [PubMed] [Google Scholar]
- 40.Siu LL RD, Vinay SP, Romano M, Menis J, Opdam FL, Heinhuis KM, Egger JL, Gorman SA,Parasrampuria R, Wang K, Kremer BE, Gounder MM METEOR-1: A phase I study of GSK3326595, a first-in-class protein arginine methyltransferase 5 (PRMT5) inhibitor, in advanced solid tumours. Annals of Oncology 2019;30 (Supplement 5)(v159–v193) doi doi: 10.1093/annonc/mdz244. [DOI] [Google Scholar]
- 41.Beaulieu ME, Jauset T, Masso-Valles D, Martinez-Martin S, Rahl P, Maltais L, et al. Intrinsic cell-penetrating activity propels Omomyc from proof of concept to viable anti-MYC therapy. Sci Transl Med 2019;11(484) doi 10.1126/scitranslmed.aar5012. [DOI] [PMC free article] [PubMed] [Google Scholar]
- 42.Sakakibara-Konishi J, Ikezawa Y, Oizumi S, Kikuchi J, Kikuchi E, Mizugaki H, et al. Combined antitumor effect of gamma-secretase inhibitor and ABT-737 in Notch-expressing non-small cell lung cancer. Int J Clin Oncol 2017;22(2):257–68 doi 10.1007/s10147-016-1060-3. [DOI] [PubMed] [Google Scholar]
- 43.Li M, Chen F, Clifton N, Sullivan DM, Dalton WS, Gabrilovich DI, et al. Combined inhibition of Notch signaling and Bcl-2/Bcl-xL results in synergistic antimyeloma effect. Mol Cancer Ther 2010;9(12):3200–9 doi 10.1158/1535-7163.MCT-10-0372. [DOI] [PMC free article] [PubMed] [Google Scholar]
- 44.Wang Z, Li Y, Ahmad A, Azmi AS, Banerjee S, Kong D, et al. Targeting Notch signaling pathway to overcome drug resistance for cancer therapy. Biochimica et biophysica acta 2010;1806(2):258–67 doi 10.1016/j.bbcan.2010.06.001. [DOI] [PMC free article] [PubMed] [Google Scholar]
- 45.Seveno C, Loussouarn D, Brechet S, Campone M, Juin P, Barille-Nion S. gamma-Secretase inhibition promotes cell death, Noxa upregulation, and sensitization to BH3 mimetic ABT-737 in human breast cancer cells. Breast Cancer Res 2012;14(3):R96 doi 10.1186/bcr3214. [DOI] [PMC free article] [PubMed] [Google Scholar]
- 46.Carroll DK, Carroll JS, Leong CO, Cheng F, Brown M, Mills AA, et al. p63 regulates an adhesion programme and cell survival in epithelial cells. Nat Cell Biol 2006;8(6):551–61 doi 10.1038/ncb1420. [DOI] [PubMed] [Google Scholar]
- 47.Dang TT, Esparza MA, Maine EA, Westcott JM, Pearson GW. DeltaNp63alpha Promotes Breast Cancer Cell Motility through the Selective Activation of Components of the Epithelial-to-Mesenchymal Transition Program. Cancer Res 2015;75(18):3925–35 doi 10.1158/0008-5472.CAN-14-3363. [DOI] [PMC free article] [PubMed] [Google Scholar]
- 48.Liu M, Yao B, Gui T, Guo C, Wu X, Li J, et al. PRMT5-dependent transcriptional repression of c-Myc target genes promotes gastric cancer progression. Theranostics 2020;10(10):4437–52 doi 10.7150/thno.42047. [DOI] [PMC free article] [PubMed] [Google Scholar]
- 49.Gay CM, Balaji K, Byers LA. Giving AXL the axe: targeting AXL in human malignancy. Br J Cancer 2017;116(4):415–23 doi 10.1038/bjc.2016.428. [DOI] [PMC free article] [PubMed] [Google Scholar]
- 50.Hara T, Kimura A, Miyazaki T, Tanaka H, Morimoto M, Nakai K, et al. Cabozantinib inhibits AXL- and MET-dependent cancer cell migration induced by growth-arrest-specific 6 and hepatocyte growth factor. Biochem Biophys Rep 2020;21:100726 doi 10.1016/j.bbrep.2020.100726. [DOI] [PMC free article] [PubMed] [Google Scholar]
- 51.Jia L, Yang X, Tian W, Guo S, Huang W, Zhao W. Increased Expression of c-Met is Associated with Chemotherapy-Resistant Breast Cancer and Poor Clinical Outcome. Med Sci Monit 2018;24:8239–49 doi 10.12659/MSM.913514. [DOI] [PMC free article] [PubMed] [Google Scholar]
- 52.Taniguchi H, Yamada T, Wang R, Tanimura K, Adachi Y, Nishiyama A, et al. AXL confers intrinsic resistance to osimertinib and advances the emergence of tolerant cells. Nat Commun 2019;10(1):259 doi 10.1038/s41467-018-08074-0. [DOI] [PMC free article] [PubMed] [Google Scholar]
- 53.Giles KM, Kalinowski FC, Candy PA, Epis MR, Zhang PM, Redfern AD, et al. Axl mediates acquired resistance of head and neck cancer cells to the epidermal growth factor receptor inhibitor erlotinib. Mol Cancer Ther 2013;12(11):2541–58 doi 10.1158/1535-7163.MCT-13-0170. [DOI] [PubMed] [Google Scholar]
- 54.Zhang Z, Lee JC, Lin L, Olivas V, Au V, LaFramboise T, et al. Activation of the AXL kinase causes resistance to EGFR-targeted therapy in lung cancer. Nat Genet 2012;44(8):852–60 doi 10.1038/ng.2330. [DOI] [PMC free article] [PubMed] [Google Scholar]
- 55.Reckamp KL, Frankel PH, Ruel N, Mack PC, Gitlitz BJ, Li T, et al. Phase II Trial of Cabozantinib Plus Erlotinib in Patients With Advanced Epidermal Growth Factor Receptor (EGFR)-Mutant Non-small Cell Lung Cancer With Progressive Disease on Epidermal Growth Factor Receptor Tyrosine Kinase Inhibitor Therapy: A California Cancer Consortium Phase II Trial (NCI 9303). Front Oncol 2019;9:132 doi 10.3389/fonc.2019.00132. [DOI] [PMC free article] [PubMed] [Google Scholar]
- 56.Campbell RM, Anderson BD, Brooks NA, Brooks HB, Chan EM, De Dios A, et al. Characterization of LY2228820 dimesylate, a potent and selective inhibitor of p38 MAPK with antitumor activity. Mol Cancer Ther 2014;13(2):364–74 doi 10.1158/1535-7163.MCT-13-0513. [DOI] [PubMed] [Google Scholar]
- 57.Sunaga N, Miura Y, Tsukagoshi Y, Kasahara N, Masuda T, Sakurai R, et al. Dual inhibition of MEK and p38 impairs tumor growth in KRAS-mutated non-small cell lung cancer. Oncol Lett 2019;17(3):3569–75 doi 10.3892/ol.2019.10009. [DOI] [PMC free article] [PubMed] [Google Scholar]
Associated Data
This section collects any data citations, data availability statements, or supplementary materials included in this article.
Supplementary Materials
Data Availability Statement
Detailed patient clinical characteristics, IHC calls, subtype classifications, gene expression data, and clustering code are deposited at in Mendeley Data (doi:10.17632/6sbv7bpj5n.1).