

Abstract
Malignant peripheral nerve sheath tumors often arise in patients with neurofibromatosis type 1 and are among the most treatment-refractory types of sarcoma. Overall survival in patients with relapsed disease remains poor, and thus novel therapeutic approaches are needed. NF1 is essential for negative regulation of RAS activity and is altered in about 90% of MPNST. A complex interplay of upstream signaling and parallel RAS-driven pathways characterizes NF1-driven tumorigenesis, and inhibiting more than one RAS effector pathway is therefore necessary. To devise potential combination therapeutic strategies, we identified actionable alterations in signaling that underlie adaptive and acquired resistance to MEK inhibitor (MEKi). Using a series of proteomic, biochemical, and genetic approaches in an in vitro model of MEKi resistance provided a rationale for combination therapies. HGF/MET signaling was elevated in the MEKi-resistant model. HGF overexpression conferred resistance to MEKi in parental cells. Depletion of HGF or MET restored sensitivity of MEKi-resistant cells to MEKi. Finally, a combination of MEK and MET inhibition demonstrated activity in models of MPNST and may therefore be effective in patients with MPNST harboring genetic alterations in NF1.
Keywords: MPNST, MEK, adaptive resistance, acquired resistance, RTK
Introduction
Malignant peripheral nerve sheath tumors (MPNST) arise in patients with neurofibromatosis type 1 (NF-1), although in adults, sporadic MPNST also occur, and these tumors are among the most treatment-refractory types of sarcoma. Overall survival in patients with relapsed and metastatic disease remains poor, with no successes from past clinical trials to date. Novel therapeutic approaches are needed, and efforts have focused on the potential for targeted small molecules against the molecular vulnerabilities that characterize these tumors. Genomic characterization of MPNST cohorts reveals recurrent alterations in NF1, CDKN2A, TP53, EED and SUZ12, the latter two elements of the polycomb repressive complex 2 (PRC2) (1–7). Other genomic amplifications have been described and include HGF, MET, EGFR, PDGFRα, PDGFRβ, KIT, IGF1R and others (8–11). Loss of NF1 disrupts the essential negative regulation of RAS activity and is altered nearly uniformly in MPNST, leading to the expected dysregulation and therefore hyperactivation of RAS and its effector pathways. While RAF-MEK-ERK signaling is among the most well-studied of the RAS effector pathways, no doubt others are also dysregulated and contribute to tumorigenesis. MEK inhibition has been tested in both pre-clinical models of MPNST and its precursor counterpart, plexiform neurofibroma (pNF), with promising activity (12, 13). Clinical trials of MEK inhibitors in patients with pNF have led to responses in the majority of patients, and selumetinib is now the first of these to gain FDA approval for this indication (14, 15). In MPNST, however, MEK inhibition alone will not be sufficient for anti-tumor control. The activation of upstream receptor tyrosine kinases (RTK), either at baseline, or as a consequence of network adaptation, or parallel RAS-driven pathways, characterizes NF1-driven malignancy, and inhibiting more than one RAS effector pathway will be necessary for improved patient outcomes.
Measurements of signaling adaptation that occurs in the short-term in response to MEK inhibition gives clues not only to which pathways and effectors are present in the native state and contributing to the tumor phenotype, but also to how tumor cells will acquire resistance. These findings can suggest targets for upfront combinations that hold promise to prevent and/or delay the acquired resistance that will undoubtedly occur and limit the utility of these agents. In other cancer types, the adaptive changes to short-term inhibition of RAF and/or MEK include upregulation of RTK, increase in RAS activity, and activation of parallel signaling, often through release of the physiologic negative feedback that is present when ERK is active (16–18). Knowledge of the dominant RTKs that limit the responsiveness to RAF and/or MEK inhibition, allows for the design of rational combination therapy, such as the use of EGFR antibodies together with RAF/MEK inhibitors in colorectal carcinoma (19). In early studies of resistance mechanisms to ERK signaling inhibition, BRAF V600E-mutant melanoma cells acquire resistance to RAF inhibitor via PDGFRβ upregulation (20). Stromal HGF expression in patients with BRAF-mutant melanoma significantly correlates with poor response to RAF inhibitor therapy (21). HGF/MET upregulation confers resistance to RAF inhibitor in BRAF-mutant melanoma, colorectal and glioblastoma cell lines, as well as in murine anaplastic thyroid cancer models (21–23). In the absence of a singular molecular marker of adaptive resistance, however, the design of such combination trials represents a greater challenge. Here, we speculate that PDGFRβ and MET are candidate RTK which may modulate adaptive and acquired resistance to MEK inhibition in MPNST. It remains unclear, to date, whether MPNST cells depend on the HGF/MET axis and would be, as a tumor class, susceptible to its inhibition, genetically or pharmacologically (24–26).
Relatively few cell line models exist for the study of NF1-MPNST, and the characterization of these lines has been partial in most reported studies (27). To add to these, our lab has generated a series of novel NF1-MPNST patient-derived xenografts (PDX) and cell lines, and made these available to the NF1 research community (28). By testing a broad panel of models of this very genomically heterogeneous tumor type (29), we can attempt to capture the heterogeneity in signaling that occurs in response to single agent treatment. We therefore characterized a panel of ten cell lines, in their native state, and following short-term and long-term MEK inhibition, to identify key molecules which modulate adaptive and acquired resistance, and then tested the most promising combinations suggested by these results. We identified a broad variety of RTK that characterize the adaptive response to MEK inhibition in MPNST. One strategy to overcome the pan-RTK upregulation is to target a convergence point vulnerability of RTK/RAS activity – a small molecule inhibitor of the SHP2 phosphatase together with a MEK inhibitor, indeed produces synergistic inhibition of NF1-MPNST models in vitro and in vivo (30). SHP2 inhibitors are currently only available through select clinical trials, however, and their tolerability and toxicity in humans, alone or in combination with MEK inhibitors, are not yet reported. We therefore tested two alternate strategies, including inhibitors of PI3K/mTOR as well as MET tyrosine kinase inhibitors, and found that combined MEK/MET inhibition is a viable therapeutic combination strategy in NF1-MPNST.
Materials and Methods
For additional details on in vitro studies, refer to Supplementary Methods.
Cell lines, antibodies and reagents.
A375, RD, SMS-CTR, A549, HEK293T, and Phoenix-AMPHO cells were obtained from the American Type Culture Collection (ATCC, Manassas, VA). SK-MEL-103 was obtained from Dr. David Solit at Memorial Sloan Kettering Cancer Center (MSKCC, New York, NY). STS26T, ST8814 and NF90.8 were kindly provided by Dr. Gregory Riggins at Johns Hopkins University (JHU, Baltimore, MD). NF94.3, NF96.2, NF10.1 and NF11.1 were kindly provided by Dr. Margaret Wallace at University of Florida (UF, Gainesville, FL). Three patient-derived NF1-MPNST cell lines JH-2–002, JH-2–009 and JH-2–031 were generated in our laboratory from biospecimens collected during surgical resection from patients with NF1-MPNST (28). Material was collected under an institutional review board (IRB)-approved protocol (JHU IRB #J1649), and all patients provided written informed consent. All cell lines used in our study were verified by short tandem repeat (STR) profiling for cell line authentication at Johns Hopkins University Core Facility, tested negative for mycoplasma contamination, and passaged in vitro for fewer than three months after resuscitation. The STR profiles are available upon written request to the corresponding author.
Antibody against NF1 (#A300–140A) was from Bethyl Laboratories. Antibodies against p16 and DUSP6 were from Abcam. Antibody against HGF was from R&D Systems. Antibodies against NRAS, HRAS and cyclin D1 were from Santa Cruz Biotechnology. Antibody against KRAS was from Millipore. Antibodies against other proteins and phospho-proteins were obtained from Cell Signaling.
Trametinib, GSK2126458, SCH772984, BMS777607, INC280, imatinib, crizotinib, pazopanib, sunitinib, AZD2932, GW441756 and BLU-554 for in vitro study were purchased from SelleckChem. LOXO-101 and LY2874455 were purchased from MedChemExpress. AZD2014 was kindly provided by Dr. Vijaya Ramesh at Massachusetts General Hospital (Boston, MA). Recombinant human HGF (rhHGF, #PHG0324) and PDGF (#PHG0045) were purchased from Thermo Fisher Scientific. Doxycycline was from Sigma Aldrich; puromycin and hygromycin stock solution were purchased from Invitrogen. Drugs for in vitro studies were dissolved in DMSO to yield 10 mM or 1 mM stock solutions, and stored at −20°C.
Generation of drug-resistant cell lines.
Cell lines resistant to trametinib were generated by exposing the parental NF1-MPNST cell lines ST8814 and NF90.8 to 20nM of trametinib for five months of continuous drug exposure (with change of medium twice per week).
Targeted gene sequencing and copy-number variation (CNV) analysis.
Targeted gene sequencing was performed on six MPNST cell lines (ST8814 parental and resistant, NF90.8 parental and resistant, NF94.3 and NF96.2) using a clinical oncology panel covering 637 genes important in oncogenesis, including copy-number variation (CNV) analysis, by the Molecular Diagnostics Laboratory at Johns Hopkins, as previously described (31, 32).
Lentivirus-based inducible shRNA-mediated knock-down cells.
shRNAs targeting GFP (33), HGF (h9) or MET (m7) (34) and PDGFR β (20) were sub-cloned into Tet-pLKO-puro vector. The lentiviruses encoding GFP, HGF or MET and PDGFR β shRNA were packaged in HEK293T cells. The target cells were infected overnight by filtered viral supernatant in the presence of 8 μg/ml of polybrene (#TR-1003-G, Millipore). The infected cells were selected with puromycin (2 μg/ml) for one week before the analysis of the knockdown effects. The shRNA oligos targeting GFP, HGF or MET and PDGFR β are listed in the Supplementary Information.
Immunoblotting.
Cells were disrupted on ice in NP40 lysis buffer as previously described (35). Protein concentration was determined with Pierce BCA protein assay kit (#23227, Thermo Fisher Scientific). Equal amounts of protein were separated by SDS-PAGE, transferred to nitrocellulose membranes, immunoblotted with specific primary and secondary antibodies, and detected by chemiluminescence with the ECL detection reagents, Immobilon western chemiluminescent HRP substrate (#WBKLS0500, Millipore) or Pierce ECL western blotting substrate (#32106, Thermo Fisher Scientific). The membranes were imaged on the ChemiDoc touch imaging system (Bio-Rad) and relative changes in p-ERK levels were quantitated by densitometry analysis using Image J as a function of concentration or treatment time. Response curves were generated using Graph Pad Prism 8.
Soft agar assay.
Soft agar assay was performed as previously described (36). Briefly, 50,000 cells growing in log phase were mixed with agar (0.33%), treated with either DMSO or trametinib in the presence of doxycycline, and plated over a bottom layer of 0.5% agar in 6-well plates. Cells were incubated at 37°C for four weeks, with 100 μl of media containing doxycycline pipetted over the surface every 48 hr. Colonies were then stained with crystal violet (Sigma-Aldrich) for 1 hr and five random fields per chamber were acquired using NikonTM Eclipse Ti inverted microscope (Nikon). Measurements were based on duplicates for each condition.
In vivo mouse xenograft.
NOD scid gamma (NSG, #005557) female mice were purchased from the Jackson Laboratory. All mouse experiments were approved by the Institutional Animal Care and Use Committee at Johns Hopkins under protocol #MO19M115. Minced tumor fragments from donor mice were implanted subcutaneously close to the sciatic nerves of 6 to 8-week-old NSG female mice. Drug treatment was started when tumor size reached roughly 150 mm3 for PDX JH-2–009 and 130 mm3 for NF11.1. Eight to ten mice were randomized into each treatment group by an algorithm that achieves the best-case distribution to assure that each treatment group has similar mean tumor burden and standard deviation. Vehicle, trametinib (0.3 mg/kg, Chemietek; dissolved in 5% DMSO and 0.5% hydroxypropyl methyl cellulose and 0.2% Tween 80), INC280 (capmatinib, 25mg/kg, MedChemExpress; dissolved in 5% DMSO and 0.5% methyl cellulose and 0.1% Tween 80), or the combination were administrated by oral gavage once daily, based on mean group body weight, with a treatment schedule of 5 days on/2 days off. The endpoint of the experiment for efficacy studies was adjusted according to the intrinsic tumor growth rates or the longest tumor diameter of 2-cm as per the JH-ACUC approved protocol, whichever occurred first. Tumors were measured twice weekly by calipering in two dimensions, and tumor volume was calculated by: L × W2(π/6), where L is the longest diameter and W is the width. Fold-change tumor growth was calculated relative to day 0 with the formula: fold change in tumor growth = (tumor volume on day X/tumor volume on day 0) −1. No data or animals were excluded from the analysis.
Results
Genomic and biochemical characterization of a panel of MPNST cell lines including sensitivity to MEK inhibition
Given the diverse tumor and genomic heterogeneity that characterizes NF1-deficient malignant peripheral nerve sheath tumors (29), we set out to determine the signaling characteristics and response to targeted ERK pathway inhibition in a large panel of cell lines, including one sporadic MPNST cell line (STS26T with BRAF V600E and PTEN loss, Supplementary Table 1), six NF1-MPNST cell lines, and three novel NF1-MPNST cell lines developed in our laboratory (28). Only STS26T has wild type (WT) NF1, while the others harbor a range of single nucleotide variants (SNV), frameshift mutations, splice abnormalities, partial and whole gene deletions, and copy number loss (loss of heterozygosity), resulting in loss of NF1 function in these cells (Figure 1A). Partial and complete loss of full-length NF1 protein was validated by immunoblot in these cells (Figure 1B). The PRC2 complex proteins SUZ12, as well as tumor suppressors PTEN and p16 (encoded by CDKN2A), are variably lost, recapitulating the genomic background previously reported in human MPNST (Supplementary Table 1) (2–4). In addition, these cell lines exhibit a range of expression levels of phospho-signaling proteins and RTK, as demonstrated in Figure 1B. We hypothesized that the fraction of RAS that is GTP-bound in the setting of loss of NF1 function was “high” and therefore measured RAS-GTP in all ten MPNST cell lines using a RAF1-RBD immunoprecipitation assay and probing with antibodies against HRAS, NRAS, KRAS, as well as pan-RAS. We used A375 (melanoma, BRAF V600E) as a control for RAS-GTP “low”; we used RD (rhabdomyosarcoma, NRAS Q61H), SMS-CTR (rhabdomyosarcoma, HRAS Q61K), and A549 (NSCLC, KRAS G12S) as positive controls for GTP-bound NRAS, HRAS, and KRAS, respectively. Other than STS26T (WT NF1) and JH-2–009, we detected modest levels of RAS-GTP, with the most intense detection of GTP-bound RAS seen using the NRAS antibody, when normalized to three known RAS- mutant cell lines, respectively (Figure 1C).
Figure 1. Genomic and biochemical characterization of a panel of MPNST cell lines including sensitivity to MEK inhibition.
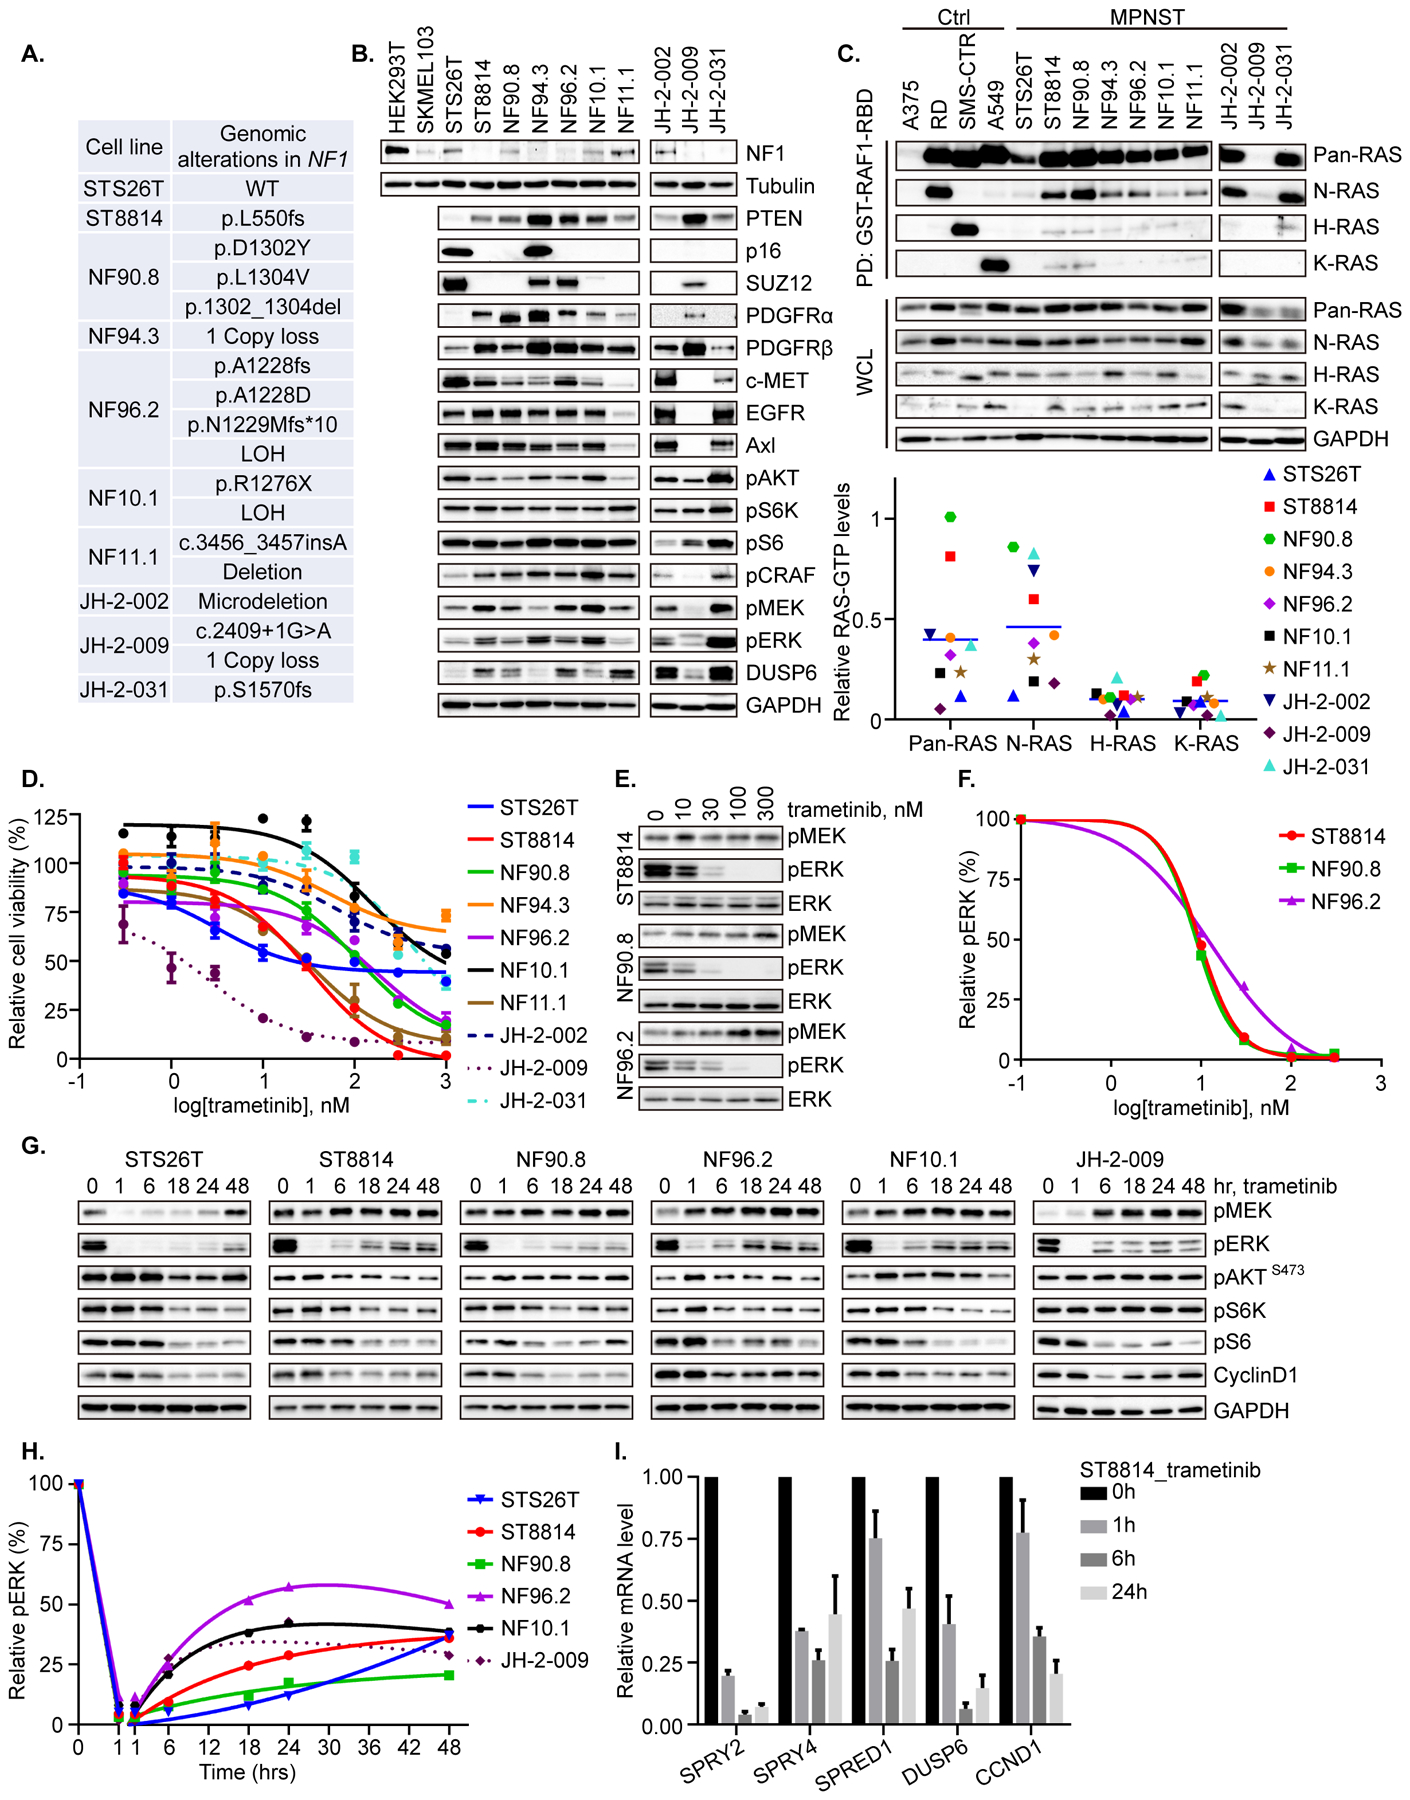
A. Genomic alterations in NF1 were detected by targeted gene sequencing or whole exome sequencing (WES) in ten MPNST cell lines. LOH = Loss of heterozygosity. B. Steady state expression level of the indicated proteins was determined by immunoblot in the ten MPNST cell lines. HEK-293T and SKMEL-103 cells were used as positive and negative controls for NF1 protein expression, respectively. C. An active Ras pull-down assay, using immunoprecipitation with GST-RAF1-RBD, was used to isolate GTP-bound RAS, and isoform-specific activity was determined using antibodies against pan-RAS, NRAS, HRAS and KRAS, as shown. A375 (BRAF V600E melanoma), RD (NRAS Q61H, rhabdomyosarcoma), SMS-CTR (HRAS Q61K, rhabdomyosarcoma), and A549 (KRAS G12S, NSCLC) were used as negative control (A375), and positive controls for NRAS (RD), HRAS (SMS-CTR) and KRAS (A549). The signal intensity of RAS-GTP was quantified using densitometry analysis. N-/H-/K-RAS-GTP levels in MPNST cells were normalized to the levels in N-/H-/K-RAS mutant cells, respectively. Pan-RAS-GTP level in MPNST was normalized to the average level of N-/H-/K-RAS mutant cells. D. Cell viability in response to the MEK inhibitor trametinib was evaluated by high-throughput colorimetric assay and graphed as percent viability relative to untreated cells. E. ST8814, NF90.8 and NF96.2 cells were treated with increasing concentrations of trametinib for 1 hr. phospho-MEK, phospho-ERK and total ERK were detected by immunoblot. F. Phospho-ERK signal intensity in E was quantified using densitometry analysis and graphed as a function of trametinib dose. G. Six MPNST cell lines were treated with trametinib (20 nM) over a time course. The indicated proteins were detected by immunoblot. H. Phospho-ERK signal intensity in G was quantified using densitometry analysis. I. Real-time PCR was used to measure mRNA levels of representative genes in the ERK-dependent transcriptional output profile in response to trametinib (20 nM) in the ST8814 cell line. Results were from the average of three independent biological replicates. Phospho-proteins and total proteins were from separate blots in B, C, E and G.
We then tested the anti-proliferative effects of the MEK inhibitor trametinib across a range of doses against the ten MPNST cell lines, and observed variable inhibition – some cells (ST8814, NF11.1, and JH-2–009, with IC50 < 45 nM) were quite sensitive; some cells (NF90.8 and NF96.2, with IC50 about 100 nM) demonstrated intermediate sensitivity; while others (NF94.3, NF10.1, JH-2–002 and JH-2–031, with IC50 > 300 nM) were only modestly so. Notably, the sporadic line STS26T that harbors BRAF V600E and PTEN loss (Supplementary Table 1), showed sensitivity to about 50% inhibition and then reached to a steady state, suggesting that even in a BRAF mutant line, MEK inhibition alone remains insufficient in MPNST (Figure 1D). We found that phospho-ERK (p-ERK) was effectively inhibited at 1 hr in all cell lines at a dose of 10–30 nM, regardless of sensitivity for proliferation (Figure 1E–F). p-ERK inhibition was not sustained, however, in most cell lines, with rebound in p-ERK detected by 6 hrs in the majority of cell lines, to modest (but not baseline) levels (Figure 1G–H). Phospho-S6 kinase, phospho-S6 and cyclin D1 levels were partially inhibited at 6-hr or later, coinciding with rebound in p-ERK, and suggesting a modest and indirect anti-signaling that perhaps relates to adaptation. Likewise, genes that comprise ERK-dependent transcriptional output in cells with hyperactivated ERK signaling (37) were inhibited over time in response to trametinib (Figure 1I).
Global activation of receptor tyrosine kinases drives adaptive resistance to MEKi in MPNST cells
Given the modest effects of single agent MEK inhibition in our in vitro models of MPNST, and the modest in vivo effects of other MEK inhibitors in MPNST xenografts previously reported (12, 38), we set out to characterize the adaptive signaling changes that occur in MPNST cells following exposure to MEK inhibitor. As predicted by the genomic diversity that occurs in MPNST, the adaptive signaling changes were likewise heterogeneous in the MPNST cell lines. Using a human phospho-RTK antibody array screen, we detected increases in p-PDGFRβ, p-IGF1R, p-EGFR, p-MET, and others in nine MPNST cell lines after exposure to trametinib for 24 hrs (Figure 2A–B and Supplementary Figure 1). The specific RTK which were upregulated by trametinib varied by cell line and were not predicted by their genotype or identifiable baseline characteristics. Further, upregulation of p-PDGFRβ, which was the most common event observed (Figure 2A–B), was accompanied by a compensatory downregulation of PDGFRα phosphorylation (Supplementary Figure 1). These findings were consistent with the global upregulation of multiple RTK detected using the PamChip phospho-peptide array in a subset of these cell lines at 24 hrs of trametinib treatment relative to control (30). Further, total PDGFRβ protein expression was induced by trametinib at 24-hr time point in the nine cell lines tested and this effect was durable in several cell lines, including STS26T, NF94.3 and NF10.1 (Figure 2C).
Figure 2. Global activation of receptor tyrosine kinases drives adaptive resistance to MEKi in MPNST cells.
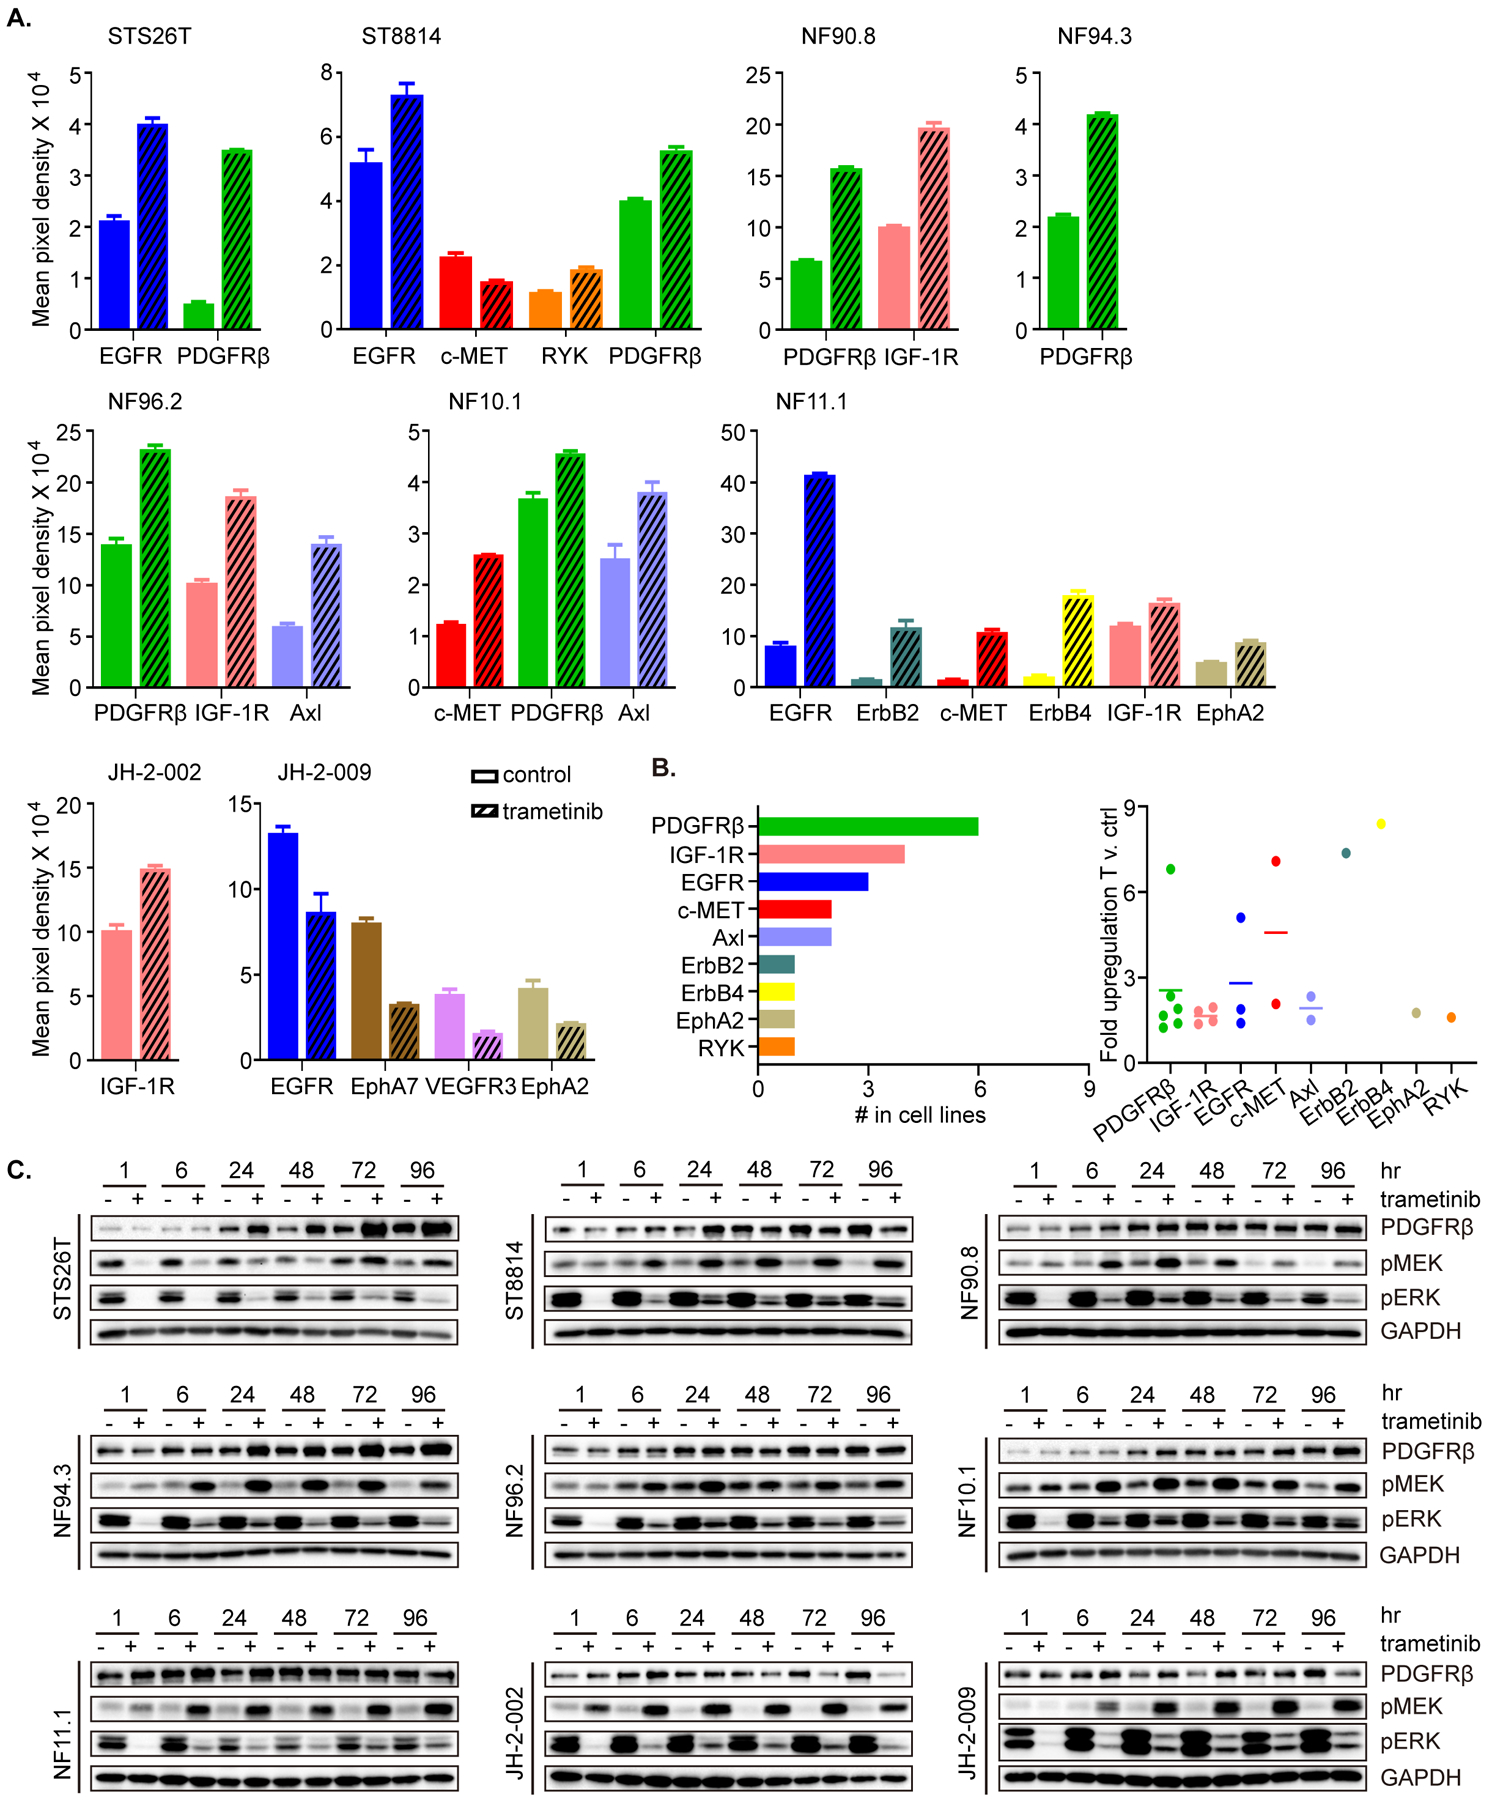
A. Nine MPNST cell lines were treated with DMSO (control) or trametinib (20 nM) for 24 hrs. Phospho-RTK levels were determined using a human phospho-RTK array kit. Mean signal intensity for significantly altered RTKs from technical duplicates was quantified using densitometry analysis. Data represent mean ± SEM. B. The frequency with which individual RTKs were significantly upregulated by MEKi (from A) shown as total out those tested (n=9). C. Nine MPNST cell lines were treated with trametinib (20 nM) or DMSO over a time course as shown. Protein levels were determined by immunoblot, as indicated. Phospho-proteins and total proteins were from separate blots.
PDGFRβ signaling and CRAF are upregulated in a MEKi-resistant model
As combination therapy with MEKi plus a multi-targeted tyrosine kinase inhibitor would be enhanced by an ability to predict the relevant RTK, we set out to determine the long-term (acquired) changes in addition to those that occur in the short-term (adaptive). To determine long-term acquired changes in signaling networks associated with resistance to MEKi, we generated cell lines with acquired resistance by continuous exposure of two trametinib-sensitive cell lines (NF90.8 and ST8814) to trametinib for a period of about five months. Following emergence of the resistant cell population, we characterized the cells using phospho-RTK arrays, in vitro measurements of sensitivity to trametinib, and the effects of trametinib on signaling.
Using NF90.8 as a parental (P) cell line and after successful emergence of a resistant population (R), we characterized the parental and resistant cell lines using targeted gene sequencing (TGS), phospho-RTK arrays, and measures of sensitivity to MEKi. NF90.8 (R) cells demonstrated significant upregulation of p-PDGFRβ, p-ALK and p-EphA7, relative to parental cells (Figure 3A and Supplementary Figure 2A). In the parental cells, PDGFRβ and CRAF were induced by MEK inhibition, but in the resistant cells, these remained higher than in parental when trametinib was withheld from the culture, and did not become re-induced upon short-term (overnight) exposure to trametinib. In addition, p-KIT and total KIT levels were higher in the resistant cells compared to parental. p-CRAF, p-MEK and p-AKT were induced by trametinib in both lines, but p-CRAF and p-MEK were markedly higher in resistant cells relative to parental, under the drug-free seeding condition (T −) (Figure 3B). mRNA levels of PDGFRβ and KIT correlated with protein levels (Figure 3C). Moreover, RAS-GTP was not markedly different between parental and resistant cells, compared to each corresponding condition (T − or T +) (Supplementary Figure 2B), in line with a previous observation that PDGFRβ-upregulated, PLX4032-resistant BRAF V600E melanoma cells retained unchanged low level of RAS-GTP (20), indicative of rebound in compensatory pathways. Further analysis of the TGS data revealed amplification in RAF1 and an equivocal copy number gain in PIK3CA, which were further investigated by detection of protein expression. CRAF/RAF1 demonstrated enhanced protein expression, while increased protein level of p110α (encoded by PIK3CA) was not detected when comparing resistant versus parental cells (Supplementary Table 2 and Supplementary Figure 2C). Measuring cell proliferation using high-throughput 96-well plate assays, we detected at least a one-log fold difference in IC50 to trametinib, comparing NF90.8 (P) to NF90.8 (R) (Figure 3D). Using cells which were seeded under their regular growth conditions overnight followed by drug-free medium for 2 hrs, we then detected the effects of a single dose of trametinib on signaling, and found reduced ability of the drug to inhibit p-ERK, with the changes in the other phosphorylated and total proteins consistently up in resistant compared to control (Figure 3E). A 3- to 10- fold higher dose of trametinib was required for similar p-ERK inhibition in resistant cells compared to parental, and this effect was more pronounced when resistant cells were held continuously in trametinib (Figure 3F, dose, and 3G, over time). Further, we observed a rapid induction of p-AKT and p-S6K under the drug-free seeding condition (T −), and less inhibition or more rapid rebound of p-S6 and cyclin D1 by trametinib in resistant cells (Figure 3G). To confirm whether PDGFRβ signaling can induce downstream RAS effector pathway, we next treated NF90.8 parental cells with vehicle or 100 ng/ml PDGF together with increasing dose of trametinib, and we observed a strong activation of ERK and AKT signaling by exogenous PDGF addition (Figure 3H). We functionally knocked down PDGFRβ expression in NF90.8(R) cells using three individual shRNA constructs (20) (Figure 3I and Supplementary Table 3), and found significant cell growth inhibition in the resistant cells when PDGFRβ was maximally reduced by shPDGFRβ #4 (Figure 3J), suggesting that the cells had acquired dependence on the PDGF/ PDGFR axis for their continued growth.
Figure 3. PDGFRβ signaling and CRAF are upregulated in a MEKi-resistant model.
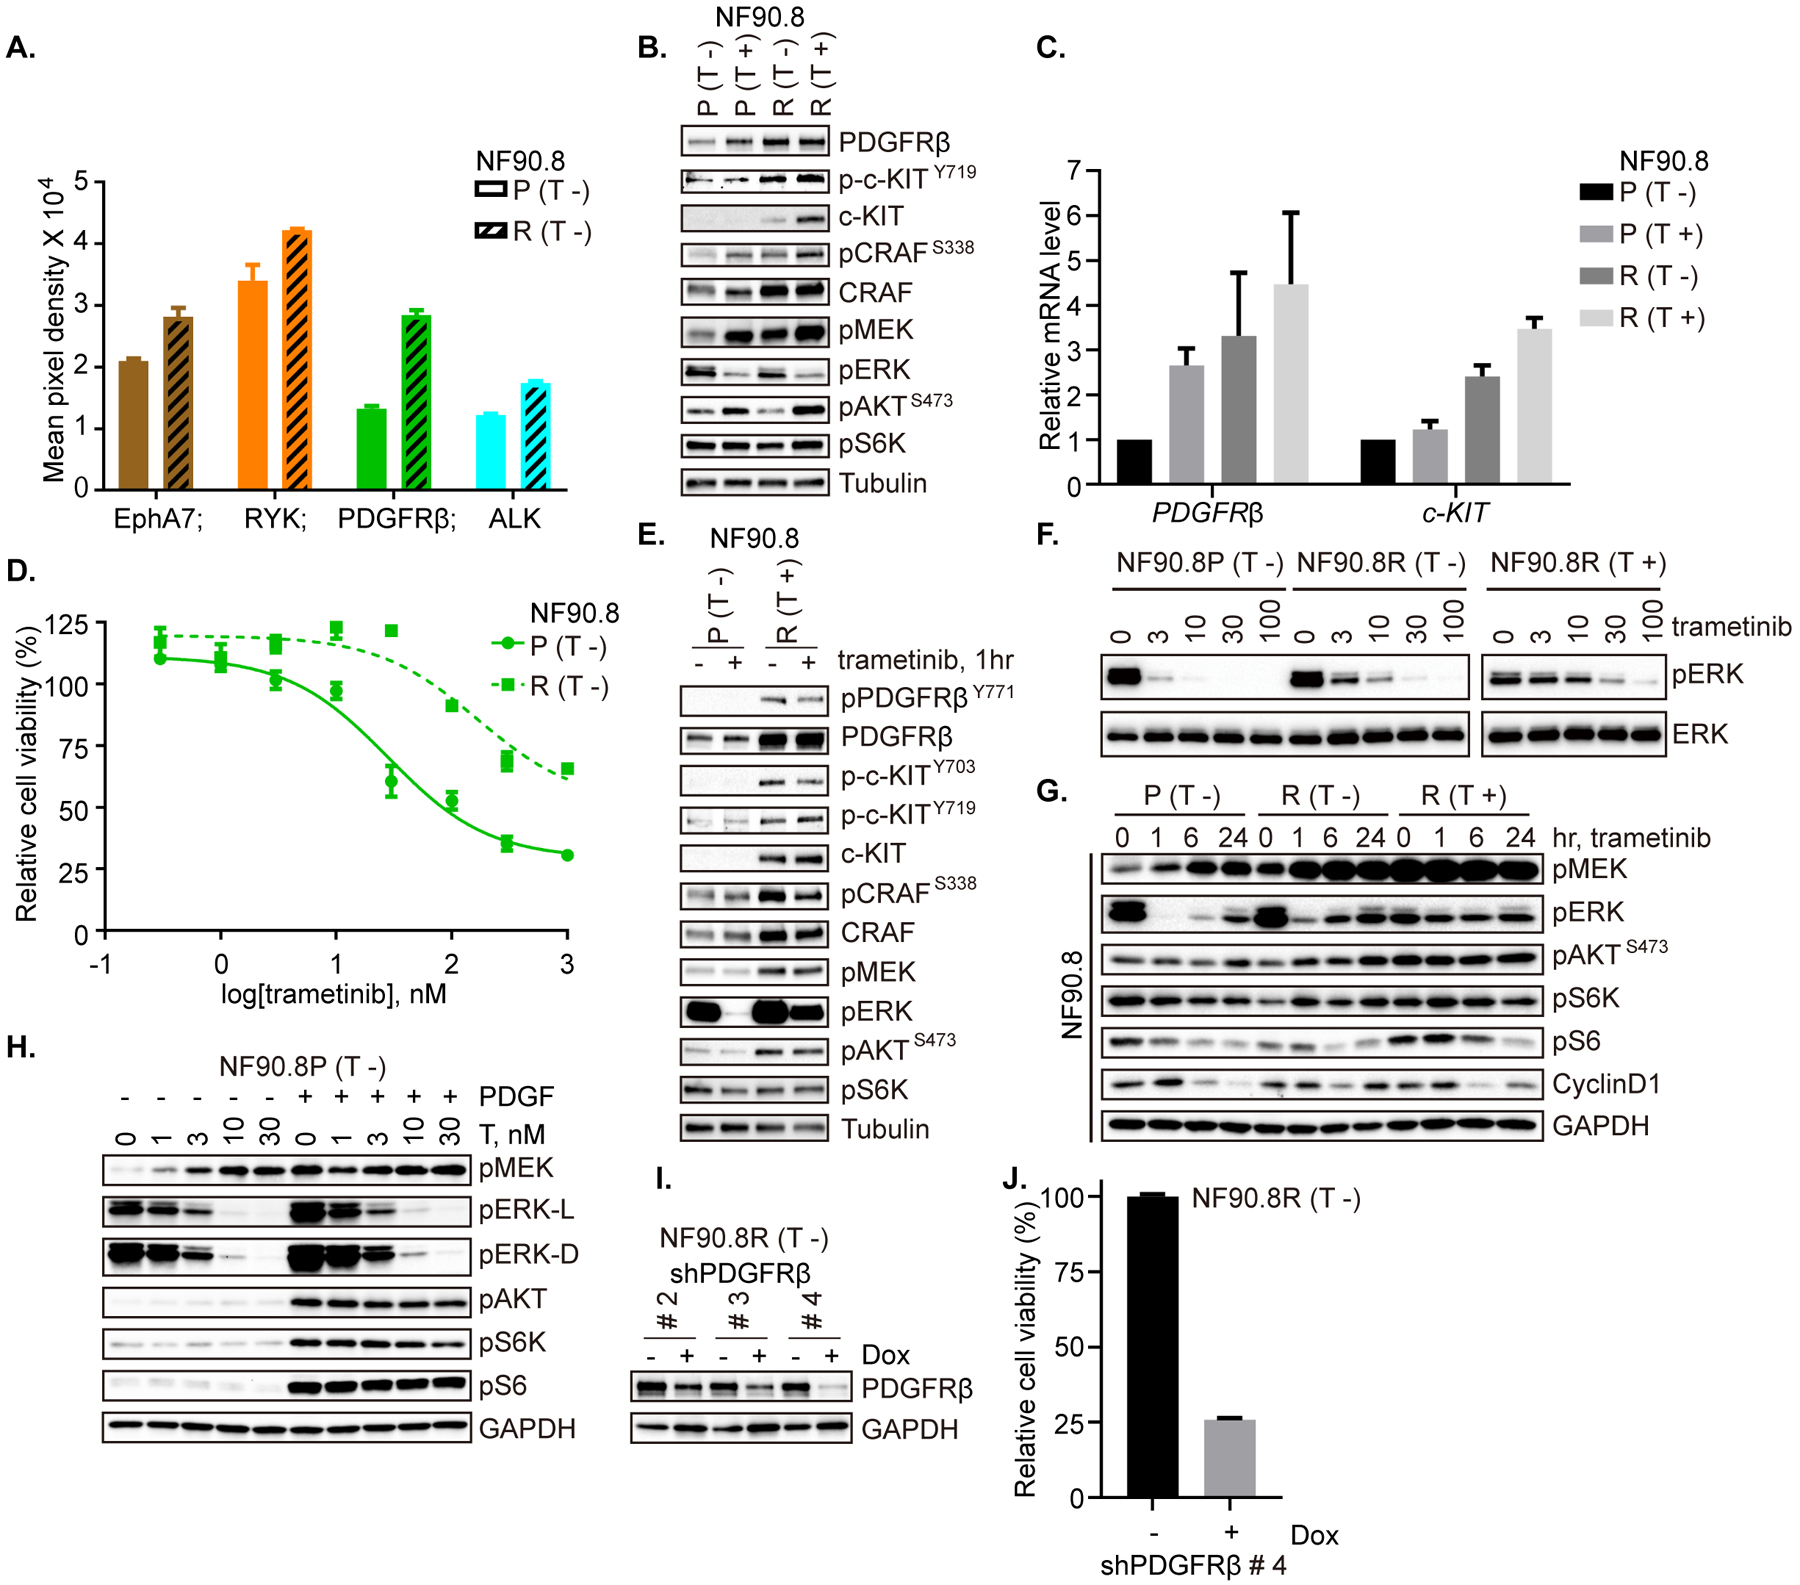
A. Phospho-RTK expression in NF90.8 parental (P) and resistant (R) cells was detected using a human phospho-RTK array kit. Mean signal intensity from technical duplicates was quantified using densitometry analysis and significantly altered RTKs are shown. B. NF90.8 parental (P) and resistant (R) cells were cultured overnight in medium without or with trametinib (20 nM). Expression and activity of RTKs and signaling intermediates in ERK and PI3K/AKT pathways were determined by immunoblot, as indicated. C. mRNA expression levels of PDGFRβ and c-Kit were determined by real-time PCR in cells cultured overnight with or without trametinib, as in B. Results were from the average of three independent biological replicates. D. NF90.8 parental (P) and resistant (R) cells were exposed to increasing concentrations of trametinib for 72 hrs and cell viability was evaluated using the CCK-8 assay, plotted relative to untreated controls. E. NF90.8 parental (P) and resistant (R) cells were plated overnight under regular growth conditions (parental without trametinib; resistant with trametinib). The following day, medium was replaced with drug-free regular growth medium for 2 hrs and then treated with DMSO or trametinib (20 nM) for 1 hr. F. NF90.8 parental (P) and resistant (R) cells (plated either without or with trametinib) were exposed to increasing concentrations of trametinib for 1 hr. G. NF90.8 parental (P) or resistant (R) cells were treated with trametinib (20 nM) over a time course, as shown. H. NF90.8 parental cells were treated with vehicle or 100 ng/ml PDGF together with increasing dose of trametinib for 1 hr. I. NF90.8 resistant cells transduced with doxycycline-inducible shPDGFRβ #2, #3 and #4 respectively, were treated with vehicle or 1000 ng/ml doxycycline for 72 hrs. Total PDGFRβ expression was assessed by immunoblot. J. NF90.8 resistant cells transduced with shPDGFRβ #4 were pretreated as in I and then 3,000 cells/well were seeded into 96-well plates. Relative cell viability was evaluated using CCK-8 assay on day 3. (T −) = seeding cells without trametinib; (T +) = seeding cells with trametinib. Phospho-proteins and total proteins were from separate blots in B, E, F, G, H and I.
HGF/MET signaling is elevated in a MEKi-resistant model
Using ST8814 as a second parental (P) cell line, and after successful emergence of a resistant population (R), we likewise characterized the parental and resistant cell lines using TGS, phospho-RTK arrays, and measures of sensitivity to MEKi. ST8814(R) cells demonstrated significant up-regulation of p-MET, p-PDGFRα, and p-VEGFR1 in response to trametinib (Figure 4A and Supplementary Figure 3A). Given that the increase in p-MET was the most striking of these, we explored the role of the HGF/MET axis in both parental and resistant ST8814 cells. We detected increased levels of HGF and p-MET in resistant cells, and this effect was dynamic in response to withholding MEKi from overnight culture (Figure 4B). Real-time PCR detection of HGF mRNA confirmed that protein changes were consistent with changes at the transcription level (Figure 4C). RAS-GTP levels did not demonstrate significant change, when comparing parental and resistant cells under respective seeding conditions (Supplementary Figure 3B). By TGS, we identified amplification of NTRK1 and FGFR4, which were also confirmed by protein expression (Supplementary Table 2 and Supplementary Figure 3C). Again, measuring cell proliferation, we detected about a one-log fold difference in IC50 to trametinib, comparing ST8814 (P) to ST8814 (R) (Figure 4D, E). Using cells which were seeded under regular growth conditions overnight followed by drug-free medium for 2 hrs, we then detected the effects of a single dose of trametinib on signaling, and found reduced ability of the drug to inhibit p-ERK, and enhanced MET, ERK and PI3K/AKT signaling and cyclin D1 expression in resistant cells. Notably, HGF was unchanged with replacement of medium 2 hrs before 1-hr of trametinib treatment (Figure 4F). A 3- to 10- fold higher dose of trametinib was required for similar p-ERK and p-RSK inhibition in resistant cells compared to parental, and this effect was more pronounced when resistant cells were held continuously in trametinib (Figure 4G, dose, and 4H, over time). However, the ERK inhibitor SCH772984 was similarly effective at inhibiting p-ERK and p-RSK in parental and resistant cells, relative to trametinib (Figure 4G). Consistently, ERK and AKT signaling were increased, and p-S6 and cyclin D1 were less inhibited by trametinib in resistant cells (Figure 4H). Washout of trametinib following exposure to MEKi in these cells also resulted in rebound of HGF and p-MET, concurrent with a quick return (< 2 hrs) of p-ERK and increase in p-AKT, p-S6K and cyclin D1 (Figure 4I).
Figure 4. HGF/MET signaling is elevated in a MEKi-resistant model.
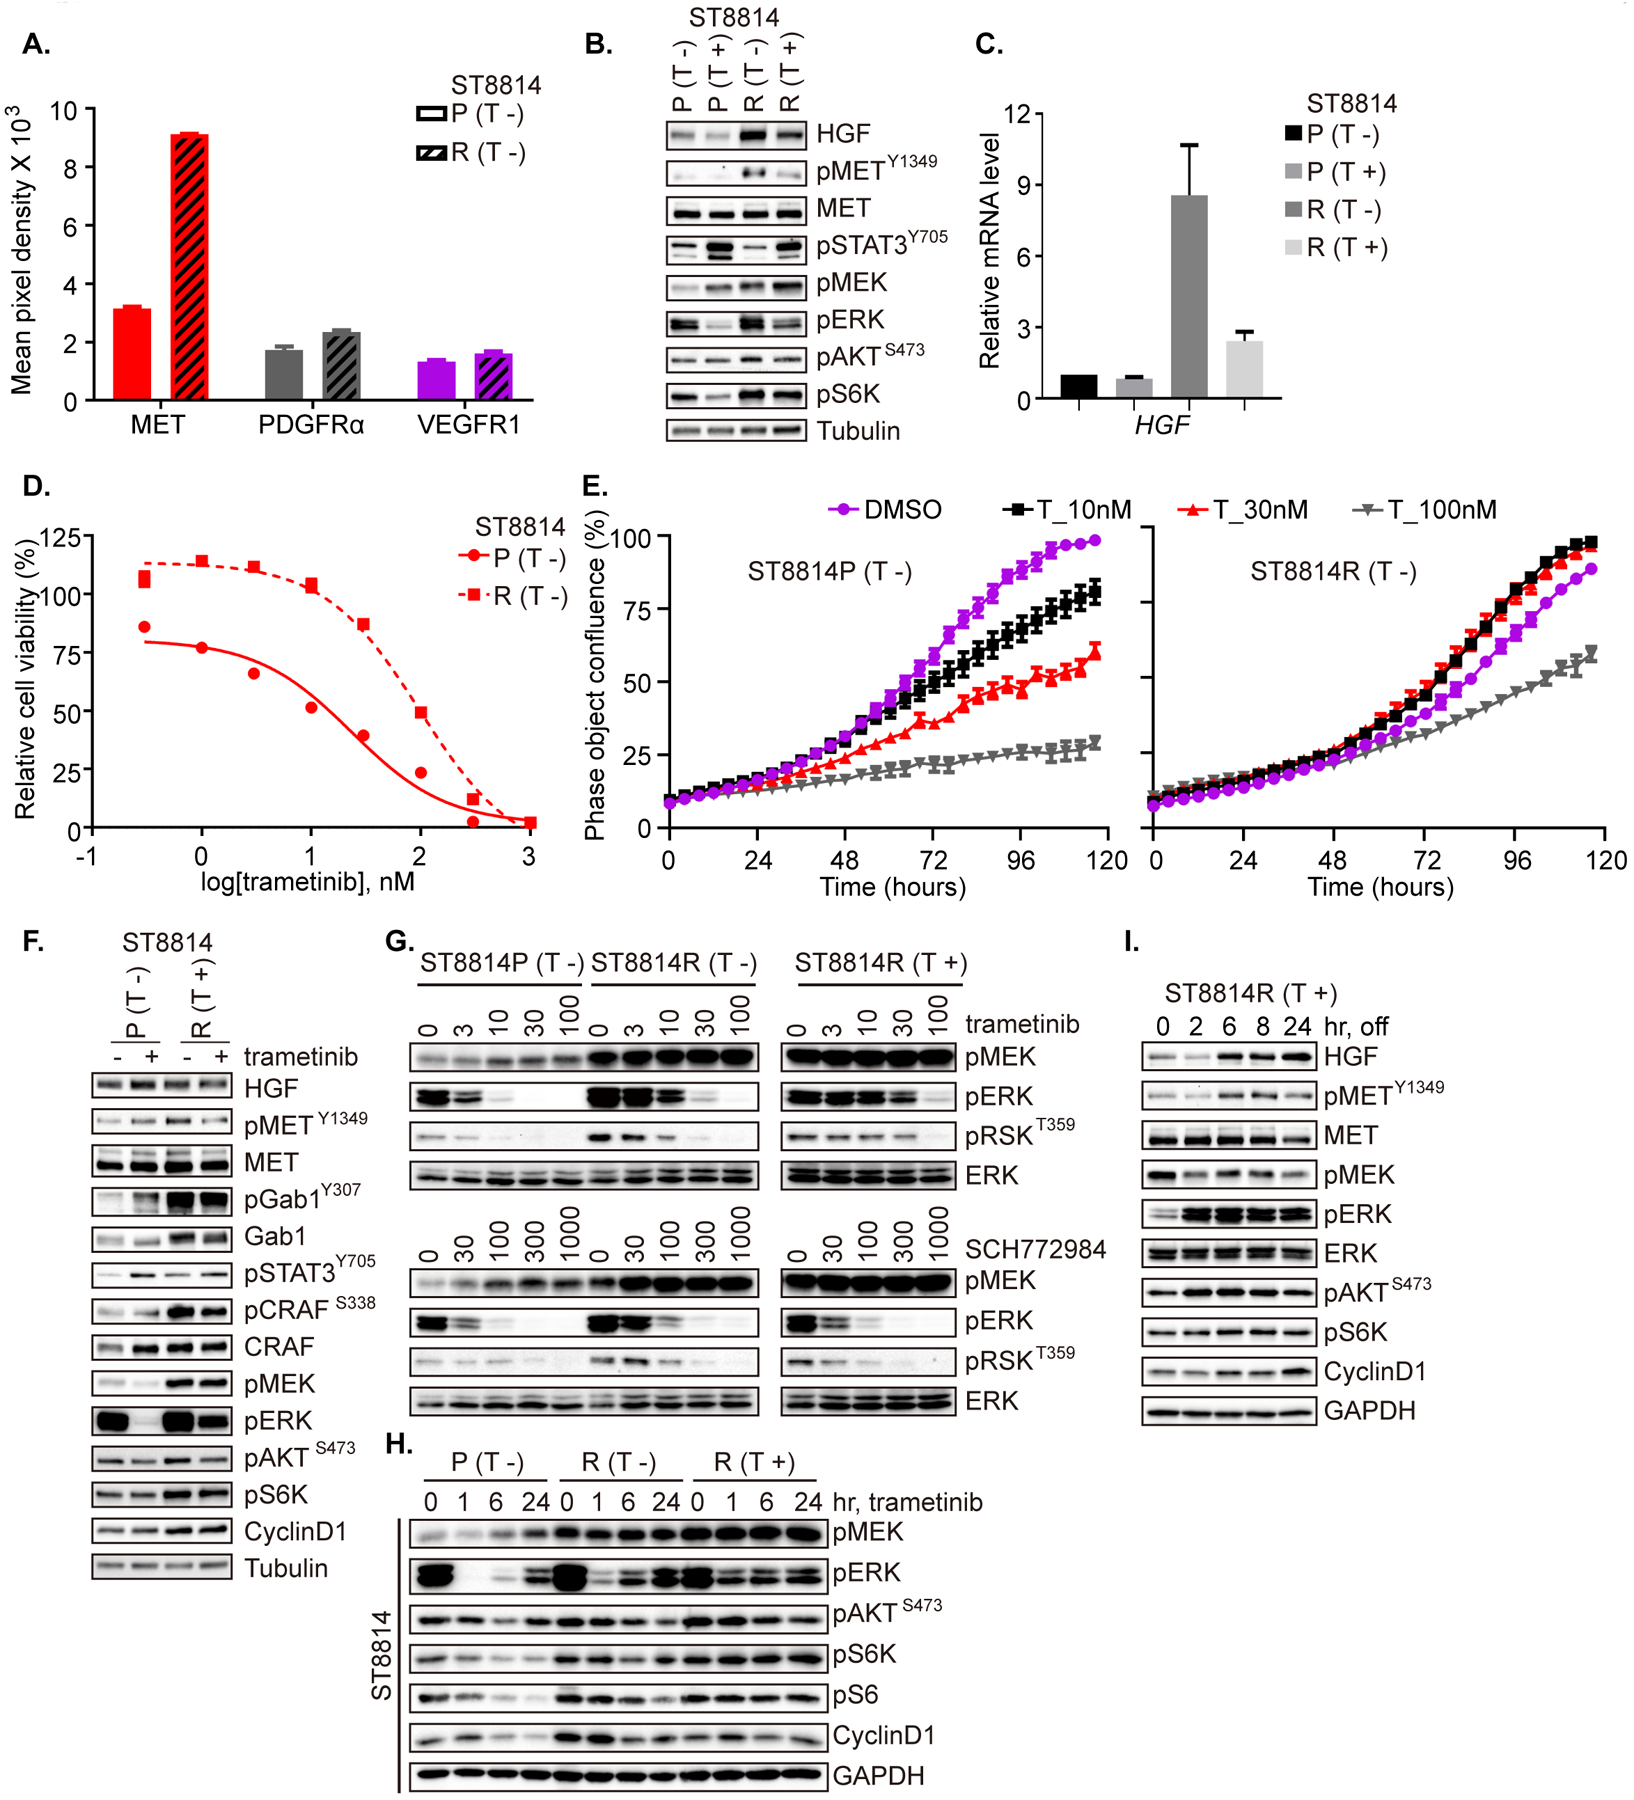
A. Phospho-RTK expression in ST8814 parental (P) and resistant (R) cells was detected using a human phospho-RTK array kit. Mean signal intensity from technical duplicates was quantified using densitometry analysis and significantly altered RTKs are shown. Data represent mean ± SEM. B. ST8814 parental (P) and resistant (R) cells were cultured overnight in medium without or with trametinib (20 nM). C. mRNA expression of HGF was determined by real-time PCR in cells cultured overnight with or without trametinib, as in B. Results were from the average of two independent biological replicates. D. ST8814 parental (P) and resistant (R) cells were exposed to increasing concentrations of trametinib for 72 hrs and cell viability was evaluated using the CCK-8 assay, plotted relative to untreated controls. E. ST8814 parental (P) and resistant (R) cells in 96-well plates were exposed to increasing concentrations of trametinib (T). The phase object confluence (%) is shown as a function of time, determined using the Incucyte imaging system. Representative replicate was shown from two biological repeats. F. ST8814 parental (P) and resistant (R) cells were plated overnight under regular growth conditions (parental without trametinib; resistant with trametinib). The following day, medium was replaced with drug-free regular growth medium for 2 hrs and then treated with DMSO or trametinib (20 nM) for 1 hr. G. ST8814 parental (P) and resistant (R) cells were exposed to increasing concentrations of trametinib or SCH772984 for 1 hr. H. ST8814 parental (P) and resistant (R) cells were treated with trametinib (20 nM) over a time course, as shown. I. ST8814 resistant cells were seeded with trametinib overnight (R, T+), followed by drug washout for the indicated time. B, F, G, H, I. Expression and activity of RTK and signaling intermediates in the ERK and PI3K/AKT pathways were determined by immunoblot. (T −) = seeding cells without trametinib; (T +) = seeding cells with trametinib. Phospho-proteins and total proteins were from separate blots in B, F, G, H, and I.
Autocrine upregulation of HGF/MET signaling contributes to MEKi resistance in a model with acquired resistance to trametinib
To further validate that the HGF/MET axis can mediate both adaptive and acquired resistance to MEK inhibition in MPNST, we modeled the overexpression of HGF in parental cells, and performed knockdown of MET and HGF, respectively, in resistant cells. We measured the growth of ST8814 (R) cells compared to those in which either HGF or MET is reduced using inducible knockdown, and observed that either MET or HGF knockdown resulted in impaired cell growth (Figure 5A, B), suggesting that the resistant cells had developed dependence on the HGF-MET axis for their continued growth and survival. The expression of the HGF and MET shRNA on a doxycycline-inducible vector caused dose-dependent reduction in p-MEK, p-ERK and p-AKT, p-S6K, p-S6. A more significant reduction in cyclin D1 was exerted by knockdown of MET than that of HGF (Figure 5C and Supplementary Table 3). Inducible knockdown of either HGF or MET resulted in restored sensitivity of ST8814 (R) cells to trametinib, as measured by both the ability of trametinib to inhibit p-ERK (Figure 5D, E) and cell growth, to levels near that of parental (Figure 5F, day 5 and Supplementary Figure 4A, day 3 and 7). Whereas trametinib did not reduce the number of cells, nor the formation of colonies, compared to control (DMSO, no treatment) in ST8814 (R) with GFP control, both cell number and colony formation were reduced by trametinib by at least 40% and by at least 66% (cell number and colony formation, respectively) in each of the knockdown cells, shHGF and shMET (Figure 5G, H and Supplementary Figure 4B).
Figure 5. Autocrine upregulation of HGF/MET signaling contributes to MEKi resistance in a model with acquired resistance to trametinib.
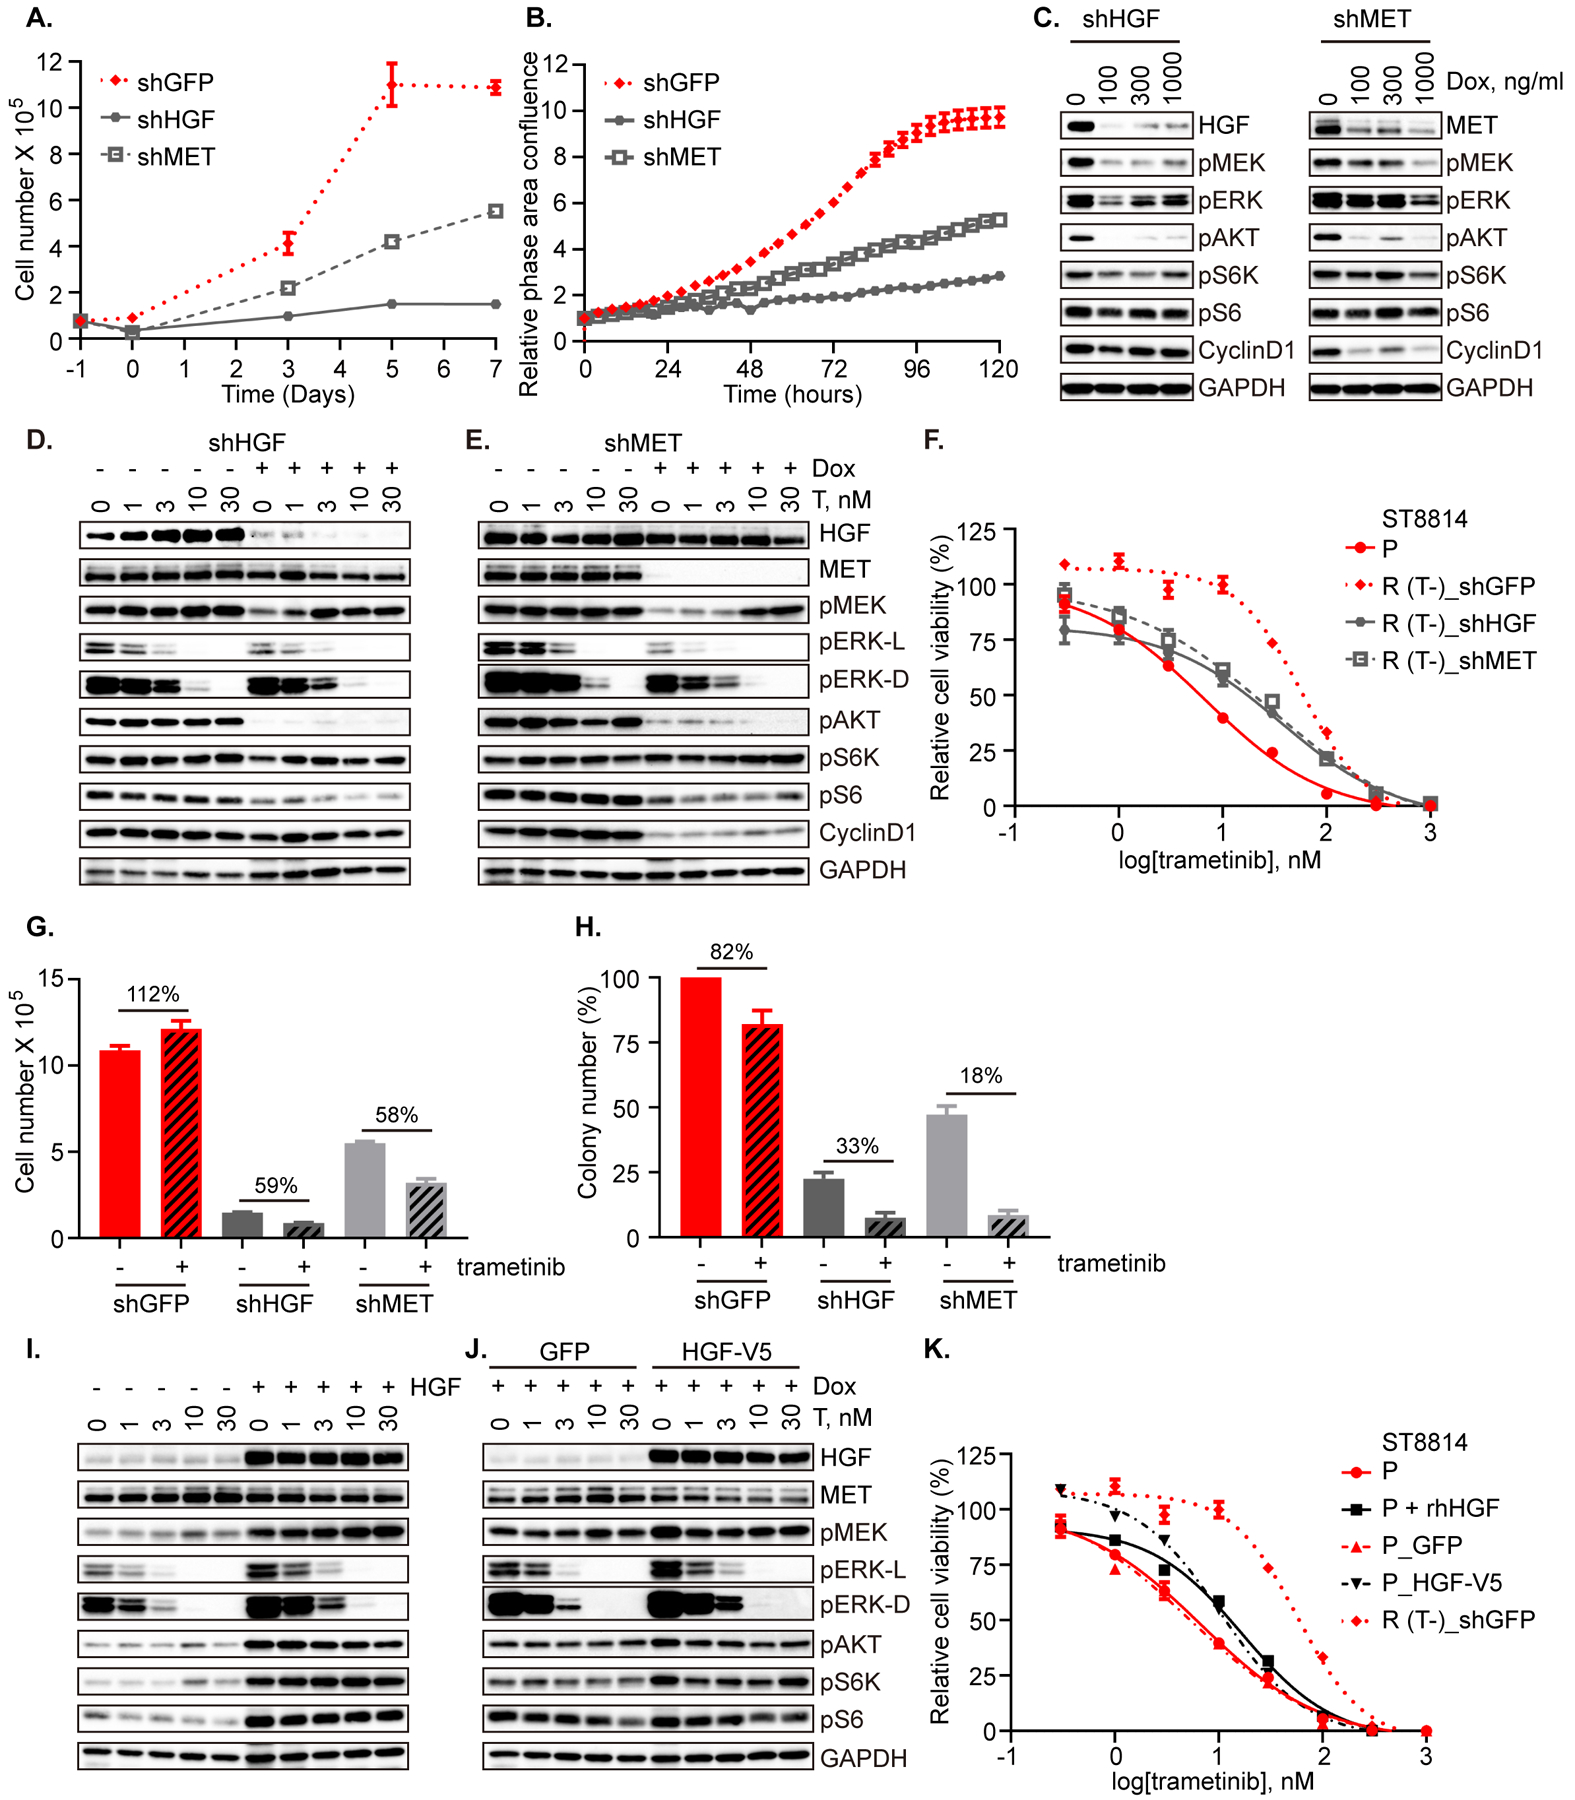
A. ST8814 resistant (R) cells inducibly expressing shRNA targeting GFP, HGF or MET were pretreated with doxycycline at 100 ng/ml, 100 ng/ml, or 1000 ng/ml, respectively for 48 hrs, and then 75,000 cells/ well were seeded in 6-well plate on day (–1). Cell number was counted on days 0, 3, 5, and 7. Result was from the average of two biological replicates. B. ST8814 resistant (R) cells as in A were seeded at 3,000 cells/ well in 96-well plates. The cell growth was monitored for 120 hrs using the Incucyte imaging system, and data are represented as relative phase area confluence normalized to the 0 hr scan, plotted as a function of time. The experiment was performed once with four technical replicates. C. ST8814 resistant (R) cells transduced with HGF shRNA or MET shRNA were exposed to increasing dose of doxycycline (Dox) for 48 hrs and then the indicated proteins were evaluated by immunoblot. D and E. ST8814 resistant (R) cells transduced with HGF shRNA (D) or MET shRNA (E) were plated in growth medium with 5% FBS and pretreated with vehicle or doxycycline at 100 ng/ml and 1000 ng/ml, respectively for 48 hrs and then exposed to increasing dose of trametinib for 1 hr. F. ST8814 parental (P) cells, and resistant (R) cells inducibly expressing shRNA targeting GFP, HGF or MET pretreated with doxycycline at 100 ng/ml, 100 ng/ml, or 1000 ng/ml, respectively for 48 hrs, were seeded at 2,000 cells/well in 96-well plates and exposed to increasing concentrations of trametinib. Cell viability was assessed on day 5 using the CCK-8 assay and plotted relative to untreated controls. G. ST8814 resistant (R) cells expressing shRNA targeting GFP, HGF or MET as in A were treated with −/+ trametinib (20 nM) on day 0 and cell number was counted on day 7. The percent change in cell number between trametinib and control is shown. H. ST8814 resistant (R) cells as in A were seeded at 100,000 cells/well in 6-well soft agar plates, three wells per condition, and were treated with −/+ trametinib (20 nM) for four weeks. Colonies were counted, using an average of five fields per well, under the microscope and are represented relative to DMSO controls for each cell line. I. ST8814 parental (P) cells were serum starved for 4 hrs, followed by concurrent treatment with increasing dose of trametinib and HGF (100 ng/ml) or vehicle control for 1 hr. J. ST8814 parental (P) cells inducibly expressing empty vector (GFP) or HGF-V5 were plated in growth medium with 2% FBS and pretreated with doxycycline (300 ng/ml) for 24 hrs, and then exposed to increasing dose of trametinib for 1 hr. K. ST8814 parental cells, parental cells treated with 50 ng/ml of recombinant human HGF (rhHGF), parental cells inducibly expressing empty vector (GFP) or HGF-V5, and ST8814 resistant (R) cells transduced with empty vector (GFP) were seeded at 2,000 cells/well in 96-well plates and exposed to increasing concentrations of trametinib. Cell viability was assessed on day 5 using the CCK-8 assay and plotted relative to untreated controls. A, B, F, G, H, K. 50% doxycycline was replenished every 24 hrs for doxycycline-inducible stable cell lines. C, D, E, I and J. Proteins as indicated were detected by immunoblot. Phospho-proteins and total proteins were from separate blots, with the exception in D, E, I and J that the blots for p-ERK Thr202/Tyr204 (42/44 kDa) were used to re-probe GAPDH (below 37 kDa).
Likewise, the phenotype of ST8814(R) was partially recapitulated by exogenous administration or ectopic overexpression of HGF in parental cells. Under serum-starved conditions, ST8814 (P) cells dosed with HGF (100 ng/ml, 1 hr), exhibited relative resistance to trametinib, with 3- to 10-fold higher dose of trametinib required to achieve similar reduction in p-ERK. Base-line levels of p-AKT, p-S6K and p-S6 were increased in the presence of HGF, and did not change in response to trametinib at 1 hr (Figure 5I). Similarly, we generated doxycycline-inducible constructs expressing V5-tagged HGF (or GFP as control) and expressed these in ST8814 parental cells. Under low serum conditions, inducible expression of HGF with doxycycline pretreatment for 24 hrs followed by short-term (1 hr) trametinib treatment again resulted in an increase in the amount of trametinib required to inhibit p-ERK by similar levels, and led to enhanced AKT signaling (Figure 5J and Supplementary Figure 4C). These results are consistent with a previous study that HGF promotes drug resistance by re-activating both PI3K/AKT and ERK signaling in the presence of the drug (22). In these cells, measurement of proliferation in response to trametinib over 5 days resulted in a shift to the right of the IC50 curve for both ST8814 (P) and (P_GFP) with either exogenous recombinant human HGF (rhHGF) or doxycycline-inducible HGF-V5 (Figure 5K, day 5 and Supplementary Figure 4D, day 3 and 7).
mTORi alone or MEKi plus mTORi exhibit variability against groups of MPNST cells, defined by their sensitivity to MEK inhibition
We hypothesized that given the central role of RAS signaling, its ability to modulate multiple downstream effector pathways, and its regulation by a large number of upstream RTK, which may change in an unpredictable fashion in this diverse group of tumors, that targeting the common downstream effector mTOR would likely work in concert with targeting the MEK-ERK signaling axis. We therefore tested the dual mTOR kinase inhibitors GSK2126458 and AZD2014, first as single agents in each of the parental/resistant pairs (PDGFRβ and HGF/MET upregulated, respectively), and found that the mTOR kinase inhibitors were no more effective as single agents in the resistant lines compared to the parental, nor were the combinations more effective than the mTOR kinase inhibitors alone – this was true in both the NF90.8 (R) and ST8814 (R) resistant cells (Figure 6A–D and Supplementary Figure 5A–F). Reasoning that PI3K/mTOR activity, either basal or adaptive, could mediate the partial sensitivity to MEKi seen in native MPNST cells, we tested the mTOR kinase inhibitor GSK2126458 in all ten MPNST cell lines as well, and found that all ten were in fact similarly sensitive to this compound (Figure 6E). We then tested whether more potent inhibition of cell proliferation could be achieved using trametinib in combination with GSK2126458, and found that the combination was more effective in reducing cell number and cyclin D1 expression than either agent alone in two cell lines (ST8814 and NF11.1) with partial sensitivity to trametinib alone (Figure 6F, cell number and immunoblot), but the effect was not additive in a cell line (NF96.2) insensitive to MEKi (Supplementary Figure 5G), despite inhibition of both PI3K/AKT and ERK signaling by the combination (Supplementary Figure 5H). Using the percent of cell growth inhibition achieved by either agent alone (trametinib 20 nM and GSK2126458 10 nM), we classified the twelve cell lines into three clusters: cluster 1, those most sensitive to MEKi; cluster 3, those most sensitive to mTORi but least sensitive to MEKi; and cluster 2, those modestly sensitive to each (Figure 6G, Supplementary Table 4 and Supplementary Figure 5I). The combined effect of MEKi/mTORi was most pronounced in clusters 1 and 2, whereas mTORi alone was most effective in cluster 3, including the two MEKi-resistant cell lines (Supplementary Figure 5A–D and J). These findings may provide insights to the ongoing phase 2 clinical trial (NCT03433183), using the MEKi selumetinib in combination with the mTORi sirolimus, in treating patients with MPNST.
Figure 6. mTORi alone or MEKi plus mTORi exhibit variability against groups of MPNST cells, defined by their sensitivity to MEK inhibition.
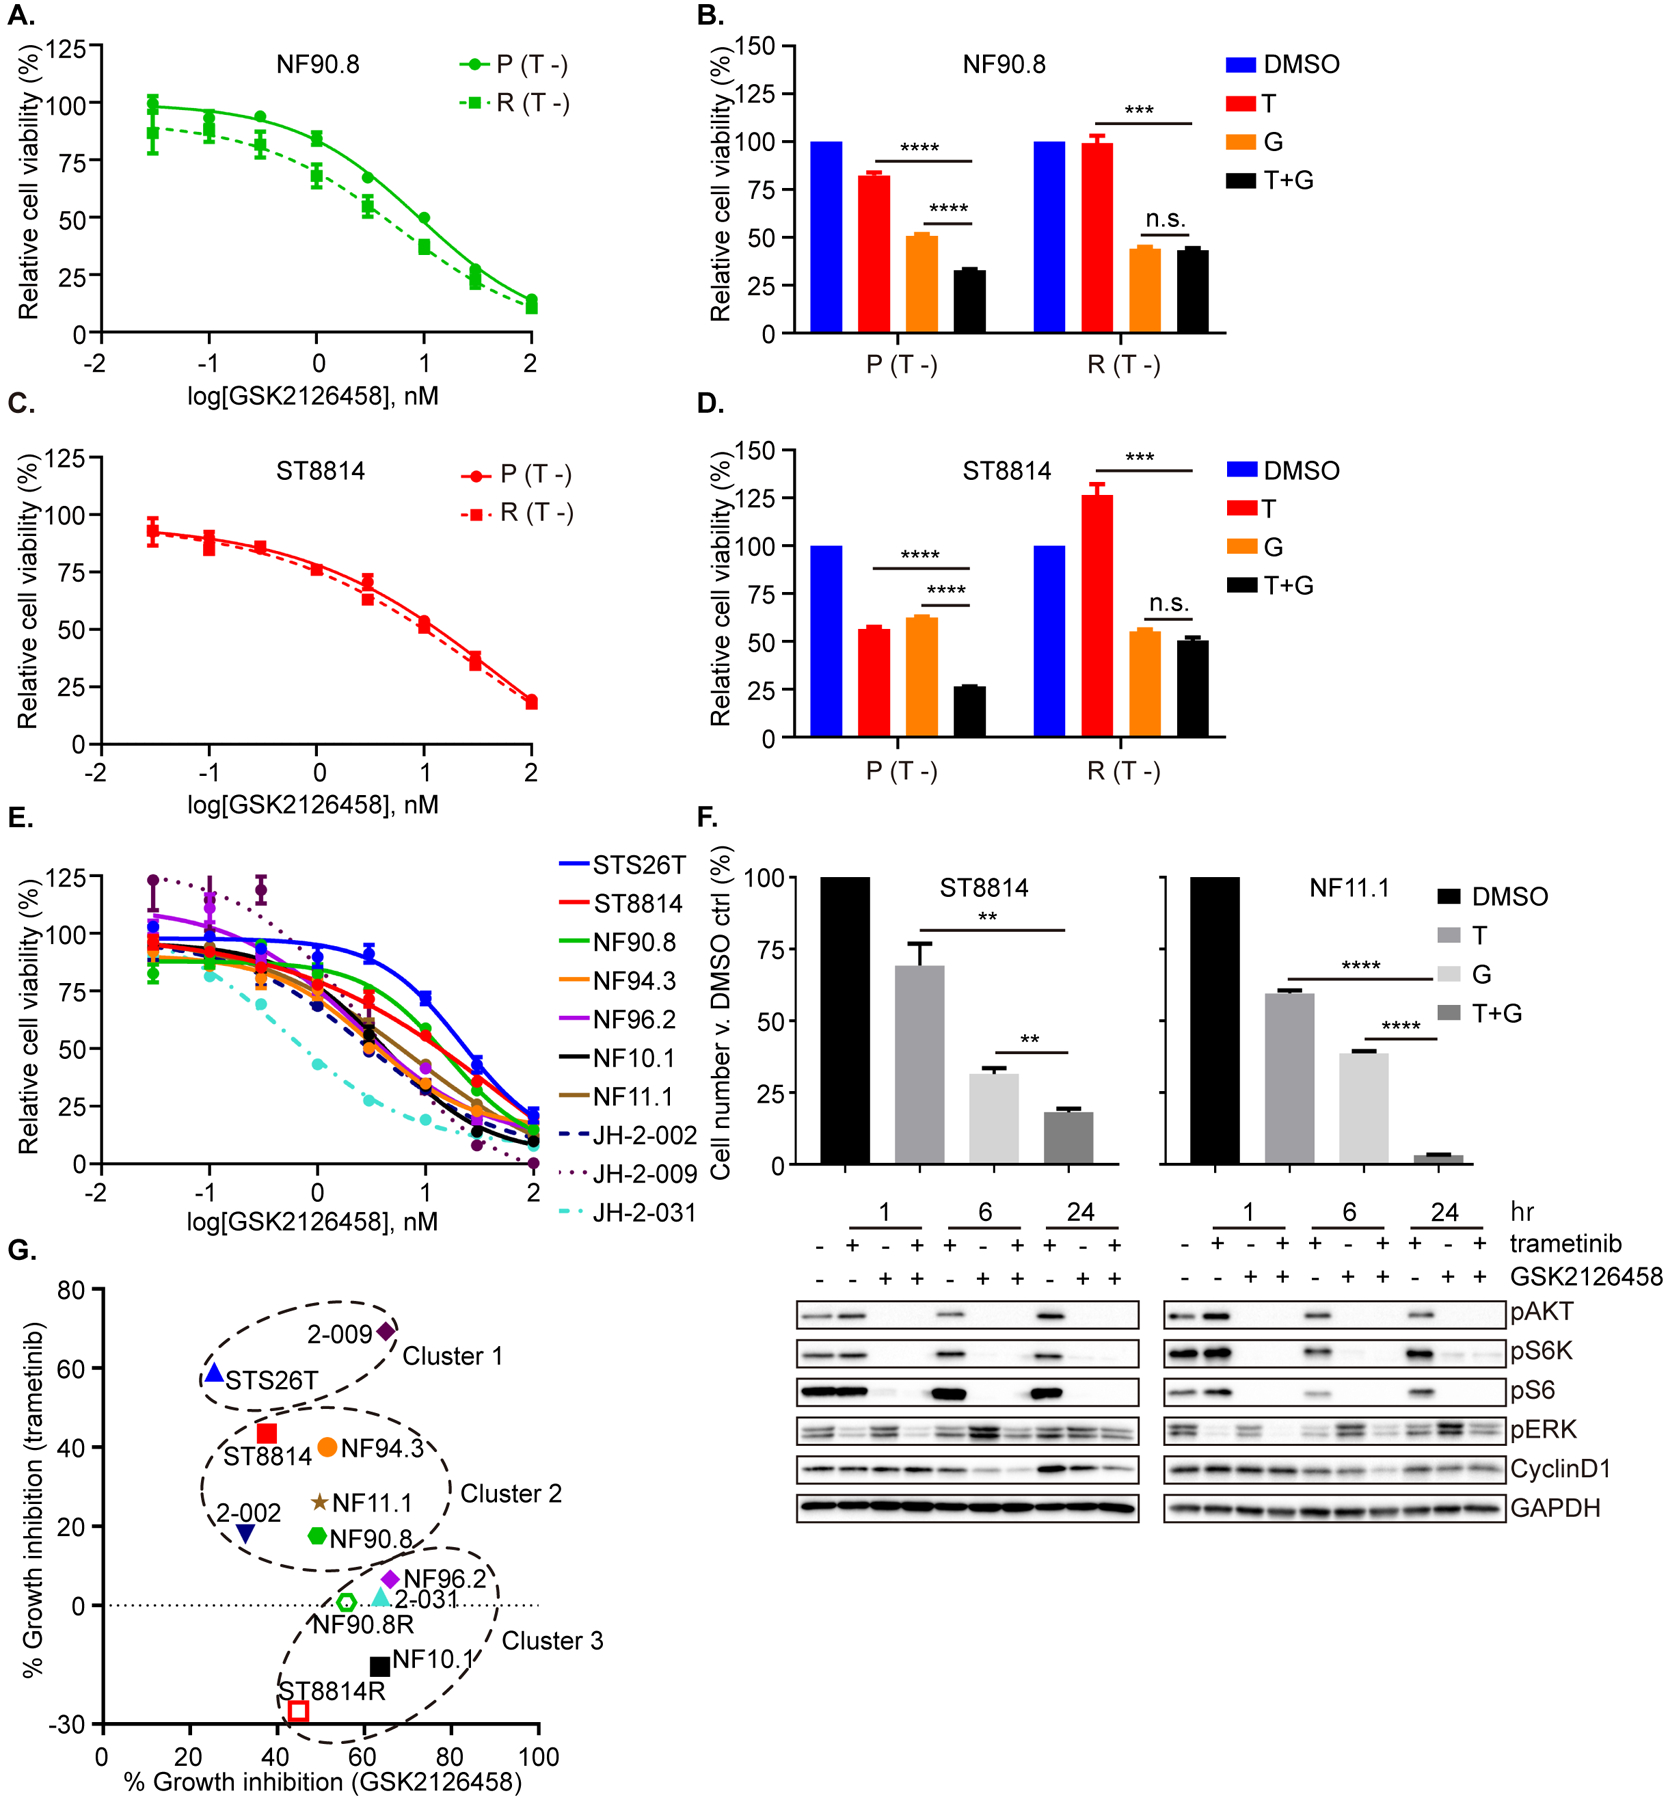
A and C. NF90.8 (A) and ST8814 (C) parental (P) and resistant (R) cells were exposed to increasing concentrations of GSK2126458. Cell viability was assessed on day 3 using the CCK-8 assay, and plotted relative to untreated controls. B and D. NF90.8 (B) and ST8814 (D) parental (P) and resistant (R) cells were exposed to DMSO, trametinib (T, 20 nM), GSK2126458 (G, 10 nM) or both drugs in combination (T+G). Cell viability was assessed on day 3 using the CCK-8 assay. (T −) = seeding cells without trametinib (A-D). E. Ten MPNST cell lines were exposed to increasing concentrations of GSK2126458 for 72 hrs. Cell viability was assessed using the CCK-8 assay, and plotted relative to untreated controls. F. ST8814 and NF11.1 were treated with DMSO, trametinib (T, 20 nM), GSK2126458 (G, 50 nM) or their combination (T+G), for 72 hrs. Cell number was counted and normalized to DMSO control (top). ST8814 and NF11.1 cells were treated with trametinib (20 nM) −/+ GSK2126458 (50 nM) over a time course. Proteins as indicated were detected by immunoblot (bottom). Phospho-proteins and total proteins were from separate blots. G. The correlation between the percent of growth inhibition across MPNST cells in response to either MEKi trametinib (20 nM) or PI3K/mTORi GSK2126458 (10 nM). The plot clusters cell lines into groups sensitive to “MEKi only” (STS26T and JH-2–009), to “PI3K/mTORi only” (NF96.2, NF10.1, JH-2–031, ST8814R and NF90.8R), or to both (ST8814, NF90.8, NF94.3, NF11.1 and JH-2–002). Data represent mean ± SEM. Unpaired t-test. n.s.= not significant, ** < 0.01, *** < 0.001, **** < 0.0001. All experiments were performed at least with two biological replicates.
Given the reported toxicity seen in clinical trials of such combinations to date, we sought an alternate combination approach, using selective inhibitors of RTK activity, to overcome the adaptive and acquired resistance we observed. As PDGFRβ was the most commonly upregulated RTK in response to MEKi in nine native cell lines and one MEKi-resistant model, we next tested the effects of the multi-targeted tyrosine kinase inhibitor (TKI) imatinib (39), alone or in combination with MEKi, on downstream signaling in the MEKi-resistant model and a panel of native cells, and found no marked or additive inhibition in PI3K/AKT or ERK signaling pathway from either imatinib, or imatinib combined with trametinib (Supplementary Figure 5K–N). Moreover, we also tested the single agent activity of the pan-TRK inhibitor LOXO-101 and the pan-FGFR inhibitor LY2874455, respectively, in ST8814 (P) and (R) cells (NTRK1- and FGFR4-amplified in resistant cells), and found no inhibitory effect of either drug on signaling, indicating that these two genomic alterations may not be the sole causative mediators of acquired resistance to MEKi (Supplementary Figure 5O).
MEKi plus METi demonstrates additive activity in MPNST parental and MEKi-resistant models
Combined treatment with MET and MEK inhibitors could represent a potential strategy to overcome both adaptive and acquired resistance to MEK inhibition in MPNST cells, given that we observed MET signaling upregulation as a feature present both in early adaptive responses to MEK inhibition, as well as one model of acquired resistance. We first tested the activity of a MET inhibitor (BMS777607; other inhibitors of MET included in Supplementary Figure 6) as a single agent in the ST8814 parental and resistant pair, and noted only modest activity of the compound against either ST8814 line, with MET inhibition suppressing the signaling molecules involved in both ERK and AKT pathways, and in particular reducing p-AKT levels to a similar extent in both cell lines (Figure 7A, B and Supplementary Figure 6A, B). When combined with trametinib, the MET inhibitor resulted in significant growth inhibition in (P) and (R) cells (Figure 7C and Supplementary Figure 6C). No additive effects on ERK signaling but more inhibition of p-AKT were detected in (P) cells. In (R) cells, the addition of METi resulted in greater inhibition of p-ERK compared to trametinib alone, accompanied by a decrease in p-AKT and cyclin D1, not seen with trametinib (Figure 7D, E and Supplementary Figure 6D, E). In an effort to identify the most effective TKI to inhibit RAS effector pathways in ST8814 (R) cells, we tested a panel of drugs, including multi-targeted kinase inhibitors pazopanib, imatinib, sunitinib, AZD2932, crizotinib, the TrkA inhibitor GW441756 and the FGFR4 inhibitor BLU-554, and found that crizotinib (which also targets MET), most significantly inhibited RAS activity and downstream PI3K/AKT and ERK signaling, in further support of the dependency of the resistant cells on MET signaling (Supplementary Figure 6F–H). Reasoning that adaptive signaling responses to MEK inhibition were also diverse and unpredictable in MPNST cell lines, we tested the MET inhibitors in the entire panel of native MPNST cells, and found only modest in vitro sensitivity to BMS777607, and little single agent activity of INC280 (capmatinib) in all lines (Figure 7F, G). Modest inhibition of RAS effector signaling was observed with METi alone in a panel of native cells (Supplementary Figure 6I), but MEKi plus METi effectively inhibited downstream survival signaling (Supplementary Figure 6J–M). Given together with MEKi, there was a significant growth-inhibitory response for both MET inhibitors (BMS777607 and INC280/capmatinib), compared to either single agent alone when analyzing the seven NF1-MPNST cell lines in aggregate (Figure 7H, I). In particular, we observed a synergistic growth inhibition of trametinib plus the METi in ST8814, NF90.8, NF11.1 and JH-2–009 (Figure 7C and Supplementary Figure 6C, N and O). We further found that the combined use of MEKi and METi leads to more profound inhibition of p-ERK and cyclin D1 for at least 96 hrs of drug treatment, indicative of more sustained suppression of downstream signaling, relative to either agent alone (Figure 7J). The additive combined effect was also seen when using trametinib and INC280 (capmatinib, a METi recently approved for NSCLC, and in clinical development for glioblastoma, melanoma, kidney cancer, triple negative breast cancer, advanced hepatocellular carcinoma and other solid tumors) in two in vivo models, PDX JH-2–009 (Figure 7K and Supplementary Figure 6P), the model with the least overall degree of RTK upregulation; and the cell-line-derived xenograft model NF11.1 (Figure 7L), the model with adaptive MET upregulation, suggesting that the combination would be effective in a broad range of heterogeneous MPNST models, as previously suggested (25, 26).
Figure 7. MEKi plus METi demonstrates additive activity in MPNST parental and MEKi-resistant models.
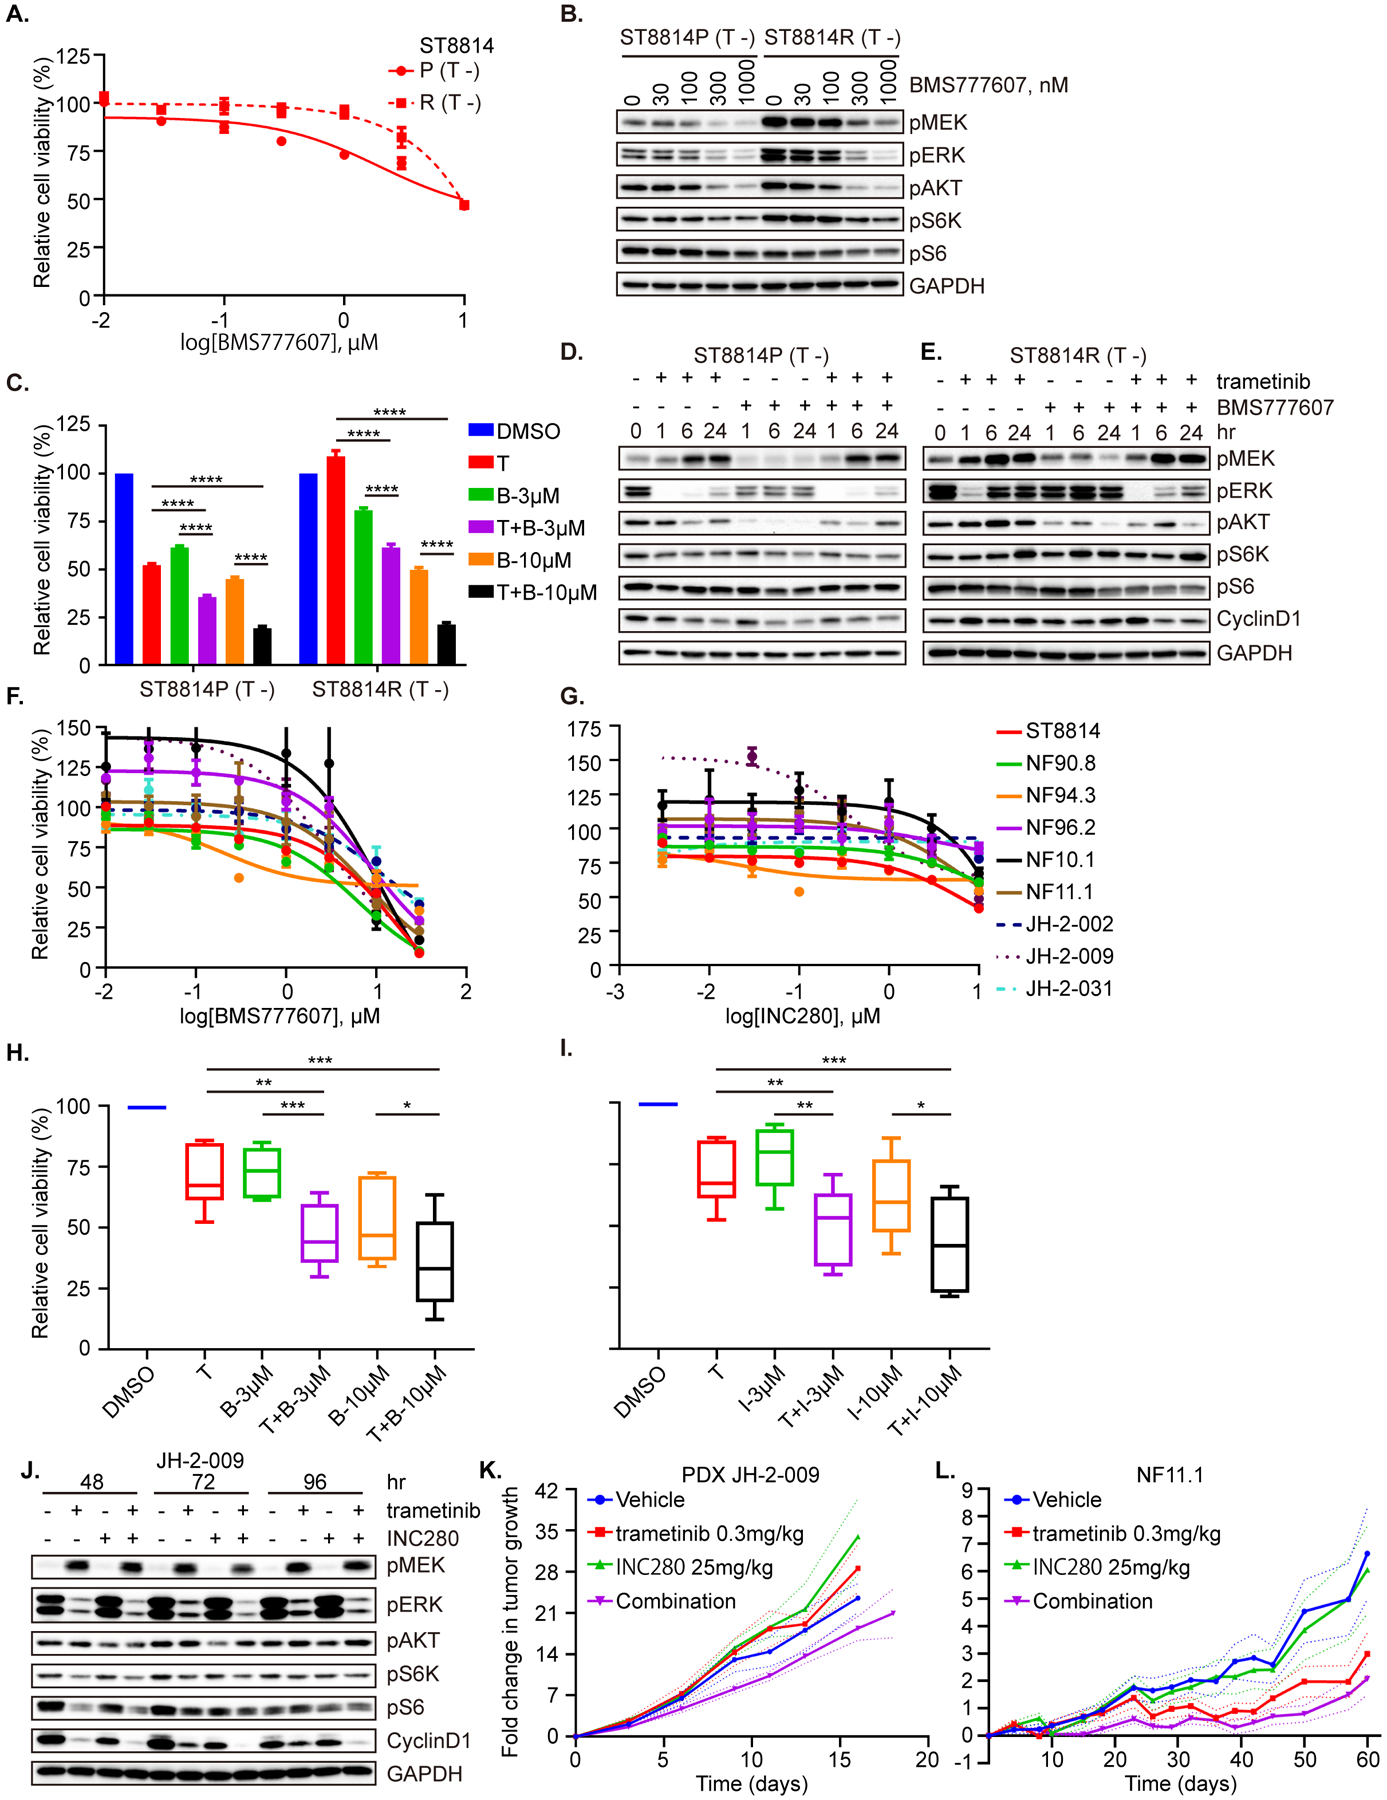
A. ST8814 parental (P) and resistant (R) cells were exposed to increasing concentrations of the MET inhibitor BMS777607 for 72 hrs. B. ST8814 parental (P) and resistant (R) cells were treated with increasing concentrations of BMS777607 for 1 hr. C. ST8814 parental (P) and resistant (R) cells were treated with DMSO, trametinib (T, 20 nM), BMS777607 (B, 3 μM and 10 μM) or the combination (T+B) for 72 hrs. Data represent mean ± SEM. Unpaired t-test. D and E. ST8814 parental (D) or resistant (E) cells were treated with trametinib (20 nM) and/or BMS777607 (300 nM) over a time course. F and G. Nine NF1-MPNST cell lines were exposed to increasing concentrations of BMS777607 (F) and INC280 (G) for 72 hrs. H and I. Seven NF1-MPNST cell lines were exposed to DMSO, trametinib (T, 20 nM), BMS777607 (B, 3 μM and 10 μM) (H) or INC280 (I, 3 μM and 10 μM) (I) and their combination. Paired t-test. J. JH-2–009 was treated with DMSO, trametinib (20 nM), INC280 (30 nM) or their combination for 48 hrs, 72 hrs and 96 hrs. K and L. NSG female mice bearing PDX JH-2–009 (K, some mice were euthanized before the endpoint due to tumor size reaching the protocol limit and the plot for individual tumor growth was shown as Supplementary. Fig 6P) and NF11.1 (L, all mice, 9–10/ cohort, were on study until the endpoint) were treated with vehicle, trametinib (0.3 mg/kg), INC280 (capmatinib, 25 mg/kg), or their combination via oral gavage once daily. The fold-change tumor growth was graphed as a function of time on treatment, plotted as an average of the mice on study per cohort. A, C, F, G, H and I. Cell viability was evaluated using the CCK-8 assay, and plotted relative to untreated controls. B, D, E and J. Proteins as indicated were detected by immunoblot. * < 0.05, ** < 0.01, *** < 0.001, **** < 0.0001. Phospho-proteins and total proteins were from separate blots in B, D, E and J.
Discussion
The development of novel therapeutic combinations for NF1-MPNST has been limited by a number of challenges, and among these are: 1) complex karyotypes and a tendency to the loss of tumor suppressor function, rather than activating mutations in protein kinases (10, 40, 41); 2) diverse heterogeneity among tumors; and 3) difficulty in predicting the ways in which tumors will evade inhibition by the most compelling class of targeted agents, the MEK inhibitors. The clinical trials to date, utilizing single agent TKI, including erlotinib, sorafenib, imatinib and dasatinib, have failed in treating MPNST (42). An abundance of data suggests that inhibition of MEK, a key effector pathway in tumors with dysregulated RAS via loss of NF1, should have anti-tumor activity, but to date, preclinical studies have suggested that MEK inhibition alone is insufficient (12, 13, 38). Identification of targeted therapies that hold potential for therapeutic efficacy in MPNST has been the focus of several clinical trials, including those testing inhibitors of Hsp90/mTOR (no responses), MEK/mTOR (ongoing) and BET family proteins, based on preclinical data suggesting a role for these molecules in MPNST (1, 38, 43–47).
We reasoned that the short-term adaptive response to MEK inhibition in NF1-MPNST tumor cells would include loss of physiologic negative feedback from activated ERK to upstream tyrosine kinases, resulting in rebound reactivation of ERK and other pathways, and that identification of upstream pathways upregulated in response to MEK inhibition would predict targets for combined therapy. Further, we set out to identify actionable alterations in signaling that underlie acquired resistance to MEK inhibition. By observation of the adaptive changes in signaling when a diverse panel of MPNST cell lines were exposed to MEK inhibitor, and by selecting for cells that had acquired resistance following prolonged therapy, we confirmed that multiple RTK become activated by MEK inhibition, and therefore hypothesized that these adaptive changes represent targets for combination therapy. We tested two distinct approaches of such combination therapies.
RAS signaling maintains a central oncogenic role in NF1-deficient cancers, and given its ability to modulate multiple downstream effector pathways, and its regulation by a numerous upstream RTK, we hypothesized that targeting the common downstream effector mTOR would likely work in concert with targeting the MEK-ERK signaling axis. We tested two ATP-competitive dual mTOR kinase inhibitors, and while no unique pattern of differential sensitivity to these drugs was seen in the panel of MPNST cell lines, the combined effect of MEK/mTOR inhibition could be stratified into clusters, defined by baseline sensitivity to single agent MEK inhibitor. In fact, in those cells which were only moderately sensitive to MEKi, the combination of MEK/mTOR inhibition resulted in a profound synergistic effect in vitro. The future of this class of agents, however, remains to be defined, as early human trials have been complicated by toxicity, and multiple agents in this class to date have not met safety and efficacy endpoints to advance further (48, 49).
There is an abundance of evidence demonstrating the importance of genomic alterations in critical driver genes in mediating therapy response, such as NF1 loss and NRAS mutation that lead to resistance to RAF inhibition in melanoma (20, 50); and NF1 loss and MET amplification in mediating resistance to EGFR inhibition in lung cancer (51, 52). Here, we indeed observed amplification of the RTK genes NTRK1 and FGFR4, and single copy loss of the tumor suppressor genes TP53, NCOR1 and FLCN specifically in ST8814 resistant cells; and RAF1 amplification, RECQL4 splicing variant (69.57% VAF) and KMT2D P2948Q (21.66% VAF) particularly in NF90.8 resistant cells. However, further evidence demonstrated the inability of the pan-TRKi LOXO-101 and the pan-FGFRi LY2874455 to effectively inhibit either ERK or AKT signaling in the corresponding resistant model. Among these alterations, RAF1 was previously reported to drive resistance to RAF inhibition in BRAF V600E melanoma through reactivation of ERK signaling (53). As such, in addition to PDGFRβ upregulation, RAF1 amplification and enhanced expression in NF90.8 resistant cells would also drive acquired resistance to trametinib, necessitating vertical co-targeting MEK and CRAF to overcome the resistance. Future studies are needed to explore the efficacy of combination pan-RAF and MEK inhibition, and to address the potential roles of NCOR1, FLCN, RECQL4 and KMT2D in pathogenesis and therapy response, in MPNST.
MET and PDGFRβ emerged specifically as the driver RTK in our models of acquired resistance, suggesting also that early targeting of these molecules would allow for enhanced therapeutic activity. We tested the combination of MEK plus imatinib but observed no additive benefit with this relatively non-selective molecule. These results are consistent with the observation that no responses to imatinib were achieved in patients with MPNST, with one stable disease as the best response reported in this early clinical trial (54). Similarly, PDGFRβ-upregulated, PLX4032-resistant melanoma cells were shown to be resistant not only to the MEKi AZD6244 but also to imatinib as a single agent (20), suggestive of reactivation of compensatory survival signaling and a need for combined use of MEKi with a new generation of small-molecule inhibitors targeting PDGFRβ.
The activity of MEK and MET inhibition was observed previously in preclinical models of MET-amplified non-small cell lung cancer, KRAS-mutant colorectal cancer, and metastatic uveal melanoma, the latter two with HGF/MET upregulation as a mediator of resistance to MEKi (55–57). In our ST8814 acquired resistance model, MET phosphorylation was upregulated nearly three-fold. Given that MET and its ligand HGF are amplified and implicated in MPNST growth and metastasis (10, 24, 58, 59), their upregulation as an escape from MEK inhibition is perhaps not surprising, and in fact has been observed in a longitudinal study of MPNST progression on chemotherapy and radiation in a single patient (25). In our experiments, the resistant cells became dependent on MET signaling, such that when either MET or HGF were reduced by short-hairpin intervening sequences, cell growth was reduced, irrespective of exposure to the MEKi. Upregulation of MET signaling was associated with reduced sensitivity of ERK to the MEKi, as well as upregulation of AKT-mTOR-S6 signaling. The fact that cells could acquire dependency on a single RTK for their growth, suggests an underlying lineage specificity, enabling emergence of the normally quiescent kinase under selective pressure. With this in mind, we tested the combination of MEK and MET inhibition not only in cells which had acquired resistance to MEKi through upregulation of HGF/MET, but rather in a broad panel of native MPNST cells, to explore whether MET is a vulnerable RTK in this tumor type in general. Despite relative insensitivity of all NF1-MPNST cell lines to two MET inhibitors, the combination was additive in most models tested, consistent with two recent reports demonstrating additive activity of trametinib and capmatinib in genetically-engineered mouse (GEM) models of MPNST (NF1/TP53/MET) (25, 26). While the in vivo efficacy of this regimen has been previously reported, our data provide additional mechanistic insight regarding both short-term and long-term adaptation to MEK inhibition, including adaptive upregulation of MET and other RTK, upregulation of AKT signaling, and reduced sensitivity of ERK to the MEKi, in the more complex and heterogenous genetic contexts relative to GEM models. These effects were present in multiple models tested, including native and MEKi-resistant cell lines, and a novel patient-derived and a cell line-derived xenograft models of NF1-MPNST (28). Among these, NF96.2 was found a copy number gain in MET (4), and was observed a more potent inhibition of cell growth by MEKi plus METi, relative to either single agent alone. Other than NF1, our knowledge of the genomic alterations including HGF and MET on the panel of these cell lines is quite limited. In our study, we indeed observed synergistic/additive inhibitory effect of MEKi plus METi on tumor cell growth, mechanistically through greater suppression of both ERK and AKT signaling, and cyclin D1. Further studies are therefore needed to correlate the genomic status of MET and HGF with the response to MEKi plus METi, using paired PDX models that more faithfully represent human tumors and predict drug response in corresponding patients. These studies will help validate whether genomic alterations in MET and HGF will serve as effective biomarkers and facilitate the selection of patients who may benefit the combination therapy. Our findings suggest that the combination of MET and MEK inhibitors hold promise for enhancing the therapeutic efficacy of MEK inhibition in MPNST, by preventing the common mechanisms of signaling network adaptation, as well as delaying or preventing the emergence of resistance by co-targeting receptors which are critical signaling moieties in this disease.
Supplementary Material
Statement of Significance.
This work demonstrates that MEKi plus MET inhibitor may delay or prevent a novel mechanism of acquired MEKi resistance, with clinical implications for MPNST patients harboring NF1 alterations.
Acknowledgements
This work has been funded by Hyundai Hope on Wheels (to C.A.P.); the Children’s Cancer Foundation (to C.A.P); The Developmental and Hyperactive RAS Tumor (DHART) SPORE, Development Research Program (to C.A.P.); the Neurofibromatosis Therapeutic Acceleration Program (NTAP, to C.A.P.); the Giant Food Pediatric Cancer Fund (to Division of Pediatric Oncology); and the SKCCC Cancer Center Core NIH P30 CA006973.
The authors wish to acknowledge Drs. Gregory Riggins and Margaret Wallace for providing cell lines; Dr. Zhan Yao for providing doxycycline-inducible vectors; and Ming-Tseh Lin, Christopher Gocke, and Lisa Haley for assistance with targeted gene sequencing. We are grateful to Dr. Ping Chi for scientific discussions, and to Dr. Jack Shern for unpublished sequencing data on the STS26T cell line.
Footnotes
Conflict of interest
C.A.P. is a paid consultant for Genentech/Roche. The remaining authors have declared that no conflicts of interests exist.
References
- 1.De Raedt T, Beert E, Pasmant E, Luscan A, Brems H, Ortonne N, et al. PRC2 loss amplifies Ras-driven transcription and confers sensitivity to BRD4-based therapies. Nature. 2014;514(7521):247–51. [DOI] [PubMed] [Google Scholar]
- 2.Lee W, Teckie S, Wiesner T, Ran L, Prieto Granada CN, Lin M, et al. PRC2 is recurrently inactivated through EED or SUZ12 loss in malignant peripheral nerve sheath tumors. Nat Genet. 2014;46(11):1227–32. [DOI] [PMC free article] [PubMed] [Google Scholar]
- 3.Zhang M, Wang Y, Jones S, Sausen M, McMahon K, Sharma R, et al. Somatic mutations of SUZ12 in malignant peripheral nerve sheath tumors. Nat Genet. 2014;46(11):1170–2. [DOI] [PMC free article] [PubMed] [Google Scholar]
- 4.Pemov A, Hansen NF, Sindiri S, Patidar R, Higham CS, Dombi E, et al. Low mutation burden and frequent loss of CDKN2A/B and SMARCA2, but not PRC2, define pre-malignant neurofibromatosis type 1-associated atypical neurofibromas. Neuro Oncol. 2019. [DOI] [PMC free article] [PubMed] [Google Scholar]
- 5.Brohl AS, Kahen E, Yoder SJ, Teer JK, Reed DR. The genomic landscape of malignant peripheral nerve sheath tumors: diverse drivers of Ras pathway activation. Sci Rep. 2017;7(1):14992. [DOI] [PMC free article] [PubMed] [Google Scholar]
- 6.Upadhyaya M, Kluwe L, Spurlock G, Monem B, Majounie E, Mantripragada K, et al. Germline and somatic NF1 gene mutation spectrum in NF1-associated malignant peripheral nerve sheath tumors (MPNSTs). Hum Mutat. 2008;29(1):74–82. [DOI] [PubMed] [Google Scholar]
- 7.Verdijk RM, den Bakker MA, Dubbink HJ, Hop WC, Dinjens WN, Kros JM. TP53 mutation analysis of malignant peripheral nerve sheath tumors. J Neuropathol Exp Neurol. 2010;69(1):16–26. [DOI] [PubMed] [Google Scholar]
- 8.Perrone F, Da Riva L, Orsenigo M, Losa M, Jocolle G, Millefanti C, et al. PDGFRA, PDGFRB, EGFR, and downstream signaling activation in malignant peripheral nerve sheath tumor. Neuro Oncol. 2009;11(6):725–36. [DOI] [PMC free article] [PubMed] [Google Scholar]
- 9.Holtkamp N, Okuducu AF, Mucha J, Afanasieva A, Hartmann C, Atallah I, et al. Mutation and expression of PDGFRA and KIT in malignant peripheral nerve sheath tumors, and its implications for imatinib sensitivity. Carcinogenesis. 2006;27(3):664–71. [DOI] [PubMed] [Google Scholar]
- 10.Mantripragada KK, Spurlock G, Kluwe L, Chuzhanova N, Ferner RE, Frayling IM, et al. High-resolution DNA copy number profiling of malignant peripheral nerve sheath tumors using targeted microarray-based comparative genomic hybridization. Clin Cancer Res. 2008;14(4):1015–24. [DOI] [PubMed] [Google Scholar]
- 11.Yang J, Ylipaa A, Sun Y, Zheng H, Chen K, Nykter M, et al. Genomic and molecular characterization of malignant peripheral nerve sheath tumor identifies the IGF1R pathway as a primary target for treatment. Clin Cancer Res. 2011;17(24):7563–73. [DOI] [PMC free article] [PubMed] [Google Scholar]
- 12.Jessen WJ, Miller SJ, Jousma E, Wu J, Rizvi TA, Brundage ME, et al. MEK inhibition exhibits efficacy in human and mouse neurofibromatosis tumors. J Clin Invest. 2013;123(1):340–7. [DOI] [PMC free article] [PubMed] [Google Scholar]
- 13.Jousma E, Rizvi TA, Wu J, Janhofer D, Dombi E, Dunn RS, et al. Preclinical assessments of the MEK inhibitor PD-0325901 in a mouse model of Neurofibromatosis type 1. Pediatr Blood Cancer. 2015;62(10):1709–16. [DOI] [PMC free article] [PubMed] [Google Scholar]
- 14.Dombi E, Baldwin A, Marcus LJ, Fisher MJ, Weiss B, Kim A, et al. Activity of Selumetinib in Neurofibromatosis Type 1-Related Plexiform Neurofibromas. N Engl J Med. 2016;375(26):2550–60. [DOI] [PMC free article] [PubMed] [Google Scholar]
- 15.Gross AM, Wolters PL, Dombi E, Baldwin A, Whitcomb P, Fisher MJ, et al. Selumetinib in Children with Inoperable Plexiform Neurofibromas. N Engl J Med. 2020;382(15):1430–42. [DOI] [PMC free article] [PubMed] [Google Scholar]
- 16.Lito P, Pratilas CA, Joseph EW, Tadi M, Halilovic E, Zubrowski M, et al. Relief of profound feedback inhibition of mitogenic signaling by RAF inhibitors attenuates their activity in BRAFV600E melanomas. Cancer Cell. 2012;22(5):668–82. [DOI] [PMC free article] [PubMed] [Google Scholar]
- 17.Corcoran RB, Ebi H, Turke AB, Coffee EM, Nishino M, Cogdill AP, et al. EGFR-mediated re-activation of MAPK signaling contributes to insensitivity of BRAF mutant colorectal cancers to RAF inhibition with vemurafenib. Cancer Discov. 2012;2(3):227–35. [DOI] [PMC free article] [PubMed] [Google Scholar]
- 18.Montero-Conde C, Ruiz-Llorente S, Dominguez JM, Knauf JA, Viale A, Sherman EJ, et al. Relief of feedback inhibition of HER3 transcription by RAF and MEK inhibitors attenuates their antitumor effects in BRAF-mutant thyroid carcinomas. Cancer Discov. 2013;3(5):520–33. [DOI] [PMC free article] [PubMed] [Google Scholar]
- 19.Kopetz S, Grothey A, Yaeger R, Van Cutsem E, Desai J, Yoshino T, et al. Encorafenib, Binimetinib, and Cetuximab in BRAF V600E-Mutated Colorectal Cancer. N Engl J Med. 2019;381(17):1632–43. [DOI] [PubMed] [Google Scholar]
- 20.Nazarian R, Shi H, Wang Q, Kong X, Koya RC, Lee H, et al. Melanomas acquire resistance to B-RAF(V600E) inhibition by RTK or N-RAS upregulation. Nature. 2010;468(7326):973–7. [DOI] [PMC free article] [PubMed] [Google Scholar]
- 21.Straussman R, Morikawa T, Shee K, Barzily-Rokni M, Qian ZR, Du J, et al. Tumour micro-environment elicits innate resistance to RAF inhibitors through HGF secretion. Nature. 2012;487(7408):500–4. [DOI] [PMC free article] [PubMed] [Google Scholar]
- 22.Wilson TR, Fridlyand J, Yan Y, Penuel E, Burton L, Chan E, et al. Widespread potential for growth-factor-driven resistance to anticancer kinase inhibitors. Nature. 2012;487(7408):505–9. [DOI] [PMC free article] [PubMed] [Google Scholar]
- 23.Knauf JA, Luckett KA, Chen KY, Voza F, Socci ND, Ghossein R, et al. Hgf/Met activation mediates resistance to BRAF inhibition in murine anaplastic thyroid cancers. J Clin Invest. 2018;128(9):4086–97. [DOI] [PMC free article] [PubMed] [Google Scholar]
- 24.Torres KE, Zhu QS, Bill K, Lopez G, Ghadimi MP, Xie X, et al. Activated MET is a molecular prognosticator and potential therapeutic target for malignant peripheral nerve sheath tumors. Clin Cancer Res. 2011;17(12):3943–55. [DOI] [PMC free article] [PubMed] [Google Scholar]
- 25.Peacock JD, Pridgeon MG, Tovar EA, Essenburg CJ, Bowman M, Madaj Z, et al. Genomic Status of MET Potentiates Sensitivity to MET and MEK Inhibition in NF1-Related Malignant Peripheral Nerve Sheath Tumors. Cancer Res. 2018;78(13):3672–87. [DOI] [PMC free article] [PubMed] [Google Scholar]
- 26.Grit JL, Pridgeon MG, Essenburg CJ, Wolfrum E, Madaj ZB, Turner L, et al. Kinome Profiling of NF1-Related MPNSTs in Response to Kinase Inhibition and Doxorubicin Reveals Therapeutic Vulnerabilities. Genes (Basel). 2020;11(3). [DOI] [PMC free article] [PubMed] [Google Scholar]
- 27.Kahen EJ, Brohl A, Yu D, Welch D, Cubitt CL, Lee JK, et al. Neurofibromin level directs RAS pathway signaling and mediates sensitivity to targeted agents in malignant peripheral nerve sheath tumors. Oncotarget. 2018;9(32):22571–85. [DOI] [PMC free article] [PubMed] [Google Scholar]
- 28.Pollard K, Banerjee J, Doan X, Wang J, Guo X, Allaway R, et al. A clinically and genomically annotated nerve sheath tumor biospecimen repository. Sci Data. 2020;7(1):184. [DOI] [PMC free article] [PubMed] [Google Scholar]
- 29.Lemberg KM, Wang J, Pratilas CA. From Genes to -Omics: The Evolving Molecular Landscape of Malignant Peripheral Nerve Sheath Tumor. Genes (Basel). 2020;11(6). [DOI] [PMC free article] [PubMed] [Google Scholar]
- 30.Wang J, Pollard K, Allen AN, Tomar T, Pijnenburg D, Yao Z, et al. Combined inhibition of SHP2 and MEK is effective in models of NF1-deficient malignant peripheral nerve sheath tumors. Cancer Res. 2020. [DOI] [PMC free article] [PubMed] [Google Scholar]
- 31.Gondek LP, Zheng G, Ghiaur G, DeZern AE, Matsui W, Yegnasubramanian S, et al. Donor cell leukemia arising from clonal hematopoiesis after bone marrow transplantation. Leukemia. 2016;30(9):1916–20. [DOI] [PMC free article] [PubMed] [Google Scholar]
- 32.Xing D, Zheng G, Pallavajjala A, Schoolmeester JK, Liu Y, Haley L, et al. Lineage-Specific Alterations in Gynecologic Neoplasms with Choriocarcinomatous Differentiation: Implications for Origin and Therapeutics. Clin Cancer Res. 2019;25(14):4516–29. [DOI] [PubMed] [Google Scholar]
- 33.Sancak Y, Peterson TR, Shaul YD, Lindquist RA, Thoreen CC, Bar-Peled L, et al. The Rag GTPases bind raptor and mediate amino acid signaling to mTORC1. Science. 2008;320(5882):1496–501. [DOI] [PMC free article] [PubMed] [Google Scholar]
- 34.Kentsis A, Reed C, Rice KL, Sanda T, Rodig SJ, Tholouli E, et al. Autocrine activation of the MET receptor tyrosine kinase in acute myeloid leukemia. Nat Med. 2012;18(7):1118–22. [DOI] [PMC free article] [PubMed] [Google Scholar]
- 35.Pratilas CA, Hanrahan AJ, Halilovic E, Persaud Y, Soh J, Chitale D, et al. Genetic predictors of MEK dependence in non-small cell lung cancer. Cancer Res. 2008;68(22):9375–83. [DOI] [PMC free article] [PubMed] [Google Scholar]
- 36.Wang J, Yao Z, Jonsson P, Allen AN, Qin ACR, Uddin S, et al. A Secondary Mutation in BRAF Confers Resistance to RAF Inhibition in a BRAF(V600E)-Mutant Brain Tumor. Cancer Discov. 2018;8(9):1130–41. [DOI] [PMC free article] [PubMed] [Google Scholar]
- 37.Pratilas CA, Taylor BS, Ye Q, Viale A, Sander C, Solit DB, et al. (V600E)BRAF is associated with disabled feedback inhibition of RAF-MEK signaling and elevated transcriptional output of the pathway. Proc Natl Acad Sci U S A. 2009;106(11):4519–24. [DOI] [PMC free article] [PubMed] [Google Scholar]
- 38.Watson AL, Anderson LK, Greeley AD, Keng VW, Rahrmann EP, Halfond AL, et al. Co-targeting the MAPK and PI3K/AKT/mTOR pathways in two genetically engineered mouse models of schwann cell tumors reduces tumor grade and multiplicity. Oncotarget. 2014;5(6):1502–14. [DOI] [PMC free article] [PubMed] [Google Scholar]
- 39.Ohishi J, Aoki M, Nabeshima K, Suzumiya J, Takeuchi T, Ogose A, et al. Imatinib mesylate inhibits cell growth of malignant peripheral nerve sheath tumors in vitro and in vivo through suppression of PDGFR-beta. BMC Cancer. 2013;13:224. [DOI] [PMC free article] [PubMed] [Google Scholar]
- 40.Upadhyaya M, Spurlock G, Majounie E, Griffiths S, Forrester N, Baser M, et al. The heterogeneous nature of germline mutations in NF1 patients with malignant peripheral serve sheath tumours (MPNSTs). Hum Mutat. 2006;27(7):716. [DOI] [PubMed] [Google Scholar]
- 41.Miller SJ, Rangwala F, Williams J, Ackerman P, Kong S, Jegga AG, et al. Large-scale molecular comparison of human schwann cells to malignant peripheral nerve sheath tumor cell lines and tissues. Cancer Res. 2006;66(5):2584–91. [DOI] [PubMed] [Google Scholar]
- 42.Kim A, Pratilas CA. The promise of signal transduction in genetically driven sarcomas of the nerve. Exp Neurol. 2018;299(Pt B):317–25. [DOI] [PubMed] [Google Scholar]
- 43.Kim A, Lu Y, Okuno SH, Reinke D, Maertens O, Perentesis J, et al. Targeting Refractory Sarcomas and Malignant Peripheral Nerve Sheath Tumors in a Phase I/II Study of Sirolimus in Combination with Ganetespib (SARC023). Sarcoma. 2020;2020:5784876. [DOI] [PMC free article] [PubMed] [Google Scholar]
- 44.De Raedt T, Walton Z, Yecies JL, Li D, Chen Y, Malone CF, et al. Exploiting cancer cell vulnerabilities to develop a combination therapy for ras-driven tumors. Cancer Cell. 2011;20(3):400–13. [DOI] [PMC free article] [PubMed] [Google Scholar]
- 45.Malone CF, Fromm JA, Maertens O, DeRaedt T, Ingraham R, Cichowski K. Defining key signaling nodes and therapeutic biomarkers in NF1-mutant cancers. Cancer Discov. 2014;4(9):1062–73. [DOI] [PMC free article] [PubMed] [Google Scholar]
- 46.Varin J, Poulain L, Hivelin M, Nusbaum P, Hubas A, Laurendeau I, et al. Dual mTORC1/2 inhibition induces anti-proliferative effect in NF1-associated plexiform neurofibroma and malignant peripheral nerve sheath tumor cells. Oncotarget. 2016;7(24):35753–67. [DOI] [PMC free article] [PubMed] [Google Scholar]
- 47.Amirnasr A, Verdijk RM, van Kuijk PF, Taal W, Sleijfer S, Wiemer EAC. Expression and inhibition of BRD4, EZH2 and TOP2A in neurofibromas and malignant peripheral nerve sheath tumors. PLoS One. 2017;12(8):e0183155. [DOI] [PMC free article] [PubMed] [Google Scholar]
- 48.Tolcher AW, Bendell JC, Papadopoulos KP, Burris HA 3rd, Patnaik A, Jones SF, et al. A phase IB trial of the oral MEK inhibitor trametinib (GSK1120212) in combination with everolimus in patients with advanced solid tumors. Ann Oncol. 2015;26(1):58–64. [DOI] [PubMed] [Google Scholar]
- 49.Schram AM, Gandhi L, Mita MM, Damstrup L, Campana F, Hidalgo M, et al. A phase Ib dose-escalation and expansion study of the oral MEK inhibitor pimasertib and PI3K/MTOR inhibitor voxtalisib in patients with advanced solid tumours. Br J Cancer. 2018;119(12):1471–6. [DOI] [PMC free article] [PubMed] [Google Scholar]
- 50.Whittaker SR, Theurillat JP, Van Allen E, Wagle N, Hsiao J, Cowley GS, et al. A genome-scale RNA interference screen implicates NF1 loss in resistance to RAF inhibition. Cancer Discov. 2013;3(3):350–62. [DOI] [PMC free article] [PubMed] [Google Scholar]
- 51.de Bruin EC, Cowell C, Warne PH, Jiang M, Saunders RE, Melnick MA, et al. Reduced NF1 expression confers resistance to EGFR inhibition in lung cancer. Cancer Discov. 2014;4(5):606–19. [DOI] [PMC free article] [PubMed] [Google Scholar]
- 52.Engelman JA, Zejnullahu K, Mitsudomi T, Song Y, Hyland C, Park JO, et al. MET amplification leads to gefitinib resistance in lung cancer by activating ERBB3 signaling. Science. 2007;316(5827):1039–43. [DOI] [PubMed] [Google Scholar]
- 53.Johannessen CM, Boehm JS, Kim SY, Thomas SR, Wardwell L, Johnson LA, et al. COT drives resistance to RAF inhibition through MAP kinase pathway reactivation. Nature. 2010;468(7326):968–72. [DOI] [PMC free article] [PubMed] [Google Scholar]
- 54.Chugh R, Wathen JK, Maki RG, Benjamin RS, Patel SR, Meyers PA, et al. Phase II multicenter trial of imatinib in 10 histologic subtypes of sarcoma using a bayesian hierarchical statistical model. J Clin Oncol. 2009;27(19):3148–53. [DOI] [PubMed] [Google Scholar]
- 55.Cheng H, Chua V, Liao C, Purwin TJ, Terai M, Kageyama K, et al. Co-targeting HGF/cMET Signaling with MEK Inhibitors in Metastatic Uveal Melanoma. Mol Cancer Ther. 2017;16(3):516–28. [DOI] [PMC free article] [PubMed] [Google Scholar]
- 56.Van Schaeybroeck S, Kalimutho M, Dunne PD, Carson R, Allen W, Jithesh PV, et al. ADAM17-dependent c-MET-STAT3 signaling mediates resistance to MEK inhibitors in KRAS mutant colorectal cancer. Cell Rep. 2014;7(6):1940–55. [DOI] [PubMed] [Google Scholar]
- 57.Chiba M, Togashi Y, Tomida S, Mizuuchi H, Nakamura Y, Banno E, et al. MEK inhibitors against MET-amplified non-small cell lung cancer. Int J Oncol. 2016;49(6):2236–44. [DOI] [PMC free article] [PubMed] [Google Scholar]
- 58.Rao UN, Sonmez-Alpan E, Michalopoulos GK. Hepatocyte growth factor and c-MET in benign and malignant peripheral nerve sheath tumors. Hum Pathol. 1997;28(9):1066–70. [DOI] [PubMed] [Google Scholar]
- 59.Thomas LE, Winston J, Rad E, Mort M, Dodd KM, Tee AR, et al. Evaluation of copy number variation and gene expression in neurofibromatosis type-1-associated malignant peripheral nerve sheath tumours. Hum Genomics. 2015;9:3. [DOI] [PMC free article] [PubMed] [Google Scholar]
Associated Data
This section collects any data citations, data availability statements, or supplementary materials included in this article.