

Abstract
Purpose:
To examine the prospective association between serum Mg level and the incidence of cognitive impairment.
Methods:
A random sub-cohort (n=2,063) from the Reasons for Geographic and Racial Differences in Stroke (REGARDS) cohort was included in this study. Baseline serum Mg concentration was measured using inductively coupled plasma mass spectrometry. According to the current reference interval of serum magnesium (0.75-0.95 mmol/L), we classified participants below the interval as Level 1 and used it as the referent. The rest of the study population were equally divided into three groups, named Level 2 to 4. Incident cognitive impairment was identified using the Six-Item Screener. Multivariable-adjusted odds ratios (ORs) and corresponding 95% confidence intervals (CIs) were estimated using logistic regression models.
Results:
After adjustment for potential confounders, an inverse threshold association between serum Mg level and incident cognitive impairment was observed. Compared to those with hypomagnesemia (Level 1: <0.75 mmol/L), the relative odds of incident cognitive impairment was reduced by 41% in the second level [OR (95% CI) = 0.59 (0.37, 0.94)]; higher serum Mg level did not provide further benefits [Level 3 and 4 versus Level 1: OR (95% CI) = 0.54 (0.34, 0.88) and 0.59 (0.36, 0.96), P for linear trend = 0.08].
Conclusions:
Findings from this prospective study sugggest that sufficient Mg status within the normal range may be benificial to cognitive health in the US general population.
Introduction
Dementia and cognitive aging are critical public health concerns that lower the quality of life of sufferers and their families, and impose a heavy economic burden on society [1]. Owing to the lack of effective treatment for dementia, efforts are shifting to the primary prevention of early cognitive impairment and identification of modifiable risk factors for dementia such as diet [2].
Magnesium (Mg) is a nutritious mineral, and its ionic form is found in a relatively large concentration in the central nervous system [3]. Because synaptic strength and plasticity in neuronal networks, which are functional substrates of memory encoding [4, 5], depend closely on ion flux across neuronal membrane [6], differences in Mg homeostasis could contribute to the pathophysiology of cognitive aging. In animal models, administration of Mg improved learning and memory in aged animals [7, 8], and Mg deficiency impaired memory function [9]. However, human studies relating Mg to cognitive aging are sparse. Some cross-sectional studies found that Mg levels measured in serum, cerebrospinal fluid, or hair were lower among Alzheimer’s disease patients compared with apparently healthy individuals [10-12]. Low serum Mg levels were also associated with poorer global cognitive function [11, 13, 14]. But, there was only one cohort study conducted in the Netherlands that found both low and high serum Mg levels were associated with an increased risk of all-cause dementia [15].
Therefore, we examined the association between baseline serum Mg level and the incidence of cognitive impairment over ten years of follow-up in a US general population using data from the Reasons for Geographic and Racial Differences in Stroke (REGARDS) cohort.
Methods
Study design and population
REGARDS is an ongoing population-based prospective cohort study designed to investigate the incidence of stroke and cognitive impairment in the US. The detailed study design has been reported elsewhere [16]. Briefly, REGARDS recruited a cohort of 30,239 black and white Americans aged ≥45 years from 2003-7 and has been following them since. After verbally consenting to participate in the study, participants were interviewed by telephone to self-report demographic (age, sex, race, and region), socioeconomic (education and family income), and lifestyle factors (smoking status, alcohol consumption, and depressive symptom). An in-person physical assessment followed 3-4 weeks later, in which blood and urine samples, as well as physical measurements (blood pressure, height, weight, and electrocardiogram), were collected using standardized protocols. Written informed consents were obtained and self-administered questionnaires were left with participants to gather dietary information and medical history. This study was approved by institutional review boards of all REGARDS participating institutions and Columbia University Irving Medical Center (IRB AAAS5777).
To analyze baseline levels of circulating minerals, a sub-cohort (n=2,666) of REGARDS participants was randomly selected with a fixed sampling probability of 9% in each stratum jointly classified by age (<55, 55-64, 65-74, 75-84, and ≥85 years), gender (female and male), race (black and white), and region of residence (Stroke Buckle, the rest of Stroke Belt, and non-Stroke-Belt region) [17, 18]. The comparisons of baseline characteristics between the REGARDS entire cohort and the random sub-cohort are shown in Supplemental Table 1. Significant difference was not found.
Laboratory analyses
Urine and fasting blood samples were collected at the baseline in-person physical assessment. Samples were placed in transfer vials, stored in a refrigerator until pick-up by a courier on the same day, shipped overnight with ice packs to a central laboratory, and stored at −80 °C for reprocessing and analysis [19]. Serum Mg and calcium concentrations were measured by inductively coupled plasma mass spectrometry (Perkin Elmer, MA, USA) [20]. Mg samples were analyzed in batches of 30-120 with instrument blanks, NIST 956d quality control samples (CVs of Level 1 to 3=1.3%, 1.4%, and 1.6% ), and in-house pooled QC serum (CV=2.0%). Lipid profiles and glucose were measured using colorimetric reflectance spectrophotometry with the Ortho Vitros Clinical Chemistry System 950IRC instrument (Johnson & Johnson Clinical Diagnostics, Rochester, NY) [21].
Assessment of cognitive function
Trained REGARDS interviewers administered a two-level cognitive function assessment longitudinally through telephone contact till April 1, 2015. To assess global cognitive function, the Six-Item Screener (SIS) was administered annually beginning from baseline (December 2003) [22]. The SIS assesses recall of a 3-item word list and temporal orientation of year, month, and day of the week, with scores ranging from 0 to 6. To assess learning, memory and executive function, a three-test battery, including the Consortium to Establish a Registry for Alzheimer's Disease (CERAD) battery, Animal Fluency Test (AFT), and Letter Fluency Test (LFT), was administered every two years during follow-up, beginning in 2006 for CERAD battery and AFT, and 2008 for LFT. CERAD battery included Word List Learning (WLL) and Word List Delayed Recall (WLD) tests that measured new learning and verbal memory of a 10-item list, with scores ranging from 0-30 for WLL and 0-10 for WLD [23]. AFT and LFT measured semantic fluency and phonemic fluency scored as the number of animals and the number of words beginning with the letter “F” that a participant can name in 60 seconds [24, 25]. In all tests, lower scores indicate poorer cognitive functions or greater impairment. These measures gathered via telephone-based assessment are included in the vascular cognitive impairment harmonization standards and have been widely used in observational and interventional studies of cognitive aging and dementia [26]. The validity of these measures has been verified in quality control in REGARDS [27].
In this study, the primary outcome was incident global cognitive impairment defined as having a SIS score ≤4 at the most recent assessment as of April 1, 2015 [28]. In secondary analyses, we examined the longitudinal associations with domain-specific cognitive functions measured by the three test battery (WLL, WLD, AFT, and LFT).
Other covariates
Important covariates measured at baseline included age, gender, race (black or white), region (Stroke Buckle, the rest of Stroke Belt, or non-Stroke-Belt region), education level (<high school, high school graduate, some college, or college graduate), family income (<$20, $20-34, $35-74, or ≥$75 thousand per year), smoking status (never, past, or current smoker; pack-years of cigarettes), alcohol consumption (never, past, or current drinker; drinks per week), physical activity (none, 1–3, or ≥4 times/week), body mass index (BMI, <25.0, 25.0-29.9, or ≥30.0 kg/m2), hypertension (yes or no), diabetes (yes or no), dyslipidemia (yes or no), history of heart disease (yes or no), depressive symptom, blood pressure, total cholesterol, high-density lipoprotein (HDL)-cholesterol, low-density lipoprotein (LDL)-cholesterol, triglycerides, glucose, and serum calcium concentration. Demographics, socioeconomics, and lifestyle factors were self-reported. Weight and height were measured by trained professionals based on the standardized protocols and were used to calculate BMI (kg/m2). Hypertension was defined as any self-reported use of blood pressure control medication or systolic blood pressure ≥140 mmHg or diastolic blood pressure ≥90 mmHg. Diabetes was defined as any self-reported use of glucose control medication or a fasting blood glucose concentration >126 mg/dL or non-fasting glucose >200 mg/dL. Dyslipidemia was defined as any self-reported use of lipid control medication or triglycerides ≥240 mg/dL or LDL-cholesterol ≥160 mg/dL or HDL-cholesterol ≤40 mg/dL. History of heart disease was defined by self-reported myocardial infarction, coronary artery bypass graft, angioplasty, stenting or evidence of myocardial infarction from an electrocardiogram performed during the in-home examination. Depressive symptom, which was indicated by the score of the Center for Epidemiological Studies – Depression four-item version (CESD-4), was evaluated over the telephone [29]. Total intake of Mg (diet plus supplementation) was estimated using Block98 FFQ [16].
Statistical analyses
According to the current reference interval of serum magnesium (0.75-0.95 mmol/L) [30, 31], we considered participants who had a serum magnesium level below the interval as the referent (Level 1) in all analyses. The rest of the participants were equally divided into three groups, named Level 2 to 4, because only 5% of the study population had serum magnesium concentrations above the reference interval (> 0.95 mmol/L).
Baseline characteristics of the study population were summarized using mean values with standard deviations for continuous variables and proportions for categorical variables. Analysis of variance, Kruskal-Wallis tests, or chi-squared tests were used to compare participants’ characteristics across serum Mg levels, as appropriate. Logistic regression models were used to examine the association between serum Mg level and incident cognitive impairment in three sequential models. Model 1 was adjusted for age, gender, race, interactions of age-gender, age-race and gender-race, and region. Model 2 was additionally adjusted for education level, family income, smoking status, alcohol consumption, physical activity, and BMI. Model 3 was further adjusted for medical histories (hypertension, diabetes, dyslipidemia, and heart disease), clinical measurements (CESD-4 score, systolic blood pressure, total cholesterol, HDL-cholesterol, LDL-cholesterol, triglycerides, and glucose), and serum calcium that have been shown to interact with Mg [32]. In addition, interactions with some pre-specified factors, including age, gender, race, and serum calcium that has been shown to interact with Mg [32], were examined in model 3.
Sensitivity analyses were performed to test the robustness of the findings. First, to reduce the possibility of reverse causality, all cases of incident cognitive impairment within the first 4 years after serum Mg measurement were excluded [15]. Second, participants with only 1 follow-up SIS measure were excluded. Third, because hypomagnesemia may be clinically diagnosed with serum Mg concentration <0.70 mmol/L, we used this cut-off point in a sensitivity analysis. Participants who had a serum Mg level <0.70 mmol/L were the referent and the rest were equally divided into three groups (Level 2 to 4).
The associations between baseline serum Mg level and the repeated assessments of WLL, WLD, AFT, and LFT were examined using linear mixed models with the adjustment for covariates in model 3. Analyses of AFT and LFT also included covariates to adjust for whether participants who were identified in review of tape recordings received assistance from someone in their home environment or were given a disallowed prompt by the interviewer. Similar to prior REGARDS reports, no random effects accounting for time between tests were included [33]. Covariance structure was chosen based on the lowest Bayesian information criterion (BIC).
P values ≤0.05 were considered statistically significant. All analyses were conducted in SAS version 9.4 (SAS Institute, Cary, NC, USA).
Results
Of the 2,666 participants in the random sub-cohort, 223 did not have data on serum Mg, 193 reported cognitive impairment at baseline, 116 reported stroke at baseline, and 72 underwent only one Six-Item Screener cognitive assessment, which leaves a total of 2,062 participants in the present study (Figure 1).
Figure 1.
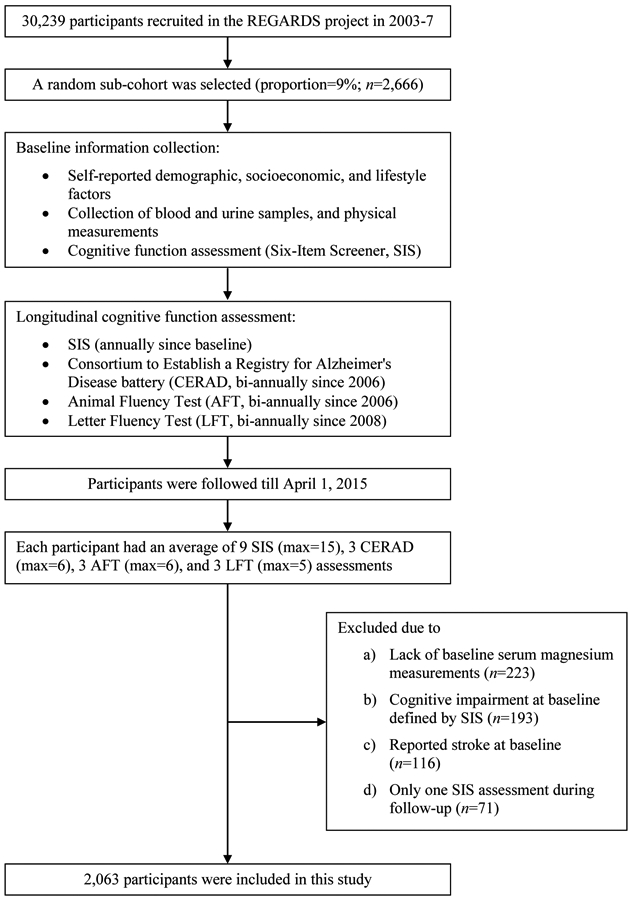
Flow chart of study sampling.
The baseline characteristics of this study population are shown in Table 1. The mean participant age at baseline was 64 years (standard deviation 9 years) with 55% women and 38% black. The distribution of serum Mg concentration was slightly left skewed with a median being 0.82 mmol/L (inter-quartile range=0.77-0.88 mmol/L). Participants with higher serum Mg level were more likely to be male and white, have higher levels of education, family income, alcohol consumption, and physical activity, and have normal weight. They were also less likely to have hypertension and type 2 diabetes. In addition, they were more likely to have lower blood pressure, higher total cholesterol and LDL cholesterol, lower glucose, and higher serum calcium levels.
Table 1.
Baseline characteristics of the study population by serum magnesium levels (n=2,063).a
| Characteristics | Levels of serum magnesium (mmol/L) |
Total | P value | |||
|---|---|---|---|---|---|---|
| Level 1 (<0.75) |
Level 2 (0.75 - <0.81) |
Level 3 (0.81 - <0.87) |
Level 4 (≥0.87) |
|||
| n | 389 | 509 | 551 | 614 | 2.062 | -- |
| Demographics | ||||||
| Age (year) | 64.0±9.4 | 64.0±9.4 | 63.6±8.9 | 64.5±8.5 | 64.1±9.0 | 0.28 |
| Female (%) | 65.3 | 56.2 | 54.0 | 48.7 | 55.1 | <0.01 |
| Black (%) | 48.3 | 41.7 | 35.1 | 30.1 | 37.7 | <0.01 |
| US region (%) | 0.11 | |||||
| Stroke Buckle | 24.4 | 20.6 | 20.7 | 20.4 | 21.3 | |
| The rest of Stroke Belt | 35.7 | 37.1 | 34.1 | 31.1 | 34.2 | |
| Non-Stroke-Belt region | 39.9 | 42.2 | 45.2 | 48.5 | 44.5 | |
| Socioeconomic status | ||||||
| Education level (%) | <0.01 | |||||
| Less than high school | 13.6 | 11.0 | 8.7 | 7.0 | 9.7 | |
| High school graduate | 26.2 | 24.6 | 22.1 | 22.5 | 23.6 | |
| Some college | 29.6 | 24.8 | 28.5 | 28.1 | 27.7 | |
| College graduate and above | 30.6 | 39.7 | 40.7 | 42.4 | 39.1 | |
| Family income (%) | <0.01 | |||||
| Less than $20k | 21.1 | 14.7 | 11.6 | 11.7 | 14.2 | |
| $20k-$34k | 25.5 | 22.6 | 24.3 | 21.3 | 23.2 | |
| $35k-$74k | 23.1 | 32.6 | 35.2 | 35.5 | 32.4 | |
| $75k and above | 17.0 | 15.5 | 18.0 | 20.2 | 17.9 | |
| Missing | 13.4 | 14.5 | 10.9 | 11.2 | 12.4 | |
| Lifestyle factors | ||||||
| Smoking status | ||||||
| Never (%) | 48.8 | 43.6 | 48.1 | 45.0 | 46.2 | 0.57 |
| Past (%) | 37.5 | 41.5 | 37.0 | 41.4 | 39.5 | |
| Current (%) | 13.6 | 14.9 | 14.9 | 13.7 | 14.3 | |
| Pack-years of cigarettes | 9.8±17.2 | 12.3±19.7 | 13.2±23.5 | 12.7±20.6 | 12.2±20.6 | 0.13 |
| Alcohol consumption | ||||||
| Never (%) | 34.5 | 28.7 | 30.1 | 27.0 | 29.7 | 0.03 |
| Past (%) | 19.5 | 18.5 | 15.3 | 15.8 | 17.0 | |
| Current (%) | 46.0 | 52.9 | 54.6 | 57.2 | 53.4 | |
| Drinks per week | 2.3±6.1 | 2.1±7.4 | 2.3±8.3 | 2.6±6.2 | 2.3±7.1 | 0.011 |
| Physical activity (%) | <0.01 | |||||
| None | 40.7 | 30.6 | 33.3 | 27.6 | 32.4 | |
| 1-3 times per week | 31.9 | 38.0 | 36.2 | 37.5 | 36.2 | |
| ≥4 times per week | 27.5 | 31.4 | 30.6 | 34.9 | 31.5 | |
| BMI group (%) | <0.01 | |||||
| <25.0 kg/m2 | 16.7 | 20.4 | 25.6 | 27.9 | 23.3 | |
| 25.0-29.9 kg/m2 | 34.2 | 37.9 | 37.8 | 40.7 | 38.1 | |
| ≥30.0 kg/m2 | 49.1 | 41.7 | 36.5 | 31.4 | 38.6 | |
| Medical history | ||||||
| Hypertension (%) | 70.0 | 58.7 | 54.6 | 48.7 | 56.7 | <0.01 |
| Diabetes (%) | 38.3 | 21.8 | 15.2 | 9.9 | 19.6 | <0.01 |
| Dyslipidemia (%) | 54.2 | 54.4 | 58.8 | 57.9 | 56.6 | 0.34 |
| History of heart disease (%) | 13.8 | 14.3 | 15.0 | 13.8 | 14.3 | 0.93 |
| Clinical measurements | ||||||
| CESD-4 score (points) | 1.3±2.3 | 1.1±1.9 | 0.9±1.6 | 1.1±2.0 | 1.1±2.0 | 0.14 |
| Systolic blood pressure (mmHg) | 129.2±16.3 | 127.5±15.9 | 126.4±15.6 | 124.9±16.3 | 126.7±16.1 | <0.01 |
| Diastolic blood pressure (mmHg) | 77.0±9.8 | 76.7±8.7 | 76.5±9.2 | 75.5±10.1 | 76.3±9.5 | <0.01 |
| Total cholesterol (mg/dL) | 188.1±39.9 | 189.7±39.2 | 192.6±39.3 | 195.8±37.6 | 192.0±39.0 | <0.01 |
| HDL-cholesterol (mg/dL) | 52.0±16.7 | 52.2±16.6 | 51.7±15.9 | 51.5± 15.1 | 51.8±16.0 | 0.43 |
| LDL-cholesterol (mg/dL) | 108.1±34.0 | 111.5±32.9 | 115.1±34.4 | 118.8±33.2 | 114.0±33.8 | <0.01 |
| Triglycerides (mg/dL) | 144.7±127.4 | 128.6±75.5 | 128.7±71.4 | 129.5±77.2 | 131.9±87.4 | 0.16 |
| Glucose (mg/dL) | 115.9±47.5 | 106.2±40.8 | 99.3±22.2 | 95.3±18.4 | 102.9±33.5 | <0.01 |
| Serum calcium (mmol/L) | 2.41±0.20 | 2.47±0.15 | 2.50±0.15 | 2.56±0.13 | 2.49±0.17 | <0.01 |
Abbreviations: BMI, body mass index; CESD-4, the Center for Epidemiological Studies-Depression: 4-item version; HDL, high-density lipoprotein; LDL, low-density lipoprotein.
Results are presented by means ± standard deviations or proportions. P values are tested for any difference across serum magnesium levels using analysis of variance, Kruskal-Wallis test, or chi-squared test as appropriate.
Through April 1, 2015, 255 participants developed cognitive impairment. A significant inverse threshold association between serum Mg level and incident cognitive impairment was observed (Table 2). Compared to those with hypomagnesemia (Level 1), the multivariable-adjusted odds ratios (ORs) [95% confidence intervals (CIs)] in Level 2 to 4 were 0.73 (0.49, 1.09), 0.64 (0.42, 0.96), and 0.71 (0.48, 1.04) (P for linear trend = 0.13) after adjustment for demographics (model 1). Further adjustment for socioeconomics and lifestyle factors (model 2) did not substantially changed the results [Level 2 to 4 versus Level 1: OR (95% CI) = 0.63 (0.41, 0.98), 0.61 (0.39, 0.95), and 0.69 (0.45, 1.05), P for linear trend = 0.16]. In the final model that additionally adjusted for medical history and clinical measurements (model 3), the inverse threshold association was more pronounced [Level 2 to 4 versus Level 1: OR (95% CI) = 0.59 (0.37, 0.94), 0.54 (0.34, 0.88), and 0.59 (0.36, 0.96), P for linear trend = 0.08]. The inverse association was not significantly modified by age, gender, race, or serum calcium level (all P for interaction >0.05, Table 3).
Table 2.
Associations (odds ratio and 95% confidence interval) between baseline serum magnesium and incident cognitive impairment as measured by the Six Item Screener (n=2,063).a-d
| Levels of serum magnesium (mmol/L) |
P for linear trend |
||||
|---|---|---|---|---|---|
| Level 1 (<0.75) |
Level 2 (0.75 - <0.81) |
Level 3 (0.81 - <0.87) |
Level 4 (≥0.87) |
||
| Median (inter-quartile range) | 0.71 (0.68-0.73) | 0.78 (0.77-0.80) | 0.84 (0.83-0.85) | 0.91 (0.88-0.93) | -- |
| Number of cases/participants | 62/389 | 63/509 | 57/551 | 73/614 | -- |
| Model 1 | 1 (Referent) | 0.73 (0.49, 1.09) | 0.64 (0.42, 0.96) | 0.71 (0.48, 1.04) | 0.13 |
| Model 2 | 1 (Referent) | 0.63 (0.41, 0.98) | 0.61 (0.39, 0.95) | 0.69 (0.45, 1.05) | 0.16 |
| Model 3 | 1 (Referent) | 0.59 (0.37, 0.94) | 0.54 (0.34, 0.88) | 0.59 (0.36, 0.96) | 0.08 |
Abbreviations: BMI, body mass index; CESD-4, the Center for Epidemiological Studies-Depression: 4-item version.
All models were constructed by using logistic regression models. According to the current reference interval of serum magnesium (0.75-0.95 mmol/L), we classified participants below the interval as Level 1 and used it as the referent. The rest of the study population were equally divided into three groups, named Level 2 to 4.
Model 1 was adjusted for age, gender, race (black or white), interactions of age-gender, age-race and gender-race, and region.
Model 2 was additionally adjusted for education level, family income, smoking status, alcohol consumption, physical activity, and BMI.
Model 3 was additionally adjusted for medical histories (hypertension, diabetes, dyslipidemia, and heart disease,) and clinical measurements (CESD-4 score, systolic blood pressure, total cholesterol, HDL-cholesterol, LDL-cholesterol, triglycerides, glucose, and serum calcium concentration).
Table 3.
Associations (odds ratio and 95% confidence interval) between baseline serum magnesium and incident cognitive impairment stratified by pre-specified factors (n=2,063).a
| serum magnesium [mean (SD)] |
number of cases/participant s |
Levels of serum magnesium (mmol/L) |
P for linear trend |
||||
|---|---|---|---|---|---|---|---|
| Level 1 (<0.75) |
Level 2 (0.75 - <0.81) |
Level 3 (0.81 - <0.87) |
Level 4 (≥0.87) |
||||
| Age | |||||||
| <65 years | 0.82 (0.08) | 65/1,122 | 1 (Referent) | 0.49 (0.22, 1.10) | 0.26 (0.10, 0.65) | 0.29 (0.12, 0.74) | 0.03 |
| ≥65 years | 0.82 (0.08) | 190/941 | 1 (Referent) | 0.72 (0.41, 1.27) | 0.76 (0.43, 1.35) | 0.74 (0.41, 1.32) | 0.39 |
| P for interaction | -- | -- | 0.10 | ||||
| Gender | |||||||
| Female | 0.81 (0.08) | 123/1,137 | 1 (Referent) | 0.50 (0.26, 0.93) | 0.45 (0.23, 0.87) | 0.51 (0.26, 0.99) | 0.29 |
| Male | 0.83 (0.08) | 132/926 | 1 (Referent) | 0.76 (0.36, 1.60) | 0.75 (0.35, 1.59) | 0.82 (0.38, 1.76) | 0.33 |
| P for interaction | -- | -- | 0.77 | ||||
| Race | |||||||
| Black | 0.81 (0.08) | 104/778 | 1 (Referent) | 0.40 (0.20, 0.81) | 0.27 (0.12, 0.61) | 0.32 (0.15, 0.69) | <0.01 |
| White | 0.83 (0.08) | 151/1,285 | 1 (Referent) | 0.83 (0.43, 1.60) | 0.80 (0.41, 1.54) | 0.83 (0.42, 1.65) | 0.84 |
| P for interaction | -- | -- | 0.28 | ||||
| Serum calcium level | |||||||
| <2.49 mmol/L | 0.80 (0.08) | 119/1,028 | 1 (Referent) | 0.71 (0.38, 1.31) | 0.34 (0.16, 0.70) | 0.47 (0.23, 0.97) | 0.02 |
| ≥2.49 mmol/L | 0.84 (0.08) | 136/1,035 | 1 (Referent) | 0.54 (0.25, 1.17) | 0.80 (0.40, 1.62) | 0.76 (0.38, 1.54) | 0.95 |
| P for interaction | -- | -- | 0.37 | ||||
All models were constructed by using logistic regression models with adjustment for the covariates listed in model 3, Table 2.
In sensitivity analyses, the observed association was not substantially changed, but was attenuated when excluding 43 cases within the first 4-year follow-up [Level 2 to 4 versus Level 1: OR (95% CI) = 0.56 (0.34, 0.94), 0.58 (0.34, 0.97), 0.62 (0.37, 1.04), P for linear trend = 0.28] or excluding 129 participants with only 1 follow-up SIS measurement [Level 2 to 4 versus Level 1: OR (95% CI) = 0.62 (0.37, 1.02), 60 (0.35, 0.96), 0.67 (0.40, 1.12), P for linear trend = 0.30], presumably due to reduced statistical power. Total intake of Mg was not associated with incident cognitive impairment (data not shown). In addition, there were only 165 participants (24 incident cognitive impairment cases) having serum Mg concentration <0.70 mmol/L. Using <0.70 mmol/L as the referent, the ORs of incident cognitive impairment in level 2-4 are 0.87 (0.47, 1.59), 0.65 (0.34, 1.21), and 0.65 (0.34, 1.24). The inverse association was attenuated presumably due to reduced statistical power.
We did not find a significant association between serum Mg level and the three test battery measures (Table 4). Serum Mg level was not associated with verbal learning and memory measured by WLL and WLD, semantic fluency measured by AFT, or phonemic fluency measured by LFT test after adjustment for potential confounders in model 3.
Table 4.
Associations [mean difference (95% confidence interval)] between baseline serum magnesium levels and the three test battery.a
| Levels of serum magnesium (mmol/L) |
P for linear trend |
||||
|---|---|---|---|---|---|
| Level 1 (<0.75) |
Level 2 (0.75 - <0.81) |
Level 3 (0.81 - <0.87) |
Level 4 (≥0.87) |
||
| Word List Learning (WLL, n=1,780) | 0 (Referent) | 0.08 (−0.51, 0.67) | 0.43 (−0.15, 1.01) | 0.15 (−0.47, 0.76) | 0.56 |
| Word List Delayed Recall (WLD, n=1,780) | 0 (Referent) | 0.08 (−0.18, 0.33) | 0.10 (−0.15, 0.35) | 0.12 (−0.15, 0.38) | 0.57 |
| Animal Fluency Test (AFT, n=1,971) | 0 (Referent) | −0.17 (−0.83, 0.48) | 0.21 (−0.44, 0.86) | 0.04 (−0.65, 0.73) | 0.62 |
| Letter Fluency Test (LFT, n=2,022) | 0 (Referent) | −0.18 (−0.85, 0.49) | −0.09 (−0.75, 0.57) | −0.13 (−0.82, 0.57) | 0.48 |
Abbreviations: CI, confidence interval.
All models were constructed by using linear mixed models with the adjustment for the covariates listed in model 3, Table 2. Analyses of AFT and LFT also included covariates to adjust for whether participants who were identified in review of tape recordings received assistance from someone in their home environment or were given a disallowed prompt by the interviewer.
Discussion
In this biracial US cohort, we observed a lower incidence of global cognitive impairment, as measured by the Six Item Screener, in those with adequate baseline serum Mg status. However, we observed no association between serum Mg and other measures of domain-specific cognitive function.
Evidence from longitudinal cohort studies that investigated the long-term neurotrophic effects of Mg is sparse [15]. Our findings are generally consistent with the other cohort study conducted in the Netherlands, which found both low and high serum Mg levels were associated with an increased risk of all-cause dementia [15]. In our study, we found that, compared to those with hypomagnesemia, individuals with higher Mg level had significantly lower incidence of cognitive impairment measured by a global test. However, because of the limited number of participants with hypermagnesemia, we were not able to examine whether Mg concentration above the reference interval was associated with cognitive impairment incidence. Therefore, a U-shaped dose-response relationship may be observable in populations with more extreme serum Mg levels than this study population. In addition, lack of a U-shaped association in the present study may be due to the different study outcome. All-cause dementia that includes Alzheimer’s disease and other neurodegenerative diseases was examined in the Dutch study, while cognitive impairment defined based on an objective test, not a clinical diagnosis of Alzheimer’s disease, was examined in the present study. More longitudinal studies are warranted to confirm the nature of the relationship of Mg level with cognitive aging. But, given the limited data in human studies, the present study certainly provides important evidence that sufficient Mg status within the normal range may be beneficial to cognitive aging.
Our findings are supported by evidence from laboratory studies. Mg is essential for synaptic conduction and is required for normal functions of the nervous system by serving as a structure stabilizer for nucleic acid and proteins and a cofactor for a number of enzymes [34]. Although not fully understood, the potential neurotrophic effects of Mg on cognitive impairment are likely to be explained by its influences on the strength and pattern of synaptic transmission [35]. Mg-ion modulates synaptic strength by regulating the probability of transmitter release (e.g., glutamate release at presynaptic terminals)[36] and by controlling the initial postsynaptic depolarization through the regulation of hyper-polarization (AHP) amplitude and duration [37]. In addition, long-lasting elevation of Mg-ion levels within physiological range increases the capacity of synapses to be highly plastic by enhancing the N-methyl-D-aspartate subtype of gluta- mate receptor (NMDA-R) responses to excitatory amino acids and calcium influx [38] and by facilitating the expression of long-term potentiation (LTP) of synaptic plasticity [7, 39, 40]. Moreover, long-lasting elevation of Mg-ion causes functional improvements at synapses of the aging brain. In aged Mg-ion-treated rats, the number of functional synaptic connections was significantly increased in hippocampus compared to the aged controls [7]. Because the strength and pattern of synaptic transmission are widely believed to code memory traces [4, 41], their susceptibility to changes in Mg-ion homeostasis suggests that cognitive abilities would also be modulated by altering Mg-ion levels. In an animal study, rats treated with Mg-ion showed significant improvements of learning abilities, working memory as well as short- and long-term memory [7], suggesting that even a small change in brain Mg-ion homeostasis is capable of altering cognitive performances. Furthermore, other hypothesized pathways are oxidative stress and chronic inflammation [42, 43]. Mg deficiency has been found to increase the production of free oxygen radicals and stimulate the excessive production and release of pro-inflammatory molecules, which potentially increases the risk of cognitive impairment [44, 45].
One limitation of the study is that serum Mg level was measured only once at baseline. While a single biomarker measurement can successfully predict cognitive impairment in prospective epidemiological studies [15], we acknowledge that repeated measurements better reflect the long-term exposure and reduce intra-individual variation. Indeed, the single–exposure limitation is likely to attenuate the observed association between serum Mg level and incident cognitive impairment as well as other domain-specific cognitive tests, so the large effect size we observed might underestimate the true association. In addition, similar to other observational studies, the possibility of residual confounding and confounding from unknown or unmeasured factors cannot be completely ruled out. However, our analyses were adjusted for a variety of potential confounders suggested in literature, thus our results should not be substantially biased.
The use of serum Mg biomarker is a major advantage of this study. Mg intake can be estimated from diet. However, dietary measurement instruments such as food frequency questionnaires may not be able to capture environmental exposure such as Mg content variations in water. Thus, biomarkers at the individual level are preferred measures of mineral status. Serum Mg concentration is relatively stable over time and correlates well with intracellular free Mg-ion, a physiologically active form of the element Mg, [46] and thus it is the most frequently used measure of Mg status [47].
Conclusion
This prospective cohort study provides human data suggesting that sufficient Mg status may prevent or slow down age-related cognitive impairment. Further studies are needed to establish whether this association is causal, and to identify the possible optimal range of Mg level for cognitive health.
Supplementary Material
Acknowledgements
The authors thank the other investigators, the staff, and the participants of the REGARDS study for their valuable contributions. A full list of participating REGARDS investigators and institutions can be found at http://www.regardsstudy.org.
Funding
This study is supported by a research grant from the NIH (R01AG056111). The REGARDS research project is supported by a National Institute of Neurological Disorders and Stroke, National Institutes of Health, and Department of Health and Human Services cooperative agreement U01-NS-041588. Additional support was provided by Centers for Disease Control and Prevention cooperative agreement U01-DP-006302. The content is solely the responsibility of the authors and does not necessarily represent the official views of the National Institute of Neurological Disorders and Stroke, the National Institutes of Health, the Centers for Disease Control and Prevention, or the Department of Health and Human Services.
Footnotes
Publisher's Disclaimer: This Author Accepted Manuscript is a PDF file of an unedited peer-reviewed manuscript that has been accepted for publication but has not been copyedited or corrected. The official version of record that is published in the journal is kept up to date and so may therefore differ from this version.
Conflicts of interest
None.
References
- 1.Wimo A, Jonsson L, Bond J, Prince M, Winblad B, Alzheimer Disease I (2013) The worldwide economic impact of dementia 2010. Alzheimers Dement 9(1): 1–11 e13. doi: 10.1016/j.jalz.2012.11.006 [DOI] [PubMed] [Google Scholar]
- 2.Karri V, Schuhmacher M, Kumar V (2016) Heavy metals (Pb, Cd, As and MeHg) as risk factors for cognitive dysfunction: A general review of metal mixture mechanism in brain. Environ Toxicol Pharmacol 48:203–213. doi: 10.1016/j.etap.2016.09.016 [DOI] [PubMed] [Google Scholar]
- 3.Poenaru S, Manicom R, Rouhani S et al. (1997) Stability of brain content of magnesium in experimental hypomagnesemia. Brain Res 769(2):329–332. [DOI] [PubMed] [Google Scholar]
- 4.Kim SJ, Linden DJ (2007) Ubiquitous plasticity and memory storage. Neuron 56(4):582–592. doi: 10.1016/j.neuron.2007.10.030 [DOI] [PubMed] [Google Scholar]
- 5.Lisman JE, McIntyre CC (2001) Synaptic plasticity: a molecular memory switch. Curr Biol 11(19):R788–791. [DOI] [PubMed] [Google Scholar]
- 6.Roberts EL Jr. (1999) Using hippocampal slices to study how aging alters ion regulation in brain tissue. Methods 18(2):150–159. doi: 10.1006/meth.1999.0768 [DOI] [PubMed] [Google Scholar]
- 7.Slutsky I, Abumaria N, Wu LJ et al. (2010) Enhancement of learning and memory by elevating brain magnesium. Neuron 65(2): 165–177. doi: 10.1016/j.neuron.2009.12.026 [DOI] [PubMed] [Google Scholar]
- 8.Huang Y, Huang X, Zhang L et al. (2018) Magnesium boosts the memory restorative effect of environmental enrichment in Alzheimer's disease mice. CNS Neurosci Ther 24(1):70–79. doi: 10.1111/cns.12775 [DOI] [PMC free article] [PubMed] [Google Scholar]
- 9.Bardgett ME, Schultheis PJ, Muzny A, Riddle MD, Wagge JR (2007) Magnesium deficiency reduces fear-induced conditional lick suppression in mice. Magnes Res 20(1):58–65. [PubMed] [Google Scholar]
- 10.Balmus IM, Strungaru SA, Ciobica A et al. (2017) Preliminary data on the interaction between some biometals and oxidative stress status in mild cognitive impairment and Alzheimer's disease patients. Oxid Med Cell Longev 2017:7156928. doi: 10.1155/2017/7156928 [DOI] [PMC free article] [PubMed] [Google Scholar]
- 11.Barbagallo M, Belvedere M, Di Bella G, Dominguez LJ (2011) Altered ionized magnesium levels in mild-to-moderate Alzheimer's disease. Magnes Res 24(3):S115–121. doi: 10.1684/mrh.2011.0287 [DOI] [PubMed] [Google Scholar]
- 12.Veronese N, Zurlo A, Solmi M et al. (2016) Magnesium status in Alzheimer's disease: A systematic review. Am J Alzheimers Dis Other Demen 31(3):208–213. doi: 10.1177/1533317515602674 [DOI] [PMC free article] [PubMed] [Google Scholar]
- 13.Cilliler AE, Ozturk S, Ozbakir S (2007) Serum magnesium level and clinical deterioration in Alzheimer's disease. Gerontology 53(6):419–422. doi: 10.1159/000110873 [DOI] [PubMed] [Google Scholar]
- 14.Corsonello A, Pedone C, Pahor M et al. (2001) Serum magnesium levels and cognitive impairment in hospitalized hypertensive patients. Magnes Res 14(4):273–282. [PubMed] [Google Scholar]
- 15.Kieboom BCT, Licher S, Wolters FJ et al. (2017) Serum magnesium is associated with the risk of dementia. Neurology 89(16):1716–1722. doi: 10.1212/wnl.0000000000004517 [DOI] [PubMed] [Google Scholar]
- 16.Howard VJ, Cushman M, Pulley L et al. (2005) The Reasons for Geographic and Racial Differences in Stroke study: objectives and design. Neuroepidemiology 25(3): 135–143. doi: 10.1159/000086678 [DOI] [PubMed] [Google Scholar]
- 17.Cai J, Zeng D (2004) Sample size/power calculation for case-cohort studies. Biometrics 60(4): 1015–1024. [DOI] [PubMed] [Google Scholar]
- 18.Cushman M, Jenny NS, Zakai NA et al. (2014) N-terminal pro-B-type natriuretic peptide and stroke risk: the Reasons for Geographic and Racial Differences in Stroke cohort. Stroke 45(6): 1646–1650. doi: 10.1161/STROKEAHA.114.004712 [DOI] [PMC free article] [PubMed] [Google Scholar]
- 19.Kabagambe EK, Judd SE, Howard VJ et al. (2011) Inflammation biomarkers and risk of all-cause mortality in the Reasons for Geographic And Racial Differences in Stroke cohort. Am J Epidemiol 174(3):284–292. doi: 10.1093/aje/kwr085 [DOI] [PMC free article] [PubMed] [Google Scholar]
- 20.Chen C, Xun P, McClure LA et al. (2018) Serum mercury concentration and the risk of ischemic stroke: The REasons for Geographic and Racial Differences in Stroke Trace Element Study. Environ Int 117:125–131. doi: 10.1016/j.envint.2018.05.001 [DOI] [PMC free article] [PubMed] [Google Scholar]
- 21.Cushman M, McClure LA, Howard VJ, Jenny NS, Lakoski SG, Howard G (2009) Implications of increased C-reactive protein for cardiovascular risk stratification in black and white men and women in the US. Clin Chem 55(9):1627–1636. doi: 10.1373/clinchem.2008.122093 [DOI] [PMC free article] [PubMed] [Google Scholar]
- 22.Callahan CM, Unverzagt FW, Hui SL, Perkins AJ, Hendrie HC (2002) Six-item screener to identify cognitive impairment among potential subjects for clinical research. Med Care 40(9):771–781. doi: 10.1097/01.mlr.0000024610.33213.c8 [DOI] [PubMed] [Google Scholar]
- 23.Morris JC, Mohs RC, Rogers H, Fillenbaum G, Heyman A (1988) Consortium to establish a registry for Alzheimer's disease (CERAD) clinical and neuropsychological assessment of Alzheimer's disease. Psychopharmacol Bull 24(4):641–652. [PubMed] [Google Scholar]
- 24.Rosen WG (1980) Verbal fluency in aging and dementia. J Clin Exp Neuropsychol 2(2): 135–146. [Google Scholar]
- 25.Benton AL, Sivan AB, deS Hamsher K, Varney NR. Contributions to neuropsychological assessment: A clinical manual: Oxford University Press, USA; 1994. [Google Scholar]
- 26.Hachinski V, Iadecola C, Petersen RC et al. (2006) National Institute of Neurological Disorders and Stroke-Canadian Stroke Network vascular cognitive impairment harmonization standards. Stroke 37(9):2220–2241. doi: 10.1161/01.Str.0000237236.88823.47 [DOI] [PubMed] [Google Scholar]
- 27.Gillett SR, Thacker EL, Letter AJ et al. (2015) Correlates of incident cognitive impairment in the REasons for Geographic and Racial Differences in Stroke (REGARDS) study. Clin Neuropsychol 29(4):466–486. doi: 10.1080/13854046.2015.1042524 [DOI] [PMC free article] [PubMed] [Google Scholar]
- 28.Pearson KE, Wadley VG, McClure LA, Shikany JM, Unverzagt FW, Judd SE (2016) Dietary patterns are associated with cognitive function in the REasons for Geographic And Racial Differences in Stroke (REGARDS) cohort. J Nutr Sci 5:e38. doi: 10.1017/jns.2016.27 [DOI] [PMC free article] [PubMed] [Google Scholar]
- 29.Kohout FJ, Berkman LF, Evans DA, Cornoni-Huntley J (1993) Two shorter forms of the CES-D (Center for Epidemiological Studies Depression) depression symptoms index. J Aging Health 5(2): 179–193. doi: 10.1177/089826439300500202 [DOI] [PubMed] [Google Scholar]
- 30.Lowenstein FW, Stanton MF (1986) Serum magnesium levels in the United States, 1971-1974. J Am Coll Nutr 5(4):399–414. doi: 10.1080/07315724.1986.10720143 [DOI] [PubMed] [Google Scholar]
- 31.Costello RB, Elin RJ, Rosanoff A et al. (2016) Perspective: The case for an evidence-based reference interval for serum magnesium: The time has come. Adv Nutr 7(6):977–993. doi: 10.3945/an.116.012765 [DOI] [PMC free article] [PubMed] [Google Scholar]
- 32.Wilmott LA, Thompson LT (2013) Sex- and dose-dependent effects of post-trial calcium channel blockade by magnesium chloride on memory for inhibitory avoidance conditioning. Behav Brain Res 257:49–53. doi: 10.1016/j.bbr.2013.09.047 [DOI] [PubMed] [Google Scholar]
- 33.Levine DA, Galecki AT, Langa KM et al. (2015) Trajectory of cognitive decline after incident stroke. JAMA 314(1):41–51. doi: 10.1001/jama.2015.6968 [DOI] [PMC free article] [PubMed] [Google Scholar]
- 34.Chui D, Chen Z, Yu J et al. Magnesium in Alzheimer's disease. In: Vink R, Nechifor M, editors. Magnesium in the Central Nervous System. Adelaide (AU): University of Adelaide Press (c); 2011. [PubMed] [Google Scholar]
- 35.Billard JM. Brain free magnesium homeostasis as a target for reducing cognitive aging. In: Vink R, Nechifor M, editors. Magnesium in the Central Nervous System. Adelaide (AU): University of Adelaide Press (c); 2011. [PubMed] [Google Scholar]
- 36.Furukawa Y, Kasai N, Torimitsu K (2009) Effect of Mg2+ on neural activity of rat cortical and hippocampal neurons in vitro. Magnes Res 22(3):174s–181s. [PubMed] [Google Scholar]
- 37.Landfield PW, Morgan GA (1984) Chronically elevating plasma Mg2+ improves hippocampal frequency potentiation and reversal learning in aged and young rats. Brain Res 322(1): 167–171. [DOI] [PubMed] [Google Scholar]
- 38.Matsuda H, Saigusa A, Irisawa H (1987) Ohmic conductance through the inwardly rectifying K channel and blocking by internal Mg2+. Nature 325(7000): 156–159. doi: 10.1038/325156a0 [DOI] [PubMed] [Google Scholar]
- 39.Slutsky I, Sadeghpour S, Li B, Liu G (2004) Enhancement of synaptic plasticity through chronically reduced Ca2+ flux during uncorrelated activity. Neuron 44(5):835–849. doi: 10.1016/j.neuron.2004.11.013 [DOI] [PubMed] [Google Scholar]
- 40.Xu ZP, Li L, Bao J et al. (2014) Magnesium protects cognitive functions and synaptic plasticity in streptozotocin-induced sporadic Alzheimer's model. PLoS One 9(9):e108645. doi: 10.1371/journal.pone.0108645 [DOI] [PMC free article] [PubMed] [Google Scholar]
- 41.Neves G, Cooke SF, Bliss TV (2008) Synaptic plasticity, memory and the hippocampus: a neural network approach to causality. Nat Rev Neurosci 9(1):65–75. doi: 10.1038/nrn2303 [DOI] [PubMed] [Google Scholar]
- 42.Hans CP, Chaudhary DP, Bansal DD (2003) Effect of magnesium supplementation on oxidative stress in alloxanic diabetic rats. Magnes Res 16(1): 13–19. [PubMed] [Google Scholar]
- 43.Yang Y, Wu Z, Chen Y et al. (2006) Magnesium deficiency enhances hydrogen peroxide production and oxidative damage in chick embryo hepatocyte in vitro. Biometals 19(1):71–81. doi: 10.1007/s10534-005-6898-1 [DOI] [PubMed] [Google Scholar]
- 44.Nielsen FH (2018) Magnesium deficiency and increased inflammation: current perspectives. J Inflamm Res 11:25–34. doi: 10.2147/jir.s136742 [DOI] [PMC free article] [PubMed] [Google Scholar]
- 45.Morais JB, Severo JS, Santos LR et al. (2017) Role of magnesium in oxidative stress in individuals with obesity. Biol Trace Elem Res 176(1):20–26. doi: 10.1007/s12011-016-0793-1 [DOI] [PubMed] [Google Scholar]
- 46.Malon A, Brockmann C, Fijalkowska-Morawska J, Rob P, Maj-Zurawska M (2004) Ionized magnesium in erythrocytes--the best magnesium parameter to observe hypo- or hypermagnesemia. Clin Chim Acta 349(1-2):67–73. doi: 10.1016/j.cccn.2004.06.006 [DOI] [PubMed] [Google Scholar]
- 47.Reddy ST, Soman SS, Yee J (2018) Magnesium balance and measurement. Adv Chronic Kidney Dis 25(3):224–229. doi: 10.1053/j.ackd.2018.03.002 [DOI] [PubMed] [Google Scholar]
Associated Data
This section collects any data citations, data availability statements, or supplementary materials included in this article.