Abstract
Eye and head movements are used to scan the environment when driving. In particular, when approaching an intersection, large gaze scans to the left and right, comprising of head and multiple eye movements, are made. We detail an algorithm called the gaze scan algorithm that automatically quantifies the magnitude, duration, and composition of such large lateral gaze scans. The algorithm works by first detecting lateral saccades, then merging these lateral saccades into gaze scans, with the start and end point of each gaze scan marked in time and eccentricity. We evaluated the algorithm by comparing gaze scans generated by the algorithm to manually-marked ‘consensus ground truth’ gaze scans taken from gaze data collected in a high-fidelity driving simulator. We found that the gaze scan algorithm successfully marked 96% of gaze scans, produced magnitudes and durations close to ground truth, and the differences between the algorithm and ground truth were similar to the differences found between expert coders. Therefore, the algorithm may be used in lieu of manual marking of gaze data, significantly accelerating the time consuming marking of gaze movement data in driving simulator studies. The algorithm also complements existing eye tracking and mobility research by quantifying the number, direction, magnitude and timing of gaze scans and can be used to better understand how individuals scan their environment.
Keywords: gaze tracking, eye and head scanning, eye movement event detection, driving simulation
1. Introduction
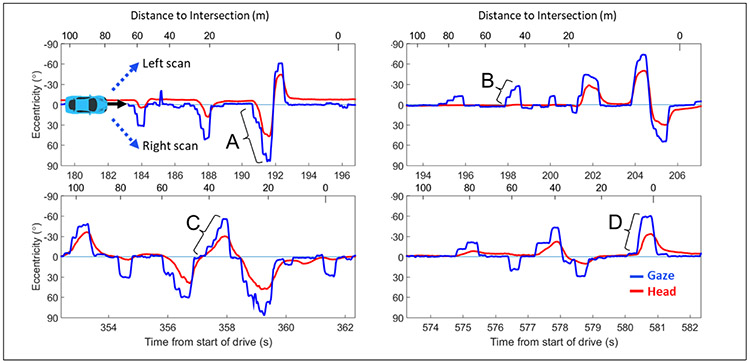
When driving we use head and eye movements to scan the environment to search for potential hazards and to navigate. Scanning is especially important when approaching intersections, where a large field of view (e.g., 180° at a T-intersection) needs to be checked for vehicles, pedestrians, and other road users. Typically, drivers make left and right scans that start near and return to the straight ahead position. The scans become increasingly larger in magnitude as the driver approaches an intersection with larger scans requiring different numbers and sizes of eye and head movements (Figure 1). Insufficient scanning has been suggested as one mechanism for increased crash risk at intersections (Hakamies-Blomqvist, 1993). Previous studies have reported that older adults scan insufficiently at intersections compared to younger adults in on-road driving (Bao & Boyle, 2009a) and in a driving simulator (Romoser & Fisher, 2009; Romoser, Pollatsek, Fisher, & Williams, 2013; Savage et al., 2017; Bowers et al., 2019; Savage et al., Revise and Resubmit). Individuals with vision loss have also been found to demonstrate scanning deficits at intersections in a driving simulator (Bowers, Ananyev, Mandel, Goldstein, & Peli, 2014). These studies and analyses of police crash reports (McKnight & McKnight, 2003; Braitman, Kirley, McCartt, & Chaundhry, 2008) suggest that scanning plays an important role in driving and that quantifying scanning may provide insights into why some individuals fail to detect hazards at intersections. Here, we are interested in quantifying visual scanning as lateral gaze scans, which encompass all of the gaze movements (the combination of eye and head movements) that extend horizontally from the starting point near the straight ahead positon to the maximally eccentric gaze position. This research extends our previous quantification of head scans (Bowers et al., 2014) by taking account of eye position as well as head position to characterize gaze scanning while driving.
Figure 1.
Examples of the diversity of individuals’ scanning patterns on approach to an intersection (gaze = blue, head = red). Sections of these plots will be used in subsequent figures to illustrate different aspects of the gaze scan algorithm. Each plot shows data from 100 to 0 m before the intersection. The black arrow in front of the car in the top left plot indicates the travel direction (i.e. left to right means forward in time). Participants decelerated at different rates, hence the different spacings between tick marks on the top (distance-to-intersection) axis. The dotted blue arrows in the top left plot indicate the direction of the gaze and head scans. Any scan below 0° eccentricity is a scan to the left and any scan above 0° eccentricity is a scan to the right. Some gaze scans were made with large head movements (e.g. A), while others were made without any head movements (e.g. B). Some large (60°) scans were slow and comprised of multiple saccades (e.g., C) while others were quick and comprised of only one saccade (e.g., D).
Studies have used different techniques to combine eye and head tracking when driving to better understand how drivers scan while approaching an intersection. One approach is to quantify the standard deviation of the horizontal displacements in gaze to capture effects such as visual tunneling, or the lack of looking into the periphery (Sodhi, Reimer, & Llamazares, 2002; Reimer 2009). One limitation of this approach is that it does not quantify how many times someone scanned to the left or right nor does it provide information about the gaze movements that compose the scan. Some studies have quantified scanning by manually counting discrete head turns while participants were driving (Keskinen, Ota, & Katila, 1998; Romoser & Fisher, 2009; Bao & Boyle, 2009b; Romoser, Fisher, Mourant, Wachtel, & Sizov, 2005). However, categorizing scans as only ‘left’ or ‘right’ fails to capture the magnitude of those scans and how those scans were made (i.e. the composition of head and eye movements). Other studies have quantified scanning by overlaying eye position onto video of the driving scene to manually determine the location of lateral gaze movements (Romoser, Pollatsek, Fisher, & Williams, 2013) or by manually marking the start and end of lateral gaze movements (Alberti, Goldstein, Peli, & Bowers, 2017). While manual marking of gaze movements is common in the literature, it is extremely time consuming, especially when the individual doing the marking must look through video frame by frame, and could be prone to potential inconsistencies when there are multiple individuals marking gaze movements. An alternative to manual marking is automatic detection of gaze movements using an algorithm, which could mark eye and head movements in lieu of manual marking altogether. The algorithm could also be used to parse data into simpler chunks for expert coders (Munn, Stefano, & Pelz, 2008).
Bowers and colleagues (2014) created an algorithm that automatically quantified the magnitude, direction, and numbers of lateral head scans on approach to intersections. That algorithm detected large discrete rotations that took head eccentricity at least 4° away from the straight ahead position for at least 0.2 s. While that algorithm successfully marked large lateral head movements, it did not account for eye position. To fully understand scanning behaviors when driving, we need to be able to quantify gaze movements, which are the combination of head-in-world and eye-in-head movements. Gaze movements differ from head movements in driving: they tend to have faster velocities, extend further laterally, and are often composed of multiple discrete saccades and fixations that resemble staircases (e.g., scan C in Figure 1). Given the differences between gaze and head movements when scanning, the head movement detection algorithm (Bowers et al., 2014) is not suitable for marking lateral gaze movements.
Alternatively, one could utilize eye tracking event detection algorithms (e.g. Salvucci & Goldberg, 2000; Nyström & Holmqvist, 2010) that detect fixations and saccadic eye movements. However, these algorithms are not appropriate by themselves for detecting gaze events for two reasons. Firstly, gaze movements that exceed the typical oculomotor range (±50°) are slower than smaller gaze movements given that at least part of the gaze movement must be composed of head rotation (Barnes, 1979; Guitton & Volle, 1987). Therefore, the parameters for detecting saccades from gaze will likely differ from the parameters typically used for detecting eye-only saccades. Secondly, event detection may capture the eye movements that compose a gaze scan, but additional steps would be required for these markings to be interpretable for large gaze scans. For example, to know how far an individual looked, which may be a gaze scan composed of multiple saccades, one would need to determine from the series of saccades which was the most eccentric, requiring additional computation beyond simply marking each saccade. Therefore, we define and measure gaze scans as the entire horizontal movement of the eyes plus head that can be composed of one or more saccades. Here we present an algorithm called the gaze scan algorithm that automatically marks gaze scans by merging neighboring saccades into a single gaze scan that ends at the most eccentric gaze location.
The goal of this algorithm is to mark the start and end of each gaze scan in time and eccentricity in order to quantify the direction, timing, magnitude, and composition of the gaze scan. Our approach to marking gaze scans is reductionist: first, we take a subset (bracketing a known event or section of road) of gaze data, isolate saccades, and then merge those saccades into gaze scans. This approach has several advantages: 1) it is based on gaze movements and not head movements which is important because not all gaze movements have a head component (see Figure 1; Savage et al., Revise and Resubmit), 2) the merging of saccades is independent of sampling rate and can be paired with any event-detection algorithm, 3) provides information about the saccades that compose the gaze scans, and 4) can be used to quantify the number of gaze scans, regardless of the magnitude or duration of the gaze scan. In order to develop and evaluate this algorithm, the algorithm’s marking of gaze scans was compared to manually marked gaze scans from data collected while participants drove in a high-fidelity driving simulator. A successful outcome would enable much more efficient processing of gaze data in future driving simulator studies.
2. Materials and Methods
2.1. Participants
The gaze scan algorithm was evaluated using data from a previous study (Savage et al., Revise and Resubmit), approved by the institutional review board at the Schepens Eye Research Institute. Given the large number of scans in the original data set and the time consuming nature of manual marking, a subset of the data were used in the evaluation of the algorithm. Data were pseudo-randomly selected from the original dataset to ensure a mix of gender and age in the sample. In total 19 drives from 13 unique participants out of the original 29 participants were selected. These 13 participants had been recruited from local advertisements (IRB-approved) and from a database of participants who had participated in previous studies or were interested in participation. They were current drivers with at least two years of driving experience, average binocular visual acuity of 20/20, and no self-reported adverse ocular history. Six of the 19 drives were from female drivers and six of the drives were from older drivers (+65 years old) compared to those from younger drivers (20-40 years old), which are similar to the proportion of demographics in Savage et al. The data from these 19 drives were split into data sets that are described further in section 3.2.
2.2. Apparatus
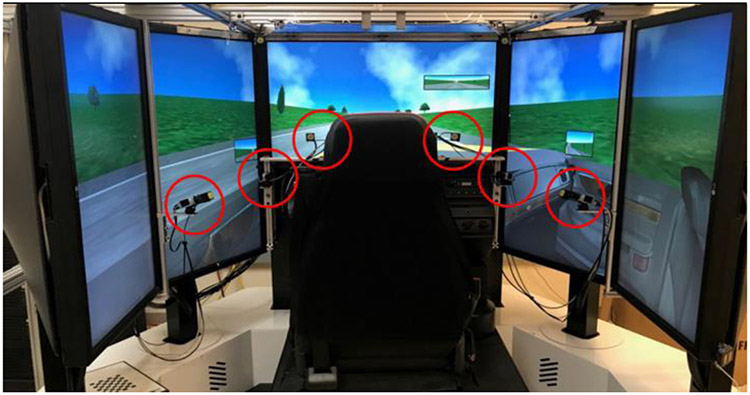
The driving simulator (LE-1500, FAAC Corp, Ann Arbor, MI) presented a virtual world at 30 Hz onto five, 42-inch liquid-crystal display (LCD) monitors (LG M4212C-BA, native resolution of 1366 x 768 pixels per monitor; LG Electronics, Seoul, South Korea) that offered approximately 225° horizontal field of view of the virtual world (Figure 2). The simulator was fully controlled by the participant in a cab, which included a steering wheel, gear shifter, air conditioning, turn signal, rear and side mirrors (inset on the monitors), speedometer (inset on the central monitor), and a motion seat. The virtual environment was created with Scenario Toolbox software (version 3.9.4. 25873, FAAC Incorporated) and was set in a light industrial virtual world consisting of an urban environment with roads set out on a grid system with many four-way (+) and three-way (T) intersections. The world contained a variety of buildings, other traffic on the road, and signage (e.g. stop signs, traffic lights). All participants drove the same route through 42 intersections and approximately half of these intersections included crosstraffic that appeared on the left, right, or straight ahead (see Savage et al. for details).
Figure 2.
Image of the driving simulator equipped with 6 cameras (red circles) located around the driver’s seat (two on the left, two on the right, and two in the center), which enabled recording of lateral eye and head position up to 90° to the left and right of the driver.
While driving in the virtual world, head and eye movements were tracked across 180° (90° to the left and right of the straight ahead position), which is sufficient for capturing large lateral eye and head scans on approach to intersections. Eye and head positions were recorded at 60 Hz with a remote, digital 6-camera tracking system (Smart Eye Pro Version 6.1, Goteborg, Sweden, 2015) located around the participant (see Figure 2, red circles). Gaze tracking was achieved using the pupil corneal reflection and estimating the combined position and direction of a 3D profile of both eyes. Head tracking was achieved automatically by creating a 3D profile of the participant’s face using salient features (e.g. eye corners, nostrils, mouth corners, and ears) to capture the position and direction of the head. Following data collection, the eye and heading tracking data and the driving simulator data were synchronized via time stamps.
2.3. Procedure
Participants drove through an acclimatization drive and practice drive (approximately 8 to 10 minutes each) to become familiar with driving the simulator. Participants were instructed to drive (speed capped at 35 mph) as they would in the real world, obey traffic rules, and press the horn whenever they saw a motorcycle (included motorcycle hazards approaching from a cross road at 16 intersections). Participants were not given any instructions regarding how or when to scan. Prior to the experimental drives, each camera’s position was adjusted sequentially to capture as much of the face as possible in the camera’s field of view, followed by any necessary adjustments to the aperture and focus. The cameras were calibrated with a checkerboard pattern that was presented to each camera from the location of the driver’s head. The head position was tracked automatically after camera calibration by detecting features of the participant’s face. The eyes were calibrated with 5 points on the center screen in the driving simulator. Verification of the calibrations resulted in a median accuracy of 2.6° and precision of 1.6° for the 5 calibration points. In each of the two experimental drives, participants drove through 42 pre-determined intersections in the same virtual city. For the purposes of this paper, we only considered data that corresponded to 100 m before and up to the white line at T and + intersections (total of 32 intersections per drive, half of which contained hazards). For a full description of the procedure, see Savage et al. (Revise and Resubmit).
2.4. Post processing
Following data collection, data were processed in MATLAB (Mathworks, R2015a). Eye movement data are typically contaminated with data loss (i.e., loss of tracking, or sections where the eyes could not be tracked) and noise. To remove these irregularities, we implemented an aggressive outlier removal process using two sequential all-zero (finite impulse response: FIR) filters (we used the Matlab function filtfilt.m with window sizes of 33 and 66 ms respectively). Median filtering was chosen because it does not alter any data and preserves high frequency events. We first removed large outliers and then smaller ones by removing data points that differed by 16° between raw and filtered. Sometimes neighboring points were influenced by large outliers, so we repeated this step using a threshold of 8°. We then removed any remaining data points with velocities that exceeded the physical limits of eye movements. Unphysical velocities were defined as velocities that exceeded thresholds from the main sequence as described in Bahill et al. (1975), given an assumed fixed relationship between saccade magnitude and peak velocity. These processing steps were applied to all data and data points that were missing due to loss of tracking or removed because of noise and were replaced using a linear interpolation. The 60 Hz data were then smoothed with a Savitzky-Golay filter (sgolayfilt.m, with filter order = 3, filter length = 0.117 ms [7 samples]) to preserve high-frequency peaks (Savitzky & Golay, 1964; Nyström & Holmqvist, 2010). Post-processed data were used during manual marking and for processing gaze scans using the gaze scan algorithm.
3. Gaze scan algorithm
3.1. Defining a gaze scan
When approaching an intersection, gaze movements typically start from and return to close to the straight ahead position (Figure 1). We therefore define a gaze scan as any lateral gaze movement that takes the eyes away from the straight ahead position (i.e. 0°) into the periphery. Gaze scans could be composed of a single or multiple saccadic gaze movements (e.g. see Figure 1) and were always defined as the whole movement from the starting point near straight ahead to the maximum eccentricity towards the left (defined as gaze scans between 0° and −90° eccentricity) or right (gaze scans between 0° and 90° eccentricity). Gaze movements that returned to 0°, which we define as return gaze scans were not analyzed here because it is only the scans headed away from the straight ahead position that capture the extent of lateral scans. In some instances, the return gaze scan did not stop at the straight ahead position, but continued to the opposite side. Any such gaze scans that crossed the straight ahead position (0°) were split into one return and one away gaze scan (see section 3.3.2). Thus, gaze scans contain side (i.e. on the left or right side of 0°) and direction (i.e. towards the left or right side of 0°) information. Each gaze scan has a start and end time and eccentricity. The duration of a gaze scan was calculated as the difference in time between the start and end of the gaze scan. The magnitude of a gaze scan was calculated as the difference in eccentricity between the start and end of the gaze scan. Given this information, other variables could be defined with respect to the timing of a gaze scan, such as the size of the head movement component of the gaze scan, or the speed and distance of the car to the intersection at the time of the start of the gaze scan.
3.2. Manually marked gaze scans
Three authors (G.S., S.W S., and L.Z.) manually marked gaze data from the 19 selected drives which were randomly split between two sets of data (see Table 1). The first set (ground-truth data set) was used to optimize and evaluate the gaze scan algorithm and contained manually marked gaze scans that the three expert coders agreed upon (i.e., consensus marking with all three coders in the same room viewing the same monitor). This set was further split pseudo-randomly by drive (i.e., total driving route) into a training set for the optimization of the gaze scan algorithm, and a testing set for the evaluation of the gaze scan algorithm. The second set (coders’ data set) was used to quantify the variance in marking between the three expert manual coders and contained manually marked gaze scans that the three expert coders marked individually. A total of 4246 gaze scans were marked, which corresponded to 6873 seconds of driving data (see Table 1 for details).
Table 1.
Details of Ground-truth and Coders’ data sets
| Type of manual marking |
Number of drives |
Number of gaze scans |
Duration of driving data (seconds) |
Purpose | |
|---|---|---|---|---|---|
| Ground Truth data Training set |
Consensus | 8 | 2322 | 3461 | Optimize gaze scan algorithm merging parameter |
| Ground Truth data Testing set |
Consensus | 4 | 1094 | 1861 | Evaluation of gaze scan algorithm performance |
| Coders’ data | Individual | 7 | 830 | 1551 | Estimate expected variance between coders when manual marking |
Methods for manual marking:
Using the post-processed data, the three expert coders manually marked gaze scans headed away from the straight ahead position using a custom MATLAB GUI that presented lateral gaze and head eccentricity and the time the driver entered an intersection. Manual coders marked gaze scans from subsets of the data that corresponded to when the driver was approximately 100 m before and up to the time the driver entered the intersection (crossed the white line of each intersection), which resulted in approximately 13.5 seconds (st.d. = 3 seconds) of data being presented at a time on the x-axis. The y-axis range was the same on all plots, set from −90° to 90° to capture all possible horizontal gaze movements. This format was exactly the same as the presentations in Figure 1. The three expert coders marked gaze scans sequentially by selecting the eccentricity and time a gaze scan started and then ended according to our definition of a gaze scan (section 3.1). This was achieved by clicking on the graph twice (first for the start and second for the end of a gaze scan), and then clicking a third button that connected the two points to create a gaze scan. Only gaze scans heading away from the straight ahead position were marked. Large gaze scans returning towards the straight ahead position and long fixations or smooth pursuits between large gaze scans were used to sepa- rate one gaze scan from another. After marking all of the gaze scans, the GUI generated an output file with the start time, end time, start eccentricity, and end eccentricity from which gaze scan magnitude, gaze scan duration, and other variables could be calculated and compared to the gaze scan algorithm.
Gaze scan matching:
We developed a procedure to match gaze scans. This procedure was used to match the algorithm to the ground truth and to match gaze scans between two different coders. The below description thus matches gaze scans from set B (e.g., algorithm) to set A (e.g., ground truth). Matching was done based on the scan start time, end time, and the midpoint between the start and end times.
For a given scan in set A, we searched all of set B’s scans for those with a midpoint between the start and end time of the given scan in set A. We also searched all of set B’s scans for those with a start and end time that contained the midpoint for the given scan in set A.
If the initial searches returned a single scan from set B, we next checked if the start and end time of that scan in set B contained the midpoint of multiple scans from set A. If so, then those scans were paired with the single scan in a many-to-one match (section 3.4). Otherwise it was designated as a one-to-one match. If the initial searches returned multiple scans from set B, then those scans were paired with the given scan in set A as a one-to-many match (section 3.4).
When matching scans from set B to set A, the procedure only included those scans from set A that had no prior matching scans to set B. That is, for a scan in set A already paired in a many-to-one match, that scan did not go the matching procedure again. The matching procedure may return some scans in set A and set B with no matches.
Ground-truth data set:
For each manually-marked gaze scan, consensus between the three expert coders was required before accepting the gaze scan to be part of the ground-truth data set. Consensus was achieved by having all three expert coders view the same image simultaneously and having at least two out of three coders agree on the start and end of each gaze scan. The scans from the algorithm that could not be matched with any ground truth scan, and vice versa, were omitted from analyses. Only a small percentage of the ground truth scans were omitted from analyses (testing set = 2.0%) with the majority of these being cases where the algorithm did not mark the gaze data as being a saccade (testing set = 75.9%) or cases where the algorithm and manual marking were offset in time and thereby not properly paired (testing set = 24.1%).
Coders’ data set:
These gaze data were independently marked by the three expert coders and then used to quantify the level of agreement amongst them in their manual markings. This provided a comparison for the level of agreement between the gaze scan algorithm and the ground-truth testing set. In the coders’ data set, approximately 16% of the gaze scans were omitted from our analyses because there was no matching gaze scan from either of the other manual coders.
3.3. Gaze scan algorithm implementation
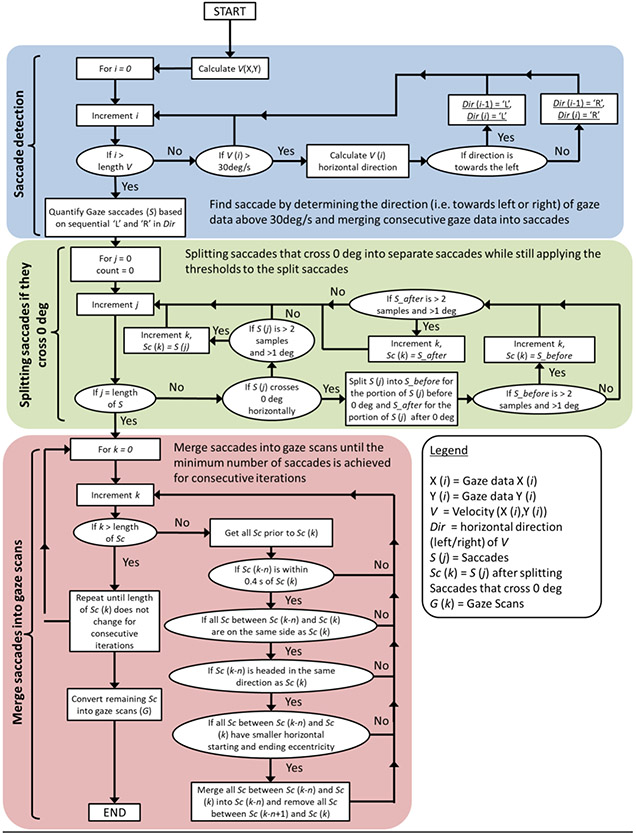
The gaze scan algorithm was implemented in MATLAB (Mathworks, R2015a). The gaze scan algorithm automatically marked gaze scans in two stages. First, gaze data were reduced to saccades (defined in next section, 3.3.1). The second stage of the gaze scan algorithm was to merge the sequences of saccades into gaze scans based on a set of rules. A detailed diagram for how the algorithm processes data is provided in the Appendix (section A.1). Furthermore, code for the gaze scan algorithm and manual marking can be downloaded from https://osf.io/p6jqn/.
3.3.1. First stage of Gaze scan algorithm – Saccade detection
Saccades (Figure A.3 in Appendix A.3) were found by calculating the velocity between each gaze sample using the smoothed eccentricity and time. If two points had a velocity greater than 30 °/s, then both samples were marked as belonging to a saccade. To capture onset and offset velocities of saccades, we opted for a velocity threshold below what is typically used for detecting eye saccades (e.g. 75 °/s; Smeets & Hooge, 2003), given that large saccades that have a head movement component may have slower velocities than eye saccades without any head movement component (Barnes, 1979; Guitton & Volle, 1987). A similar 30 °/s velocity threshold for detection of saccades has also been used in other studies involving driving simulation and gaze tracking (e.g. Hamel et al., 2013; Bahnemann, et al., 2015). Only neighboring data points that exceeded the velocity threshold and were headed in the same direction were combined to form a saccade. The onset and offset of a saccade was defined by the first and last data point. Saccades that had a lateral magnitude smaller than 1° or were shorter than 2 samples (0.033 s) were removed in order to minimize the likelihood of marking noise as a saccade (see Beintema, Van Loon, & Van Den Berg, 2005 for a similar approach).
3.3.2. Crossing zero line
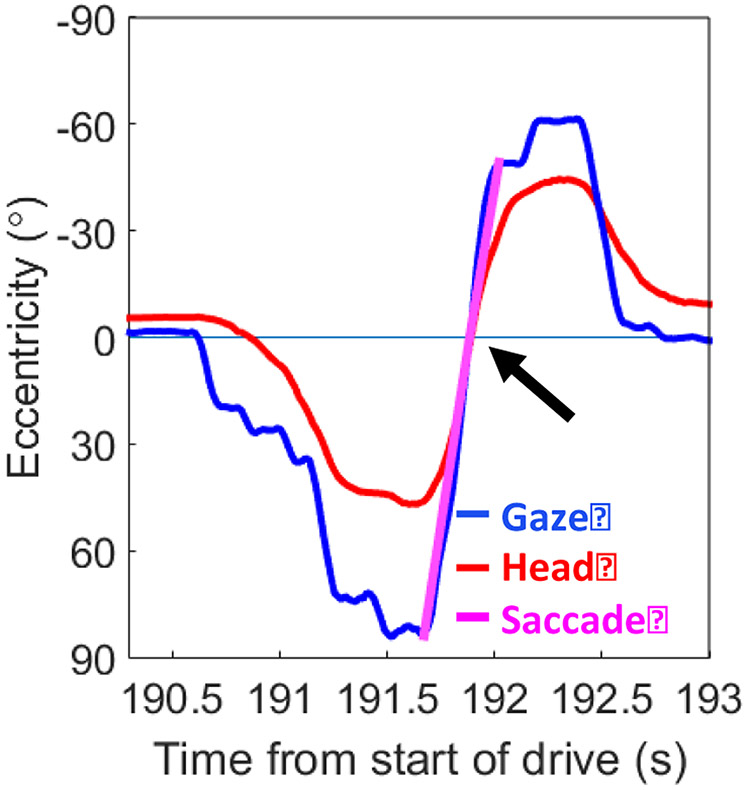
While the majority of the gaze scans start and end near the straight ahead position (0°), some saccades from gaze scans cross 0°. Saccades that crossed the straight ahead position were split into two saccades (Figure 3). By splitting saccades with respect to the straight ahead position, we can directly compare left and right gaze behavior with objects that appear on the left and right in the environment. Furthermore, in a post-hoc analysis, over 70% of the gaze scans started within 7° of the straight ahead position. When splitting saccades that cross 0°, the new first saccade now contained a linearly interpolated gaze and time value immediately before the cross over, while the new second saccade now contained the value immediately after the cross over. Because the saccade was split into two new saccades, it necessitated that the two new saccades still satisfied the thresholds for saccade detection (section 3.3.1). Any new saccade created after splitting two saccades that no longer satisfied the rules was no longer categorized as a saccade.
Figure 3.
Zoomed in data from Figure 1 (upper left plot), illustrating where a saccade is split when crossing 0°.
3.3.3. Second stage of gaze scan algorithm – merging saccades into scans
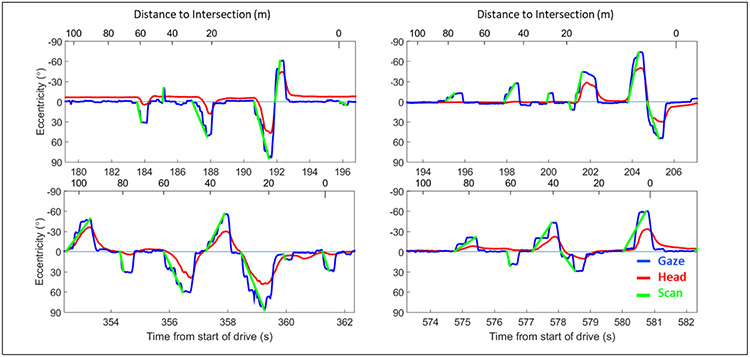
The sequence of saccades was next merged into gaze scans (Figure 4). Any two saccades could be merged to form a gaze scan headed away from 0°. Merging occurred by comparing two saccades and merging those saccades if they satisfied the following rules:
Figure 4.
Illustration of lateral head and eye movement with gaze scans (green) produced from the gaze scan algorithm overlaid onto the gaze movements. Despite the diversity of gaze movements that compose the gaze scans, the gaze scan algorithm is able to successfully mark the start and end of the different gaze scans.
Rule 1:
Both saccades must be on the same side of the straight ahead position, such that no saccades on the left side were merged with saccades on the right side, or vice versa. This rule prevented merging when two saccades were on opposite sides but satisfy the remaining rules.
Rule 2:
Both saccades must be headed in the same direction (i.e. to the left, or to the right). This rule helped ensure that the end points of gaze scans were at the maximum eccentricity from the straight ahead position. Note that if two saccades qualified for merging but were separated by an intermediate saccade that did not satisfy this rule, the saccades may still be merged assuming they satisfied Rule 1 and Rule 4 (see appendix section A.2 for example of how this is achieved).
Rule 3:
The magnitude of the starting eccentricity of the later saccade must be greater than the magnitude of the starting eccentricity for the earlier saccade. The same must be true of the ending eccentricity as well. This rule helped ensure that each gaze scan included the maximum deviation from the straight ahead position and prevented unnecessary merging between likely distinct gaze scans.
Rule 4:
The two saccades must be close in time to each other. The time that was selected, 0.4 s, is discussed in greater detail in section 3.4. If the difference in time between the end of the first saccade and the start of the second saccade exceeded this 0.4 s criterion, then the saccades were not merged. Given that gaze scans can occur sequentially on the same side (e.g. the multiple leftward scans on the top right in Figure 4), this rule prevents neighboring, yet separate, gaze scans from being merged together.
Merging was achieved by chronologically merging saccades until there were no more saccades that could be merged. This was achieved by repeating the merging procedure until there were two consecutive iterations with the same number of saccades. The remaining saccades (both those that were merged and not merged) were then treated as the final gaze scans. See appendix for a flowchart (section A.1) and written description (section A.2) of how the gaze scan algorithm steps through gaze data.
3.4. Optimizing the merging parameter
Rule 4 of the gaze scan algorithm determines how close in time two saccades need to be in order to be merged. We used the training set (Table 1) to optimize this parameter. The current parameter (i.e. 0.4 s) was selected by maximizing the product of the proportion of one-to-one gaze scan matches between the ground truth and the gaze scan algorithm and Cohen’s Kappa (see section 3.6 for calculation) for each parameter value between 0.016 s to 0.750 in steps of 0.016 s (i.e., 1 sample at 60hz). A one-to-one match was defined as situations in which a single gaze scan from the ground truth was matched to a single gaze scan from the algorithm. Only for one-to-one matches could we evaluate the start and end markings of the gaze scan algorithm. Cases where more than one gaze scan was matched to a single gaze scan were labeled as one-to-many and many-to-one. One-to-many refers to situations where there were multiple algorithm gaze scans for a single ground truth gaze scan and many-to-one refers to situations where there were multiple ground truth gaze scans for a single algorithm gaze scan. As expected, increasing the time between saccades decreases the number of one-to-many errors and increases the number of many-to-one errors (Figure 5)
Figure 5.

The effect that the value determining the maximum time between saccades (i.e. Rule 4) has on the proportion of one-to-many errors (left), on the proportion of many-to-one errors (middle), and on Cohen’s Kappa (right; note: the graph is truncated at 0.5). The solid black line is the average for the 8 participants and the gray shading around the average represents the standard error. The vertical dotted line represents the value (0.4 s) that maximizes the product of 1 minus the proportion of one-to-many and many-to-one errors (i.e., proportion of one-to-one matches) and Cohen’s Kappa.
3.5. Characterizing saccades and gaze scans generated by the gaze scan algorithm
Saccades and gaze scans generated by the gaze scan algorithm were characterized in terms of duration and magnitude. In addition, for gaze scans, the number of saccades per gaze scan was computed. The relationship between the duration and magnitude of saccades and gaze scans was quantified with Pearson correlations. Differences between the distributions of the durations and magnitudes of saccades and gaze scans were analyzed using two-sample Kolmogorov-Smirnov tests (given the non-normal distributions for gaze scan duration and magnitude). The relationship between the number of saccades per gaze scan and magnitude and duration was quantified with a series of Pearson correlations.
3.6. Quantifying performance of the gaze scan algorithm compared to the ground truth
To measure how well the gaze scan algorithm marked gaze scans, gaze scans from the algorithm were compared to the ground truth gaze scans from the testing set. We used a sample-by-sample Cohen’s Kappa (K; Cohen, 1960; Andersson, et al., 2017) to measure the reliability of the algorithm by comparing the relative observed agreement (Po) and the hypothetical probability of chance agreement (Pe) of gaze data being marked as part of a gaze scan or not using the following formula:
Where K = 1 corresponds to perfect agreement and K = 0 corresponds to chance agreement. Pearson correlations were used to estimate the relationship between the algorithm and ground truth gaze scan durations and magnitudes. However, strong correlations do not necessarily imply good agreement between two methods (in this case, gaze scan algorithm and ground truth), especially if there is an offset in one method. Therefore, we used Bland-Altman methods (Bland & Altman, 1986), which provide a way to investigate systematic differences between two methods using the bias and variance (i.e., limits of agreement). These methods are more sensitive than other methods (e.g., correlation, Cohen’s Kappa) because the direction of the bias can be ascertained and we can individually evaluate how well the algorithm is marking the start and end time and eccentricity. We calculated both the bias and limits of agreement (LoA) of the differences in duration and magnitude between the gaze scan algorithm and ground truth. The significance of the bias was calculated using a sign-test, given that the differences in duration and magnitude were not normally distributed in one-sample Kolmogorov-Smirnov tests. LoAs were calculated by adding the median of the differences to the 2.5th and 97.5th percentile. Effect sizes (r) for the sign-test were calculated by dividing the sign-test statistic (z) by the square root of the sample size (Rosenthal, 1994). Bland-Altman methods were also used for quantifying the differences between the start time, end time, start eccentricity, and end eccentricity, in the same manner as for duration and magnitude.
When comparing the gaze scan algorithm to the ground truth, only those gaze scans marked by the algorithm that could be paired with exactly one ground truth gaze scan (i.e., one-to-one matches) were analyzed, which corresponded to 92.5% of the marked gaze scans. Gaze scans categorized as one-to-many (2.4%), many-to-one (2.6%), or had no corresponding algorithm markings (2.5%) were not analyzed for the quality of their marking. However, it is worth noting that the few one-to-many and many-to-one errors suggest that the gaze scan algorithm successfully matched saccades according to the ground truth.
To evaluate the gaze scan algorithm, we compared the LoA between the gaze scan algorithm and ground truth to the LoA between the three manual coders’ manual markings of the ‘coders set’ of data. The same methods to generate LoAs between the gaze scan algorithm and ground truth were calculated for each coder compared to the other. Next, we averaged the LoAs between the manual coders. This average is thus the difference we may expect between manual coders, which provides a benchmark to determine whether the algorithm is performing as well, worse, or the same as what we may expect for manual coders. See appendix (Appendix A.4) for differences between manual coders.
To calculate the 95% confidence intervals around the LoAs, we utilized bootstrapped resampling given the non-normality of the data. In 1000 iterations, we randomly selected, with resampling, from the distribution until we had selected the same number of resamples as the original distribution. Then, we calculated the LoAs for each iteration, thereby creating a resampled distribution. The 95% confidence interval of the LoAs was defined by taking the 2.5% and 97.5% percentile of the resampled distribution.
4. Results
4.1. Saccades and gaze scans generated by the gaze scan algorithm
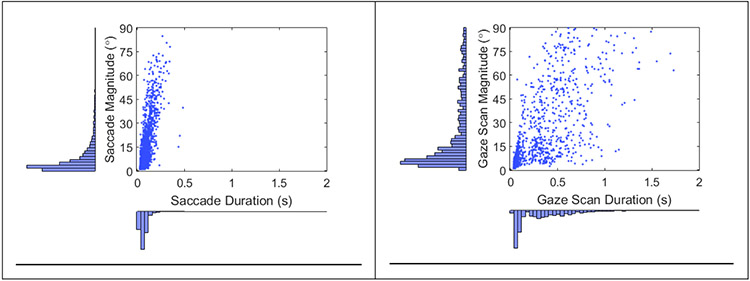
The magnitude and duration of saccades [r2 = 0.63, p < 0.001] and gaze scans [r2 = 0.43, p < 0.001] were found to be significantly correlated (Figure 6), similar to main sequence relationships reported for eye saccades (Bahill, Clark, & Stark, 1975). As expected, the distributions of the durations [D = 0.63, p < 0.001] and magnitudes [D = 0.37, p < 0.001] were significantly different between saccades and gaze scans. Saccades had smaller durations with less dispersion [median = 0.07, IQR = 0.04 s to 0.083] than gaze scans (median = 0.24, IQR = 0.09 s to 0.45 s). The same was also true of magnitudes [saccades: median = 4.3, IQR = 2.1° to 10.0°; gaze scans: median = 12.7, IQR = 6.2° to 36.2°]. Longer duration and larger magnitude gaze scans compared to saccades was expected given that gaze scans could be composed of multiple saccades.
Figure 6.
Scatter plots and histograms for the duration and magnitude of saccades (left) and gaze scans (right).
Approximately 55.2% of gaze scans were composed of more than one saccade (Figure 7 left). The duration [r2 = 0.84, p < 0.001] and magnitude [r2 = 0.44, p < 0.001] of gaze scans were significantly positively correlated with the number of saccades per gaze scan (Figure 7 center and right, respectively). This was expected given that individuals typically don’t make many eye saccades greater than 15° (Bahill, Adler, & Stark, 1975) and larger gaze scans would, therefore, require more saccades. Finding a majority of the gaze scans are composed of multiple saccades and that the number of saccades affects both the magnitude and duration of gaze scans supports the usefulness of the gaze scan algorithm when merging gaze scans together.
Figure 7.
Proportion of gaze scans with specific numbers of saccades (left) with blue representing gaze scans composed of a single saccade and orange representing those composed of more than one. The magnitude of gaze scans as a function of the number of saccades within each gaze scan (middle). The duration of gaze scans as a function of the number of saccades (right)
4.2. Comparing gaze scans between the gaze scan algorithm and ground truth
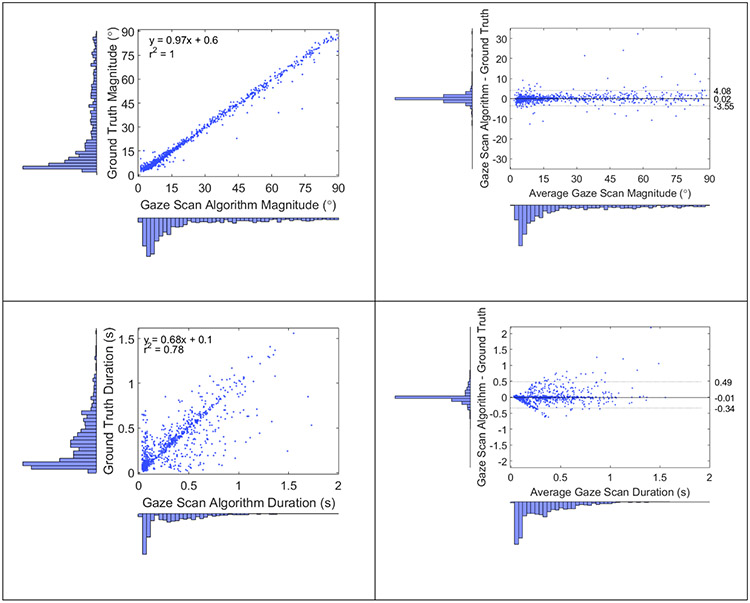
Gaze scan duration [r2 = 0.61, p < 0.001] and gaze scan magnitude [r2 = 0.995, p < 0.001] were significantly positively correlated (Figure 8 left) between the gaze scan algorithm and ground truth, with the relationship being stronger for magnitude than duration [z = 50.7, p < 0.001]. The sample-to-sample Cohen’s kappa for all gaze scans between the algorithm and ground truth was 0.62, which suggests good agreement (Cohen, 1960) and is similar to the sample-to-sample kappa between expert coders in this study (see Table A.1) and found for other saccade detection algorithms (Andersson, et al., 2017; 60hz data in Zemblys, et al., 2018)
Figure 8.
Scatterplots and histograms showing the relationship between the gaze scan algorithm and ground truth magnitudes (top left) and durations (bottom left). Bland-Altman plots showing the difference between the algorithm and ground truth magnitudes (top right) and duration (bottom right). The dotted horizontal lines represent the limits of agreement (LoA) and the numbers correspond to those limits with the median between the two LoAs.
The differences in duration [p < 0.001] and magnitude [p < 0.001] were found to be significantly different from a normal distribution, which was likely due to the distributions being highly leptokurtic [kurtosis for durations = 24.6, magnitudes = 56.4, standard error of kurtosis = 0.16]. When evaluating agreement between the gaze scan algorithm and ground truth with the Bland-Altman methods (Figure 8 right), the duration [median = −0.01 s, z = 6.0, p < 0.001] was significantly biased towards the ground truth, albeit with a small effect size [r = 0.19] and a bias that is smaller than what can be measured with our system (i.e., our sampling rate was 60 hz). The magnitude was not significantly biased [median = 0.02°, z = 0.5, p = 0.63] towards either the gaze scan algorithm or ground truth.
The comparisons of the limits of agreement (LoA) between the algorithm and ground truth are summarized in Table 2 and described further below.
Table 2.
Average limits of agreement (LoA) between the gaze scan algorithm and ground truth and between the coders. 95% confidence intervals are displayed inside the parentheses.
| Algorithm vs. Ground Truth | Inter-coder | |
|---|---|---|
| Magnitude (°) | 3.82 (3.36 to 4.45) | 3.42 (2.95 to 4.05) |
| Duration (s) | 0.41 (0.37 to 0.46) | 0.29 (0.24 to 0.34) |
| Start gaze scan eccentricity (°) |
2.27 (1.88 to 2.63) | 1.65 (1.37 to 1.95) |
| End gaze scan eccentricity (°) |
2.42 (2.15 to 3.33) | 2.74 (2.3 to 3.35) |
| Start gaze scan time (s) | 0.28 (0.24 to 0.32) | 0.17 (0.12 to 0.21) |
| End gaze scan time (s) | 0.28 (0.25 to 0.33) | 0.22 (0.19 to 0.26) |
The LoA for magnitude between the gaze scan algorithm and ground truth were within the average confidence interval of the LoA between manual coders (Table 2), which suggests that the level of agreement between the algorithm and ground truth was similar to that found between expert coders. However, this was not the case for the LoAs for duration, given that confidence intervals between the algorithm and ground truth and manual coders did not overlap (Table 2). Despite the lack of an overlap in LoAs for duration, approximately 90.5% of differences between the gaze scan algorithm and ground truth were within the lower and upper confidence bounds between the manual coders, suggesting that the wider LoA between the algorithm and ground truth was driven by a few outliers in durations.
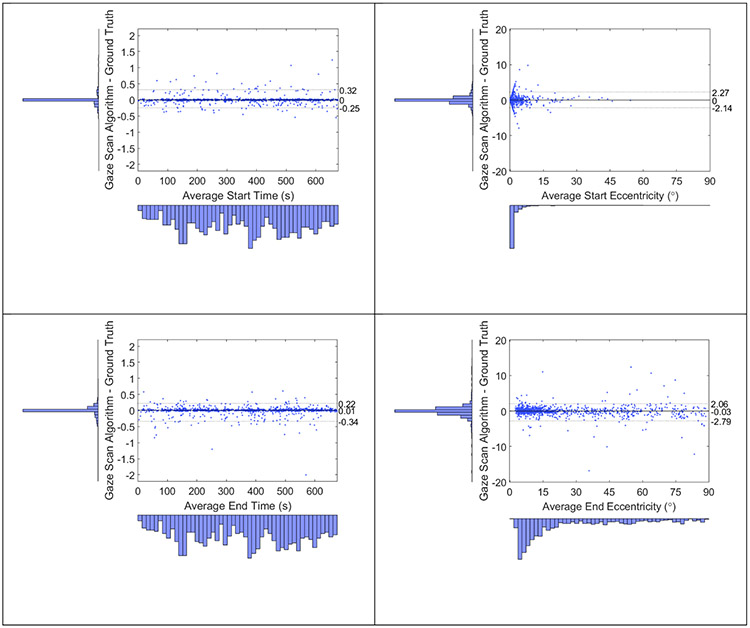
As was the case with duration and magnitude, the error distributions for start time [p < 0.001], end time [p < 0.001], start eccentricity [p < 0.001], and end eccentricity [p < 0.001] between gaze scans from the algorithm and ground truth were found to be significantly different from a normal distribution. The non-normality was likely related to the distributions being highly leptokurtic (kurtosis: start time = 27.1, end time = 53.4, start eccentricity = 22.2, end eccentricity = 96.0, standard error of kurtosis = 0.16). Bland-Altman plots for the differences of start time, end time, start eccentricity and end eccentricity between the algorithm and ground truth are displayed in Figure 9. The difference in end time was significantly biased towards the ground truth [median = −0.01 s, z = 6.6, p < 0.001], albeit with a small effect size [r = 0.21]. However, the difference in start time [median = 0.0 s, z = 0.6, p = 0.54], start eccentricity [median = 0.0°, z = 1.5, p = 0.13], and end eccentricity [median = 0.3°, z = 1.4, p = 0.15] were not significantly biased.
Figure 9.
Differences between the gaze scan algorithm and ground truth for each matched gaze scan’s start time (top left), end time (bottom left), starting eccentricity (top right), and ending eccentricity (bottom right). The dotted horizontal lines represent the limits of agreement (LoA) and the numbers correspond to those limits with the median between the two LoAs.
The LoAs between the gaze scan algorithm and ground truth for end eccentricity overlap with the average confidence intervals of the LoAs between the manual coders for end eccentricity (Table 2), suggesting agreement between algorithm and manual coders regarding where the gaze scan ends in eccentricity. There was some overlap for start eccentricity and end time, but no overlap for start time (Table 2). As was the case with duration, 92.4% of the differences between the algorithm start times were within the lower and upper confidence bounds between the manual coders, suggesting a few outliers may have been driving the worse agreement between gaze scan algorithm and ground truth.
4.3. Addressing gaze scans poorly marked by the algorithm
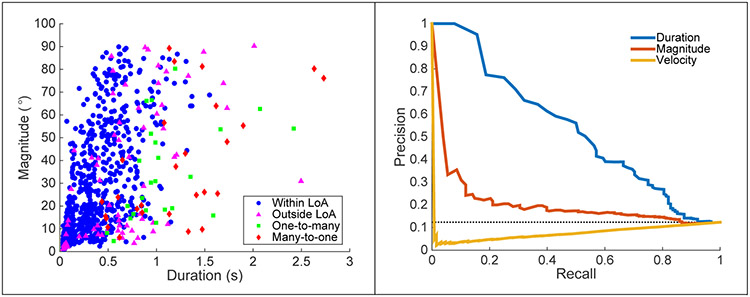
As is the case in any event detection algorithm, the goal is to accelerate processing of gaze data without sacrificing accuracy. As identified here, the gaze scan algorithm produced one-to-many errors (2.4%) and many-to-one errors (2.6%) when compared to the ground truth. These gaze scans, and gaze scans with a duration or magnitude that were outside the ground truth LoA (approximately 7.8%, Figure 10), could then be manually inspected and corrected where necessary. However, without manual marking, it would be difficult to know in advance which gaze scans are poorly marked. We utilized precision-recall curves to evaluate whether gaze scan duration, magnitude, or velocity may be predictors of poor fitting. Precision-recall curves are similar to receiver operator characteristic (ROC) curves, except that precision-recall curves are more appropriate for imbalanced datasets (Saito & Rehmsmeier, 2015). Unlike ROC curves, better classification corresponds to recall and precision closest to 1 (i.e., towards the upper right). Area under the curve (AUC), which summarizes classification performance, was estimated using the trapezoidal rule. AUCs for classifying poorly fit gaze scans were 0.53, 0.21, and 0.08 for gaze scan duration, magnitude, and velocity, respectively. For gaze scan duration, the threshold that best separated true and false positive rates was 0.6 s, which suggests that that threshold may be useful in indicating whether a gaze scan may be poorly marked. Specifically, this threshold may be most useful in capturing one-to-many and many-to-one errors (i.e., 92% and 82% were above 0.6 s, respectively) and less useful for gaze scans outside of the LoA (48.7%).
Figure 10.
Scatter plot (left) showing the gaze scan duration and magnitude for gaze scans from the gaze scan algorithm within the LoA bounds (blue circles), outside of the LoA (purple triangles), and one-to-many (green circles) and manually marked scans that were many-to-one (red diamonds). Precision-recall curves for classifying whether a gaze scan would be poorly marked (i.e., outside of the LoA, one-to-many, or many-to-one) given gaze scan duration (blue line), magnitude (red line), and velocity (yellow line). Classification closest to the upper right (in this case, duration) provided better classification. Chance classification is represented with the horizontal dashed line.
5. Discussion
We developed an algorithm to automatically detect gaze (head combined with eye eccentricity) scans by marking the start and end of each scan called the gaze scan algorithm. We compared performance of the algorithm to a ground-truth dataset of manually-marked scans. In addition, we compared the differences between the gaze scan algorithm and manually marked scans to differences found between expert coders to better understand what may be considered adequate markings by the algorithm.
The algorithm’s primary function is to merge saccades into gaze scans. To determine if this was necessary, we calculated the number of saccades per gaze scan to determine how frequently gaze scans were composed of multiple saccades. Approximately 55.2% of the matched gaze scans in the testing set were composed of multiple saccades, suggesting that the algorithm was necessary in marking the full extent of the gaze scans. For the testing set, less than 2.4% of the ground truth gaze scans were one-to-many by the gaze scan algorithm compared to 49.4% in a version of the algorithm without any merging. These results suggest that the algorithm successfully merged multiple saccades into gaze scans.
Overall, the gaze scan algorithm and ground truth produced qualitatively and quantitatively similar gaze scans. In the testing set, 95% of the gaze scans produced by the algorithm were matched to a gaze scan from the ground truth data set, suggesting the algorithm successfully marked gaze scans. When considering the magnitude and duration of the gaze scans, there was good agreement according to Cohen’s Kappa and significant correlations between the algorithm and ground truth gaze scans for both the magnitude and duration, albeit with a stronger correlation for magnitude than duration. In addition, we assessed the agreement between the gaze scan durations and magnitudes between the algorithm and ground truth using limits of agreement (LoA) from Bland-Altman methods. The agreement between the gaze scan algorithm and ground truth for gaze scan magnitude was similar to the agreement between the expert coders, suggesting that the algorithm is sufficiently marking the magnitude of the gaze scan. Furthermore, similar results were found for both the start and end eccentricity and end timing. However, there was less agreement for gaze scan duration between the gaze scan algorithm and ground truth compared to the expert coders. When examining the agreement between the gaze scan algorithm and ground truth for start and end times, there was less agreement for start times than end times, which may explain the variability for durations produced by the gaze scan algorithm. However, even though there was less agreement between the gaze scan algorithm and ground truth for the timing of gaze scans, more than 90% of the gaze scans were still within the agreement range of the manual coders. Thus, the gaze scan algorithm and ground truth tended to agree about as well as expert manual coders tend to agree. Gaze scan duration is one metric (section 4.3) that may be useful in identifying gaze scans that may be poorly marked by the gaze scan algorithm and need to be corrected with manual marking. In our dataset, gaze duration exceeding 0.6 s seemed to be a reasonable threshold, though this value may change based on the driving scenario.
The current implementation of the gaze scan algorithm focused on quantifying gaze scanning on approach to intersections, but could also be applied to scanning in other driving scenarios. It is applicable to different driving environments that may have different types of scanning, such as driving on the highway versus driving in the city. The algorithm complements existing research measuring for how long or how frequently individuals look at different sections of the road (Yamani, Samuel, Gerardino, & Fisher, 2016), hazards (Crundall et al., 2012) or at in-vehicle displays (Donmez, Boyle, & Lee, 2009) by providing a way to quantify how individuals moved their eyes to reach that area of interest. In addition, the algorithm could be used to determine the magnitude of gaze scans when walking; for example, determining when it is safe to cross a street requires large gaze scans to the left and right (e.g. Whitebread & Neilson, 2000; Hassan, Geruschat, & Turano, 2005). In applied settings, the algorithm could be used to quantify an individual’s scanning behaviors (how far and how frequently they scanned) to monitor progress during scanning training as part of a rehabilitation program for drivers who exhibited scanning deficits, such as individuals with visual field loss (Bowers et al., 2014) or older persons with normal vision (Romoser & Fisher, 2009).
One potential limitation of the gaze scan algorithm is that detecting saccadic gaze movements using velocity thresholds at low sampling rates (i.e. less than 250 Hz) results in imprecise markings (Mack, Belfanti, & Schwarz, 2017). Therefore, the accuracy and optimization of the algorithm may have been impacted by imprecise markings of saccades because the gaze data used was collected at 60 Hz. While the 60 Hz sampling rate might have influenced the accuracies described here, the algorithm is not dependent upon the sampling rate and can be considered modular. That is, the merging portion of the algorithm (i.e. Stage 2 described in section 3.3.3) could be applied to saccades detected from a different algorithm using a different sampling rate from the methodology used in Stage 1 described in this paper.
While the current configuration of the gaze scan algorithm sufficiently marked gaze scans compared to the ground truth scans, it is possible that there may be subgroups of participants wherein a different configuration of the algorithm would provide a better fit of data. For example, age impacts how an individual scans when driving on-road (Bao & Boyle, 2009b) and in the driving simulator (Romoser, Pollatsek, Fisher, & Williams, 2013; Savage et al., Revise and Resubmit) and this could mean that age may impact the parameter value that determines how close in time two saccades need to be to be merged. With the current data set, there is not enough data to determine whether this should be the case or the case for other potential subgroups (e.g. gender, driving experience).
6. Conclusion
We describe an algorithm that automatically marks the beginning and end of lateral gaze scans, which allows for the quantification of the duration, magnitude, and composition of those scans, called the gaze scan algorithm. The algorithm produces gaze scans that are quantitatively similar in duration and magnitude to manually marked ground truth gaze scans with differences from the ground truth within the level of agreement that may be expected between expert manual coders. Therefore, the algorithm may be used in lieu of manual marking of gaze data, significantly accelerating the time consuming marking of gaze movement data in driving simulator studies. The algorithm complements existing driving simulator research investigating the relationships between gaze movements and driving behavior and could be implemented in other situations outside of the driving simulator (e.g. walking) that involve multiple gaze movements headed in the same direction.
Acknowledgements
The research was supported in part by NIH grant R01-EY025677, NIH Core Grant P30EY003790, and S10 – RR028122
GRANT: NIH grants R01-EY025677, P30-EY003790, and S10-RR028122 and with support from the Hand-Böckerler-Foundation
Appendix
A.1. Flow chart for processing gaze data using gaze scan algorithm
Figure A.1.
Flow chart for converting gaze data into gaze scans using the gaze scan algorithm. Here, V(X,Y) refers to gaze velocity in the horizontal and vertical directions. Saccade is simplified to S, saccades after correcting for saccades that cross zero is simplified to Sc, and gaze scans are simplified to G.
A.2. Verbal description of the gaze scan algorithm
The procedure for merging saccades is described in a simplified format below. Figure A.2 shows gaze data from Figures 3 and 5 (lower right plot) from the manuscript, to illustrate how the gaze scan algorithm merges saccades (Figure A.2, left) into gaze scans (Figure A.2, right). For the sake of simplicity, saccade is represented by S and the number next to S represents which saccade.
Figure A.2.
Zoomed in data from Figures 3 and 5 (lower right plot) illustrating how saccades (on the left) are merged into gaze scans (on the right). On the left, S (N) represents the Nth saccade (S). On the right, G (N) represents the saccades that compose a gaze scan (G). Note that for simplicity, only large saccades are being shown.
Merging begins with S (2). Given that S (1) is headed in a different direction (i.e. towards the right) than S (2), S (2) is not merged with S (1) based on Rule 2. Next, we examine S (3). Given that S (1) and S (2) are on the opposite side (i.e. on the right) to S (3) (i.e. on the left), S (3) is not merged with either S (1) or S (2) based on Rule 1. Next, we examine S (4). Like S (3), S (4) cannot be merged with S (1) and S (2) because they are on opposite sides. However, the relationship between S (3) and S (4) satisfies all of the rules. Therefore, S (3) and S (4) are merged into a single S (3-4), which has the start of S (3) and the end of S (4). Next, we examine S (5). Given that S (1) and S (2) are on the opposite side to S (5) and that S (3-4) is headed in a different direction than S (5), S (5) is not merged. Next, we examine S (6). Given that S (1) and S (2) are separated from S (6) by more than 0.4 s (i.e. Rule 4) and that S (3-4) and S (5) are on the opposite side to S (6), S (6) is not merged. Next, we examine S (7). Given that S (1) and S (2) are too far back in time, S (3-4) and S (5) are the opposite side to S (7), and S (6) is headed in a different direction, S (7) is not merged. Next, we examine S (8). Given that S (1) and S (2) are too far back in time and S (3-4) and S (5) are on the opposite side, S (8) cannot be merged with those saccades. However, S (6) is within the merging time set by Rule 4 and can be merged with S (8). Furthermore, S (7), while headed in a different direction than S (8), is merged with S (6) and S (8) because it is on the same side (i.e. Rule 1) and is sandwiched between S (6) and S (8), thereby resulting in S (6-8) with the start of S (6) and end of S (8). Next, we examine S (9). Given that S (1) and S (2) are too far back in time, S (3-4) and S (5) are on the opposite side, and S (6-8) is headed in a different direction, S (9) is not merged. Now that all of the saccades have been merged, the remaining saccades are treated as the final gaze scans. When only considering the gaze scans headed away from 0°, S (1) becomes the first gaze scan G (1), S (3-4) becomes G (3-4), and S (6-8) becomes G (6-8); the numbers in parentheses still refer to the original numbering of the saccades.
A.3. Saccades markings
In Figure A.3, the saccade markings are displayed on the same data as displayed in Figure 1 and Figure 4 in the main paper.
Figure A.3.
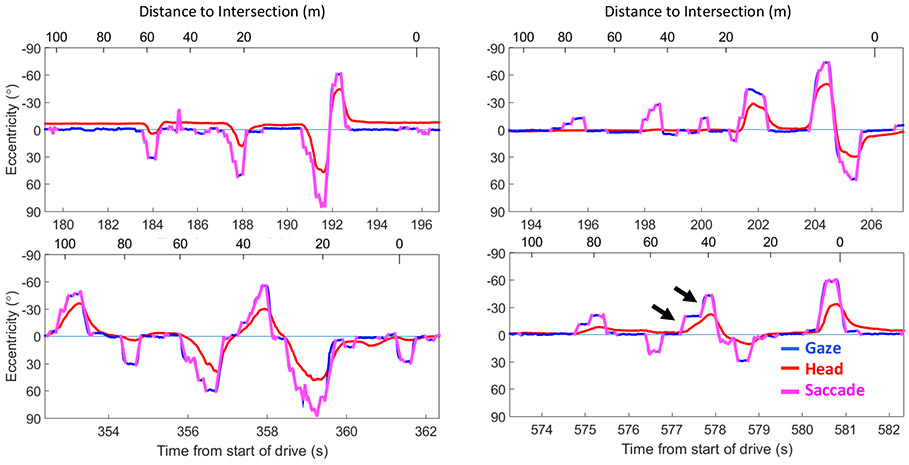
Saccades (pink) overlaid on the gaze data from Figure 1 in the paper. While the saccades successfully capture the large gaze movements made during saccades, they do not, by themselves, capture the full gaze scan. For example, see the large leftward gaze scan starting at 577s in the bottom right plot, which is broken into two leftward saccades (indicated by the two black arrows) superimposed on one continuous leftward head movement.
A.4. Agreement between manual coders
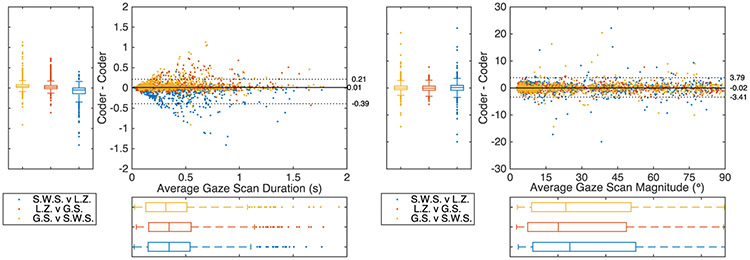
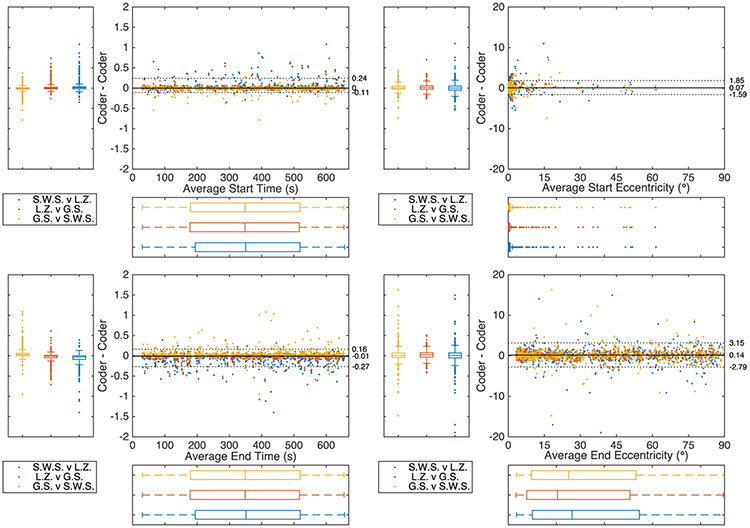
Three authors (G.S., S.W S., and L.Z.) independently manually marked data from the ‘coders set’. Sample-by-sample Cohen’s Kappa between the algorithm and the coders is displayed in Table A.1. Bland-Altman plots for the comparisons of gaze scan duration and magnitude are displayed in Figure A.4 and gaze scan start time, end time, start eccentricity, and end eccentricity are displayed in Figure A.5. As in the main manuscript, the limits of agreement (LoA) were calculated based on adding the median difference to the 2.5th and 97.5th percentile, which resulted in an average LoA of 0.30 s (95% CI: 0.24 s to 0.36 s) and 3.6° (95% CI: 3.1° to 4.5°) for duration and magnitude, respectively. In addition, here are the average LoAs for start time (0.18 s, 95% CI: 0.14 s to 0.22 s), end time (0.21 s, 95% CI: 0.18 s to 0.27 s), start eccentricity (1.72°, 95% CI: 1.43° to 2.1°), and end eccentricity (3.0°, 95% CI: 2.5° to 3.6°). Note, that there is significant overlap in the markings between coders for each of these measures.
Table A.1.
Sample-by-sample Cohen’s kappa calculated between the different coders (G.,L.,S.) and between the coders and the algorithm.
| G. | L. | S. | |
|---|---|---|---|
| G. | 1 | ||
| L. | 0.64 | 1 | |
| S. | 0.51 | 0.68 | 1 |
| Algorithm | 0.71 | 0.68 | 0.69 |
Figure A.4.
Bland-Altman plots for the comparisons between coders for gaze scan duration (left) and magnitude (right). Here, color represents the different comparisons. Box plots are provided in lieu of histograms to demonstrate the differences between coders, which was minimal. The dotted horizontal lines represent the average limits of agreement (LoA) and the numbers correspond to the average limits with the median between the two LoAs.
Figure A.5.
Bland-Altman plots for the comparisons between coders for gaze scan start time (top left), end time (bottom left), start eccentricity (top right), and end eccentricity (bottom right). Here, color represents the different comparisons. Box plots are provided in lieu of histograms to demonstrate the differences between coders, which was minimal. The dotted horizontal lines represent the average limits of agreement (LoA) and the numbers correspond to the average limits with the median between the two LoAs.
Footnotes
Open Access Statement
Code for the gaze scan algorithm and manual marking can be downloaded from https://osf.io/p6jqn/. Furthermore, the data from the training, testing, and coders sets can also be downloaded from that same location.
References
- Alberti CF, Goldstein RB, Peli E, & Bowers AR (2017). Driving with hemianopia V: do individuals with hemianopia spontaneously adapt their gaze scanning to differing hazard detection demands?. Translational vision science & technology, 6(5), 11–11. [DOI] [PMC free article] [PubMed] [Google Scholar]
- Andersson R, Larsson L, Holmqvist K, Stridh M, & Nyström M (2017). One algorithm to rule them all? An evaluation and discussion of ten eye movement event-detection algorithms. Behavior research methods, 49(2), 616–637. [DOI] [PubMed] [Google Scholar]
- Bahill AT, Adler D, & Stark L (1975). Most naturally occurring human saccades have magnitudes of 15 degrees or less. Investigative Ophthalmology & Visual Science, 14(6), 468–469. [PubMed] [Google Scholar]
- Bahill AT, Clark MR, & Stark L (1975). The main sequence, a tool for studying human eye movements. Mathematical Biosciences, 24(3-4), 191–204. [Google Scholar]
- Bahnemann M, Hamel J, De Beukelaer S, Ohl S, Kehrer S, Audebert H, … & Brandt SA (2015). Compensatory eye and head movements of patients with homonymous hemianopia in the naturalistic setting of a driving simulation. Journal of neurology, 262(2), 316–325. [DOI] [PubMed] [Google Scholar]
- Bao S, & Boyle LN (2009a). Driver safety programs: The influence on the road performance of older drivers. Transportation Research Record: Journal of the Transportation Research Board, (2096), 76–80. [Google Scholar]
- Bao S, & Boyle LN (2009b). Age-related differences in visual scanning at median-divided highway intersections in rural areas. Accident Analysis & Prevention, 41(1), 146–152. [DOI] [PubMed] [Google Scholar]
- Barnes GR (1979). Vestibulo-ocular function during co-ordinated head and eye movements to acquire visual targets. The Journal of Physiology, 287(1), 127–147. [DOI] [PMC free article] [PubMed] [Google Scholar]
- Beintema JA, van Loon EM, & van den Berg AV (2005). Manipulating saccadic decision-rate distributions in visual search. Journal of vision, 5(3), 1–1. [DOI] [PubMed] [Google Scholar]
- Bland JM, & Altman D (1986). Statistical methods for assessing agreement between two methods of clinical measurement. The lancet, 327(8476), 307–310. [PubMed] [Google Scholar]
- Bowers AR, Ananyev E, Mandel AJ, Goldstein RB, & Peli E (2014). Driving with hemianopia: IV. Head scanning and detection at intersections in a simulator. Investigative ophthalmology & visual science, 55(3), 1540–1548.. [DOI] [PMC free article] [PubMed] [Google Scholar]
- Bowers AR, Bronstad MP, Spano LP, Goldstein RBB, & Peli E (2019). The effects of age and central field loss on head scanning and detection at intersections. Translational Vision Science & Technology, 8(5), 14–14. [DOI] [PMC free article] [PubMed] [Google Scholar]
- Braitman KA, Kirley BB, McCartt AT, & Chaudhary NK (2008). Crashes of novice teenage drivers: Characteristics and contributing factors. Journal of safety research, 39(1), 47–54. [DOI] [PubMed] [Google Scholar]
- Cohen J (1960). A coefficient of agreement for nominal scales. Educational and psychological measurement, 20(1), 37–46. [Google Scholar]
- Crundall D, Chapman P, Trawley S, Collins L, Van Loon E, Andrews B, & Underwood G (2012). Some hazards are more attractive than others: Drivers of varying experience respond differently to different types of hazard. Accident Analysis & Prevention, 45, 600–609. [DOI] [PubMed] [Google Scholar]
- Donmez B, Boyle LN, & Lee JD (2009). Differences in off-road glances: effects on young drivers’ performance. Journal of transportation engineering, 136(5), 403–409. [Google Scholar]
- Guitton D, & Volle M (1987). Gaze control in humans: eye-head coordination during orienting movements to targets within and beyond the oculomotor range. Journal of neurophysiology, 58(3), 427–459. [DOI] [PubMed] [Google Scholar]
- Hakamies-Blomqvist LE (1993). Fatal accidents of older drivers. Accident Analysis & Prevention, 25(1), 19–27. [DOI] [PubMed] [Google Scholar]
- Hamel J, De Beukelear S, Kraft A, Ohl S, Audebert HJ, & Brandt SA (2013). Age-related changes in visual exploratory behavior in a natural scene setting. Frontiers in psychology, 4, 339. [DOI] [PMC free article] [PubMed] [Google Scholar]
- Hassan SE, Geruschat DR, & Turano KA (2005). Head movements while crossing streets: effect of vision impairment. Optometry and vision science, 82(1), 18–26. [PubMed] [Google Scholar]
- Keskinen E, Ota H, & Katila A (1998). Older drivers fail in intersections: Speed discrepancies between older and younger male drivers. Accident Analysis & Prevention, 30(3), 323–330. [DOI] [PubMed] [Google Scholar]
- Mack DJ, Belfanti S, & Schwarz U (2017). The effect of sampling rate and lowpass filters on saccades–a modeling approach. Behavior research methods, 49(6), 2146–2162. [DOI] [PubMed] [Google Scholar]
- McKnight AJ, & McKnight AS (2003). Young novice drivers: careless or clueless?. Accident Analysis & Prevention, 35(6), 921–925. [DOI] [PubMed] [Google Scholar]
- Munn SM, Stefano L, & Pelz JB (2008). Fixation-identification in dynamic scenes: Comparing an automated algorithm to manual coding. In Proceedings of the 5th symposium on Applied perception in graphics and visualization (pp. 33–42). ACM. [Google Scholar]
- Nyström M, & Holmqvist K (2010). An adaptive algorithm for fixation, saccade, and glissade detection in eyetracking data. Behavior research methods, 42(1), 188–204. [DOI] [PubMed] [Google Scholar]
- Reimer B (2009). Impact of cognitive task complexity on drivers’ visual tunneling. Transportation Research Record, 2138(1), 13–19. [Google Scholar]
- Romoser MR, & Fisher DL (2009). The effect of active versus passive training strategies on improving older drivers’ scanning in intersections. Human factors, 51(5), 652–668. [DOI] [PMC free article] [PubMed] [Google Scholar]
- Romoser MR, Fisher DL, Mourant R, Wachtel J, & Sizov K (2005). The use of a driving simulator to assess senior driver performance: Increasing situational awareness through post-drive one-on-one advisement. In: Proceedings of the 8th International Driving Symposium on Human Factors in Driver Assessment, Training and Vehicle Design. Iowa City, IA: University of Iowa, 239–245 [Google Scholar]
- Romoser MR, Pollatsek A, Fisher DL, & Williams CC (2013). Comparing the glance patterns of older versus younger experienced drivers: Scanning for hazards while approaching and entering the intersection. Transportation research part F: traffic psychology and behaviour, 16, 104–116. [DOI] [PMC free article] [PubMed] [Google Scholar]
- Rosenthal R, Cooper H, & Hedges L (1994). Parametric measures of effect size. The handbook of research synthesis, 621(2), 231–244. [Google Scholar]
- Salvucci DD, & Goldberg JH (2000). Identifying fixations and saccades in eye-tracking protocols. In Proceedings of the 2000 symposium on Eye tracking research & applications (pp. 71–78). ACM. [Google Scholar]
- Saito T, & Rehmsmeier M (2015). The precision-recall plot is more informative than the ROC plot when evaluating binary classifiers on imbalanced datasets. PloS one, 10(3). [DOI] [PMC free article] [PubMed] [Google Scholar]
- Savitzky A, & Golay MJ (1964). Smoothing and differentiation of data by simplified least squares procedures. Analytical chemistry, 36(8), 1627–1639. [Google Scholar]
- Savage SW, Zhang L, Pepo D, Sheldon SS, Spano LP, & Bowers AR (2017). The Effects of Guidance Method on Detection and Scanning at Intersections–A Pilot Study. In Proceedings of the International Driving Symposium on Human Factors in Driver Assessment, Training, and Vehicle Design. Manchester Village, VT: University of Iowa, 340–346 [DOI] [PMC free article] [PubMed] [Google Scholar]
- Savage SW, Zhang L, Swan G, & Bowers AR (Revise & resubmit). The effects of age on the relative contributions of the head and the eyes to scanning behaviors at intersections. Transportation Research Part F: Traffic Psychology and Behaviour [DOI] [PMC free article] [PubMed] [Google Scholar]
- Smeets JB, & Hooge IT (2003). The nature of variability in saccades. Journal of neurophysiology. [DOI] [PubMed] [Google Scholar]
- Sodhi M, Reimer B, & Llamazares I (2002). Glance analysis of driver eye movements to evaluate distraction. Behavior Research Methods, Instruments, & Computers, 34(4), 529–538. [DOI] [PubMed] [Google Scholar]
- Whitebread D, & Neilson K (2000). The contribution of visual search strategies to the development of pedestrian skills by 4-11 year-old children. British Journal of Educational Psychology, 70(4), 539–557. [DOI] [PubMed] [Google Scholar]
- Yamani Y, Samuel S, Roman Gerardino L, & Fisher DL (2016). Extending analysis of older drivers’ scanning patterns at intersections. Transportation Research Record: Journal of the Transportation Research Board, (2602), 10–15. [Google Scholar]
- Zemblys R, Niehorster DC, Komogortsev O, & Holmqvist K (2018). Using machine learning to detect events in eye-tracking data. Behavior research methods, 50(1), 160–181. [DOI] [PubMed] [Google Scholar]


