

Abstract
Objective:
To investigate how functional integrity of ascending sensory pathways measured by visual and somatosensory evoked potentials (VEP & SEP) is associated with abnormal glycemia and brain injury in newborns treated with hypothermia for hypoxic-ischemic encephalopathy (HIE).
Methods:
Fifty-four neonates ≥ 36 weeks gestational age with HIE underwent glucose testing, VEPs, SEPs, and magnetic resonance imaging (MRI) the first week of life. Minimum and maximum glucose values recorded prior to evoked potential (EP) testing were compared with VEP and SEP measures using generalized estimating equations. Relationships between VEP and SEP measures and brain injury on MRI were assessed.
Results:
Maximum glucose is associated with decreased P200 amplitude, and increased odds that N300 peak will be delayed/absent. Minimum glucose is associated with decreased P22 amplitude. Presence of P200 and N300 peaks is associated with decreased odds of brain injury in the visual processing pathway, with delayed/absent N300 peak associated with increased odds of brain injury in posterior white matter.
Conclusions:
Deviations from normoglycemia are associated with abnormal EPs, and abnormal VEPs are associated with brain injury on MRI in cooled neonates with HIE.
Significance:
Glucose is a modifiable risk factor associated with atypical brain function in neonates with HIE despite hypothermia treatment.
Keywords: Hyperglycemia, Hypoglycemia, Hypoxic ischemic encephalopathy (HIE), Magnetic resonance imaging (MRI), Visual evoked potentials, Somatosensory evoked potentials
1. Introduction
Hypoxic ischemic encephalopathy (HIE) is the leading cause of neonatal encephalopathy, and is associated with a high risk of mortality and long-term neurological disability (Douglas-Escobar and Weiss, 2015; Basu et al., 2016; Basu et al., 2017; Pinchefsky et al., 2019). HIE occurs in 1–8 per 1000 live births in developed countries and up to 26 per 1000 live births in underdeveloped countries (Douglas-Escobar and Weiss, 2015; Basu et al., 2016). Despite implementation of therapeutic hypothermia as standard of care to treat neonates with HIE, there continues to be significant death and disability (Douglas-Escobar and Weiss, 2015; Basu et al., 2016; Basu et al., 2017), and thus other potential modifiable risk factors must be explored. Deviations from normoglycemia are prevalent in newborns with HIE, and have been associated with unfavourable developmental outcomes at preschool age (Boardman and Hawdon, 2015; Douglas-Escobar and Weiss, 2015; Basu et al., 2016; Basu et al., 2017).
Magnetic resonance imaging (MRI) and amplitude-integrated electroencephalogram (aEEG) are routinely used to help predict neurodevelopmental outcome in neonates with HIE, however, the implementation of therapeutic hypothermia has made prognostication more complicated (Rutherford et al., 2010; Kontio et al., 2013; Rollins et al., 2014; Douglas-Escobar and Weiss, 2015; Cainelli et al., 2018; Pinchefsky et al., 2019). An abnormal brain MRI and/or severe aEEG abnormalities can accurately predict death or disability in early childhood, regardless of whether or not the neonate with HIE was cooled (Rutherford et al., 2010; Douglas-Escobar and Weiss, 2015; Cainelli et al., 2018; Pinchefsky et al., 2019). However, an MRI showing no or minor brain injury for a newborn who underwent therapeutic hypothermia for HIE does not ensure a typical neurodevelopmental outcome (Rollins et al., 2014; Douglas-Escobar and Weiss, 2015; Cainelli et al., 2018). Further, studies have found that therapeutic hypothermia may dampen the aEEG, limiting its ability for early outcome prediction (Kontio et al., 2013; Douglas-Escobar and Weiss, 2015; Cainelli et al., 2018), highlighting a need for complementary testing that is more resilient to the effects of cooling.
Visual evoked potentials (VEP) and somatosensory evoked potentials (SEP) are standard non-invasive neurophysiological tests, which assess the functional integrity of deep brain structures and cortical areas which are selectively vulnerable in the HIE patient population, and can be done at the bedside (De Vries et al., 1991; Kontio et al., 2013; Cainelli et al., 2018). A recent study determined that a combination of VEP, SEP and electroencephalogram (EEG) done in the first couple weeks of life can predict adverse neurodevelopmental outcomes in early childhood in neonates with HIE who were cooled and had a postnatal MRI that revealed no brain abnormalities, demonstrating that these neurophysiological tests can withstand the effects of therapeutic hypothermia (Cainelli et al., 2018) making them potential tools to help predict neurodevelopmental outcome.
Studies investigating the effects of deviations from euglycemia on VEPs and SEPs are limited and inconclusive (Koh et al., 1988; Tamburrano et al., 1988; Greisen and Pryds, 1989; Martinelli et al., 1992; Tamburrano et al., 1992; Lingenfelser et al., 1993; Seidl et al., 1996; Kubova et al., 2005; Tam et al., 2008; Hu et al., 2014). Limitations of prior studies include heterogeneous study cohorts, small sample sizes, and variability in periodic glucose sampling. To our knowledge, no studies have explored the effects of hyperglycemia and only a minority of studies have examined the effects of hypoglycemia on VEPs or SEPs in newborns. Here, we are the first to utilize a continuous glucose monitor to investigate how glucose derangements are associated with the functional integrity of ascending sensory pathways as measured by evoked potentials (VEPs and SEPs) in the first week of life, and are the first to study this in neonates with HIE who were cooled. Additionally, this study aims to assess how VEP and SEP measures, representing functional integrity, are associated with brain injury on MRI, representing the structural integrity of the visual and somatosensory pathways, in neonates who underwent therapeutic hypothermia for HIE.
2. Methods
2.1. Study population
Seventy-five neonates (≥36 weeks gestational age) born between August 2014 and December 2017, who had an abnormal level of consciousness in addition to seizures and/or abnormalities in tone and/or reflexes, and were admitted to the neonatal intensive care unit (NICU) at The Hospital for Sick Children were studied. Newborns were excluded if they had a suspected or confirmed congenital malformation, inborn error of metabolism, or congenital infection, weighed < 1500 grams, or if it was expected that the continuous glucose monitor (CGM) could not be inserted within 6 hours of life. While therapeutic hypothermia was not a requirement for enrollment, all subjects underwent whole body hypothermia for 72 hours, reaching a target temperature of 33–34 °C within 6 hours of life, and were then rewarmed for 6 hours by gradually increasing core body temperature by 0.5 °C per hour. As part of an ongoing prospective cohort study, the Neurological Outcome of Glucose in Neonatal Encephalopathy (NOGIN) study, written consent was obtained from parents/guardians for all participating neonates following a protocol approved by The Hospital for Sick Children’s Research Ethics Board. Study data were collected and managed using research electronic data capture (REDCap, Vanderbilt University, Tennessee) hosted at The Hospital for Sick Children (Harris et al., 2009).
2.2. Glucose data
After parental/guardian consent was obtained, within the first few hours of life, all neonates had a CGM comprised of an Enlite™ Sensor (Medtronic Canada, Brampton, Ontario) connected to a blinded Medtronic iPro™2 professional CGM (Medtronic Canada, Brampton, Ontario) inserted into the lateral aspect of the thigh for approximately 72 hours of continuous glucose monitoring. The CGM stores interstitial glucose concentrations and reports data every 5 minutes once the data are uploaded to the Medtronic CareLink™ iPro™ software (Medtronic MiniMed, Northridge, California) and calibrated. Laboratory blood glucose values collected as part of standard of care were used to calibrate the CGM. Due to Medtronic CareLink™ iPro™ software limitations for determining interstitial glucose concentrations <2.2 and >22.2 mmol/L, interstitial glucose readings initially reported as 2.2 or 22.2 mmol/L were verified or corrected manually using an equation provided by Medtronic to calculate their true interstitial glucose concentrations. Since CGM data were not available real-time, clinicians detected and treated hypoglycemia and hyperglycemia using intermittent glucose testing as part of standard of care.
All clinically ordered point of care testing and laboratory blood glucose values from both the referral hospital and The Hospital for Sick Children were collected for the first week of life, and were utilized as glucose study data when CGM data was unavailable for the subject (i.e., before/after the CGM was on the subject). Since i-STAT (Abbott Laboratories, Abbott Park, Illinois) uses the gold standard glucose oxidase reaction, glucose values obtained using this method of point of care testing were treated as comparable to laboratory values.
For the current study, a blood or interstitial glucose concentration of ≤2.6 mmol/L was considered as hypoglycemia, and a glucose concentration of > 8.0 mmol/L was considered hyperglycemia. Considering all glucose concentrations during the first week of life, regardless of the method of collection (CGM or clinically ordered point of care or laboratory blood tests), minimum and maximum blood or interstitial glucose concentration for the first week of life were determined for each subject.
2.3. Evoked potentials
VEPs and SEPs were conducted within the first week of life as part of standard of care in the NICU at The Hospital for Sick Children. All VEP & SEP data acquired during the first week of life were collected retrospectively from patient medical records for each patient. Of 54 neonates who had evoked potential (EP) testing, approximately half (n = 26) were asleep during testing, 20 were awake, 7 transitioned between sleep/wake states, and 1 was unknown. Technologists administering the EP testing are trained to check for the impact of sleep on the EP recording. If an infant is in sleep and there is an absent EP, the technologist will slightly arouse the infant to change the sleep state, and then will check for any change in EP. If aroused, and there is no change in EP, only then is the EP interpreted as an absent response.
For VEPs, flash stimuli were presented binocularly at a rate of 2 Hz via goggles that were placed over the patient’s eyes. Surface electrodes were placed according to the 10–20 international system with the recording electrode at Oz, the reference electrode at Fz, and the ground electrode at Cz. The scalp electrode impedance was maintained below 5 kΩ. Bandpass filters were set at 1–200 Hz. After rejection of excessive artifacts, two sets of 100 responses were averaged at a 1000 msec total sweep time. VEPs were scored as delayed or absent with respect to normal values determined by The Hospital for Sick Children’s Neurophysiology Lab (N70 < 218 ms; P200 < 253 ms; N300 < 365 ms). Amplitudes were measured for the following VEP waveforms: N70, P200, and N300. The peaks of N70, P200 and N300 were scored as present or absent. If peaks were present, latencies were recorded in milliseconds.
SEPs were recorded from the contralateral somatosensory cortex after stimulation of the median nerve at the patient’s wrist with electrical stimuli given at a rate of 1.1 Hz, duration of 0.2 msec and with an intensity above motor threshold. The impedance was less than 5 kΩ. A high-pass filter setting of 5–1500 Hz was used. The montage for the P16 component consisted of a recording electrode at C5spine and a reference electrode at Fz. The montage for the N20 cortical component consisted of a recording electrode at the contralateral C3′ or C4′ site and a reference electrode at Fz. In accordance with the American Clinical Neurophysiology Society guidelines (American Clinical Neurophysiology Society, 2006), 2 blocks of 500 trials each were acquired, with each block on-line averaged separately. Technologists administering the SEP testing are trained to acquire enough blocks to have 2 reproducible averages. SEP waveforms (P16, N20, and P22) were scored as present if the waveform was bilaterally recorded. SEP waveforms (P16, N20, and P22) were scored as delayed or absent if the waveform was unilaterally or bilaterally prolonged or absent with respect to normal values determined by The Hospital for Sick Children’s Neurophysiology Lab (P16 < 29 ms; N20 < 38.5 ms; P22 < 47.3 m s). Amplitude was measured for the P22 waveform.
2.4. MRI studies
MRI scans were performed on either a 3 T or 1.5 T MRI scanner (Siemens or Philips) at around day 4 of life after patients were rewarmed after undergoing therapeutic hypothermia (Barkovich et al., 2006; Thayyil et al., 2010; Bednarek et al., 2012; Chau et al., 2014). MRI sequences performed included 1) axial volumetric 3-dimensional Fast Low Angle Shot T1-weighted images, 2) axial spin-echo T2-weighted images, and 3) axial diffusion-weighted images. One pediatric neuroradiologist (EW) blinded to patient history reviewed and assessed brain injury for images derived from all 3 MRI sequences mentioned above. A brain region was considered injured if injury was identified on images obtained using any of the 3 MRI sequences. Regions of interest included pericalcarine cortex, posterior white matter, pulvinar, and the anterior medial nuclei of the thalamus for evaluation of the visual processing pathway, and perirolandic cortex, corticospinal tract, midbrain, pons, and medulla for evaluation of the somatosensory processing pathway.
2.5. Statistical analysis
Statistical analyses were performed using Stata Statistical Software: Release 15 (StataCorp LLC, 2017, College Station, Texas). Generalized estimating equations were used to assess the relationships between glucose measures (minimum and maximum glucose values) and VEP measures (N70, P200, and N300 amplitudes and presence of peaks) and between VEP measures and brain injury findings on MRI. Additionally, generalized estimating equations were used to assess the relationships between glucose measures (minimum and maximum glucose values) and SEP measures (presence of P16, N20, and P22 waveforms, and P22 amplitude). Descriptive statistics were used to summarize the relationships between SEP measures and brain injury findings on MRI because there was a large amount of absent latencies for the studied SEP waveforms. All measures analyzed were acquired from tests conducted throughout the first week of life. Analyses were adjusted for umbilical arterial cord pH taken at birth, a clinical marker and measure of severity of perinatal hypoxic ischemia. Associations were considered significant at P < 0.050.
3. Results
3.1. Study cohort
Of 116 neonates (≥36 weeks gestational age) approached, 75 were enrolled in the study, resulting in an enrollment rate of 65%. Of the 75 neonates consented, VEPs were done within the first week of life for 54 neonates as part of standard of care (21 were excluded: 1 declined test, 1 had neuromuscular disorder, 7 withdrew care within 24 hours of life due to severe HIE, 12 had no VEPs done due to changes in NICU guidelines). Of the 54 neonates who had VEPs, 50 also had SEPs done within the first week of life, and all had MRIs. Of the 54 MRIs, if a studied brain region was found to be injured, the injury occurred bilaterally. See Table 1 for a summary of patient demographics.
Table 1.
Patient demographics.
| Subjects Consented (N = 75)# | Subjects with EPs (N = 54) | |
|---|---|---|
| Sex (M:F) | 45:30 | 30:24 |
| Gestational age (wk) | 39.6 ± 1.4 | 39.7 ± 1.4 |
| Birth weight (g) | 3359.8 ± 544.4 | 3363.0 ± 568.5 |
| Head circumference (cm) | 34.2 ± 1.4 | 34.2 ± 1.4 |
| Umbilical arterial cord pH | 7.01 ± 0.17 | 7.01 ± 0.16 |
| Umbilical arterial cord BE | −15.35 ± 7.00 | −15.28 ± 7.43 |
| Apgar score at 5 min | 4.1 ± 2.4 | 4.2 ± 2.2 |
| Minimum glucose (mmol/L) | 2.9 (2.0–3.4) | 2.9 (1.8–3.4) |
| Maximum glucose (mmol/L) | 8.5 (6.6–12.2) | 8.6 (7.1–12.1) |
| VEPs(n = 73) | 54 (72%) | 54 (100%) |
| SEPs(n = 65) | 50 (67%) | 50 (93%) |
| Brain Injury | ||
| Pericalcarine cortex | 6 (9%) | 5 (9%) |
| Posterior white matter | 21 (30%) | 17 (31%) |
| Pulvinar/anterior medial nuclei | 6 (9%) | 5 (9%) |
| Perirolandic cortex | 9 (13%) | 8 (15%) |
| Corticospinal tract | 12 (17%) | 10 (19%) |
| Midbrain | 9 (13%) | 8 (15%) |
| Pons | 4 (6%) | 3(6%) |
| Medulla | 2 (3%) | 2 (4%) |
Expressed as mean +/− SD, median (interquartile range), or frequency (percentage). BE, base excess; EPs, evoked potentials; F, female; M, male; MRI, magnetic resonance imaging; SD, standard deviation; SEPs, somatosensory evoked potentials; VEPs, visual evoked potentials.
Of 75 subjects consented, 69 had an MRI.
3.2. Glucose derangements and VEPs within the first week of life
A total of 73 VEPs were done on 54 neonates during the first week of life. Glucose measures were associated with VEP measures acquired within the first week of life. Adjusting for umbilical arterial cord pH, generalized estimating equations revealed that per 1 mmol/L increase in maximal glucose level there is an associated 0.27 μV (95% Confidence Intervals [CI] − 0.47 to − 0.07, P = 0.009) decrease in P200 amplitude (Table 2; Fig. 1), and an associated 1.14-fold (95% CI 1.00 to 1.29, P = 0.04) increased odds that the N300 peak will be delayed or absent (Table 2). No associations were found for maximum glucose with N70 measures (P > 0.21). Moreover, no associations were found for minimum glucose and any studied VEP measure (P > 0.49).
Table 2.
Generalized estimating equation analyses comparing minimal and maximal glucose levels with VEP measures from all VEPs done within the first week of life.
| Minimum glucose (mmol/L) | Maximum glucose (mmol/L) | ||||||
|---|---|---|---|---|---|---|---|
| Value# | 95% CI | P value | Value# | 95% CI | P value | ||
| N70 | Delayed or absent | 1.03 | 0.62 to 1.71 | 0.90 | 1.09 | 0.95 to 1.25 | 0.23 |
| Amplitude (μV) | −0.02 | −0.22 to 0.18 | 0.84 | −0.03 | −0.07 to 0.02 | 0.21 | |
| P200 | Delayed or absent | 1.18 | 0.73 to 1.93 | 0.50 | 1.11 | 0.99 to 1.25 | 0.08 |
| Amplitude (μV) | −0.30 | −1.47 to 0.86 | 0.61 | −0.27 | −0.47 to −0.07 | 0.009* | |
| N300 | Delayed or absent | 0.93 | 0.57 to 1.52 | 0.79 | 1.14 | 1.00 to 1.29 | 0.04* |
| Amplitude (μV) | −0.87 | −3.31 to 1.57 | 0.49 | −0.26 | −0.84 to 0.32 | 0.38 | |
Analyses adjusted for umbilical arterial cord pH.
CI, confidence interval; VEPs, visual evoked potentials.
P < 0.050.
When comparing glucose levels with delayed or absent VEP waveforms, value represents an odds ratio. When comparing glucose levels with VEP amplitudes, value represents a coefficient.
Fig. 1.
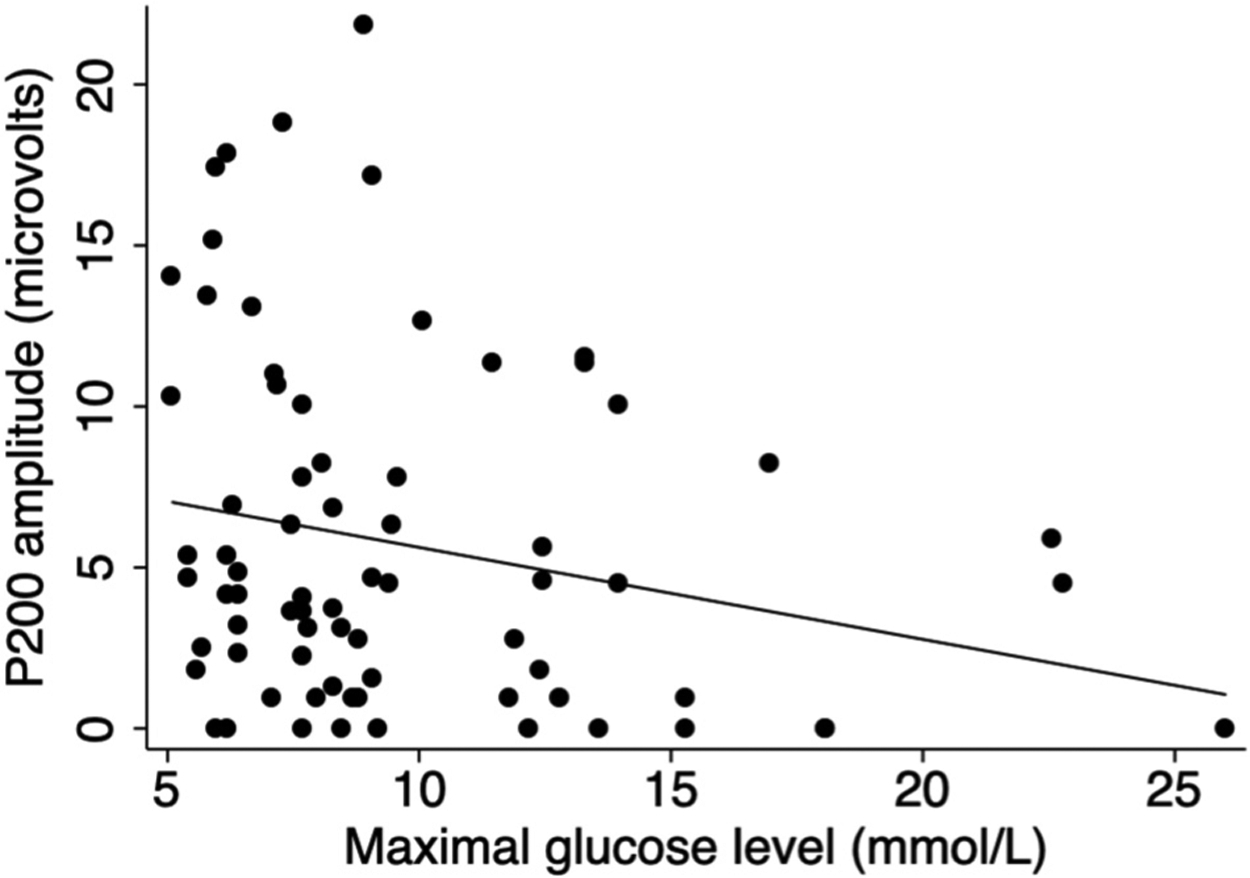
Scatter plot of P200 amplitude compared with maximal glucose level prior to visual evoked potential testing within the first week of life. Fit line adjusts for umbilical arterial cord pH at birth.
3.3. Glucose derangements and SEPs within the first week of life
A total of 65 SEPs were done on 50 neonates during the first week of life. Glucose measures were associated with SEP measures acquired within the first week of life. Adjusting for umbilical arterial cord pH, generalized estimating equations revealed that per 1 mmol/L decrease in minimal glucose level there is an associated 0.09 μV (95% CI 0.01 to 0.17, P = 0.03) decrease in P22 amplitude (Table 3). No associations were found for minimum glucose with P16 (P > 0.22) or N20 (P > 0.88) measures. Furthermore, no associations were found for maximum glucose and any studied SEP measure (P > 0.14).
Table 3.
Generalized estimating equation analyses comparing minimal and maximal glucose levels with SEP measures from all SEPs done within the first week of life.
| Minimum glucose (mmol/L) | Maximum glucose (mmol/L) | ||||||
|---|---|---|---|---|---|---|---|
| Value# | 95% CI | P value | Value# | 95% CI | P value | ||
| P16 | Delayed or absent¶ | 0.67 | 0.35 to 1.27 | 0.22 | 1.22 | 0.94 to 1.59 | 0.14 |
| N20 | Delayed or absent¶ | 1.05 | 0.59 to 1.87 | 0.88 | 1.10 | 0.90 to 1.34 | 0.38 |
| P22 | Delayed or absent¶ | 0.62 | 0.38 to 1.00 | 0.05 | 1.10 | 0.93 to 1.31 | 0.25 |
| Amplitude (μV) | 0.09 | 0.01 to 0.17 | 0.03* | 0.00 | −0.02 to 0.02 | 0.98 | |
Analyses adjusted for umbilical arterial cord pH.
CI, confidence interval; SEPs, somatosensory evoked potentials.
P < 0.050.
When comparing glucose levels with delayed or absent SEP waveforms, value represents an odds ratio. When comparing glucose levels with SEP amplitudes, value represents a coefficient.
SEP waveforms were scored as delayed or absent if the waveform was unilaterally or bilaterally prolonged or absent.
3.4. VEPs and brain injury on MRI within the first week of life
All 54 neonates who had one or more VEPs done within the first week of life, also had an MRI at approximately day 4 of life after patients were rewarmed after undergoing therapeutic hypothermia. VEP measures were associated with brain injury findings on MRI. Generalized estimating equations revealed that the presence of the P200 peak is associated with a 50-fold, 5-fold and 14-fold decreased odds of having brain injury in the pericalcarine cortex (Odds Ratio [OR] 0.02, 95% CI 0.002 to 0.252, P = 0.002), posterior white matter (OR 0.20, 95% CI 0.05 to 0.75, P = 0.02), and pulvinar and/or anterior medial nuclei of the thalamus (OR 0.07, 95% CI 0.01 to 0.50, P = 0.008), respectively (Table 4). The presence of the N300 peak is associated with a 13-fold decreased odds of having brain injury in the pericalcarine cortex (OR 0.08, 95% CI 0.01 to 0.57, P = 0.01), and pulvinar and/or anterior medial nuclei of the thalamus (OR 0.08, 95% CI 0.01 to 0.57, P = 0.01). Moreover, the delay or absence of N300 is associated with a 3-fold increased odds of having brain injury in the posterior white matter (OR 3.38, 95% CI 1.12 to 10.17, P = 0.03). No associations were found for N70 measures with any studied brain region (P > 0.17).
Table 4.
Generalized estimating equation analyses comparing VEP measures and regional brain injury on MRI done within the first week of life.
| Brain ROIs | ||||||||||
|---|---|---|---|---|---|---|---|---|---|---|
| Pericalcarine cortex | Posterior white matter | Pulvinar/anterior medial nuclei | ||||||||
| OR | 95% CI | P value | OR | 95% CI | P value | OR | 95% CI | P value | ||
| N70 | Delayed or absent | 3.92 | 0.40 to 38.82 | 0.24 | 2.00 | 0.69 to 5.77 | 0.20 | 3.92 | 0.40 to 38.82 | 0.24 |
| Peak present | 0.20 | 0.02 to 1.98 | 0.17 | 0.67 | 0.22 to 2.01 | 0.47 | 0.20 | 0.02 to 1.98 | 0.17 | |
| Amplitude (μV) | 0.51 | 0.11 to 2.39 | 0.39 | 1.22 | 0.71 to 2.10 | 0.47 | 0.74 | 0.16 to 3.32 | 0.69 | |
| P200 | Delayed or absent | 2.71 | 0.40 to 18.27 | 0.31 | 2.40 | 0.89 to 6.50 | 0.09 | 7.22 | 0.73 to 70.98 | 0.09 |
| Peak present | 0.02 | 0.002 to 0.252 | 0.002* | 0.20 | 0.05 to 0.75 | 0.02* | 0.07 | 0.01 to 0.50 | 0.008* | |
| Amplitude (μV) | 0.55 | 0.22 to 1.36 | 0.20 | 0.93 | 0.82 to 1.06 | 0.31 | 0.92 | 0.70 to 1.21 | 0.55 | |
| N300 | Delayed or absent | 9.35 | 0.95 to 92.34 | 0.06 | 3.38 | 1.12 to 10.17 | 0.03* | 9.35 | 0.95 to 92.34 | 0.06 |
| Peak present | 0.08 | 0.01 to 0.57 | 0.01* | 0.36 | 0.09 to 1.41 | 0.14 | 0.08 | 0.01 to 0.57 | 0.01* | |
| Amplitude (μV) | 0.66 | 0.41 to 1.06 | 0.09 | 0.99 | 0.92 to 1.07 | 0.86 | 0.98 | 0.80 to 1.20 | 0.84 | |
CI, confidence interval; MRI, magnetic resonance imaging; OR, odds ratio; ROIs, regions of interest; VEPs, visual evoked potentials.
P < 0.050.
3.5. SEPs and brain injury on MRI within the first week of life
All 50 neonates who had one or more SEPs done within the first week of life, also had an MRI at approximately day 4 of life. Of 65 SEPs, 55 (85%) for P16, 50 (77%) for N20, and 52 (80%) for P22 were scored as absent. All neonates with P16, N20 and/or P22 peaks on SEP, whether or not the peak was delayed, had no brain injury in any of the studied brain regions (perirolandic cortex, corticospinal tract, midbrain, pons, or medulla). Of the 48 neonates who had an absent P16 waveform, 7 (15%) had injury in the perirolandic cortex, 9 (19%) in the corticospinal tract, 7 (15%) in the midbrain, 2 (4%) in the pons, and 2 (4%) in the medulla. Of the 43 neonates who had an absent N20 waveform, 7 (16%) had injury in the perirolandic cortex, 9 (21%) in the corticospinal tract, 7 (16%) in the midbrain, 2 (5%) in the pons, and 2 (5%) in the medulla. Lastly, of the 44 neonates who had an absent P22 waveform, 7 (16%) had injury in the perirolandic cortex, 9 (20%) in the corticospinal tract, 7 (16%) in the midbrain, 2 (5%) in the pons, and 2 (5%) in the medulla.
4. Discussion
During the first week of life, utilizing continuous glucose monitoring, neurophysiological tests, and neuroimaging in neonates with HIE who underwent therapeutic hypothermia, we are the first to demonstrate in neonates that maximal but not minimal glucose is associated with VEP measures, which assess the functional integrity of the visual pathway, and that VEP measures are associated with brain injury in regions involved in the visual processing pathway. Further, we show that minimal but not maximal glucose is associated with SEP measures, which assess the functional integrity of the somatosensory pathway, and that only the neonates with absent SEP waveforms have brain injury in the studied regions involved in the somatosensory processing pathway.
Considering the brain consumes approximately 25% of the total glucose used by the body for energy metabolism, with the visual system being one of the most energy-consuming systems in the brain (Wong-Riley, 2010), it is not surprising that this study finds that deviations from euglycemia are associated with VEP measures. This study finds that increased maximal glucose level obtained within the first week of life is associated with a decrease in P200 amplitude and increased odds that the N300 peak will be delayed or absent, suggesting that high glucose is negatively associated with the functional integrity of the visual pathway. Moreover, minimal glucose level is not associated with any studied VEP measure, suggesting that a single low glucose level may not be sufficient to reveal an association with the functional integrity of the visual pathway. Only two previous studies (Tam et al., 2008; Hu et al., 2014) utilized flash VEPs in neonates to investigate the effect of hypoglycemia on VEP measures, and in contrast to results from the current study, both studies found a correlation between hypoglycemia and VEP measures. Considering the current study cohort underwent therapeutic hypothermia, which decreases metabolic demands leading to decreased glucose utilization and resulting in higher glucose concentrations, it is not surprising that we did not find a correlation between minimal glucose and VEP measures unlike previous studies in which subjects did not undergo therapeutic hypothermia (Tam et al., 2008; Hu et al., 2014) because it is possible that the current study cohort may have had a higher threshold to maintain a typical VEP with lower minimal glucose values as a result of undergoing therapeutic hypothermia. Conflicting findings could also be due to both previous studies being retrospective and only symptomatic hypoglycemia based on intermittent glucose testing was studied, without consideration of hyperglycemia. Indeed Hu et al. (2014) acknowledged that their study had selection bias and that it was possible that the incidence of abnormal flash VEP was likely much lower among all cases of neonatal hypoglycemia than what they found since only neonates with significant hypoglycemia underwent flash VEP in their study.
As expected, when comparing measures of functional integrity to measures of structural integrity in the visual processing pathway, this study finds that the presence of the P200 peak and N300 peak are associated with decreased odds of having brain injury in regions involved in the visual processing pathway, suggesting that a typical VEP is reassuring that there is likely no underlying brain injury in the visual processing pathway. Furthermore, a delayed or absent N300 peak is associated with an increased risk of having brain injury in the posterior white matter, suggesting that the N300 peak is a more sensitive VEP measure for predicting whether there will be brain injury in the visual processing pathway, with its presence being reassuring and its delay or absence being concerning. Interestingly, this finding in conjunction with the finding that increased maximal glucose level is associated with increased odds that the N300 peak will be delayed or absent, provides evidence that the posterior white matter may be particularly vulnerable to the negative influence that high glucose may have on the visual processing pathway. This is supported by findings that glucose utilization is variable across brain regions (being very low in regions including the posterior white matter in the first 5 weeks of life; Chugani and Phelps, 1986), and since this cohort underwent therapeutic hypothermia which decreases metabolic demands in turn decreasing glucose utilization leading to higher blood glucose concentrations, it is possible that this resulted in an excess amount of glucose in the posterior white matter potentially leading to injury (Alexandrou et al., 2010).
Unlike its association with the visual processing pathway, glucose has an opposing association with the somatosensory pathway. In accordance with the literature from the pre-therapeutic hypothermia era (Koh et al., 1988; Aynsley-Green, 1991), this study finds that decreased minimal glucose level obtained within the first week of life is associated with a decrease in P22 amplitude, suggesting that low glucose is negatively associated with the functional integrity of the somatosensory pathway, and providing evidence that minimal glucose level may predict SEP measures. Moreover, maximal glucose level is not associated with any studied SEP measure, suggesting that a single high glucose level may not be sufficient to reveal an association with the functional integrity of the somatosensory pathway. Previous studies have found that from birth there is a high rate of glucose utilization in brain regions involved in the somatosensory processing pathway (Chugani and Phelps, 1986; Koh et al., 1988; Chugani et al., 1987), suggesting that glucose is a vital source of energy here with low concentrations potentially having adverse effects on the somatosensory system, which provides support for our current findings. Of note, we previously reported no identifiable aEEG changes associated with hypoglycemia is this same cohort (Pinchefsky et al., 2019), which suggests that SEP measures are more predictive of associations between glucose and brain function than aEEG, highlighting the utility of supplementary neurophysiological tests when investigating brain function in neonates with HIE undergoing therapeutic hypothermia.
Similar to our findings for the visual processing pathway, when comparing measures of functional integrity to measures of structural integrity in the somatosensory processing pathway, this study finds that all neonates who had P16, N20, and/or P22 peaks, regardless of whether a peak is delayed, had no brain injury in regions involved in the somatosensory processing pathway. Further, only neonates with absent SEP waveforms had brain injury, albeit even if the waveforms were absent, the majority of these neonates did not have any brain injury in the studied brain regions involved in the somatosensory processing pathway. This suggests that the mere presence of an SEP peak seems to be reassuring, whereas an absent SEP waveform is concerning but not definitively adverse in regards to underlying brain injury in the somatosensory processing pathway, agreeing with previous studies (Garfinkle et al., 2015). However, regardless of whether the neonate was treated with therapeutic hypothermia, this current study along with previous studies (De Vries et al., 1991; Konito et al., 2013; Cainelli et al., 2018), have demonstrated that it is possible that neonates with HIE can have brain dysfunction revealed with SEPs in the absence of abnormalities on MRI, providing evidence that SEPs can withstand the effects of therapeutic hypothermia, and again highlighting the importance of using SEPs as a complementary test when investigating the brains of neonates with HIE undergoing therapeutic hypothermia. Meanwhile, it is comforting that Cainelli et al. (2018) found that cooled infants with HIE who had a normal MRI typically had a good prognosis with only mild (if any) neurodevelopmental impairments at preschool age and were not at risk for severe neurological sequelae.
One limitation of our current study is that as a prospective observational study, causal links cannot be made between variables. Another limitation is that since the study cohort underwent therapeutic hypothermia for HIE, all neonates were also treated with sedation. It is possible that sedation might have affected the findings (Kumar et al., 2000), however, this is unlikely because less than 10% of neonates had VEPs and SEPs without sedation and many of the findings were in accordance with previous literature. Indeed, several previous studies (Garfinkle et al., 2015; Cainelli et al., 2018; Suppiej et al., 2018) that investigated VEPs and SEPs in the era of therapeutic hypothermia waited until neonates were normothermic to conduct VEPs and SEPs. However, one study (Nevalainen et al., 2017), like the current study, conducted SEPs while neonates were sedated for therapeutic hypothermia, and found that SEP results were preserved, which aligns with the current study that additionally demonstrates that VEP results, like SEP results, can withstand the effects of sedation for therapeutic hypothermia. It is also important to note that the detection rate of SEPs is reduced with increasing number of averaged trials, and thus while increasing number of trials can improve the signal-to-noise ratio, it can also result in habituation (Bongers-Schokking et al., 1989), and could overestimate the frequency of abnormal SEPs. Thus, this potential increase in false positive tests could be decreasing the positive predictive value and specificity of the test. Furthermore, this study was limited by the blood samples used to obtain glucose values and calibrate the CGM. It is known that the type of blood sample (arterial, capillary, venous) and whether whole blood or plasma glucose is measured affects the glucose value result from the blood glucose test (Aynsley-Green, 1991). Since at the study centre, blood samples were quite homogenous with the majority being arterial, and plasma glucose is always measured, we do not think this limitation would have impacted the results of our current study, but may account for some differences in findings when comparing with the literature. This study was also limited by the fact that CGM data could not be time-locked to EP data because EP data was collected retrospectively and detailed timing of EP changes was not recorded in patient medical charts. Although this study did make sure that the minimum and maximum glucose values used for each patient occurred before VEP and SEP tests were conducted, future studies should prospectively collect EP data to ensure that CGM data can be time-locked with EP data. Lastly, we did not adjust for multiple comparisons due to the exploratory nature of the study and small sample size. However, even if we did a Bonferroni correction for a P < 0.025, P200 associations with maximum glucose and brain injury on MRI would still hold.
5. Conclusions
This study is the first study in the era of therapeutic hypothermia to illustrate that deviations from euglycemia have opposing associations with the functional integrity of the visual and somatosensory processing pathways. We find that high glucose is associated with an atypical VEP, whereas low glucose is associated with an atypical SEP. We demonstrate that the presence of the P200 peak and N300 peak predict no underlying brain injury in the visual processing pathway. Likewise, all neonates who had a P16, N20, and/or P22 peak, even if delayed, had no brain injury in the somatosensory processing pathway. Furthermore, a delayed or absent N300 peak predicted posterior white matter injury, and only neonates with absent SEPs had brain injury in the somatosensory processing pathway, although the majority of absent SEPs did not correspond to underlying brain injury. Our findings support the literature (Garfinkle et al., 2015; Cainelli et al., 2018) and provide further evidence that EPs are more resilient to the effects of cooling and should be used as supplementary tests for neonates treated with therapeutic hypothermia for HIE. Future studies need to determine whether there is an optimal glucose level that needs to be maintained for a specific duration in order to improve brain function and prevent brain injury in neonates with HIE, and to investigate whether the current findings can predict long-term developmental outcomes.
HIGHLIGHTS.
Maximal but not minimal glucose is associated with atypical VEPs in neonates treated with therapeutic hypothermia for hypoxic-ischemic encephalopathy (HIE).
Minimal but not maximal glucose is associated with atypical SEPs in neonates treated with therapeutic hypothermia for HIE.
Postnatally, VEPs can predict the presence of brain injury in the visual processing pathway via MRI in cooled neonates with HIE.
Acknowledgments
The authors thank the families and children who have participated in this study. The authors also thank the NOGIN research team, including the SickKids Acute Care Transport Services team for recruiting all study participants, the neurophysiology technologists for performing the VEP and SEP tests, and Ashley LeBlanc for transporting the neonates to/from the MRI scanner. This work was supported by research grants from the Canadian Institutes of Health Research [MOP-133710, PJT-166076] and the National Institutes of Health [R01 HD101419] awarded to EWYT. Continuous glucose monitors were provided by Medtronic Canada. The funders had no role in study design, data collection, analysis or interpretation, decision to publish, or preparation of the manuscript.
Abbreviations:
- aEEG
amplitude-integrated electroencephalogram
- CGM
continuous glucose monitor
- CI
confidence intervals
- EEG
electroencephalogram
- EP
evoked potential
- HIE
hypoxic ischemic encephalopathy
- MRI
magnetic resonance imaging
- NICU
neonatal intensive care unit
- NOGIN
Neurological Outcome of Glucose in Neonatal encephalopathy
- OR
odds ratio
- REDCap
research electronic data capture
- ROI
region of interest
- SEP
somatosensory evoked potential
- VEP
visual evoked potential
Footnotes
Declaration of Competing Interest
The authors have no financial or other conflicts of interest to declare.
Submission declaration and verification
This article has not been published previously, is not under consideration for publication elsewhere, is approved by all authors and tacitly or explicitly by the responsible authorities where the work was carried out, and will not be published elsewhere in the same form, in English or any other language, including electronically without written consent of the copyright-holder.
References
- American Clinical Neurophysiology Society. Guideline 9A: Guidelines on evoked potentials. J Clin Neurophysiol 2006;23:125–37. [DOI] [PubMed] [Google Scholar]
- Alexandrou G, Skiöld B, Karlén J, Tessma MK, Norman M, Adén U, et al. Early hyperglycemia is a risk factor for death and white matter reduction in preterm infants. Pediatrics 2010;125:e584–91. [DOI] [PubMed] [Google Scholar]
- Aynsley-Green A Glucose: a fuel for thought!. J Paediatr Child Health 1991;27:21–30. [DOI] [PubMed] [Google Scholar]
- Barkovich AJ, Miller SP, Bartha A, Newton N, Hamrick SEG, Mukherjee P, et al. MR imaging, MR spectroscopy, and diffusion tensor imaging of sequential studies in neonates with encephalopathy. Am J Neuroradiol 2006;27:533–47. [PMC free article] [PubMed] [Google Scholar]
- Basu SK, Kaiser JR, Guffey D, Minard CG, Guillet R, Gunn AJ, et al. Hypoglycemia and hyperglycemia are associated with unfavourable outcome in infants with hypoxic ischemic encephalopathy: a post hoc analysis of the CoolCap Study. Arch Dis Child Fetal Neonatal Ed 2016;101:F149–55. [DOI] [PubMed] [Google Scholar]
- Basu SK, Salemi JL, Gunn AJ, Kaiser JR. CoolCap Study Group. Hyperglycemia in infants with hypoxic-ischemic encephalopathy is associated with improved outcomes after therapeutic hypothermia: a post hoc analysis of the CoolCap Study. Arch Dis Child Fetal Neonatal Ed 2017;102:F299–306. [DOI] [PubMed] [Google Scholar]
- Bednarek N, Mathur A, Inder T, Wilkinson J, Neil J, Shimony J. Impact of therapeutic hypothermia on MRI diffusion changes in neonatal encephalopathy. Neurology 2012;78:1420–7. [DOI] [PMC free article] [PubMed] [Google Scholar]
- Boardman JP, Hawdon JM. Hypoglycemia and hypoxic-ischemic encephalopathy. Dev Med Child Neurol 2015;57:29–33. [DOI] [PubMed] [Google Scholar]
- Bongers-Schokking CJ, Colon EJ, Hoogland RA, Van den Brande JL, De Groot KJ. The somatosensory evoked potentials of normal infants: influence of filter bandpass, arousal state and number of stimuli. Brain Dev 1989;11:33–9. [DOI] [PubMed] [Google Scholar]
- Cainelli E, Trevisanuto D, Cavallin F, Manara R, Suppiej A. Evoked potentials predict psychomotor development in neonates with normal MRI after hypothermia for hypoxic-ischemic encephalopathy. Clin Neurophysiol 2018;129:1300–6. [DOI] [PubMed] [Google Scholar]
- Chau V, Poskitt KJ, Dunham CP, Hendson G, Miller SP. Magnetic resonance imaging in the encephalopathic term newborn. Curr Pediatr Rev 2014;10:28–36. [DOI] [PubMed] [Google Scholar]
- Chugani HT, Phelps ME. Maturational changes in cerebral function in infants determined by 18FDG positron emission tomography. Science 1986;231:840–3. [DOI] [PubMed] [Google Scholar]
- Chugani HT, Phelps ME, Mazziotta JC. Positron emission tomography study of human brain functional development. Ann Neurol 1987;22:487–97. [DOI] [PubMed] [Google Scholar]
- De Vries LS, Pierrat V, Eken P, Minami T, Daniels H, Casaer P. Prognostic value of early somatosensory evoked potentials for adverse outcome in full-term infants with birth asphyxia. Brain Dev 1991;13:320–5. [DOI] [PubMed] [Google Scholar]
- Douglas-Escobar M, Weiss MD. Hypoxic-ischemic encephalopathy: a review for the clinician. JAMA Pediatr 2015;169:397–403. [DOI] [PubMed] [Google Scholar]
- Garfinkle J, Sant’Anna GM, Rosenblatt B, Majnemer A, Wintermark P, Shevell MI. Somatosensory evoked potentials in neonates with hypoxic-ischemic encephalopathy treated with hypothermia. Eur J Paediatr Neurol 2015;19:423–8. [DOI] [PubMed] [Google Scholar]
- Greisen G, Pryds O. Neonatal hypoglycemia. Lancet 1989;1:1332–3. [DOI] [PubMed] [Google Scholar]
- Harris PA, Taylor R, Thielke R, Payne J, Gonzalez N, Conde JG. Research electronic data capture (REDCap) - A metadata-driven methodology and workflow process for providing translational research informatics support. J Biomed Inform 2009;42:377–81. [DOI] [PMC free article] [PubMed] [Google Scholar]
- Hu L, Gu Q, Zhu Z, Yang C, Chen C, Cao Y, et al. Flash visual evoked potentials are not specific enough to identify parieto-occipital lobe involvement in term neonates after significant hypoglycemia. Acta Paediatr 2014;103:e329–33. [DOI] [PubMed] [Google Scholar]
- Koh TH, Aynsley-Green A, Tarbit M, Eyre JA. Neural dysfunction during hypoglycemia. Arch Dis Child 1988;63:1353–8. [DOI] [PMC free article] [PubMed] [Google Scholar]
- Kontio T, Toet MC, Hellstruöm-Westas L, van Handel M, Groenendaal F, Stjerna S, et al. Early neurophysiology and MRI in predicting neurological outcome at 9–10 years after birth asphyxia. Clin Neurophysiol 2013;124:1089–94. [DOI] [PubMed] [Google Scholar]
- Kubova Z, Chlubnova J, Szanyi J, Kuba M, Kremlacek J. Influence of physiological changes of glycaemia on VEPs and visual ERPs. Physiol Res 2005;54:245–50. [PubMed] [Google Scholar]
- Kumar A, Bhattacharya A, Makhija N. Evoked potential monitoring in anaesthesia and analgesia. Anaesthesia 2000;55:225–41. [DOI] [PubMed] [Google Scholar]
- Lingenfelser T, Buettner UW, Sommerwerck U, Renn W, Eggstein M, Jakober B. Neurophysiological impairments in IDDM patients during euglycemia and hypoglycemia. Diabetes Care 1993;16:1438–45. [DOI] [PubMed] [Google Scholar]
- Martinelli V, Piatti PM, Filippi M, Pacchioni M, Pastore MR, Canal N, et al. Effects of hyperglycemia on visual evoked potentials in insulin-dependent diabetic patients. Acta Diabetol 1992;29:34–7. [DOI] [PubMed] [Google Scholar]
- Nevalainen P, Lauronen L, Metsäranta M, Lönnqvist T, Ahtola E, Vanhatalo S. Neonatal somatosensory evoked potentials persist during hypothermia. Acta Paediatr 2017;106:912–7. [DOI] [PubMed] [Google Scholar]
- Pinchefsky EF, Hahn CD, Kamino D, Chau V, Brant R, Moore AM, et al. Hyperglycemia and glucose variability are associated with worse brain function and seizures in neonatal encephalopathy: a prospective cohort. J Pediatr 2019;209:23–32. [DOI] [PubMed] [Google Scholar]
- Rollins N, Booth T, Morriss MC, Sanchez P, Heyne R, Chalak L. Predictive value of neonatal MRI showing no or minor degrees of brain injury after hypothermia. Pediatr Neurol 2014;50:447–51. [DOI] [PMC free article] [PubMed] [Google Scholar]
- Rutherford M, Ramenghi LA, Edwards AD, Brocklehurst P, Halliday H, Levene M, et al. Assessment of brain tissue injury after moderate hypothermia in neonates with hypoxic-ischemic encephalopathy: a nested substudy of a randomised controlled trial. Lancet Neurol 2010;9:39–45. [DOI] [PMC free article] [PubMed] [Google Scholar]
- Seidl R, Birnbacher R, Hauser E, Bernert G, Freilinger M, Schober E. Brainstem auditory evoked potentials and visually evoked potentials in young patients with IDDM. Diabetes Care 1996;19:1220–4. [DOI] [PubMed] [Google Scholar]
- Suppiej A, Cappellari A, Talenti G, Cainelli E, Di Capua M, Janes A, et al. Bilateral loss of cortical SEPs predict severe MRI lesions in neonatal hypoxic ischemic encephalopathy treated with hypothermia. Clin Neurophysiol 2018;129:95–100. [DOI] [PubMed] [Google Scholar]
- Tam EW, Widjaja E, Blaser SI, Macgregor DL, Satodia P, Moore AM. Occipital lobe injury and cortical visual outcomes after neonatal hypoglycemia. Pediatrics 2008;122:507–12. [DOI] [PubMed] [Google Scholar]
- Tamburrano G, Lala A, Locuratolo N, Leonetti F, Sbraccia P, Giaccari A, et al. Electroencephalography and visually evoked potentials during moderate hypoglycemia. J Clin Endocrinol Metab 1988;66:1301–6. [DOI] [PubMed] [Google Scholar]
- Tamburrano G, Locuratolo N, Pozzessere G, Lostia O, Caiola S, Valle E, et al. Changes in central and peripheral nervous system function during hypoglycemia in man: an electro-physiological quantification. J Endocrinol Invest 1992;15:279–82. [DOI] [PubMed] [Google Scholar]
- Thayyil S, Chandrasekaran M, Taylor A, Bainbridge A, Cady EB, Kling Chong WK, et al. Cerebral magnetic resonance biomarkers in neonatal encephalopathy: a meta-analysis. Pediatrics 2010;125:e382–95. [DOI] [PubMed] [Google Scholar]
- Wong-Riley MT. Energy metabolism of the visual system. Eye Brain 2010;2:99–116. [DOI] [PMC free article] [PubMed] [Google Scholar]