

Abstract
Foxo1 is an essential transcription factor required for the survival and differentiation of memory CD8 T cells, yet it is unclear whether these Foxo1-dependent functions are inherently coupled. To address this question, we examined the effects of different Foxo1 post-translational modifications. Phosphorylation of Foxo1 by Akt kinases at three distinct residues is well characterized to inhibit Foxo1 transcriptional activity. However, the effect of Foxo1 phosphorylation within its DNA-binding domain at Serine 209 by Mst1 kinase is not fully understood. Here, we show that an S209A phospho-null Foxo1 (SA-Foxo1) exhibited Akt-dependent nuclear trafficking in mouse CD8 T cells and augmented the expression of canonical Foxo1 target genes such as Il7r and Sell. In contrast, an S209D phospho-mimetic Foxo1 (SD-Foxo1) was largely excluded from the nucleus of CD8 T cells and failed to transactivate these genes. RNAseq analysis revealed that SD-Foxo1 was associated with a distinct Foxo1-dependent transcriptional profile including genes mediating CD8 effector function and cell survival. Despite defective transactivation of canonical target genes, SD-Foxo1 promoted IL-15-mediated CD8 T cell survival in vitro and survival of short-lived effector cells in vivo in response to Listeria monocytogenes infection. However, SD-Foxo1 actively repressed CD127 expression and failed to generate memory precursors and long-lived memory T cells. Together, these data indicate that S209 is a critical residue for the regulation of Foxo1 subcellular localization and for balancing CD8 T cell differentiation and survival.
Introduction
In response to bacterial or viral infection, CD8 T cells undergo cell fate decisions to appropriately balance pathogen clearance with the generation of long-lived memory to ensure both immediate host survival and durable immunity against subsequent infections. Some transcription factors act at crucial nodes to integrate pathogen and host cues and instruct CD8 T cell differentiation. One such transcription factor, Foxo1, is necessary for the establishment and maintenance of CD8 T cell memory (1–5). Foxo1-regulated genes promote memory T cell development by increasing T cell survival, homing to secondary lymphoid organs, and expression of downstream transcription factors that further establish the memory state (1, 2, 6). Expression of these genes is severely impaired in the absence of Foxo1, resulting in markedly reduced CD8 T cell persistence and expansion during recall responses (1–3).
Foxo1 transcriptional activity is tightly regulated by post-translational modifications including phosphorylation by the kinases Akt and Mst1 (7–10). It is well established that Akt dependent phosphorylation of Foxo1 at threonine (T)24, serine (S)253, and S316 residues prevents Foxo1 transcriptional activity by promoting Foxo1 association with 14-3-3 proteins leading to its cytoplasmic sequestration (7, 8, 11). In contrast, Mst1 phosphorylates Foxo1 at a distinct residue located within its forkhead DNA-binding domain: S212 in humans and S209 in mice (10). The first studies characterizing Mst1 phosphorylation of Foxo1 and its paralog Foxo3 in neurons reported that Mst1 positively regulates Foxo transcription factors by causing dissociation from 14-3-3 proteins promoting Foxo nuclear translocation (10, 12). Conversely, x-ray crystallography data show that S209 directly participates in binding to cognate insulin response elements (IRE) and Daf-16 family binding elements (DBE) (9, 13, 14). Consequently, phosphorylation of the Foxo1 forkhead domain at S209 completely abrogates binding to cognate DNA in vitro (9). Moreover, Mst1 deficiency in humans and mice causes an immunodeficiency syndrome characterized by impaired naïve T cell survival and trafficking and associated autoimmunity (15–22). However, whether this immunodeficiency is a consequence of defective Foxo1 S209 phosphorylation in T cells is unclear. Additionally, the impact of Foxo1 S209 phosphorylation on the expression of canonical Foxo1 target genes and CD8 memory T cell development is unknown.
In this study, we investigated how Foxo1 S209 regulates effector versus memory CD8 T cell differentiation. We generated Foxo1 variants in which S209 was mutated to alanine (S209A, SA) or aspartic acid (S209D, SD) to determine how Foxo1 behaves in the non-phosphorylated or phosphorylated states, respectively. SA-Foxo1 exhibited Akt-dependent nuclear trafficking and largely recapitulated WT-Foxo1 transcriptional activity but unexpectedly was defective in promoting survival of memory-like T cells in vitro. Moreover, SA-Foxo1-reconstituted CD8 T cells favored memory precursor vs short-lived effector differentiation yet were defective in generating central memory T cells in response to L. monocytogenes infection in vivo. In contrast, SD-Foxo1 was exported out of the nucleus and was unable to transactivate canonical target genes, consistent with the structural analyses implicating S209 in direct DNA contact. However, SD-Foxo1-reconstituted T cells had a unique transcriptional signature distinct from WT or Foxo1-deficient T cells including genes that mediate cell survival and CD8 effector function. Furthermore, SD-Foxo1 enhanced CD8 T cell survival in vitro. Finally, we found that SD-Foxo1-reconstituted CD8 T cells favored short-lived effector differentiation and survival but were unable to form CD8 memory precursor cells and memory cells in vivo, in part due to active suppression of CD127 expression.
Together, our findings demonstrate that phosphorylation of Foxo1 at S209 is neither activating nor inhibitory, per se. Instead, modification of Foxo1 at S209 promotes its nuclear exclusion and simultaneously results in expression of alternative transcriptional targets to promote effector function and cell survival at the expense of memory T cell differentiation. Thus, these studies have dissociated the signals for T cell survival from those for memory differentiation.
Material and Methods
Molecular cloning of retroviral Foxo1-GFP variants.
WT-Foxo1-GFP (Addgene, #17551) and ADA-Foxo1-GFP (Addgene, #35640) mammalian expression vectors were purchased from Addgene (23, 24). A non-synonymous substitution in the Addgene vectors located within the Foxo1 transactivation domain that changes a conserved Leucine at position 619 to Proline was reverted to the native Leucine by PCR site-directed mutagenesis. The respective Foxo1-GFP fragments were inserted into the pCigar retroviral vector by PCR, restriction digest, and ligation according to standard protocols. PCR site-directed mutagenesis was used to introduce the serine209alanine (S209A, SA) and serine209aspartate (S209D, SD) mutations into Foxo1 at the Mst1 phosphorylation site, and Gibson Assembly (NEB, #E2611) was used to replace the homologous sequences in Foxo1 with the amplified DNA fragments. To generate the Foxo1 quad mutant (QM-Foxo1: T24A, S209D, S253D, S316A), gene block DNA fragments containing the indicated mutations were synthesized by Integrated DNA Technologies (IDT) and inserted into the retroviral Foxo1-GFP vector by standard restriction digest and ligation. For each retroviral construct, the entirety of the Foxo1 gene was sequenced in the Dartmouth Molecular Biology Core Facility to verify the presence of the intended mutation(s) and the absence of any unintended mutations.
293T transfection and Foxo1 subcellular localization studies.
For 293T studies, cells were transfected by calcium phosphate transfection with retroviral plasmids encoding Foxo1-GFP variants and a mammalian expression vector encoding histone H2B fused to red fluorescent mCherry (H2B-mCherry, Addgene, #20972) (25) as a nuclear marker. At 24 hours post-transfection, 293T cells were seeded on 8-well Nunc Lab-Tek II Chambered Coverglass (ThermoFisher, #155409) at a density of 8 x 10⁴ cells per well in complete DMEM media. At 24 hours post-seeding, 293T cells were treated with Leptomycin B (MilliporeSigma, #L2913) or vehicle control (methanol:H2O) for 6 hours to inhibit exportin/NES-mediated nuclear export. For the final 45 minutes of Leptomycin B treatment, cells were treated with 10 μM MK2206 Akt allosteric inhibitor (Santa Cruz, #sc-364537) or vehicle control. 293T cells were visualized on a Zeiss Axio Observer Z1 microscope at 40X magnification. Foxo1-GFP fluorescence intensity in the nuclear and cytoplasmic compartments was measured using FIJI and the nuclear-to-cytoplasmic ratio (N:C) of Foxo1-GFP was calculated on a per cell basis.
T cell transduction and fluorescence microscopy.
Retroviruses encoding Foxo1-GFP variants were packaged in 293T cells. Whole splenocytes from OT1 TCR transgenic mice were cultured in complete RPMI-1640 media with 0.4 mg/mL chicken ovalbumin (MilliporeSigma, #A5503) and 50 ng/mL recombinant mouse IL-2 (BioLegend, #575406). At 24-32 hours post activation, OT1 T cells were transduced with Foxo1 retroviral supernatants containing 8 μg/mL polybrene and centrifuged at 1,500g for 1.5 hours. After centrifugation, OT1 T cells were rested at 37°C for 1 hour before replacing the viral supernatant with fresh complete RPMI-1640 media containing 50 ng/mL recombinant mouse IL-2. At 48 hours post-transduction, Foxo1-GFP positive OT1 T cells were sorted by fluorescence-activated cell sorting (FACS) and seeded on 8-well chambered coverglass (ThermoFisher, #155409) at a density of 2.1 x 10⁵ cells per well in complete RPMI-1640 media with 50 ng/mL recombinant mouse IL-2. At 24 hours post-seeding, OT1 T cells were treated with 2 μM MK2206 or vehicle control (sterile H2O) for 45 minutes and visualized on a Zeiss Axio Observer Z1 microscope at 63X magnification. Foxo1-GFP fluorescence intensity in the nuclear and cytoplasmic compartments was measured using FIJI and the nuclear-to-cytoplasmic ratio (N:C) of Foxo1-GFP was calculated on a per cell basis.
Immunoblotting.
OT1 T cells were transduced with Foxo1-GFP variants as described above. At 48 hours post-transduction, transduced OT1 T cells were centrifuged in a Ficoll gradient to remove dead cells, treated with 2 μM MK2206 or vehicle control for 45 minutes at 37°C, and lysed using a NE-PER Nuclear and Cytoplasmic Extraction Kit (ThermoFisher, #78833). Immunoblotting was performed according to standard protocols. The following antibodies were purchased from Cell Signaling Technologies: Foxo1 (clones C29H4 Cat # 2880, and D7C1H Cat # 14952), Vinculin (clone E1E9V, Cat #: 13901), and Lamin A/C (clone 4C11, Cat #: 4777). Immunoblots were visualized on a FluorChem Q Multi Image III analyzer (ProteinSimple) and protein band intensity was measured using Alpha View FluorChem Q software (ProteinSimple). The nuclear-to-cytoplasmic ratio (N:C) of Foxo1-GFP was calculated using the protein band intensity of Foxo1-GFP in the nuclear lysate fraction vs. the protein band intensity of Foxo1-GFP in the cytoplasmic lysate fraction.
Mice.
Foxo1fl/fl, Granzyme-B-Cre, CD45.1, OT1 TCR transgenic (Foxo1-cKO-OT1) mice were generated by crossing Granzyme-B-Cre, CD45.1, OT1 mice provided by E. Usherwood with Foxo1fl/fl mice obtained from the Jackson Laboratory (#024756) and originally generated by R. DePinho (26). Foxo1-cKO-OT1 mice were backcrossed to B6/CD45.1/OT1 mice for 6 generations to obtain a background of >95% WT B6. Foxo1-flox, dLck-Cre, P14 TCR transgenic (Foxo1-cKO-P14) mice were provided by S. Hedrick (6). Whenever possible, age- and sex-matched controls were used for experiments. Male and female Foxo1-cKO co-housed mice were used between 6-12 weeks of age for all experiments. Where indicated, WT B6 or B6/CD45.1 mice obtained from the Jackson Laboratory or Charles River were used as recipients of T cell adoptive transfers. All recipient mice were used between 7-10 weeks of age. All mice were cared for according to the guidelines of Dartmouth College and Dartmouth-Hitchcock Medical Center, and the Institutional Animal Care and Use Committee approved all experimental protocols.
In vitro IL-2 and IL-15 T cell polarization.
Retroviruses encoding Foxo1-GFP variants were packaged in 293T cells. Whole splenocytes from Foxo1-cKO-OT1 (OT1 TCR transgenic) mice were cultured in complete RPMI-1640 media with 0.4 mg/mL chicken ovalbumin (MilliporeSigma, # A5503). At 24-32 hours post activation, Foxo1-cKO-OT1 T cells were transduced with Foxo1 retroviral supernatants containing 8 μg/mL polybrene and centrifuged at 1,500 g for 1.5 hours. After centrifugation, Foxo1-cKO-OT1 T cells were rested at 37°C for 1 hour before replacing the viral supernatant with fresh complete RPMI-1640 media. At 24 hours post-transduction, Foxo1-cKO-OT1 T cells were cultured in fresh complete RPMI-1640 with the addition of either 50 ng/mL recombinant mouse IL-2 (BioLegend, #575406) or 50 ng/mL recombinant mouse IL-15 (BioLegend, #566302) to polarize towards effector-like or memory-like phenotypes, respectively. T cell cultures were passaged every 48 hours with fresh complete RPMI-1640 and cytokines. After 4 days, rmIL-2 and rmIL-15 polarized Foxo1-cKO-OT1 T cells were collected and processed for flow cytometry and qRT-PCR.
In vivo Listeria monocytogenes gp33 (Lm33) infections and adoptive T cell transfers.
Retroviruses encoding Foxo1-GFP variants were packaged in 293T cells. CD8 T cells were purified from Foxo1-cKO-P14 (P14 TCR transgenic) mice using an EasySep Mouse CD8+ T Cell Isolation Kit (StemCell Technologies, #19853). Purified Foxo1-cKO-P14 T cells were activated in complete RPMI-1640 media with Dynabeads Mouse T-Activator CD3/CD28 beads (ThermoFisher, #11456D). At 24-32 hours post activation, Foxo1-cKO-P14 T cells were transduced with Foxo1 retroviral supernatants containing 8 μg/mL polybrene and centrifuged at 1,500g for 1.5 hours. After centrifugation, Foxo1-cKO-P14 T cells were rested at 37°C for 1 hour, dissociated from magnetic DynaBeads, and reconstituted in 1X phosphate-buffered saline (PBS) without calcium and magnesium. 5 x 10⁴ transduced Foxo1-cKO-P14 T cells were adoptively transferred by intravenous injection into CD45.1 recipient mice. On the same day as adoptive T cell transfers, 5 mL of brain heart infusion (BHI) broth (MilliporeSigma, #53286) was inoculated with Lm33 (provided by J. Obar and originally generated by H. Shen) (27) and incubated overnight at 37°C, 250 rpm. After overnight culture, the Lm33 was added to 45 mL of additional BHI broth and cultured until reaching an OD600 of 0.797. 5mL of OD 0.797 Lm33 was centrifuged at 16,000g for 15 min and reconstituted in 1 mL of 1X PBS without calcium and magnesium for a concentration of 5 x 10⁹ CFU/mL. The Lm33 was further diluted in 1X PBS to a final concentration of 5 x 10⁵ CFU/mL, and mice were infected by intravenous injection with 5 x 10⁴ CFU of Lm33. Spleens were harvested at 7, 14, and 40 days post infection and processed for flow cytometry.
Flow cytometry.
Spleens were homogenized in complete RPMI-1640 media to generate single-cell suspensions. Red blood cells were lysed using RBC Lysis Buffer (BioLegend, #420301). Alternatively, CD8 T cells were used directly from in vitro cultures. Whole splenocytes or CD8 T cells were stained with Zombie Viability Dye (BioLegend) in 1X PBS without calcium and magnesium according to the manufacturer’s protocol. Cells were blocked using anti-CD16 and anti-CD32 antibodies (Bio X Cell, #BE0307) and stained with fluorochrome-conjugated antibodies diluted in 1X PBS without calcium and magnesium containing 2% FBS and 1 mM EDTA. The following antibodies and dyes were obtained from BioLegend, unless otherwise indicated: CD8 (clone 53-6.7, Cat #s 100734, 100722), CD62L (clone MEL-14, Cat #: 104436), KLRG1 (clone 2F1/KLRG1, Cat #s: 138414, 138416), CD127 (clone A7R34, Cat #: 135010), CD45.2 (clone 104, Cat #:s 109837, 109815), P2RX7 (clone 1F11, Cat#: 148705), Zombie Viability Dyes (Cat #s: 423105, 423113), CellTrace Violet (Thermo Fisher, Cat #: C34557), and Annexin V (Cat #s: 640941, 640908). All flow cytometry data were analyzed using a MACSQuant Analyzer 10 (Miltenyi Biotec) and FlowJo software.
CD8 T cell in vitro survival and proliferation studies
Foxo1-cKO-OT1 T cells were transduced with Foxo1 variants and polarized to memory-like T cells in IL-15 cultures, as described above. Transduced T cells were cultured in IL-15 replete media for 3 days, stained with Zombie Violet and Annexin V APC live dead stains, and further processed for flow cytometry. For proliferation studies, transduced T cells were stained with CellTrace Violet (Thermo Fisher, #C34557) and cultured in IL-15 replete media prior to further processing for flow cytometry.
RNA isolation and qRT-PCR.
T cells were sorted by FACS into Foxo1-GFP+ and Foxo1-GFP− populations. RNA was isolated using TRIzol Reagent (ThermoFisher, #15596026) according to the manufacturer’s protocol. Isolated RNA was reverse transcribed using qScript cDNA SuperMix (Quantabio, #95048) according to the manufacturer’s protocol. Transcripts were quantified using PerfeCTa SYBR Green SuperMix for iQ (Quantabio, #95054) and run in duplicate on a CFX96 Touch Real-Time PCR Detection System (Bio-Rad). Relative transcript quantities were calculated by the ΔΔCq method and normalized to β-actin/Actb using CFX Maestro software (Bio-Rad). The following primer sequences were used as published by Kim, M.V. et al. (1) or obtained from PrimerBank (http://pga.mgh.harvard.edu/primerbank/): Actb (5’-TTGCTGACAGGATGCAGAAG-3’, 5’-ACATCTGCTGGAAGGTGGAC-3’), Bcl2 (5’-ATAACCGGGAGATCGTGATG-3’, 5’-CAGGCTGGAAGGAGAAGATG-3’), Ccr7 (5’-AAAGCACAGCCTTCCTGTGT-3’, 5’-GACCTCATCTTGGCAGAAGC-3’), Foxo1 (5’-CCGGAGTTTAACCAGTCCAA-3’, 5’-TGCTCATAAAGTCGGTGCTG-3’), Il7r (5’-TGGCTCTGGGTAGAGCTTTC-3’, 5’-GTGGCACCAGAAGGAGTGAT’3’), Sell (5’-CTCGAGGAACATCCTGAAGC-3’, 5’-AGCATTTTCCCAGTTCATGG-3’), Tcf7 (5’-CAATCTGCTCATGCCCTACC-3’, 5’-CTTGCTTCTGGCTGATGTCC-3’), Klf2 (5’-CTCAGCGAGCCTATCTTGCC-3’, 5’-CACGTTGTTTAGGTCCTCATCC-3’), and P2rx7 (5’-AGACAAACAAAGTCACCCGG-3’, 5’-GCTCACCAAAGCAAAGCTAATG-3’).
3’ RNA Sequencing
Live, CD8+, Foxo1-GFP+ T cells from IL-15 cultures were sorted using a FACS Aria II. Total RNA was purified using a RNeasy Mini Kit (Qiagen, #74134 / 74136) according to the manufacturer’s protocol. 3’ mRNA libraries were prepared using TruSeq Library Prep Kits (Illumina) according to the manufacturer’s protocol and sequenced using a NextSeq 500 sequencer (Illumina). Reads were quality trimmed using CLC Genomics Workbench Tool (v11.0) and sequences were mapped to the Mus musculus GRCm38/mm10 reference genome using default parameters.
Differential Gene Expression Analyses
Significant differentially expressed genes (DEGs; False Discovery Rate <5%) were identified between SD-Foxo1 and all other variants using DESeq2 (28). DEGs and Foxo1-variant samples were clustered using Pearson uncentered correlation with average linkage. The heatmap color scale was generated based on log2 transformed TPM counts +1 and median centered on a per gene basis.
For pathway analysis, significant differentially expressed genes (DEGs; false discovery rate <5%) were identified between SD-Foxo1 and all other variants using DESeq2. Significant DEGs were annotated with Gene Ontology (GO) functional terms via g:Profiler (29), and GO terms with p<0.05 corrected for multiple testing via default g:SCS method were treated as significant. Pathways with a false discovery rate (FDR) <0.05 were considered significant. To compare pathway enrichment across cell types, we compiled a list of biologically relevant pathways that were significantly different between SD-Foxo1 and at least one other Foxo1 variant and determined their FDR-corrected p-values and direction of regulation in all Foxo1 variants. The direction of regulation for each pathway was based on the mean fold change in gene expression relative to SD-Foxo1 for all gene hits within the specified pathway. Visualizations of these data were created using ggplot2 (v. 3.2.1).
Statistics.
All statistical analyses were performed using Prism 7 or 8 software (GraphPad). Where noted, data were analyzed with two-tailed, unpaired Welch’s or Student’s t tests or 1- or 2-way ANOVA with Tukey’s post-hoc tests to determine whether the means of two or more groups were significantly different. A P value <0.05 was considered to be statistically significant.
Results
SD-Foxo1 is resistant to nuclear localization in CD8 T cells.
In neurons, Foxo1 nuclear localization is promoted by Mst1 phosphorylation and inhibited by Akt phosphorylation via control of Foxo1 binding to 14-3-3 cytosolic adapter proteins (7, 11, 12). To determine the effect of Mst1 on Foxo1 subcellular localization in T cells, we generated a series of GFP-tagged Foxo1 variants. The phospho-null (SA) and phospho-mimetic (SD) Foxo1 variants harbor serine 209 to alanine or aspartic acid substitutions to prevent or mimic Mst1 phosphorylation, respectively (Fig. 1 A). GFP-tagged WT-, SA- and SD-Foxo1 were retrovirally introduced into OT1 TCR transgenic T cells under T cell activating conditions that result in robust Akt activity. Fluorescence microscopy revealed predominantly cytosolic localization of all three variants, including SD-Foxo1, contrary to expectations based on the neuronal studies (Fig. 1, B and C). Conversely, an Akt-insensitive ADA-Foxo1 variant had constitutively nuclear localization, as previously reported (Fig. 1, A–C) (30). When Akt activation was pharmacologically inhibited with MK2206, WT- and SA-Foxo1 localized to the nucleus, consistent with release from 14-3-3. However, SD-Foxo1 remained in the cytosol despite Akt inhibition, indicating that an Akt-independent mechanism controlled its cytosolic localization (Fig.1, B and C).
Figure 1. SD-Foxo1 is resistant to nuclear localization in CD8 T cells.

(A) Schematic of Foxo1 variants including the positions of Akt and Mst1 target residues and functional protein domains; FKHD (forkhead DNA-binding domain), NLS (nuclear localization signal), NES (nuclear export sequence), TAD (transactivation domain). (B) Representative fluorescence microscopy images showing subcellular localization of GFP-tagged Foxo1 variants (white) in OT1 T cells in the absence (vehicle) or presence (MK2206) of Akt inhibition; scale bar = 10μm. (C) Quantification of the nuclear-to cytoplasmic (N:C) ratio of each Foxo1 variant from fluorescence microscopy experiments. (D) Representative western blot of nuclear and cytoplasmic lysates from OT1 T cells transduced with mock empty retrovirus or WT-, SA-, SD-, or ADA-Foxo1 (3) retroviruses and treated with vehicle or MK2206; N (nuclear lysate), C (cytoplasmic lysate); Vinculin served as a cytoplasmic control and Lamin A/C served as a nuclear control; numbers at left indicate approximate molecular weights. (E and F) Quantification of the nuclear-to cytoplasmic (N:C) ratio of each Foxo1 variant (E) or endogenous Foxo1 (Foxo1E; F) from western blot experiments. Results are representative of two independent experiments (B and C) or pooled data from three independent experiments (D, E and F). For (C) and (E), statistical analyses were performed with a 1-way ANOVA and Tukey’s test to adjust for multiple comparisons. For (F), statistical analysis was performed with a two-tailed Welch’s t test. All data are the mean ± SEM. *P < 0.05; ***P < 0.001; ****P < 0.0001.
To validate our findings, T cells expressing the Foxo1 variants were lysed and the quantity of Foxo1 protein was assessed in the nuclear and cytoplasmic fractions. Western blot analysis showed that retrovirally introduced Foxo1 variants were expressed in the bulk T cell population at levels comparable to endogenous Foxo1. In agreement with our fluorescence microscopy data, SD-Foxo1 was resistant to nuclear localization upon Akt inhibition with an approximately 4-fold reduction in N:C ratio compared to WT- and SA-Foxo1 (Fig. 1, D and E). Nevertheless, a small but detectable fraction of SD-Foxo1 remained in the nucleus (Fig. 1, B–E). Importantly, endogenous Foxo1 translocated into the nucleus upon Akt inhibition, which confirmed that MK2206 treatment had the expected effect on Foxo1 trafficking (Fig.1 F) (7, 8). Thus, SD-Foxo1 is resistant to nuclear localization suggesting that, unlike in neurons (10, 12), S209 phosphorylation promotes cytoplasmic localization of Foxo1 in CD8 T cells.
SD-Foxo1 cytoplasmic localization is mediated by enhanced Akt-independent nuclear export.
We next sought to determine whether SD-Foxo1 localization was due to impaired nuclear import or enhanced nuclear export. To distinguish between these possibilities, we generated an additional Foxo1 variant that combined the S209D mutation with the Akt phospho-null ADA mutations (quad mutant, QM-Foxo1), which would allow us to genetically isolate the effect of S209D from that of Akt phospho-residues (Fig. 2 A). Expression of WT- and SD-Foxo1 in 293T cells cultured in serum replete media showed similar subcellular localization to that observed in OT1 T cells, indicating that regulation of Foxo1 at residue 209 is conserved between these cell types (Fig. 2, B, C, and E).
Figure 2. SD-Foxo1 localizes to the cytoplasm due to increased, Akt-independent nuclear export.

(A) Schematic depiction of the QM-Foxo1 variant including the positions of mutated Mst1 and Akt target residues and functional protein domains; FKHD (forkhead DNA-binding domain), NLS (nuclear localization signal), NES (nuclear export sequence), TAD (transactivation domain). (B-D) Representative fluorescence microscopy images showing subcellular localization of GFP-tagged WT- (B), SD- (C), and QM-Foxo1 (D) variants (green) in 293T cells treated with vehicle control, MK2206 Akt inhibitor, Leptomycin B nuclear export inhibitor, or MK2206 and Leptomycin B together. H2B-mCherry was co-expressed as a nuclear marker. Scale bar = 20μm. (E) Quantification of the nuclear-to cytoplasmic (N:C) ratio of each Foxo1 variant from fluorescence microscopy experiments. Results are pooled data from two independent experiments. Statistical analyses were performed with a 2-way ANOVA and Tukey’s test to adjust for multiple comparisons. All data are the mean ± SEM. ***P < 0.001; ****P < 0.0001; NS, not significant.
While Akt inhibition released WT-Foxo1 from 14-3-3 cytosolic adapters allowing nuclear localization of WT-Foxo1, SD-Foxo1 and QM-Foxo1 remained cytoplasmic with a significantly reduced N:C ratio compared to WT-Foxo1 (Fig. 2, D and E). This reinforced the observation that the S209D mutation promotes cytoplasmic localization of Foxo1 independent of Akt phosphorylation. Treatment with the nuclear export inhibitor Leptomycin B alone had little impact on WT- or SD-Foxo1 localization since both were already predominantly cytoplasmic. However, Leptomycin B was sufficient to promote nuclear accumulation of QM-Foxo1 and a significantly higher N:C ratio (Fig. 2, B–E). The capacity of Leptomycin B to promote nuclear accumulation of the Akt-insensitive QM mutant but not the Akt-sensitive SD mutant strongly suggests that in the absence of Akt phosphorylation, mimicking S209 phosphorylation promotes cytoplasmic localization by enhancing Foxo1 nuclear export. This conclusion is further supported by the observation that treatment with MK2206 and Leptomycin B together caused nuclear accumulation of all three Foxo1 variants (Fig. 2, B–E).
Together, these data suggest that phosphorylation of Foxo1 at S209 promotes its cytoplasmic localization in primary murine CD8 T cells in a non-redundant parallel pathway to Akt. Our data in 293T cells also suggests that the cytoplasmic localization of SD-Foxo1 is due to enhanced nuclear export rather than impaired nuclear translocation.
SD-Foxo1 fails to transactivate canonical target genes in memory-like CD8 T cells in vitro.
Foxo1 target genes including Klf2, Sell, and Ccr7 are critical for the development and maintenance of memory CD8 T cells (1, 2, 4, 31). To determine whether Foxo1 variants are capable of rescuing Foxo1 target gene transcription, we generated Foxo1 conditional knockout (cKO) mice in which a floxed Foxo1 allele is deleted in activated CD8 T cells expressing a Granzyme B promoter-driven Cre Recombinase (GzmB-Cre). OT1 transgenic TCR expression allowed tracking of the antigen specific response. These mice and their CD8 T cells are hereafter referred to as Foxo1-cKO-OT1. Foxo1-cKO-OT1 cells were reconstituted with WT- (WTR T cells), SA- (SAR T cells), or SD-Foxo1 (SDR T cells) and cultured in IL-15 containing media (Fig. 3 A). Culturing CD8 T cells in vitro in the presence of IL-15 generates memory-like T cells that express Ccr7 and Sell, which encodes CD62L (32, 33). Under these conditions, both WTR and SAR T cells expressed CD62L at equivalent levels to control Cre-negative T cells that retain endogenous Foxo1 (Foxo1E; Fig. 3, B and C). In contrast, SDR T cells had significantly lower surface expression of CD62L, which was comparable to the level observed in Foxo1-cKO-OT1 T cells (cKO; Fig. 3, B and C).
Figure 3. SD-Foxo1 fails to transactivate canonical target genes in memory-like CD8 T cells in vitro.
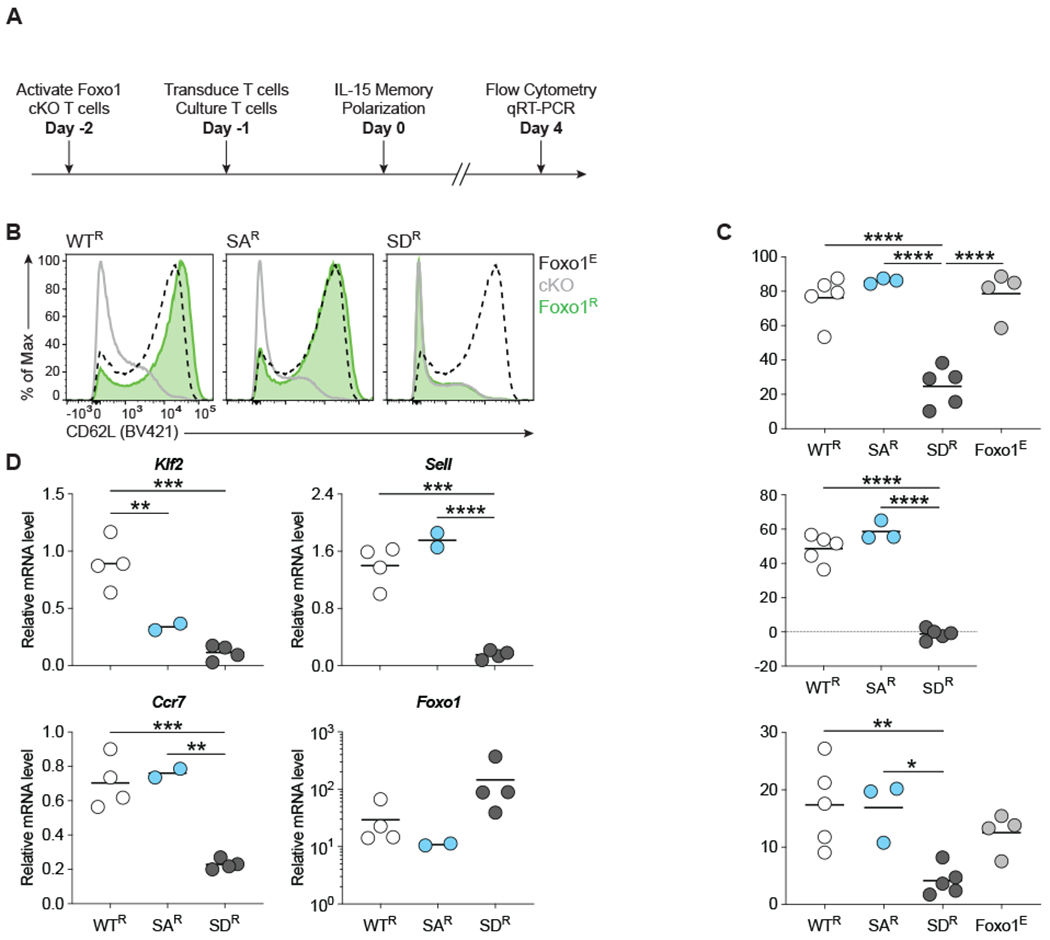
(A) Diagram of experiment design. Foxo1-cKO-OT1 T cells were activated and then transduced with retroviruses encoding GFP-tagged WT-, SA-, or SD-Foxo1 and cultured in the presence of IL-15 for 4 days. Cells were harvested and prepared for analysis by flow cytometry or FACS sorted into GFP+ (Foxo1 variant reconstituted) and GFP− (Foxo1 null) populations for RNA isolation followed by qRT-PCR. Control “Foxo1E” cells were either Foxo1-fl/+, GzmB-Cre+ or Foxo1-fl/fl, GzmB-Cre−.(B) Representative flow cytometry plots of WTR, SAR, SDR, and control T cells stained for CD62L. Events were sequentially gated on the live population (Zombie NIR-), single cells, size, CD8-PE-Cy7+ population, and Foxo1-GFP+ or GFP− populations prior to analysis of CD62L expression. (C) Quantification of CD62L expression in WTR, SAR, SDR, and control T cells represented as the total percentage of CD62L+ cells (Top), the percentage of GFP+, C62L+ cells normalized to respective GFP− populations that lack both endogenous and retroviral Foxo1 (Middle), and CD62L mean fluorescence intensity (MFI) in the GFP+, CD62L+ populations (Bottom). (D) qRT-PCR analysis of Foxo1 target gene relative expression in WTR, SAR, and SDR T cells. Values were normalized to control OT1 T cells expressing endogenous Foxo1 and Actb mRNA by the ΔΔCq method. Flow cytometry data are pooled from 5 independent experiments with n = 5 (WTR and SDR), n = 4 (Foxo1E), or n = 3 (SAR) biological replicates. qRT-PCR data are pooled from 4 independent experiments with n = 4 (WTR and SDR) or n = 2 (SAR) biological replicates. For all graphs, statistical analyses were performed with a 1-way ANOVA and Tukey’s test to adjust for multiple comparisons. All data are the mean (bar) and all individual values (circles). *P < 0.05; **P < 0.01; ***P < 0.001; ****P < 0.0001.
Additionally, the expression of Klf2, Sell, and Ccr7 transcripts was significantly reduced in SDR T cells compared to WTR T cells (Fig. 3 D). SAR T cells expressed Sell and Ccr7 at levels comparable to WTR T cells and significantly higher than SDR T cells, but interestingly were unable to induce expression of Klf2 (Fig. 3 D). The observed differences in target gene transactivation were not due to differential expression of the Foxo1 variants.
In contrast to IL-15, culturing CD8 T cells in vitro in the presence of IL-2 generates effector-like T cells that express much lower levels of Foxo1 target genes (32, 33). Under these conditions, WTR T cells expressed CD62L/Sell, Klf2, and Ccr7 at significantly higher levels than Cre-negative control T cells while SDR T cells failed to express these genes (Fig. S1, A–D). Interestingly, CD62L/Sell expression in SAR T cells was augmented above WTR T cells, but SAR T cells did not express Klf2 or Ccr7 in IL-2 culture conditions (Fig. S1, B–D).
Together, these data suggest that phosphorylation of Foxo1 at S209 impairs the ability of Foxo1 to transactivate canonical target genes in CD8 T cells. While these results are consistent with nuclear exclusion of SD-Foxo1, they do not exclude other negative regulatory mechanisms such as impaired DNA binding (9).
SD-Foxo1 supports an alternative transcriptional program in CD8 T cells.
Foxo1 can promote the transcription of alternative target genes in the absence of direct DNA binding (34, 35). We thus wanted to identify the transcriptome-wide effect of Foxo1 phosphorylation at residue S209. For this purpose, we performed bulk 3’ RNA sequencing (RNAseq) on WTR, SAR, SDR, and Foxo1-cKO T cells from IL-15 cultures and identified differentially expressed genes (DEGs) (Fig 4 A). To determine which functional pathways were differentially regulated by the Foxo1 variants, the significant DEGs between SD-Foxo1 and all other Foxo1 variants were assigned Gene Ontology (GO) functional terms. This analysis revealed that several GO pathways were differentially expressed by SDR cells compared to cKO, WTR or SAR cells (Fig. 4 B). Interestingly, regulation of the GO pathways ‘regulation of translation’, ‘regulation of protein deacetylation’, and ‘regulation of cellular amide metabolic process’ was significantly different between SDR and cKO T cells suggesting functional differences between SD-Foxo1 and Foxo1-deficiency (Fig. 4 B). Additionally, DEGs assigned to the GO functional term ‘positive regulation of immune system process’ had significantly higher expression in SAR T cells as compared to SDR T cells. This pathway includes the canonical Foxo1 target genes Il7r and Sell, which are essential for CD8 T cell memory establishment (1, 2) (Fig. 4 C). In contrast, DEGs assigned to the GO functional term ‘leukocyte mediated cytotoxicity’ are significantly upregulated in SDR T cells as compared to WTR and SAR T cells and include Gzmm, which is also expressed at significantly higher levels in SDR T cells as compared to cKO T cells (Fig. 4 D). Surprisingly, we observed higher mRNA expression of the purinergic receptor P2RX7 (P2rx7) that is required for the survival of memory CD8 T cells (36) in cKO and SDR cells compared to SAR and WT cells. Identification of P2rx7 prompted us to independently analyze known Foxo1 target genes that also regulate cell survival. Among these, Bcl2l11, which encodes the pro-apoptotic protein Bim, had the highest expression in SAR T cells and the lowest expression in SDR T cells (Fig. 4 E). Conversely, expression of anti-apoptotic Bcl2 was not significantly different between Foxo1 variants (data not shown).
Figure 4. SD-Foxo1 supports an alternative transcriptional program in CD8 T cells.

(A) Heatmap of differentially expressed genes (DEGs) between SDR and other cell types based on a false discovery rate (FDR) of <5%. (B) Gene Ontology (GO) pathway analysis demonstrating pathways distinctly regulated by SD-Foxo1. (C) Expression level of DEGs assigned to the ‘positive regulation of immune system process’ GO functional term. (D) Expression level of DEGs assigned to the ‘leukocyte mediated cytotoxicity’ GO functional term. (E) Expression level of Bcl2l11, which encodes the pro-apoptotic protein Bim. In C-E, the expression level was calculated as transcripts per million (TPM) for individual genes. Data are the mean (column) and all individual values (circles). All data are from 3 independent experiments with n = 3 biological replicates. *P < 0.05; **P < 0.01; ***P < 0.001; ****P < 0.0001.
Together, these data suggest that phosphorylation of S209 simultaneously inhibits expression of canonical Foxo1 target genes and supports expression of alternative genes and functional pathways, including those involved in CD8 effector function and cell survival. Furthermore, differentially regulated pathways identified between Foxo1-cKO T cells and SD-Foxo1 T cells suggest that SD-Foxo1 is functionally distinct from knockout of Foxo1.
SD-Foxo1 promotes CD8 T cell survival.
Foxo transcription factors exert distinct effects on cell survival in a cell type and context-dependent manner. Foxo1 is critical for the survival of naïve CD4 and CD8 T cells as well as memory CD8 T cells (1, 2, 31, 37), effects that are partly attributable to induction of CD127 expression and upregulation of Bcl-2. The surprising observation that SDR T cells express high levels of P2rx7 led us to hypothesize that this variant may promote a distinct mode of CD8 T cell survival.
We first sought to independently validate the augmented P2rx7 expression observed in SDR T cells in our RNAseq experiments. We measured the transcript and protein levels of P2rx7/P2RX7 using the in vitro IL-15 culture system. Activated Foxo1-cKO-OT1 cells were reconstituted with Foxo1 variants and allowed to grow in IL-15 containing media for 3 days followed by P2rx7/P2RX7 expression analysis by qRT-PCR (Fig. 5 A) and flow cytometry (Fig. 5 B). Similar to the RNA-seq data, P2rx7 transcript and protein expression were higher in SD-Foxo1 cells as compared to SA-Foxo1 and WT-Foxo1.
Figure 5. SD-Foxo1 promotes CD8 T cell survival.

(A) qRT-PCR analysis of P2rx7 relative expression in WTR, SAR, and SDR T cells. Values were normalized to control OT1 T cells expressing endogenous Foxo1 and Actb mRNA by the ΔΔCq method. (B) Quantification of P2RX7 expression in WTR, SAR and SDR T cells represented as the total percentage of P2RX7+ cells (left). Representative flow cytometry plots showing the % of P2RX7+ cells within the CD8+, Foxo1-GFP+ populations (right). (C) Representative flow cytometry plots of WTR, SAR, and SDR T cells cultured in the presence of IL-15 for 3 days and analyzed for cell death by Annexin V and Zombie Violet staining. (D) Quantification of the percentage of live and dead CD8 T cells as described in (C). Cells negative for both Annexin V and Zombie Violet were considered live and all cells positive for Zombie Violet were considered dead. (E) Representative flow cytometry plots showing Foxo1-GFP gating stratified by expression level in WTR, SAR, and SDR T cells. (F) Quantification of the percentage of live CD8 T cells stratified by GFP expression level as shown in (E). (G) Representative flow cytometry plots of WTR, SAR, and SDR T cells stained with Cell Trace Violet to track their proliferation. (H) Quantification of the data shown in (G). For (A) and (B) data were pooled from three independent experiments. Data in C-H represent two independent experiments with 2 (G and H) or 3 (C-F) biological replicates. For (A), (B), and (D), statistical analyses were performed with a 1-way ANOVA and Tukey’s test to adjust for multiple comparisons. For (F) and (H), statistical analyses were performed with a 2-way ANOVA and Tukey’s test to adjust for multiple comparisons. In (A) and (B), data are the mean (bar) and all individual values (circles). In (D) and (H), data are the mean (column) and SEM (error bars). In (F), data are the mean (circle) and SEM (error bars), *P < 0.05; **P < 0.01; ***P < 0.001; ****P < 0.0001.
We next sought to determine whether SD-Foxo1 confers a survival advantage to CD8 T cells as compared to WT- and SA-Foxo1. Three days post IL-15 culture, Annexin V and Zombie Violet staining revealed a significant increase in the survival of SDR memory-like T cells compared to SAR (Fig. 5, C and D). Moreover, the survival of SAR T cells was significantly lower than both WTR and SDR T cells, despite their robust expression of canonical Foxo1 target genes. Surprisingly, SDR T cells also had significantly increased survival compared to Foxo1-cKO-OT1 T cells (Fig. 5 C and D), despite similar expression of P2rx7/P2RX7 (Fig. 5 A and B) and Bcl2l11 (Fig. 4 E). Stratifying CD8 T cells by their level of Foxo1-GFP expression revealed that the survival differences caused by Foxo1 variants were maintained over a wide range of Foxo1-GFP expression (Fig. 5, E and F). Thus, these differences in survival were independent of corresponding differences in Foxo1 variant expression. In addition, tracking CD8 T cell proliferation with Cell Trace Violet showed no differences in proliferation between Foxo1 variants, demonstrating that differential proliferation did not contribute to the observed differences in the viability of CD8 T cells (Fig. 5, G and H).
Together, these data suggest that phosphorylation at residue S209 promotes Foxo1-dependent CD8 T cell survival through a distinct biological mechanism. The differences in survival between Foxo1 variants may involve P2RX7 and/or Bim. However, this survival advantage is unlikely to be solely dependent on P2rx7 or Bcl2l11 expression since expression of these genes is similar between SDR and Foxo1-cKO T cells despite significantly higher survival of the former.
SD-Foxo1 inhibits formation of CD8 T cell memory precursors and long-lived memory cells by suppressing CD127 expression and promoting SLEC survival in vivo.
Foxo1 is crucial for the generation and maintenance of CD8 memory T cells. Given the failure of SD-Foxo1 to transactivate canonical target genes in vitro, we hypothesized that phosphorylation at residue S209 might be antagonistic to CD8 T cell memory development in vivo. To investigate this, we utilized Foxo1 conditional knockout mice that express distal Lck-Cre (dLck-Cre) and the P14 transgenic TCR that recognizes LCMV glycoprotein 33 (gp33) (2, 4), (Foxo1-cKO-P14). Foxo1-cKO-P14 (cKO) T cells reconstituted with Foxo1 variants (WTR, SAR, SDR) ex vivo were adoptively transferred into congenically marked recipients that were subsequently infected with gp33-expressing Listeria monocytogenes (Lm33) (Fig. 6 A).
Figure 6. SD-Foxo1 fails to promote CD8 T cell memory precursors and long-lived memory cells in vivo.

(A) Diagram of experiment design. (B) Flow cytometry analysis of CD127 and KLRG1 expression in adoptively transferred WTR, SAR, SDR, and cKO T cells at 7 and 14 days post-infection. (Left) representative flow cytometry plots and (right) quantification of the percentage of total CD127+ cells, memory precursor effector cells (MPECs; CD127+, KLRG1−), and short-lived effector cells (SLECs; CD127−, KLRG1+) amongst adoptively transferred Foxo1-GFP-reconstituted and Foxo1-cKO T cells. (C) Flow cytometry analysis of adoptively transferred P14 memory T cell populations at 40 days post-Lm33 infection. (Left) representative flow cytometry plots and (right) quantification of the percentage of total CD127+ cells, central memory T cells (TCM; CD127+, CD62L+), and effector memory T cells (TEM; CD127+, CD62L−) amongst adoptively transferred Foxo1-GFP-reconstituted and Foxo1-cKO T cells. (D) Quantification of CD127 mean fluorescence intensity (MFI) in day-14 WTR, SAR, and SDR T cells stratified by their level of Foxo1-GFP expression. (E) Quantification of the total number of Foxo1-GFP+ cells at 7-, 14-, and 40-day timepoints. (F) Quantification of the percentage of dead cells within the day-7 and day-14 SLEC populations as determined by staining with Zombie Viability Dye. For each timepoint (7, 14, and 40 days), data are pooled from two independent experiments with n = 6-11 biological replicates for Foxo1-GFP-reconstituted groups and n = 23-28 biological replicates for the Foxo1-cKO group. For (B), (C), and (F), statistical analyses were performed with a 1-way ANOVA and Tukey’s test to adjust for multiple comparisons. Data are the mean (bar/column) and all individual values (circles). For (D) and (E), statistical analyses were performed with a 2-way ANOVA and Tukey’s test to adjust for multiple comparisons. Data are the mean (circles) and SD (error bars) (D) or SEM (error bars) (E). For (D), asterisks indicating statistical significance for pairwise comparisons are color-coded: black (SAR vs SDR), dark grey (WTR vs SAR), and light grey (WTR vs SDR). *P < 0.05; **P < 0.01; ***P < 0.001; ****P < 0.0001.
Il7r is a Foxo1 target gene that encodes the interleukin 7-receptor α-chain (IL-7Rα/CD127) and is expressed in both memory precursor effector T cells (MPECs) and long-lived memory T cells. At the peak of CD8 T cell expansion, 7 days post-infection with Lm33, WTR and SAR T cells in the spleen had comparable percentages of CD127+ cells, while SAR T cells produced a significantly higher percentage of CD127+/KLRG1− MPECs (Fig. 6 B). In contrast, SDR T cells had a significant deficit in CD127 expression and MPEC formation compared to WTR and SAR T cells, and instead had increased percentages of CD127−/KLRG1+ short-lived effector cells (SLECs; Fig. 6 B). This was consistent with the RNAseq analyses showing enhanced expression of cytotoxic genes and pathways in SDR T cells (Fig. 4). Surprisingly, the generation of CD127+ cells, including MPECs, was also significantly impaired in SDR T cells compared to cKO T cells while SDR T cells produced a significantly higher percentage of SLECs.
During the contraction phase, 14 days post-Lm33 infection, SDR T cells remained unable to effectively express CD127. Only 5% of SDR T cells expressed CD127, while approximately 35% of WTR, 55% of SAR, and 16% of cKO T cells were CD127+ (Fig. 6 B). Importantly, this ~1.6-fold increase in the percentage of CD127+ SAR T cells compared to WTR T cells suggests that the Foxo1 S209 residue is actively phosphorylated during the contraction phase. These differences corresponded with a significant reduction in MPECs among SDR T cells as compared to WTR, SAR, and cKO T cells. Conversely, SLECs remained significantly enriched amongst SDR T cells as compared to WTR, SAR, and cKO T cells (Fig. 6 B).
Analysis of memory T cells in the spleen at 40 days post-Lm33 infection revealed that SDR T cells had a persistent deficit in CD127 expression as compared to WTR, SAR, and cKO T cells (Fig. 6 C). Although the percentage of CD127+ cKO T cells remained significantly lower than that observed in WTR and SAR T cells, these cells did partially recover CD127 expression in a Foxo1 independent manner, which has been shown by others (2). Surprisingly, SDR T cells failed to recover CD127 expression to the same extent as cKO T cells (Fig. 6 C). Despite persistent differences in CD127 expression, both SAR and SDR T cells failed to generate long-lived CD62L+/CD127+ central memory T cells (TCM) displaying significantly decreased percentages of TCMs compared to their WT-Foxo1 counterparts (Fig. 6 C). This suggests that dynamic regulation of Foxo1 by S209 phosphorylation may be required for commitment to the TCM lineage with both phosphorylated and unphosphorylated forms of Foxo1 serving complementary roles. However, since SA-Foxo1 induces comparable or augmented expression of surface CD62L and Sell transcripts compared to WT-Foxo1 in vitro (Fig. 3, C and D; Fig. 4 C), the lack of CD62L expression by SAR T cells in vivo is unlikely to be due to an intrinsic deficit in the ability of SA-Foxo1 to transactivate target genes. In contrast to TCM formation, SAR T cells generated a significantly higher percentage of CD62L−/CD127+ effector memory T cells (TEM) than WTR, SDR, and cKO T cells (Fig. 6 C).
The surprising deficit in CD127+ memory precursor and long-lived memory formation in SDR T cells as compared to cKO T cells led us to hypothesize that SD-Foxo1 actively suppresses CD127 expression. To investigate this possibility, we stratified day-14 WTR, SAR, and SDR T cells by their level of Foxo1-GFP expression. Interestingly, this revealed that while CD127 mean fluorescence intensity (MFI) increased in proportion to the level of WT- and SA-Foxo1, CD127 MFI decreased in proportion to the level of SD-Foxo1 (Fig. 6 D; dotted line represents the mean CD127 MFI in cKO T cells). Together, these data suggest that rather than functioning as a simple null mutant, SD-Foxo1 actively suppresses at least one canonical target gene in vivo. This phenomenon may underlie the distinct capacities of SDR and cKO T cells to form MPECs, SLECs, and long-lived memory cells.
We next sought to determine how these Foxo1 variants impacted the numbers and survival of CD8 T cells throughout their response to Lm33 infection. At the peak of expansion, there were significantly more SDR T cells as compared to WTR and SAR T cells (Fig. 6 E). Although the total number of SDR T cells remained elevated at 14- and 40-days post infection, the number of these cells was more similar to that of WTR and SAR T cells. Interestingly, there was significantly less death of SDR SLECs as compared to cKO SLECs at both 7- and 14-days post infection (Fig. 6 F). The enhanced survival of SDR SLECs likely contributes to the increased percentage of these cells in vivo and agrees with the enhanced survival of SDR T cells in the in vitro experiments (Fig. 5). However, this survival advantage appears to be limited to SLECs in vivo as other subsets of SDR T cells had comparable survival to their WTR and SAR counterparts (data not shown).
Altogether, these results suggest that phosphorylation of Foxo1 at S209 represses CD8 memory T cell formation in vivo by actively inhibiting the expression of CD127. Our data also suggest that S209 phosphorylation simultaneously promotes the preferential survival of SLECs.
Discussion
Since Foxo transcription factors were first identified as Mst1 substrates in neurons (10, 12), phosphorylation of Foxo1 by Mst1 has been widely viewed as an activating event (38–41). Deficiency of Mst1 or Foxo1 in T cells results in partially overlapping phenotypes including decreased numbers of naïve T cells in secondary lymphoid organs and increased T cell susceptibility to apoptosis (31, 37, 42–44). However, in contrast to the profound deficiency of Klf2, CD62L, CCR7 and CD127 expression in Foxo1 cKO T cells (1, 2, 31, 37), loss of Mst1 in T cells does not diminish expression of these Foxo1 targets (42, 43, 45). To date, the extent to which these distinct and overlapping features are mediated through an Mst1-Foxo1 transcriptional axis or by the independent functions of either protein has not been directly examined in T cells. In this study, we performed a comprehensive analysis to determine how the Mst1 target residue S209 impacts Foxo1 transcription in CD8 T cells using phospho-null SA-Foxo1 and phospho-mimetic SD-Foxo1 variants. These studies yielded several unexpected and novel findings: we found that phospho-mimetic SD-Foxo1 fails to induce the canonical Foxo1 transcription program required for CD8 memory T cell development and maintenance (1, 2). Instead, SD-Foxo1 was associated with a distinct transcriptional signature from that of WT-Foxo1, SA-Foxo1, and Foxo1-cKO; furthermore, SD-Foxo1 actively suppressed the expression of CD127 during the CD8 T cell response to infection in vivo. Importantly, SD-Foxo1 promoted CD8 T cell survival in vitro and SLEC survival in vivo despite the absence of canonical target gene expression. And surprisingly, we found that SD-Foxo1 is resistant to nuclear localization in CD8 T cells whereas SA-Foxo1 retains typical Akt-dependent nuclear transport.
Our in vivo studies demonstrate that SDR T cells have a profound deficit in their ability to generate memory precursors and long-lived memory cells, even compared to Foxo1-cKO T cells. This corresponds with dose dependent suppression of CD127 expression by SD-Foxo1 and an increased percentage and survival of SDR SLECs compared to their cKO counterparts. These findings suggest that phosphorylation of Foxo1 at S209 actively promotes the effector response at the expense of memory formation. Surprisingly, SAR T cells were also defective in TCM generation, despite their robust expression of CD127 and capacity to form memory precursors and effector memory T cells. This observation suggests that – while phosphorylation of Foxo1 at S209 may be antagonistic to memory precursor formation – both phosphorylated and unphosphorylated Foxo1 are necessary for the expression of CD62L and generation of TCM in vivo. Whether this reflects distinct temporal regulation of Foxo1 phosphorylation or direct cooperation between the phosphorylated and unphosphorylated forms of Foxo1 is an important avenue for future investigation. The differences we observed in the ability of SA-Foxo1 to induce Klf2 and Sell/CD62L expression in vitro and in vivo are also intriguing. However, because these analyses were performed at 6 days post-T cell activation versus 40 days post-Lm33 infection, respectively, and because Klf2 expression was not measured in vivo, it is not possible to directly relate these findings based on the available data.
Together, our RNAseq analysis, survival data, and in vivo studies highlight novel SD-Foxo1 functions that cannot be explained by the simple loss of function observed in Foxo1-cKO T cells. RNA sequencing analysis revealed that SDR T cells had a partially distinct transcriptional signature from Foxo1-cKO T cells. Furthermore, examining the relationship between SD-Foxo1 expression and CD127 expression in vivo revealed that SD-Foxo1 actively suppresses CD127 expression. We also found that SD-Foxo1 enhances the survival of IL-15 cultured CD8 T cells in vitro and SLECs in vivo. This was surprising given that SDR T cells did not express canonical Foxo1 targets. We identified high P2RX7 expression and low Bcl2l11 expression in SDR T cells, which may contribute to the survival advantage of these cells. However, the increased survival of SDR T cells compared to cKO T cells both in vitro and in vivo suggests that other survival mechanisms are also important. These findings may be partly explained by our fluorescence microscopy and western blot studies quantifying Foxo1 subcellular localization, which show a residual pool of SD-Foxo1 in the nucleus despite its predominantly cytoplasmic localization. Thus, it is possible that the interaction of SD-Foxo1 with other transcription factors in the nucleus can promote expression of non-canonical target genes (46–49). In addition, residual SD-Foxo1 in the nucleus may indirectly affect gene expression by inhibiting other transcription factors, similar to Foxo1-mediated repression of T-bet (6, 50). Together, these data suggest that phosphorylation of Foxo1 at S209 does not simply inactivate Foxo1 but instead diverts its activity towards distinct cellular functions.
The similarity we identified between WT- and phospho-null SA-Foxo1 nuclear trafficking agrees with work by Du and colleagues, which suggests that Foxo1 localization is similar in Mst1-sufficient and Mst1-deficient murine CD4 T cells (18). However, this finding, in combination with the unexpected observation that phospho-mimetic SD-Foxo1 is resistant to nuclear localization, is in marked contrast to previous findings in neurons. Those studies indicated that Mst1 promotes the nuclear localization of Foxo1 and its close mammalian paralog Foxo3 by causing their dissociation from 14-3-3 adaptors (10, 12). Our finding that phospho-mimetic SD-Foxo1, and it’s Akt-insensitive counterpart QM-Foxo1, have enhanced nuclear export through an Akt-independent mechanism does not exclude the ability of Mst1 to cause Foxo1 dissociation from 14-3-3. However, it does suggest that in antigen and cytokine stimulated CD8 T cells the cumulative effect of Foxo1 phosphorylation at S209 is increased cytoplasmic localization. Thus, our data suggest a unique role for S209 phosphorylation in regulating the nuclear-to-cytoplasmic shuttling of Foxo1 in CD8 T cells. Whether this directly causes impaired transactivation of Foxo1 target genes or is a consequence of altered DNA targeting is an important avenue for future investigation.
To our knowledge, Mst1 is the only known kinase that phosphorylates Foxo1 at S209. Nevertheless, we cannot exclude the possibility that this residue is a substrate for other kinases, and the discovery of additional kinases that phosphorylate Foxo1 at this site would be a significant finding. Complementary studies are warranted to further elucidate the findings described herein. In particular, the marked difference we observed between WT- and SA-Foxo1 transactivation of CD127 during the CD8 T cell contraction phase makes this an exciting physiologic context for future investigation.
In summary, our findings suggest that phosphorylation of S209 allows Foxo1 to mediate unique functions in different phases of the CD8 T cell response. Future studies may support the role of Mst1 as neither a simple activator nor repressor of Foxo1 or identify additional kinases that regulate Foxo1 through the S209 residue. Our work suggests that dynamic modulation of Foxo1 activity via phosphorylation at S209 is critical for balancing CD8 T cell differentiation and survival with the biological context.
Supplementary Material
Key Points.
Disrupting the Foxo1 Mst1-phosphoresidue Ser209 abrogates central memory T cells.
Foxo1 phosphomimetic Ser209D inhibits canonical target genes including CD127.
S209D promotes distinct gene pathways and context-dependent survival advantages.
Acknowledgements
We thank S. M. Hedrick (University of California, San Diego) for Foxo1-cKO-P14 mice; G. Ward in the DartLab FACS core facility for cell sorting; the Dartmouth microscopy core facility for training in fluorescence microscopy; F. W. Kolling IV for RNA sequencing; and H. Nguyen and other members of the Huang laboratory for discussions and technical assistance.
This work was supported by the National Institutes of Health grant R01-AI089805 to Y.H.H., P20-GM103506 to Dr. W.R. Green, T32-AI007363 to L.B.H., the Burroughs Wellcome Fund, Big Data in the Life Sciences Training Program to H.E.L. and P30-CA023108 to Dr. S.D. Leach which supports the Norris Cotton Cancer Center’s genomics, microscopy and flow cytometry cores.
References
- 1.Kim MV, Ouyang W, Liao W, Zhang MQ, and Li MO. 2013. The transcription factor Foxo1 controls central-memory CD8+ T cell responses to infection. Immunity 39: 286–297. [DOI] [PMC free article] [PubMed] [Google Scholar]
- 2.Hess Michelini R, Doedens AL, Goldrath AW, and Hedrick SM. 2013. Differentiation of CD8 memory T cells depends on Foxo1. J Exp Med 210: 1189–1200. [DOI] [PMC free article] [PubMed] [Google Scholar]
- 3.Utzschneider DT, Delpoux A, Wieland D, Huang X, Lai CY, Hofmann M, Thimme R, and Hedrick SM. 2018. Active Maintenance of T Cell Memory in Acute and Chronic Viral Infection Depends on Continuous Expression of FOXO1. Cell Rep 22: 3454–3467. [DOI] [PMC free article] [PubMed] [Google Scholar]
- 4.Delpoux A, Michelini RH, Verma S, Lai CY, Omilusik KD, Utzschneider DT, Redwood AJ, Goldrath AW, Benedict CA, and Hedrick SM. 2018. Continuous activity of Foxo1 is required to prevent anergy and maintain the memory state of CD8(+) T cells. J Exp Med 215: 575–594. [DOI] [PMC free article] [PubMed] [Google Scholar]
- 5.Tejera MM, Kim EH, Sullivan JA, Plisch EH, and Suresh M. 2013. FoxO1 controls effector-to-memory transition and maintenance of functional CD8 T cell memory. J Immunol 191: 187–199. [DOI] [PMC free article] [PubMed] [Google Scholar]
- 6.Delpoux A, Lai CY, Hedrick SM, and Doedens AL. 2017. FOXO1 opposition of CD8(+) T cell effector programming confers early memory properties and phenotypic diversity. Proc Natl Acad Sci U S A 114: E8865–E8874. [DOI] [PMC free article] [PubMed] [Google Scholar]
- 7.Biggs WH 3rd, Meisenhelder J, Hunter T, Cavenee WK, and Arden KC. 1999. Protein kinase B/Akt-mediated phosphorylation promotes nuclear exclusion of the winged helix transcription factor FKHR1. Proc Natl Acad Sci U S A 96: 7421–7426. [DOI] [PMC free article] [PubMed] [Google Scholar]
- 8.Nakae J, Park BC, and Accili D. 1999. Insulin stimulates phosphorylation of the forkhead transcription factor FKHR on serine 253 through a Wortmannin-sensitive pathway. J Biol Chem 274: 15982–15985. [DOI] [PubMed] [Google Scholar]
- 9.Brent MM, Anand R, and Marmorstein R. 2008. Structural basis for DNA recognition by FoxO1 and its regulation by posttranslational modification. Structure 16: 1407–1416. [DOI] [PMC free article] [PubMed] [Google Scholar]
- 10.Lehtinen MK, Yuan Z, Boag PR, Yang Y, Villen J, Becker EB, DiBacco S, de la Iglesia N, Gygi S, Blackwell TK, and Bonni A. 2006. A conserved MST-FOXO signaling pathway mediates oxidative-stress responses and extends life span. Cell 125: 987–1001. [DOI] [PubMed] [Google Scholar]
- 11.Brunet A, Bonni A, Zigmond MJ, Lin MZ, Juo P, Hu LS, Anderson MJ, Arden KC, Blenis J, and Greenberg ME. 1999. Akt promotes cell survival by phosphorylating and inhibiting a Forkhead transcription factor. Cell 96: 857–868. [DOI] [PubMed] [Google Scholar]
- 12.Yuan Z, Lehtinen MK, Merlo P, Villen J, Gygi S, and Bonni A. 2009. Regulation of neuronal cell death by MST1-FOXO1 signaling. J Biol Chem 284: 11285–11292. [DOI] [PMC free article] [PubMed] [Google Scholar]
- 13.Obsil T, and Obsilova V. 2011. Structural basis for DNA recognition by FOXO proteins. Biochim Biophys Acta 1813: 1946–1953. [DOI] [PubMed] [Google Scholar]
- 14.Obsil T, and Obsilova V. 2008. Structure/function relationships underlying regulation of FOXO transcription factors. Oncogene 27: 2263–2275. [DOI] [PubMed] [Google Scholar]
- 15.Abdollahpour H, Appaswamy G, Kotlarz D, Diestelhorst J, Beier R, Schaffer AA, Gertz EM, Schambach A, Kreipe HH, Pfeifer D, Engelhardt KR, Rezaei N, Grimbacher B, Lohrmann S, Sherkat R, and Klein C. 2012. The phenotype of human STK4 deficiency. Blood 119: 3450–3457. [DOI] [PMC free article] [PubMed] [Google Scholar]
- 16.Crequer A, Picard C, Patin E, D’Amico A, Abhyankar A, Munzer M, Debre M, Zhang SY, de Saint-Basile G, Fischer A, Abel L, Orth G, Casanova JL, and Jouanguy E. 2012. Inherited MST1 deficiency underlies susceptibility to EV-HPV infections. PLoS One 7: e44010. [DOI] [PMC free article] [PubMed] [Google Scholar]
- 17.Nehme NT, Schmid JP, Debeurme F, Andre-Schmutz I, Lim A, Nitschke P, Rieux-Laucat F, Lutz P, Picard C, Mahlaoui N, Fischer A, and de Saint Basile G. 2012. MST1 mutations in autosomal recessive primary immunodeficiency characterized by defective naive T-cell survival. Blood 119: 3458–3468. [DOI] [PMC free article] [PubMed] [Google Scholar]
- 18.Du X, Shi H, Li J, Dong Y, Liang J, Ye J, Kong S, Zhang S, Zhong T, Yuan Z, Xu T, Zhuang Y, Zheng B, Geng JG, and Tao W. 2014. Mst1/Mst2 regulate development and function of regulatory T cells through modulation of Foxo1/Foxo3 stability in autoimmune disease. J Immunol 192: 1525–1535. [DOI] [PubMed] [Google Scholar]
- 19.Dang TS, Willet JD, Griffin HR, Morgan NV, O’Boyle G, Arkwright PD, Hughes SM, Abinun M, Tee LJ, Barge D, Engelhardt KR, Jackson M, Cant AJ, Maher ER, Koref MS, Reynard LN, Ali S, and Hambleton S. 2016. Defective Leukocyte Adhesion and Chemotaxis Contributes to Combined Immunodeficiency in Humans with Autosomal Recessive MST1 Deficiency. J Clin Immunol 36: 117–122. [DOI] [PMC free article] [PubMed] [Google Scholar]
- 20.Xu X, Jaeger ER, Wang X, Lagler-Ferrez E, Batalov S, Mathis NL, Wiltshire T, Walker JR, Cooke MP, Sauer K, and Huang YH. 2014. Mst1 directs Myosin IIa partitioning of low and higher affinity integrins during T cell migration. PLoS One 9: e105561. [DOI] [PMC free article] [PubMed] [Google Scholar]
- 21.Xu X, Wang X, Todd EM, Jaeger ER, Vella JL, Mooren OL, Feng Y, Hu J, Cooper JA, Morley SC, and Huang YH. 2016. Mst1 Kinase Regulates the Actin-Bundling Protein L-Plastin To Promote T Cell Migration. J Immunol 197: 1683–1691. [DOI] [PMC free article] [PubMed] [Google Scholar]
- 22.Katagiri K, Imamura M, and Kinashi T. 2006. Spatiotemporal regulation of the kinase Mst1 by binding protein RAPL is critical for lymphocyte polarity and adhesion. Nat Immunol 7: 919–928. [DOI] [PubMed] [Google Scholar]
- 23.Frescas D, Valenti L, and Accili D. 2005. Nuclear trapping of the forkhead transcription factor FoxO1 via Sirt-dependent deacetylation promotes expression of glucogenetic genes. J Biol Chem 280: 20589–20595. [DOI] [PubMed] [Google Scholar]
- 24.Qiang L, Banks AS, and Accili D. 2010. Uncoupling of acetylation from phosphorylation regulates FoxO1 function independent of its subcellular localization. J Biol Chem 285: 27396–27401. [DOI] [PMC free article] [PubMed] [Google Scholar]
- 25.Nam HS, and Benezra R. 2009. High levels of Id1 expression define B1 type adult neural stem cells. Cell Stem Cell 5: 515–526. [DOI] [PMC free article] [PubMed] [Google Scholar]
- 26.Paik JH, Kollipara R, Chu G, Ji H, Xiao Y, Ding Z, Miao L, Tothova Z, Horner JW, Carrasco DR, Jiang S, Gilliland DG, Chin L, Wong WH, Castrillon DH, and DePinho RA. 2007. FoxOs are lineage-restricted redundant tumor suppressors and regulate endothelial cell homeostasis. Cell 128: 309–323. [DOI] [PMC free article] [PubMed] [Google Scholar]
- 27.Shedlock DJ, Whitmire JK, Tan J, MacDonald AS, Ahmed R, and Shen H. 2003. Role of CD4 T cell help and costimulation in CD8 T cell responses during Listeria monocytogenes infection. J Immunol 170: 2053–2063. [DOI] [PubMed] [Google Scholar]
- 28.Love MI, Huber W, and Anders S. 2014. Moderated estimation of fold change and dispersion for RNA-seq data with DESeq2. Genome Biol 15: 550. [DOI] [PMC free article] [PubMed] [Google Scholar]
- 29.Reimand J, Kull M, Peterson H, Hansen J, and Vilo J. 2007. g:Profiler--a web-based toolset for functional profiling of gene lists from large-scale experiments. Nucleic Acids Res 35: W193–200. [DOI] [PMC free article] [PubMed] [Google Scholar]
- 30.Kitamura YI, Kitamura T, Kruse JP, Raum JC, Stein R, Gu W, and Accili D. 2005. FoxO1 protects against pancreatic beta cell failure through NeuroD and MafA induction. Cell Metab 2: 153–163. [DOI] [PubMed] [Google Scholar]
- 31.Kerdiles YM, Beisner DR, Tinoco R, Dejean AS, Castrillon DH, DePinho RA, and Hedrick SM. 2009. Foxo1 links homing and survival of naive T cells by regulating L-selectin, CCR7 and interleukin 7 receptor. Nat Immunol 10: 176–184. [DOI] [PMC free article] [PubMed] [Google Scholar]
- 32.Weninger W, Crowley MA, Manjunath N, and von Andrian UH. 2001. Migratory properties of naive, effector, and memory CD8(+) T cells. J Exp Med 194: 953–966. [DOI] [PMC free article] [PubMed] [Google Scholar]
- 33.Manjunath N, Shankar P, Wan J, Weninger W, Crowley MA, Hieshima K, Springer TA, Fan X, Shen H, Lieberman J, and von Andrian UH. 2001. Effector differentiation is not prerequisite for generation of memory cytotoxic T lymphocytes. J Clin Invest 108: 871–878. [DOI] [PMC free article] [PubMed] [Google Scholar]
- 34.Kim YH, Choi J, Yang MJ, Hong SP, Lee CK, Kubota Y, Lim DS, and Koh GY. 2019. A MST1-FOXO1 cascade establishes endothelial tip cell polarity and facilitates sprouting angiogenesis. Nat Commun 10: 838. [DOI] [PMC free article] [PubMed] [Google Scholar]
- 35.Ramaswamy S, Nakamura N, Sansal I, Bergeron L, and Sellers WR. 2002. A novel mechanism of gene regulation and tumor suppression by the transcription factor FKHR. Cancer Cell 2: 81–91. [DOI] [PubMed] [Google Scholar]
- 36.Borges da Silva H, Beura LK, Wang H, Hanse EA, Gore R, Scott MC, Walsh DA, Block KE, Fonseca R, Yan Y, Hippen KL, Blazar BR, Masopust D, Kelekar A, Vulchanova L, Hogquist KA, and Jameson SC. 2018. The purinergic receptor P2RX7 directs metabolic fitness of long-lived memory CD8(+) T cells. Nature 559: 264–268. [DOI] [PMC free article] [PubMed] [Google Scholar]
- 37.Ouyang W, Beckett O, Flavell RA, and Li MO. 2009. An essential role of the Forkhead-box transcription factor Foxo1 in control of T cell homeostasis and tolerance. Immunity 30: 358–371. [DOI] [PMC free article] [PubMed] [Google Scholar]
- 38.Calnan DR, and Brunet A. 2008. The FoxO code. Oncogene 27: 2276–2288. [DOI] [PubMed] [Google Scholar]
- 39.Hedrick SM, Hess Michelini R, Doedens AL, Goldrath AW, and Stone EL. 2012. FOXO transcription factors throughout T cell biology. Nat Rev Immunol 12: 649–661. [DOI] [PMC free article] [PubMed] [Google Scholar]
- 40.Lam EW, Brosens JJ, Gomes AR, and Koo CY. 2013. Forkhead box proteins: tuning forks for transcriptional harmony. Nat Rev Cancer 13: 482–495. [DOI] [PubMed] [Google Scholar]
- 41.Ouyang W, and Li MO. 2011. Foxo: in command of T lymphocyte homeostasis and tolerance. Trends Immunol 32: 26–33. [DOI] [PMC free article] [PubMed] [Google Scholar]
- 42.Choi J, Oh S, Lee D, Oh HJ, Park JY, Lee SB, and Lim DS. 2009. Mst1-FoxO signaling protects Naive T lymphocytes from cellular oxidative stress in mice. PLoS One 4: e8011. [DOI] [PMC free article] [PubMed] [Google Scholar]
- 43.Zhou D, Medoff BD, Chen L, Li L, Zhang XF, Praskova M, Liu M, Landry A, Blumberg RS, Boussiotis VA, Xavier R, and Avruch J. 2008. The Nore1B/Mst1 complex restrains antigen receptor-induced proliferation of naive T cells. Proc Natl Acad Sci U S A 105: 20321–20326. [DOI] [PMC free article] [PubMed] [Google Scholar]
- 44.Dong Y, Du X, Ye J, Han M, Xu T, Zhuang Y, and Tao W. 2009. A cell-intrinsic role for Mst1 in regulating thymocyte egress. J Immunol 183: 3865–3872. [DOI] [PubMed] [Google Scholar]
- 45.Mou F, Praskova M, Xia F, Van Buren D, Hock H, Avruch J, and Zhou D. 2012. The Mst1 and Mst2 kinases control activation of rho family GTPases and thymic egress of mature thymocytes. J Exp Med 209: 741–759. [DOI] [PMC free article] [PubMed] [Google Scholar]
- 46.Seoane J, Le HV, Shen L, Anderson SA, and Massague J. 2004. Integration of Smad and forkhead pathways in the control of neuroepithelial and glioblastoma cell proliferation. Cell 117: 211–223. [DOI] [PubMed] [Google Scholar]
- 47.Puigserver P, Rhee J, Donovan J, Walkey CJ, Yoon JC, Oriente F, Kitamura Y, Altomonte J, Dong H, Accili D, and Spiegelman BM. 2003. Insulin-regulated hepatic gluconeogenesis through FOXO1-PGC-1alpha interaction. Nature 423: 550–555. [DOI] [PubMed] [Google Scholar]
- 48.Lin YC, Jhunjhunwala S, Benner C, Heinz S, Welinder E, Mansson R, Sigvardsson M, Hagman J, Espinoza CA, Dutkowski J, Ideker T, Glass CK, and Murre C. 2010. A global network of transcription factors, involving E2A, EBF1 and Foxo1, that orchestrates B cell fate. Nat Immunol 11: 635–643. [DOI] [PMC free article] [PubMed] [Google Scholar]
- 49.van der Vos KE, and Coffer PJ. 2008. FOXO-binding partners: it takes two to tango. Oncogene 27: 2289–2299. [DOI] [PubMed] [Google Scholar]
- 50.Rao RR, Li Q, Gubbels Bupp MR, and Shrikant PA. 2012. Transcription factor Foxo1 represses T-bet-mediated effector functions and promotes memory CD8(+) T cell differentiation. Immunity 36: 374–387. [DOI] [PMC free article] [PubMed] [Google Scholar]
Associated Data
This section collects any data citations, data availability statements, or supplementary materials included in this article.