

Abstract
Latent variable models of picture naming attempt to explain observed responses in terms of hidden, mental operations. Connectionist simulation models and processing tree mathematical models have complementary advantages and disadvantages. In this paper, these model types were compared in terms of their predictions of independent language measures and their associations between model components and measures that should be related according to their theoretical interpretations. The models were tasked with predicting independent picture naming data in persons with aphasia, as well as measuring effects associated with neuropsychological tests of semantic association and speech production, grammatical categories of formal errors, and lexical properties of target items. In all cases, the processing tree model parameters provided better predictions and stronger associations between parameters and independent language measures than the connectionist simulation model. Given the enhanced generalizability of latent variable measurements afforded by the processing tree model, evidence regarding mechanistic and representational features of the speech production system are re-evaluated in light of these new estimates of picture naming abilities in aphasia. Several areas are indicated as being potentially viable targets for elaboration of the mechanistic descriptions of picture naming errors.
Keywords: cognitive psychometrics, multivariate assessment, computational modeling, picture naming, anomia, aphasia
Word finding difficulty (anomia) is one of the most common deficits in stroke survivors, particularly in those diagnosed with aphasia. Picture naming tests are often used in clinical and research contexts to assess the severity of anomia specifically, or aphasia more generally, since the task has well-defined targets and engages nearly the full complement of mental abilities required for naturalistic speech production. However, while the overall naming accuracy is easy to tabulate, it is a blunt instrument, obscuring the mechanistic source(s) of the deficit. Error type (semantic, phonological, etc.) analysis offers potentially higher granularity but error classification is often ambiguous (rat for cat), and there is probably not a one-to-one relationship between error type and processing deficit. Moreover, raw error counts lack favorable psychometric properties, having skewed, low-variance distributions.
Latent variable approaches provide a potential solution to these challenges by modeling the underlying system that generates the observed distribution of response types. The better the fit between the model predictions and the data, the more confidence one has that the model approximates the underlying system. In this way, latent variable models can inform cognitive/computational models of the speech production system. Working in the reverse direction, once we have a latent variable model that approximates the underlying system, we can use it to estimate the computational state of the system in individuals with language deficits, thus potentially informing mechanistic theories of speech production.
In this study, we use neuropsychological data to compare two latent variable models of naming. First, we describe a connectionist model (Foygel & Dell, 2000) that focuses on the flow of activation through a network of psycholinguistic representations that must be selected for production. Then, we present a cognitive psychometric processing tree model (Walker, Hickok, & Fridriksson, 2018) that focuses on the probabilities of selection outcomes within different psycholinguistic levels rather than the network properties that induce them. While the tree model is mechanistically simpler than the network model in its description of observable phenomena as well as its computational implementation, it is statistically more complex, involving many more free parameters that can be adjusted to fit the data. We investigated whether the added complexity of the tree model is capturing meaningful variance in speech production deficits (i.e., provides better predictions), which would point to the need to update our processing assumptions regarding the underlying system. To compare the models, we adopted a pragmatic approach and used each to predict independent behavioral data after being fit to picture naming response type data, under the assumption that better measurements of the underlying processes will yield better predictions in new contexts. After establishing that the cognitive psychometric model yields improved measurements of latent variables over the network model, we discuss the patterns of covariance between the model parameters and independent evidence relevant to the mechanisms and architectures of speech production systems. Specifically, processing assumptions regarding discreteness and interactivity are evaluated with respect to the lexical bias of phonologically-related errors and the phonological facilitation of semantic errors, while representational assumptions regarding the organization of word-forms are evaluated with respect to the relationship between performance on naming and repetition tasks. In the next sections, we briefly describe the two models.
Modeling the Picture Naming Process as a Spreading Activation Network
The Foygel and Dell (2000) Semantic-Phonological (SP) connectionist model of naming is a popular model of word retrieval deficits. The simulated network is illustrated in Figure 1A, with the target nodes shaded to represent their activation across the semantic, lexical, and phonological representation levels. Words that are related to the target by meaning are connected to shared semantic nodes, and words that are phonologically related to the target are connected to shared phonological nodes. The S-weight and P-weight parameters control the signal-to-noise ratio in the bidirectional flow of activation between representational levels, and selection errors can occur at the lexical or phonological levels due to top-down and bottom-up spreading activation and noise. Aside from the variable connection strengths, the probability of observed error types is also affected by the statistical relationships among words and sounds in the language, which are encoded in the model’s fixed network structure. The SP model allows individual naming response profiles (i.e., relative frequencies of response types) to vary in terms of overall severity and lexical versus sublexical aphasia type. The SP model’s assumptions of distributed representations and the continuity hypothesis, which proposes that processing deficits lie on a continuum from normal to completely unregulated, enable the model to quantify language processing in a way that predicts real-world outcomes (Dell, Martin, & Schwartz, 2007; Schwartz, Dell, Martin, Gahl, & Sobel, 2006).
Figure 1.

A) The Foygel and Dell (2000) connectionist network for lexical retrieval of the target item ‘CAT’ is shown. Nodes are labeled with the corresponding selection probability (italics) from the Walker et al. (2018) multinomial processing tree model (MPT-Naming), and the target nodes are shaded. B) The MPT-Naming model architecture, reproduced from Walker et al. (2018). Nodes with rounded corners represent latent processing decisions, and leaf nodes with square corners represent response types. C = Correct, S = Semantic, F = Formal, M = Mixed, U = Unrelated, N = Neologism, AN = Abstruse Neologism, NA = Non-naming Attempt. Each branch is associated with a probability indicated by the letters a-h.
There are significant limitations of the connectionist model, however. One is that while the two-parameter model is quite elegant, more elaborate versions of the model have demonstrated improved explanations for a variety of speech phenomena (Chen & Mirman, 2012; Dell, Chang, & Griffin, 1999; Dell, Lawler, Harris, & Gordon, 2004; Goldrick & Rapp, 2007; Walker & Hickok, 2016). A disadvantage of the SP model is that the connection strength parameters do not allow latent selection probabilities to vary independently; as S-weight decreases, all types of lexical competitor intrusions increase in probability. By reducing these probability variables into connection strength parameters, the simulation model makes the probability of a specific intrusion at the lexical level opaque. In addition to obscuring lexical level outcomes, a further disadvantage of the SP model is that it does not account for item effects when estimating an individual participant’s network parameters. The probabilities of different response types are assumed to be the same on each naming trial, even though lexical properties of the target item such as length and frequency are known to influence different error type rates by challenging different naming impairments (Kittredge, Dell, Verkuilen, & Schwartz, 2008; Nickels & Howard, 1994, 1995, 2004; Walker et al., 2018). This means that the model does not account for how retrieval of different lexical items is challenged in different ways by the target’s lexical or phonological competitors without further supplementary assumptions that only apply to a limited set of hypothetical items (e.g., Nozari, Kittredge, Dell, & Schwartz, 2010).
Modeling Competitive Selection of Speech Representations as a Probability Tree
A cognitive psychometric approach, formalized with a multinomial processing tree (MPT) model (Batchelder, 1998; Riefer & Batchelder, 1988), can estimate computational abilities at different stages of a naming task. MPT models have parameters that represent probabilities of success of mental operations and have found many applications in cognitive psychology (Batchelder & Riefer, 1999; Erdfelder et al., 2009), including measuring clinical deficits (Batchelder & Riefer, 2007; Neufeld, 2015). The key advantage to using an MPT model parameter versus an overt response frequency to estimate a latent ability is that the model decomposes each trial outcome into a series of successes and failures. While a semantic error (dog for cat) represents a failure at lexical selection, it also represents a success at phonological selection; likewise, while a non-word error that sounds like the target (steposcope for stethoscope) represents a failure at phonological selection, it also represents a success at lexical retrieval. An MPT model can use all of the data, including the correct responses, as evidence of computational success or failure. The psychometric model can incorporate some of the same theoretical constructs of the simulation model, such as linguistic representational levels and phonological neighborhood effects, without being constrained by a particular specification of the mechanistic details. The trade-off of mechanistic details for computational simplicity that is characteristic of the MPT approach makes modeling of item effects feasible and interpretation and generalization of parameters more intuitive based on their intended meaning.
Following the Foygel and Dell (2000) network model, Walker et al. (2018) formulated an MPT model (Figure 1B) to interpret essentially the same response type data1 from a new set of 365 participants with aphasia. A major goal of this work was to disambiguate different types of selection errors at the lexical level from each other as well as from errors at the sublexical level, that is, to develop a model with higher granularity. At the lexical level, substitutions may or may not preserve semantic features of the target, or they may or may not preserve phonological features of the target, resulting in four possible lexical error types. At the sublexical level, errors can result in real words or non-words which may or may not preserve phonological features of the target depending on the success of lexical selection, but generally do not preserve semantic features. The MPT model’s ability parameters are described in Table 1; the nodes of the connectionist model in Figure 1A are labeled with the corresponding selection probabilities of the MPT model. The distributions of response types among a large cohort of people with aphasia, along with the distributions of estimated MPT naming abilities and associations with their prototypical response types are presented in Figure S1. The proportions of explained variance (R2) between MPT naming abilities and SP weights and between MPT naming abilities and prototypical response types are listed in Table S1.
Table 1.
Descriptions of ability parameters in the MPT-Naming model in terms of the mental computations that they govern.
| Ability Parameter | Mental Computation |
|---|---|
| Attempt | Initiating a naming attempt |
| Sem | Avoiding an unrelated lexical substitution error, given an attempt |
| LexSem | Avoiding a semantically related lexical substitution error, given avoidance of previous error opportunities |
| LexPhon | Avoiding a phonologically related lexical substitution error, given avoidance of previous error opportunities |
| LexSel | Avoiding a semantically and phonologically related lexical substitution error, given avoidance of previous error opportunities |
| Phon | Avoiding a sub-lexical phonological addition, deletion, or substitution error |
A notable divergence of the MPT model from the SP model is that the probabilities of intrusions by lexical neighbors with different relationships to the target are governed by separate abilities rather than shared connection strength parameters, enabling measurement of different types of competition at the lexical level. Each of these ability parameters is measured on a logit scale (similar to a z-score) and complemented with an item difficulty parameter2 to determine the probability of success (Figure 2). The model has two additional parameters related to the statistical structure of words and sounds of the language, thus providing a means to model the effects of phonological neighborhoods on error distributions elicited by target words such as cat versus stethoscope. This is a particularly important feature for determining whether an error that sounds like the target provides evidence of incorrect lexical versus sublexical selection; a target with many similar-sounding neighbors is more likely to result in a real word from a phonological slip, whereas a lexical-level error is likely required to produce another real word instead of a long and complex target.
Figure 2.
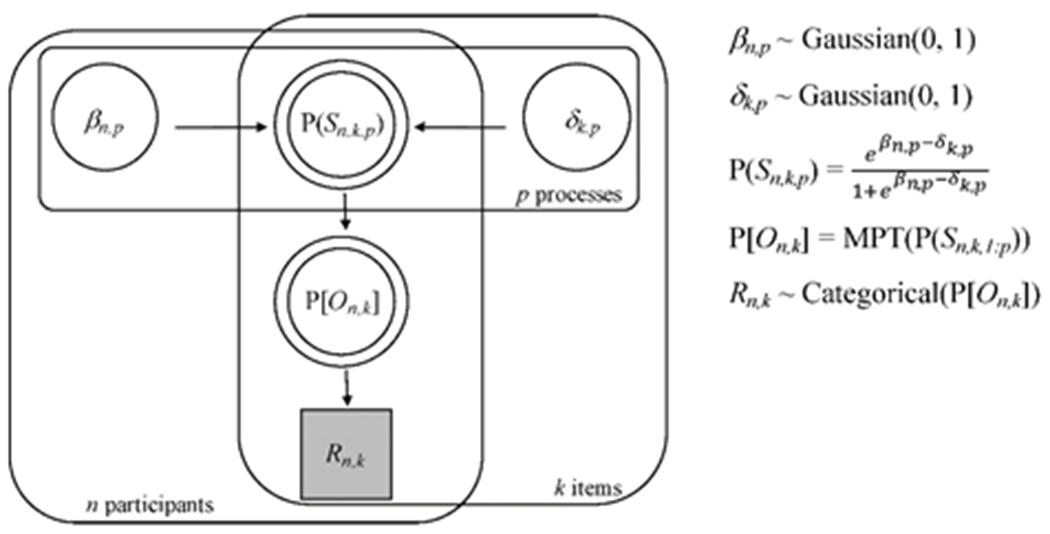
A directed acyclic graph for Bayesian estimation of MPT-Naming model parameters, βn,p (the ability of participant n for process p) and δk,p (the difficulty of item k for process p), where p indicates a decision node in the processing tree. These parameters have standard normal prior distributions and determine P(Sn,k,p), the probability of successful processing, via a logistic model equation. Taken together, these probabilities determine P[On,k], a vector of probabilities of observing each response type, via the MPT-Naming model equations. The observed response Rn,k is modeled as a draw from a categorical distribution parameterized by P[On,k]. circle/square = continuous/discrete variable, shaded/unshaded = observed/unobserved variable, single/double border = stochastic/deterministic variable, arrow = dependency, rounded square = set.
Evaluating Model Parameters as Measurements of Mental Computation
It is an open question whether the additional dimensions of impairment described by the MPT model’s ability parameters offer relevant information beyond the SP model’s connection strength parameters. (See Appendix A for a discussion of similarities and differences between the parameters of the SP and MPT models; see also Supplementary Information of Walker et al., 2018). The aim of this investigation was to evaluate whether the MPT parameters provide new information about measurable aspects of aphasic speech processing compared to the SP parameters. The logic here is that computations underlying naming performance should not be restricted to the picture naming task alone but should also operate in other tasks that draw on those same semantic, lexical, and phonological resources. Therefore, parameters that fit naming data should also explain other psycholinguistic measures in an interpretable way, and a model that generalizes better can be assumed to be a better approximation of the underlying system (Bamber, 2018; Busemeyer & Wang, 2000).
Four evaluations were performed.
1. Cross-validation with naming data.
A cross-validation comparison of the model’s fit to picture naming response types was undertaken to confirm that the MPT model is capturing more generalizable information about the response types than the SP model, and to quantify the improvement.
2. Generalization to non-naming neuropsychological tests.
Associations were tested between individual model parameters and independent test scores that should depend on them according to their theoretical interpretation. In order to test parameter interpretations, neuropsychological test scores were selected to serve as continuous measures of participants’ semantic association or speech production abilities.
3. Evaluation of the source of formal errors.
Theoretical and empirical research in the context of the SP model has suggested that formal errors (real word phonological errors with no semantic relation to the target) arise, unintuitively, from lexical selection errors. We use the MPT model to evaluate this theoretical prediction and ask whether the MPT model provides stronger evidence than the SP model to support it.
4. Evaluation of target lexical properties’ effects on naming difficulty.
Some properties of words pertain to the word as a whole, while others pertain to the segmental structure. Since these properties vary across target words, it is expected that the parameters of the models pertaining to different levels of representation should covary with the appropriate lexical properties.
Study 1: Cross-validation Predictions of Naming Data
Because the SP and MPT-Naming models have very different sizes and structures, we used cross-validation comparison to evaluate how much generalizable information each model can encode in their parameters from a set of training data in order to predict an independent set of testing data. Cross-validation is used almost universally in the machine learning field to compare and select among very different approaches to constructing models with varying sizes and complexities (Yarkoni & Westfall, 2017), because, unlike in-sample fit statistics, out-of-sample cross-validation error is not guaranteed to improve with additional model parameters. Further, encoding generalizable information depends both on the number of model parameters and the fixed assumptions of the model. Thus, when we predict test-level response distributions (i.e., response type frequencies aggregated over the whole test for each participant), we use SP’s 3 parameters (the attempt rate is a “hidden” parameter), along with its many processing assumptions (i.e., many variables must be tracked and updated in mapping parameters to data, such as calculating activation in each node of the network at each time step, which is specified, in our formatting, by several hundred lines of code), versus using MPT-Naming’s 1,057 parameters (6 participant ability parameters + 175 x 6 item difficulty parameters + 1 global lexicon parameter) and its minimal processing assumptions (i.e., about 40 lines of code in our formatting).4 The MPT-Naming model was expected to yield better predictions than the SP model, given its ability to leverage item-level information and it not being constrained to operate within a network architecture. The cross-validation comparison helps quantify how much more relevant information about response types can be encoded in the MPT-Naming parameters due to its assumptions.
Methods
Participants
Archived behavioral data were examined from 364 participants with a single, left-hemisphere stroke and aphasia. These participants’ picture naming abilities were estimated by Walker et al. (2018) using the MPT-Naming model. The data were obtained from two different archives: 275 participants were enrolled in studies at Moss Rehabilitation Research Institute (Philadelphia, PA) (Mirman et al., 2011), and 89 participants3 were enrolled in studies at the University of South Carolina (Columbia, SC). These research groups administered different neuropsychological tests to subsets of the participant pools; however, both research groups administered the Philadelphia Naming Test along with other tests designed to measure relevant mental abilities (e.g., semantic association and speech production). All participants were administered the Western Aphasia Battery (Kertesz, 1982) and categorized into aphasia types. The breakdown of aphasia types included 153 anomic, 94 Broca’s, 58 conduction, 44 Wernicke’s, 7 global, 3 transcortical motor, and 5 transcortical sensory aphasias.
Statistical analysis.
The SP model is designed to fit naming response type data on the test-level (i.e., response type frequencies aggregated over the whole test for each participant), while the MPT-Naming model is designed to fit naming response type data on the item-level (i.e., the response type on each individual naming trial produced by each participant). Both models are capable of making predictions at either level, however, so we compared their predictions at both levels. A random 50 items (29%) were set aside as testing data for each participant and the parameters of each model were estimated using the remaining 125 items. Specifically, a random binary vector with 50 ones and 125 zeros was used as an index for the testing items in the first participant. For the next participant, the same vector of indices was shifted upward by one element, with the last element recycling to the beginning of the vector, and the process was repeated for each participant.
Test-level predictions were generated with the MPT-Naming model for each participant by averaging the mean posterior predictive probabilities for each response type over the testing items and then multiplying these probabilities by 50 and rounding to the nearest integer. Predicted frequencies of Neologism and Abstruse Neologism responses were added together to compare predictions of the same number of response categories as with the SP model. Item-level predictions were generated with the MPT-Naming model using the mode of the posterior predictive distribution for each participant-item combination (i.e., the estimated most likely response type). If multiple response types were equally likely for a given participant-item combination, the response type with the higher proportion in the participant’s training data was predicted; if these proportions were also equal, the response type with the higher proportion in the aggregated training dataset was predicted. Item-level predictions with the MPT-Naming model were made without combining Neologism and Abstruse Neologism responses, that is, predicting all eight categories.
Test-level predictions were generated with the SP model as usual, using the simulated response type proportions, adjusted for the observed proportion of Non-naming Attempts in the training data, and multiplying these proportions by 50, then rounding to the nearest integer. Item-level predictions were generated with the SP model using the most likely response type from the simulated distribution for all items in a given participant. Although predictions could be generated randomly with a multinomial distribution weighted by the SP model’s predicted response probabilities, this is a suboptimal item-level prediction strategy compared with guessing the mode of the probability distribution.5
As a measure of prediction quality for test-level predictions, the root mean square error (RMSE) for each participant was calculated (i.e., the expected error between the predicted and observed frequencies of each response type) and the group averages for each model were compared to examine group differences in prediction accuracy. Comparison of individual differences in RMSE were examined via scatterplot, with further analysis of individuals where the models had unusually large discrepancies in prediction accuracy. At the item-level, the overall proportion of correctly predicted response types (out of 18,200 naming attempts in the testing data) was used as a measure of prediction quality.
Results
At the test-level, the SP model’s out-of-sample predictions had an average RMSE of 2.03 items (range = 0.0 - 6.6 items), and the MPT-Naming model’s predictions had an average RMSE of 1.89 items (range = 0.4 - 4.5 items). The average reduction in prediction error was statistically significant (paired two-tail t-test, df = 363, p = .007). It is also worth noting that using the observed response rates in the training data to predict response rates in the testing data (i.e., without using a latent variable model) had an average RMSE of 1.96 items (range = 0.0 – 6.6 items). This means that the SP model’s predictions about response type rates were significantly more misleading on average than predictions that ignore latent variables entirely (paired two-tail t-test, df = 363, p = .004). Figure 3 shows the scatterplot comparing the SP and MPT-Naming prediction errors in terms of RMSE. Using an arbitrary threshold of ±2 RMSE to establish a region of practical equivalence, there were 11 participants that were significantly better predicted by the MPT-Naming model than the SP model, and one participant that was significantly better predicted by the SP model than the MPT-Naming model.6
Figure 3.

Scatterplot comparing MPT-Naming and SP test-level prediction errors (RMSE) for the naming response type frequency distributions in the cross-validation testing data (50 naming trials distributed over 7 response types) for 364 participants. The RMSE can be interpreted as the expected difference between predicted and observed response type frequencies for a randomly selected response type. The solid black identity line indicates where the models provided equally good predictions; points above the identity line represent individuals whose data were better predicted by the MPT-Naming model than the SP model. An arbitrary region of practical equivalence is denoted by the dotted lines at ±2 RMSE, and circled points represent individuals whose data were much better predicted by one model over the other.
We checked two possible reasons for the difference in prediction accuracy for these 11 cases where the SP model yielded significantly worse predictions: 1) The testing and training data might have had significantly different distributions of response types, which would mislead the SP model but would be less of a problem for the MPT model given its item-based inferences. 2) The testing data might have included a response type frequency that the SP model is incapable of fitting due to its internal assumptions. In the first case, we tested whether data in the training and testing sets were drawn from the same distributions using a Fisher’s exact test (p < .05), implemented with the MATLAB function MyFisher (Cardillo, 2010). In the second case, we identified response frequencies that exceeded the maximum rates that the SP model could predict, which were: Correct (97.0%), Semantic (17.7%), Formal (30.6%), Mixed (4.0%), Unrelated (33.7%), and Nonword (76.3%). There were three participants that fell only into explanation #1: they had significantly different training and testing distributions. Five participants fell only into explanation #2: the SP model could not accommodate their response type frequencies. Three participants fell into both explanation categories. For participants who fell into explanation #2, one produced too many Formal errors, two produced too many Unrelated errors, and five participants produced too many Mixed errors for SP to accommodate.
At the item-level, guessing randomly from the seven response type categories had an expected accuracy of 14.3%, but knowing that correct responses were the most frequent type (inferable from the training data) increased prediction accuracy, without using a model, to 55.8%, providing a benchmark for prediction accuracy with a fitted model. The SP model predictions had an accuracy of 42.40%, and the MPT-Naming model predictions had an accuracy of 67.51%.
Summary
The SP model did not provide useful out-of-sample predictions of naming response types at the test-level beyond the overt response type rates observed in the training data, and it did not provide useful predictions at the item-level beyond the prior probability of a correct response. The MPT-Naming model provided better predictions at both the test-level and item-level. At the test-level, the MPT-Naming model was able to provide much better predictions for eight participants who exhibited the three known response patterns where the SP model under-predicts error rates (Schwartz et al., 2006), as well as for six participants whose response distributions changed significantly with respect to the set of items being named. While these patterns of SP model failures were identified by Schwartz et al. (2006) based on exceeding arbitrary fit thresholds, the current study reinforces that the fit can be significantly improved by a latent variable model with different assumptions. Schwartz et al. (2006) offered several plausible explanations for these SP model failures: 1) Underprediction of unrelated errors may be due to an incorrect assumption that perseverative errors can be explained by the same mechanisms as other error types; the MPT model relaxes this assumption by positing the independent Sem parameter. 2) Underprediction of mixed errors may be due to an incorrect assumption of uniform effects of damage throughout the vocabulary; some semantic categories may be more susceptible to mixed error intrusions due to the presence of more mixed neighbors, which the MPT model can account for with its item difficulty parameters. That is, while the SP model estimates of mixed error rates can only range from 0% to 4% on any test item, the MPT model estimates of mixed error rates can range from 0% to 100%, but only on the limited subset of items with mixed neighbors (see Appendix B for a discussion of the low likelihood of mixed errors arising from phonological level disturbances). 3) The underprediction of formal errors in the context of very low accuracy may be related to an incorrect assumption about the decay rate of phonological representations; the MPT model can predict relative rates of correct, formal, and nonword responses without making assumptions about activation levels or decay rates, while still maintaining assumptions about psycholinguistic representations and phonological neighborhoods. This generalizability of MPT-Naming parameter estimates to new data suggests that if one wants to measure the computational state of the system for applied purposes (e.g., for lesion-parameter mapping, therapeutic diagnosis, or treatment evaluation), the MPT-Naming model is providing more informative metrics than the SP model.
Study 2: Generalization to Non-naming Neuropsychological Tests
Clinicians and scientists use standardized test scores to evaluate specific aspects of speech or language processing. Examining the relationships between these test scores and model parameters can aid in interpreting the information that is encoded by each parameter. Tests were selected that either required visual/lexical-semantic decisions, which are assumed to share processes with lexical selection during naming, or that required verbal responses, which are assumed to share processes with phonological assembly and articulation during naming. The SP parameters’ association/dissociation with these types of test scores has been presented as evidence of valid construct measurement (e.g., Tochadse, Halai, Lambon Ralph, & Abel, 2018); thus, it is helpful to validate that the MPT-Naming parameters also exhibit interpretable patterns of association/dissociation with these test scores.
Methods
Participants.
There were 127 participants with all selected test scores available from the Moss Rehabilitation Research Institute archive. There were 75 participants with the selected semantic association test score available and 66 and 88 participants, respectively, with the two selected speech production test scores available from the University of South Carolina archive.
Neuropsychological tests.
Table 2 lists the tests that were included in the study along with a brief description.
Table 2.
Neuropsychology tests used to evaluate semantic, lexical, phonological, and speech motor processing.
| Test | Abbreviation | Brief Description | Reference |
|---|---|---|---|
| Synonymy Triplets | SYN | Choose which two of three visually and auditorily presented words are synonyms. | N. Martin, Schwartz, & Kohen (2007) |
| Peabody Picture Vocabulary Test | PPVT | Choose which one of four pictures matches a spoken word. | Dunn & Dunn (1997) |
| Camels and Cactus Test | CCT | Choose which one of four taxonomically-related pictures shares a thematic relation with a probe picture. | Bozeat, Lambon Ralph, Patterson, Garrard, & Hodges (2000) |
| Pyramids and Palm Trees Test | PPT | Choose which one of two taxonomically-related pictures shares a thematic relation with a probe picture. | Howard & Patterson (1992) |
| Philadelphia Repetition Test | PRT | Repeat a single, auditorily presented word. The targets are the same words included in the naming test. | Roach et al. (1996) |
| Nonword Repetition Test | NWR | Repeat a single, auditorily presented pseudoword. The targets are derived from the words included in the naming test, by changing two phonemes to create a pronounceable nonword. | Mirman et al. (2011) |
| Immediate Serial Recall Span | ISR | Repeat a list of auditorily presented words in the correct order. The list length begins at one and increases until the participant is unable to perform the task. | R. C. Martin, Shelton, & Yaffee (1994) |
| Western Aphasia Battery, Repetition Subscore | WAB | Repeat an auditorily presented word, phrase, or sentence. | Kertesz (1982) |
| Apraxia Battery for Adults, Diadochokinetic Rate | DDK | Repeat a two- or three-syllable pseudoword as quickly and as many times as possible within three seconds for two syllables or five seconds for three syllables. | Dabul (2000) |
Statistical analysis.
To compare how the model parameters related to neuropsychological test scores, R2 was calculated between each model parameter and each test score, as well as between each naming response type frequency and each test score. Given the unique contributions of LexPhon and Phon to multi-word repetition test scores reported by Walker et al., (2018), a multiple linear regression model using these two abilities as predictors for the ISR and WAB test scores was also examined. The unique contributions of S-weight and P-weight to each neuropsychological test score were tested statistically by including both parameters as predictors in a multiple linear regression model and examining the p-value from a t-test of the beta coefficients, using p < .05 as the criterion for significance. Regression statistics were calculated with the MATLAB regstats command.
Results
A summary of the highest prediction accuracies and strengths of association derived from each model’s parameters is presented in Table 3. While both models’ parameters exhibited associations that were qualitatively consistent with their theoretical interpretations, the MPT-Naming model provided more accurate predictions and stronger parameter associations than the SP model for all investigated language measures.
Table 3.
Summary of the SP and MPT-Naming models’ naming response type predictions and parameter associations with independent behavioral data. The “predictive parameters” column lists the model parameters that were found to have the strongest association with the relevant data. All parameters were used when generating cross-validation predictions. For the multi-word repetition tests, the reported R2 is from a multiple regression model using both parameters as predictors. The reported t values are standardized β coefficients from logistic regression models. LexForm, calculated from the MPT-Naming abilities, is the relative likelihood that a Formal error on a given naming trial originated from a failure at the lexical versus the phonological selection stage.
| Language Measure | Prediction / Association Measure | SP Model | Predictive Parameters | MPT-Naming Model | Predictive Parameters |
|---|---|---|---|---|---|
| Picture Naming Response Types | |||||
| Scale-level (n = 50, 7 categories) | Mean RMSE | 2.03 items | All | 1.89 items | All |
| Item-level (n = 18,200, 7-8 categories) | Accuracy | 42.40% | All | 67.51% | All |
| Semantic Association Test Scores | |||||
| Synonymy Triplets (n = 127) | R2 | .47 | S | .51 | LexSel |
| Peabody Picture Vocabulary Test (n = 127) | R2 | .38 | S | .47 | LexSel |
| Camels and Cactus Test (n = 127) | R2 | .42 | S | .47 | LexSel |
| Pyramids and Palm Trees Test (n = 75) | R2 | .06 | P | .19 | LexSem |
| Speech Production Test Scores | |||||
| Diadochokinetic Rate (n = 66) | R2 | .18 | P | .22 | Phon |
| Nonword Repetition Test (n = 127) | R2 | .35 | P | .44 | Phon |
| Philadelphia Repetition Test (n = 127) | R2 | .26 | P | .41 | Phon |
| Immediate Serial Recall Span (n = 127) | R2 | .49 | S, P | .53 | LexPhon, Phon |
| WAB Repetition Subtest (n = 88) | R2 | .54 | S, P | .70 | LexPhon, Phon |
| Formal Error Grammatical Categories | |||||
| Test-level rate of non-nouns (n = 83) | R | .32 | S-P | .43 | LexPhon |
| Item-level risk of non-noun (n = 1,504) | t | 2.13 | S-P | 2.94 | LexPhon |
The R2 values quantifying the proportion of explained variance between each model parameter or naming response type frequency and each test score are presented in Table 4. The strongest parameter association for each test score is marked in gray, and any stronger associations with response type frequency are also marked in gray. All test scores had a stronger association with MPT-Naming parameters than SP parameters. The semantic association test scores were best predicted by the LexSel and LexSem parameters. The diadochokinetic rate and single-word speech production test scores were best predicted by the Phon parameter, while multi-word speech production test scores were best predicted by the LexPhon parameter. Using both LexPhon and Phon to predict multi-word repetition test scores yielded R2 values of .53 and .70 for ISR and WAB repetition, respectively. S-weight and P-weight both made significant, unique contributions to multi-word repetition test scores (S-weight, t = 7.9 and 6.5, both P < .0001 for ISR and WAB; P-weight, t = 5.4 and 5.5, both P < .0001 for ISR and WAB), yielding combined R2 values of .49 and .54 for ISR and WAB, respectively.
Table 4.
Proportion of explained variance (R2) between neuropsychological test scores and individual model parameters or response type frequencies. The degrees of freedom are indicated as subscripts in the column headings. The strongest parameter association for each test score is marked in gray, as well as any response type frequency associations that were stronger than the parameter associations.
| Semantic Association | Speech Production | |||||||||
|---|---|---|---|---|---|---|---|---|---|---|
| SYN125 | PPVT125 | CCT125 | PPT73 | DDK64 | NWR125 | PRT125 | ISR125 | WABrep86 | ||
| MPT-Naming | LexSem | .48 | .34 | .41 | .19 | .002* | .10 | .11 | .25 | .38 |
| LexPhon | .29 | .28 | .19 | .05 | .11 | .31 | .35 | .48 | .63 | |
| LexSel | .51 | .47 | .47 | .13 | .04* | .18 | .17 | .35 | .53 | |
| Phon | .14 | .15 | .09 | .04* | .22 | .44 | .41 | .42 | .51 | |
| SP | S-weight | .47 | .38 | .42 | .04* | .02* | .17 | .21 | .38 | .38 |
| P-weight | .03 | .06 | .02* | .06 | .18 | .35 | .26 | .24 | .31 | |
| Response Type | Correct | .46 | .40 | .34 | .17 | .15 | .33 | .32 | .53 | .77 |
| Semantic | .15 | .08 | .15 | .01* | .18 | .00* | .00* | .01* | .15 | |
| Formal | .05 | .07 | .02* | .03* | .08 | .32 | .28 | .30 | .13 | |
| Mixed | .10 | .11 | .18 | .01* | .11 | .01* | .00* | .00* | .13 | |
| Unrelated | .28 | .29 | .21 | .00* | .04* | .17 | .12 | .24 | .19 | |
| Neologism | .00* | .00* | .00* | .03* | .12 | .21 | .21 | .12 | .01* | |
| Abstruse Neologism | .14 | .18 | .12 | .03* | .05* | .32 | .18 | .23 | .23 | |
| No Attempt | .45 | .30 | .34 | .27 | .02* | .06 | .09 | .27 | .46 | |
Non-significant correlations (uncorrected p > .05) are marked with an asterisk (*).
SYN = Synonymy Triplets, PPVT = Peabody Picture Vocabulary Test, CCT = Camels and Cactus Test, PPT = Pyramids and Palm Trees Test, DDK = Diadochokinetic Rate, NWR = Non-word Repetition, PRT = Philadelphia Repetition Test, ISR = Immediate Serial Recall Span, WABrep = Western Aphasia Battery Repetition Test.
Notably, the MPT-Naming parameters encoded more generalizable information for most neuropsychological test scores than was present in the overt response frequencies, and the few instances where response frequencies exhibited stronger associations than model parameters were instructive. The Pyramids and Palm Trees Test (PPT) was unique among the other lexical-semantic tests in having a weak overall correlation with model parameters and naming response types, with the exception of the Attempt ability and the No Attempt response type. We interpret this finding to mean that the PPT mostly failed to evaluate processes relevant to the internal mechanisms of lexical retrieval during picture naming. The weak but significant association with the LexSem parameter might be interpreted as evidence of cascading activation from prelexical visual-semantic processes to early lexical-semantic retrieval processes. The only other instances where test scores were more highly correlated with an overt response type than a model parameter were the multi-word repetition tests, which were most strongly correlated with correct naming responses. This result is sensible, given that these tests presumably challenge the full complement of single-word production processes as well as other cognitive mechanisms that must be employed to remember and produce long sequences of words. For immediate serial recall span (ISR), the combined association with LexPhon and Phon was about equal to the association with correct naming responses (R2 = .53). However, for WAB repetition, requiring rehearsal of full phrases and sentences, the association with the LexPhon and Phon parameters (R2 = .70) was still lower than the association with correct responses (R2 = .77). This pattern of results suggest that repetition of phrases and sentences employs mechanisms beyond those simply dedicated to single-word form processing, presumably including syntactic rules, combinatoric semantic elaboration, and working memory.
Summary
The MPT-Naming model parameters encoded more generalizable information about neuropsychological test scores than the SP parameters or the overt response frequencies. These strong patterns of association were accompanied by interpretable patterns of dissociations as well. For example, lexical-semantic test scores and speech production test scores doubly dissociated with LexSel and Phon, respectively. Meanwhile, a dissociation emerged between Phon and LexPhon for syllable/single-word and multi-word repetition test scores, respectively. These results suggest that the MPT-Naming parameters are capturing more kinds of information than the SP parameters, not just more information overall. The division of S-weight into multiple parameters is paying dividends. We return to the implications of these patterns of associations for mechanistic models in the general discussion.
Study 3: Evaluation of the Source of Formal Errors
According to two-step theories of lexical access (Dell, 1986; Dell, Schwartz, Martin, Saffran, & Gagnon, 1997; Gagnon, Schwartz, Martin, Dell, & Saffran, 1997; Garrett, 1980; Goldrick & Rapp, 2002; Levelt, 1989; Rapp & Goldrick, 2000), formal errors (i.e., real words that sound like the target) can arise either at the lexical or phonological selection steps. Formal errors originating from the lexical level should maintain the grammatical category of the target (i.e., nouns), while formal errors originating from the phonological level are free to cross grammatical category boundaries. These two sources of errors should have different effects on the proportion of formal errors that are non-nouns: errors during lexical selection should increase the formal error frequency without increasing the non-noun error frequency, leading to a reliable decrease in the proportion of non-noun errors. On the other hand, errors during phonological selection may increase the non-noun error frequency but may also increase noun error and non-word error frequencies, leading to a direct but weak relationship with the proportion of non-noun formal errors. We thus investigated whether the models’ assessments regarding the source of formal errors could account for the grammatical category of the errors in accordance with theoretical expectations, and we compared the measured strength of the predicted effect.
Methods
Model estimates of lexical versus phonological deficits.
In the SP model, the relative likelihood of formal errors during lexical selection can be approximated by S-weight minus P-weight (Schwartz et al., 2006). As P-weight grows in strength relative to S-weight, formal errors are more likely to originate from the lexical level due to overwhelming feedback from the phonological level. As S-weight minus P-weight decreases, lexical formal errors increase and non-noun formal errors become less likely (i.e., a direct relationship). In the MPT-Naming model, LexPhon ability is specifically intended to measure the likelihood of formal errors during lexical selection. As LexPhon ability decreases, lexical formal errors increase and non-noun formal errors become less likely (again, a direct relationship). Phon ability, on the other hand, should have an inverse relationship, to the extent that it has any relationship at all, with the likelihood of non-noun formal error rates. Decreases in Phon ability can sometimes lead to increases in formal errors during phonological selection that may or may not be non-nouns by chance.
To assess the relationships between modeled deficits and non-noun formal error rates (NFER), we examined the formal error responses (n = 1,504) collected from the 83 participants who produced at least five formal errors and at least one non-noun. Non-noun errors were identified by comparing the available transcriptions of the formal error responses with the Moby Part-of-Speech II dictionary (Ward, 1996). A conservative criterion7 with respect to being a non-noun identified a formal error as a noun even if it was not the word’s primary usage, so long as it was grammatically possible to use it as a noun. Of the original 2,943 transcribed formal errors, 600 transcriptions were not recognized by the dictionary; the presumed responses could be determined by manual inspection for all but 20 trials, which were excluded from item-level analyses. The grammatical categories of the remaining errors were also classified by manual inspection.
Statistical analysis.
For each participant, we calculated the NFER (# of non-noun formal errors / total # of formal errors produced by the participant). We used simple linear regression to test correlations between NFER and S-weight minus P-weight, LexPhon, and Phon. We also used multivariate linear regression predicting NFER from LexPhon and Phon simultaneously to test for unique contributions of each ability to NFER, as well as to evaluate the direction of effects, while controlling for the other’s covariance. At the item-level, we used logistic regression to test the association between each of the metrics (S-weight minus P-weight, as well as LexPhon and Phon, individually and together) and the relative risk of producing a non-noun versus a noun. Linear regression models were fit with the MATLAB function regstats, while logistic regression models were fit with the MATLAB function mnrfit. For logistic regression models, the t-values associated with the coefficients of each predictor are reported. The t-values are standardized coefficients enabling comparison of the strengths of association between the relative risk of producing a non-noun and predictors that are quantified on different scales. The t-values can also be negative, indicating the direction of association, which is of interest. The reported p-values are the probabilities of obtaining more extreme coefficient estimates by chance if the true values were zero.
Results
The median NFER was .09 (range = [.02, .36]). There was a significant, direct correlation between S-weight minus P-weight and NFER (r = .32, p = .0035), confirming previous investigations, although the correlation between NFER and LexPhon was even stronger (r = .44, p < .0001). The correlation between NFER and Phon was not significant (r = .09, p = .42). When keeping the other ability fixed using multiple regression, numerically opposite effects (i.e., positive and negative β coefficients) emerged for LexPhon (β = 0.03, p < .0001) and Phon (β = −0.007, p = .33), although the association with the Phon ability was not significant.
At the item-level, the S-weight minus P-weight metric was significantly associated with the relative risk of a formal error being a non-noun (t = 2.13, p = .033), although LexPhon had an even stronger association (t = 2.94, p = .0033). Again, while Phon was not significantly related to the risk of a non-noun formal error (t = 0.44, p = .66), opposite effects emerged for LexPhon (t = 2.91, p = .0037) and Phon (t = −0.38, p = .70) when they were both included in a multivariate logistic regression model. The directions of the associations were consistent with the theoretical predictions. An increase in the likelihood of a lexical failure was associated with a decrease in the risk of producing a non-noun, because selection errors within the lexicon respect the grammatical organization of word representations.
Summary
The grammatical category of formal errors was significantly associated with estimates of lexical selection failures derived from both models, as predicted by their common motivating theory. At both the test-level and item-level, however, the estimates derived from the MPT-Naming model provided stronger associations with the predicted effect. We believe this replication and demonstration of enhanced measurement of a predicted effect is one of the strongest tests of the MPT-Naming model’s validity/utility to date, and perhaps the best example of synergy between the models. The results further support the assumption that some errors that are phonologically related to the target occur during processing of whole-word representations rather than only during processing of segment representations (Dell et al., 1997; Gagnon et al., 1997).
Study 4: Model Parameters and Lexical Item Properties
So far, we have examined how well each of the models account for lawful variation among speech and language assessments in individual people with aphasia. Much of neuropsychology research, however, is focused on the universal properties of the mental lexicon across all people who share a language. The MPT-Naming model’s item difficulty parameters offer clearly interpretable evaluations of how much an item (and its bundling of lexical properties) influence naming response types in people with aphasia, independent of their impairment severity. While we have been stressing that, unlike the MPT-Naming model, the SP model does not use item-level information in estimating participant-level parameters, it would be premature to conclude that the SP model cannot account for item-level information in principle. As Dell has pointed out (personal communication), the SP model can simply be fit to the naming response type distributions aggregated over participants to yield estimates of connection strengths for each item in the average aphasic lexicon (cf., Nickels & Howard, 1995). We investigated how this approach compares with the MPT-Naming item difficulty measurements, which are independent of the abilities of the participants. To do this, we examined the unique contributions of lexical properties to each dimension of item variance encoded by the models. Similar stepwise regression models were presented in Walker et al. (2018); the current analysis included explicit comparison with the SP model and additionally included age-of-acquisition as an independent predictor to potentially disambiguate effects of lexical frequency.
Methods
We obtained four psycholinguistic measures for each of the 175 target words on the PNT. Three measures (log lexical frequency, phoneme length, and log phonological neighborhood density) came from the Irvine Phonotactic Online Dictionary (www.iphod.com) and were reported in Walker et al. (2018). For these measures, when words had multiple pronunciations, the most common one for American English was selected. These measures did not disambiguate word senses (e.g., the frequency of can, as in, “We can go,” was combined with can, as in, the metal container). We also obtained a test-based age-of-acquisition measure (Brysbaert & Biemiller, 2017; http://crr.ugent.be/archives/806), which does disambiguate word senses. These norms are derived from vocabulary tests in children and are considered to be an objective measure. It is worth noting that among the PNT items, there is very little variance in this measure with very high skew; 150 items (86%) are learned by age two, 23 items (13%) are learned by age four, one item (van) is learned by age six, and one item (stethoscope) is learned by age ten. Nevertheless, age-of-acquisition has been found to be a reliable predictor of both error and latency data in aphasic picture naming and healthy language processing (Belke, Brysbaert, Meyer, & Ghyselinck, 2005; Brysbaert & Ellis, 2016; Cuetos, Aguado, Izura, & Ellis, 2002; Cuetos, Barbón, Urrutia, & Domínguez, 2009; Kittredge et al., 2008; Nickels & Howard, 1995).
We used ascending stepwise multiple linear regression to identify the significant unique contributions of these four lexical property measures to each of the MPT-Naming item difficulty parameters and the Word-T probability parameter (i.e., the probability of a phonological error resulting in a real word by chance), as well as to the SP model’s S-weight and P-weight parameters. All independent and dependent variables were z-score normalized prior to regression, for comparison of predictor coefficients and fit statistics. We began with no predictors in the model, and then used a criterion (p < .05) for inclusion or exclusion of predictors.
Results
The stepwise regression models predicting each item-level parameter from lexical properties are presented in Table 5. There were several notable results. All of the effects reported in Walker et al. (2018) were replicated after controlling for age-of-acquisition. The objective measure of phonological neighborhood density was the only property uniquely contributing to Word-T (i.e., the phonological neighborhood density inferred from naming errors). Phonological neighborhood density was facilitative for Attempt and Phon. Lexical frequency uniquely contributed to all MPT-Naming item difficulty parameters in a facilitative fashion (i.e., decreasing difficulty), but did not uniquely contribute to the inferred phonological neighborhood density parameter, as expected. Additionally, age-of-acquisition uniquely contributed to Attempt, LexSem, and Phon difficulties, with later-acquired words being more difficult, but did not uniquely contribute to LexPhon or LexSel difficulties. Lexical frequency was the only property that uniquely contributed to LexPhon difficulty. Both lexical frequency and phoneme length uniquely contributed to LexSel difficulty, with longer words increasing the likelihood of a semantic and phonologically related (and presumably shorter) competitor being selected. To test this presumption, we examined all 916 unique target-response pairs that were coded as Mixed errors, finding a significant reduction in the average number of phonemes in the responses versus the targets (5.4 versus 5.8 phonemes, respectively; paired-sample t = −6.59, two-tailed p = 7.6e-11).
Table 5.
Stepwise multiple linear regression models predicting MPT-Naming item difficulty or SP item weights from lexical properties. The linear coefficient associated with each significant predictor in each of the regression models is reported in the corresponding cell. Item difficulty parameters are measured on a logit scale; the Word-T parameter is measured on a probability scale; and S-weight and P-weight are measured on a connection strength scale. All dependent and independent variables were z-score normalized for coefficient comparison; the intercept of all models is zero. LexFreq = the log transformed frequency of the target in American television and movie transcripts; PhonLeng = the number of target phonemes; PhonDens = the log transformed number of words differing from the target by a single phoneme; AoA = age of target word acquisition; df = degrees of freedom; rmse = root mean square error.
| Lexical Property | Model fit | ||||||
|---|---|---|---|---|---|---|---|
| LexFreq | PhonLeng | PhonDens | AoA | df | rmse | ||
| MPT-Naming Item Difficulties | Attempt | −0.22 | −0.39 | +0.18 | 171 | 0.80 | |
| LexSem | −0.19 | +0.16 | 172 | 0.97 | |||
| LexPhon | −0.54 | 173 | 0.84 | ||||
| LexSel | −0.22 | +0.41 | 172 | 0.83 | |||
| Phon | −0.27 | +0.24 | −0.43 | +0.15 | 170 | 0.48 | |
| Word–T | +0.68 | 173 | 0.73 | ||||
| SP Item Weights | S-weight | +0.30 | +0.33 | 172 | 0.96 | ||
| P-weight | +0.14 | −0.35 | +0.44 | 171 | 0.55 | ||
Lexical frequency also uniquely contributed to both the S-weight and P-weight, with higher frequency words being associated with higher connection strengths. Phonological length unexpectedly contributed to the S-weight as well, with longer words being associated with stronger S-weights. Phonological length had the opposite effect on P-weights, with longer words having weaker connections. Phonological neighborhood density was uniquely associated with increased P-weights. Neither of the connection strength parameters were significantly associated with age-of-acquisition.
The pairwise proportions of variance accounted for are shown in Table 6. The LexSem and S-weight parameters had weak associations with individual lexical properties, while the Phon and P-weight parameters had strong associations with individual lexical properties, particularly phonological length and neighborhood density. The Attempt, LexPhon, and LexSel parameters had intermediate associations with lexical properties. These patterns are also evident in the stepwise regression fit statistics (RMSE).
Table 6.
Pairwise proportion of variance accounted for (R2) between lexical properties and MPT-Naming item difficulty parameters or SP item connection weight parameters. The strongest predictor for each parameter is shaded gray.
| LexFreq | PhonLeng | PhonDens | AoA | ||||
|---|---|---|---|---|---|---|---|
| MPT-Naming Item Difficulties | Attempt | 0.22 | 0.27 | 0.29 | 0.10 | ||
| LexSem | 0.05 | 0.02* | 0.04 | 0.04 | |||
| LexPhon | 0.29 | 0.09 | 0.04 | 0.04 | |||
| LexSel | 0.19 | 0.28 | 0.20 | 0.06 | |||
| Phon | 0.43 | 0.64 | 0.66 | 0.14 | |||
| Word-T | 0.16 | 0.42 | 0.47 | 0.02* | |||
| SP Item Weights | S-weight | 0.02* | 0.03 | 0.03 | 0.00* | ||
| P-weight | 0.29 | 0.64 | 0.66 | 0.09 | |||
Non-significant correlations (uncorrected p > .05) are marked with an asterisk (*).
LexFreq = the log transformed frequency of the target in American television and movie transcripts; PhonLeng = the number of target phonemes; PhonDens = the log transformed number of words differing from the target by a single phoneme; AoA = age of target word acquisition.
Summary
The MPT-Naming model’s item difficulty parameters showed unique patterns of association with all four of the objective lexical property measures. Effects of lexical frequency were distinguishable from effects of age-of-acquisition. Interpreting the effect of target length on LexSel led to the prediction and subsequent confirmation that responses with a semantic and phonological relation to the target are also typically shorter than the target. The SP model’s description of item variability in terms of connection strengths, on the other hand, was harder to interpret, and the connection strengths were less sensitive to objective lexical property measures than the MPT-Naming item difficulties.
General Discussion
The goal of the present study was to evaluate the merits of the MPT-Naming model versus the SP model in terms of encoding useful and generalizable linguistic and neuropsychological information in a large sample of persons with aphasia. We found that the MPT-Naming model does a better job of predicting out-of-sample picture naming data at the test and item levels (Study 1), that its parameters correlate more strongly with other, related neuropsychological measures (Study 2), that it enables a more robust evaluation of certain psycholinguistic theoretical predictions (Study 3), and that its parameters correlate more strongly with statistical properties of the lexicon (Study 4).
What is the basis of the MPT-Naming model’s better performance? One obvious factor is that the MPT-Naming model has more free parameters compared to SP. While one may be tempted to write off the improvements as a trivial consequence of the added parameters, this would be a mistake for several reasons. First, while it’s true that the MPT model has more free parameters, it has far fewer fixed assumptions, thus a direct comparison in terms of just the free parameter aspect of the models is not the whole story. Second, there is nothing inherently wrong with adding parameters if those parameters are capturing meaningful information rather than just modeling noise. Using out-of-sample prediction and correlation with independent measures, we confirmed that the MPT-Naming model is not merely fitting noise with the extra parameters. Rather, the model is encoding useful information that allows it to make better predictions and extrapolate beyond the naming task. This result, in turn, provides evidence that the SP model is oversimplified in important respects, which may not be a surprise to many researchers including the developers of the SP model. Indeed, these and other authors have noted several limitations of the SP model, as revealed by poor fits to a subset of individuals’ data (Caramazza & Hillis, 1990; Goldrick & Rapp, 2002; Schwartz et al., 2006).
This brings up the final reason for not trivializing the MPT-Naming model’s success: the additional parameters were not added for the sake of adding parameters but for empirical and theoretical reasons. Empirically, the SP model had known shortcomings and did not provide a generalizable account for item effects, suggesting additional model complexity was warranted (see also Caramazza & Hillis, 1990; DeLeon et al., 2007; Dell, 1986; Dell et al., 1999, 2004; Goldrick & Rapp, 2002, 2007; Levelt, Roelofs, & Meyer, 1999; Martin & Dell, 2019; Roelofs, 2004, 2000; Ueno, Saito, Rogers, & Lambon Ralph, 2011; Walker & Hickok, 2016 for investigations of more complex models). Our approach to adding model complexity was guided theoretically and with maximal parsimony: we hypothesized, following long-standing and standard assumptions in psycho- and neurolinguistics, that different error types arise from distinguishable computational processes that have the potential to reveal the architecture of the underlying speech production system (Fromkin, 1971). We estimated the computational abilities underlying the different error types in individual patients while incorporating item effects but without committing to a particular mechanistic processing model, which is what MPT modeling affords. Thus, the MPT parameters are far from frivolous and instead represent broad theoretical commitments in the field. What we have shown here is that by explicitly estimating latent abilities corresponding to the source of error types, together with the modulatory effects of items, the MPT-Naming model is able to encode useful (generalizable) information more effectively than the SP model.
However, this result does not necessarily imply that there is an isomorphic relation between the abilities we modeled and distinguishable processing stages or levels. Rather, it is likely that at least some of the ability parameters capture the dynamic interaction of representational levels rather than within-level processes (see Rapp & Goldrick, 2000 for discussion). Estimating abilities, while quite useful as we’ve clearly shown, does not automatically reveal the underlying architecture. While several critical assumptions in the MPT-Naming model were inspired by the SP model’s architecture, different network architectures can lead to the same predictions about the probability of specific naming error types, as Goldrick (2011) demonstrated. This means that there are almost certainly multiple mechanistic explanations that are consistent with the current estimated parameters of the MPT model. That said, we believe this investigation of the MPT model has indeed added to the body of evidence regarding the architecture and mechanisms of the speech production system. We discuss these contributions next.
The Lexical Source of Formal Phonological Errors.
Errors that are phonologically related to the target tend to be real words more frequently than would be expected due to chance disturbances of the phonological segments, in both aphasic and non-aphasic speakers (Best, 1996; Gagnon et al., 1997). There are two competing accounts of this fact grounded in different model architectures, one interactive, the other serial. On the interactive account, formal errors arise from selection errors at the lexical level that have been influenced by interaction with sublexical phonological representations (Dell, 1986; Dell et al., 1997; Foygel & Dell, 2000; Goldrick & Rapp, 2002; Rapp & Goldrick, 2000). On the serial account, no such interaction is possible so formal errors are assumed to be segmental selection errors with the lexical bias arising because a comprehension-based, post-lexical monitor catches and prevents nonword errors more efficiently (Levelt et al., 1999; Roelofs, 1992, 1997, 2000, 2004). Our MPT model separately accounts for presumed segmental- and lexical-based phonological errors via its Phon and LexPhon parameters and so should enable a strong test of these hypotheses. We tested two predictions of the competing hypotheses. First, we tested whether there was an association between the frequency of non-noun errors, which should be low if the error source is lexical (see Study 2), and the LexPhon parameter values. We found that LexPhon, but not Phon, was indeed correlated with non-noun error frequency as has been reported in a much smaller sample Gagnon et al. (1997). This is consistent with a lexical source for at least some formal errors. Second, we tested the hypothesis that a comprehension-based monitor was responsible for the lexical bias effect by measuring the correlation between variation in LexPhon and language comprehension measures. We found no unique, significant relation, which argues against a post-lexical monitor account of the lexical bias effect. Therefore, the more parsimonious explanation for lexical bias of phonological errors in our study seems to be interactivity between lexical and phonological representations internal to the production system.
The Source of the Mixed Error Effect.
Debates about interaction in the naming system have also turned on the observation that mixed errors (both semantically and phonologically related to the target) occur more often than would be expected due to phonological segment disturbances or mis-selections within a target’s semantic neighborhood, in both aphasic and non-aphasic speakers (N. Martin, Gagnon, Schwartz, Dell, & Saffran, 1996; Rapp & Goldrick, 2000; Roelofs, 2004). Intuitively, this fact suggests interaction between semantic and phonological processes as the source of mixed errors. However, our results provide evidence for an alternative account. Roelofs (2000) proposed that mixed errors arise from the simultaneous selection of two lemma candidates, which then race through word-form encoding to be the one that controls articulation. If the simultaneous activation of the target word-form primes the word-form of its competitor in a feedforward fashion, this competitor is more likely to emerge as the winner than a phonologically unrelated competitor, leading to a bias in the observed rates of mixed versus purely semantic errors. One piece of evidence supporting this view is our observation that mixed errors were shorter on average than the target, which makes sense if shorter words are more likely to win a race for phonological encoding. Another source of evidence is that the LexSel parameter, which is the ability to avoid mixed errors, is most strongly correlated with semantic tasks and tends to covary more with LexSem (R2 = .66), which also correlates strongly with semantic tasks, than with LexPhon (R2 = .54) or Phon (R2 = .31). This suggests that variation in the LexSel parameter is related to variation in higher-order, semantic-related networks, which, if disrupted, could affect the fidelity of lexical activation leading to more simultaneously activated lemmas. Although this evidence is somewhat indirect and will require further study, the association between LexSel and semantic variables lead to the conclusion that mixed errors have a more strongly semantic source than one might expect intuitively.
Routes for Repetition and their Relation to Naming.
The shared and distinct mechanisms of naming and repetition tasks have been previously investigated based on the performance of aphasic speakers (Dell et al., 2007; Goldrick & Rapp, 2007). A central goal has been to define the content of hierarchical levels of mental word-form representations that are processed during speech production. Dell et al. (2007) assumed that repetition involves only the second step of naming (phonological retrieval), thereby explaining why repetition is typically easier than naming. Furthermore, they noted that research into list memory has found that immediate repetition of multiple words relies primarily on phonological input and output resources, but also on lexical or semantic levels of representation as well (e.g., Hulme et al., 1997). Since the SP naming model adopts the multi-level (lexical and sublexical) approach to explaining phonological errors in naming, the success in predicting repetition error rates via the SP model weights was interpreted as being consistent with a multi-level mechanism of single-word repetition (Dell et al., 2007). The current results also support the idea of multi-level representations in list memory and sentence repetition, with Phon and LexPhon both exhibiting unique associations with these tasks. However, single-word and non-word repetition performance could be explained based on Phon alone, suggesting that a non-lexical route for single-word repetition is the norm for people with aphasia (see also, Goldrick & Rapp, 2007). The distinction between LexPhon and Phon in the MPT model thus could be viewed as being consistent with the distinction between lexical-phonological and postlexical-phonological processing. That is, LexPhon may reflect deficits in “L-level” (i.e., lemma or lexeme) processing (indicated by grammatical category effects) or deficits in lexical-phonological processing (indicated by phonological disruption of naming but not single-word repetition), while Phon reflects more specifically postlexical-phonological processing. Consistent with this suggestion, we find that excluding participants with apraxia of speech, a postlexical disorder in action planning of the articulators (Ziegler, 2002), only has a significant effect on the average Phon ability (two-sample t-test, n1 = 365, n2 = 275, two-tail p = .0028; p > .17 for all other ability comparisons). If this view is accepted, then the significant effects of lexical frequency on Phon in naming may be interpreted as a result of cascading activation from lexical to postlexical phonological representations (Goldrick & Rapp, 2002, 2007; Rapp & Goldrick, 2000).
In sum, the results of this investigation have provided support for aspects of the SP model including its interpretation of the source of formal errors, the interactivity between lexical and phonological levels during speech production, and for a general distinction between lexical and sublexical processes. We also found that the MPT model provides better out of sample predictions for naming errors at both the whole-test scale and individual item levels, and captures more relevant dimensions of linguistic impairment beyond naming than the SP model. This suggests some empirical deficiencies of the SP model that could be accommodated, we argue, by elaborating the mechanistic explanations. Specifically indicated directions of elaboration include, 1) acknowledging the independence of perseverative unrelated errors, 2) allowing the effects of damage to vary across vocabulary items, 3) consideration of individual differences in processing speed and decay rates on error types, 4) allowing for resolution of multiple lemmas being selected simultaneously, 5) explicit handling of the relationships between omissions and other error types, and 6) extension of word-form representations to include postlexical phonological processing. In terms of practical applications, the MPT model parameters are strong candidates for clinical assessment where ability estimates should provide a finer-grained picture of a given patient’s mental processing strengths and weaknesses than current clinical or model-based estimates.
Supplementary Material
Acknowledgments
Funding
This research was supported by the National Institute on Deafness and Other Communication Disorders [grant number P50 DC014664].
Appendix A
Connections Versus Selections
To clarify how the naming data is projected into the different parameter spaces defined by the models, a Bayesian perspective can be adopted to evaluate the impact of each response type on the estimated model parameters. A Bayesian implementation of the SP model was proposed by Walker (2016) that assumes a uniform prior distribution over the interval [0.0001, 0.04] for the S-weight and P-weight parameters, yielding a point estimate, before observing any data, of 0.02 in connection strength units or .5 as a proportion of the parameter range. Table A1 lists the change in the parameter point estimates as a proportion of the parameter range after observing a single response of each type. Given the non-linearity in the relationship between connection strengths and probabilities of response types, the direction of change is more easily interpreted than the magnitude of the change. As expected, a correct response leads to an increase in both connection strengths. Real-word errors—semantic, formal, mixed, and unrelated—lead to a decrease in S-weight and an increase in P-weight, while nonword errors primarily lead to a decrease in P-weight.
The marginal changes in MPT-Naming abilities (i.e., keeping all other abilities fixed) after observing each response type are listed in Table A2, reported as the probability of success on a PNT item of average difficulty. Unlike the SP model, the change in parameter estimates depends on the target item being named, and therefore a range of possible changes is presented. Again, the magnitudes of change are not directly comparable to the changes in SP parameter estimates, but the direction of change provides a useful comparison. As with the SP model, a correct response leads to an increase in all estimated abilities, and a Semantic error leads to a decrease in LexSem and an increase in Phon. Formal errors, however, are treated differently by the MPT-Naming model than the SP model, leading to a decrease in LexPhon and an increase in LexSem, with either a decrease or an increase in Phon depending on the item. Another difference from SP is that, while Neologism and Abstruse Neologism have the same negative effect on Phon, Neologism provides evidence of successful phonological neighborhood access, increasing LexSem, while Abstruse Neologism decreases LexSem. The MPT-Naming model accepts the reality of phonological and semantic neighbors competing at the lexical level as proposed by the SP model, but, unlike the SP model, it allows these types of competition to vary independently, both within an individual and across target items. These differences are intended to improve measurements of latent competition, and they have the potential to inform theoretical models about the speech production process and its functional organization in the brain.
Table A1.
Changes from the prior estimate of SP model parameters (.5) as a proportion of the parameter range after observing a single response of each type.
| S-weight | P-weight | |
|---|---|---|
| Correct | +.14 | +.02 |
| Semantic | −.43 | +.3 |
| Formal | −.42 | +.14 |
| Mixed | −.05 | +.21 |
| Unrelated | −.5 | +.2 |
| Nonword | −.01 | −.5 |
Table A2.
Changes from the prior estimate of MPT-Naming abilities (approximately .88 for LexSem, LexPhon, and LexSel and .80 for Phon) calculated in terms of the probability of success on a PNT item of average difficulty, after observing a single response of each type.
| LexSem | LexPhon | LexSel | Phon | |||||
|---|---|---|---|---|---|---|---|---|
| Min. | Max. | Min. | Max. | Min. | Max. | Min. | Max. | |
| Correct | +.0003 | +.0027 | +.0003 | +.0027 | +.0002 | +.0049 | +.0007 | +.0111 |
| Semantic | −.0108 | −.0035 | 0 | 0 | 0 | 0 | +.0007 | +.0111 |
| Formal | +.0003 | +.0055 | −.0092 | −.0034 | 0 | 0 | −.0112 | +.0078 |
| Mixed | +.0003 | +.0055 | +.0003 | +.0027 | −.0097 | −.003 | +.0007 | +.0111 |
| Unrelated | −.0006 | 0 | 0 | 0 | 0 | 0 | +.0006 | +.0064 |
| Neologism | +.0003 | +.0055 | 0 | 0 | 0 | 0 | −.0147 | −.0023 |
| Abstruse Neologism | −.0019 | −.0003 | 0 | 0 | 0 | 0 | −.0147 | −.0023 |
Appendix B
Estimating Mixed Error Rates from Simulated Phonological-level Errors
What is the probability that a selection error at the phonological-level will result in a real word with a semantic and phonological relation to the target (i.e., a mixed error)? For each target item on the PNT, we simulated 1,000 phonological errors by selecting a random phoneme in the target transcription and replacing it with another random phoneme of the same type (vowel or consonant) weighted by the relative frequency of each phoneme in a model lexicon (details below). If the replacement resulted in a consecutive pair of identical phonemes, then one phoneme was deleted, simulating cluster reduction, for example. We then calculated the rate at which mixed errors were observed from these simulated phonological errors. Of course, in the real data, mixed errors can differ from the target by more than one phoneme; however, given the combinatoric increase in possible phoneme strings relative to the modest potential increase in mixed neighbors within reach due to a broader error definition, we expected these simulations to provide a reasonable approximation to the true likelihood of mixed errors arising from disturbances at the phonological-level.
We used a custom MATLAB natural language processing program to identify semantic and phonological relationships between targets and their phonologically perturbed strings. Words were distinguished from nonwords using a list generated from the intersection of several public databases of English words to identify a core set of 40,058 common words with 48,084 acceptable transcriptions. The following databases were used: 1) the IPHOD/SUBTLEXus database of words collected from American movie and television transcripts (http://www.iphod.com/), 2) the SIL database of words collected from an online bulletin board (https://www.sil.org/resources/archives/70459), and 3) the GloVe database of words collected from a 42B-token Common Crawl of the Internet (https://nlp.stanford.edu/projects/glove/). Lists of semantic neighbors were generated for each PNT item using several databases and methods and then concatenating the results: 1) thresholding pairwise GloVe vector similarities at the top 100 words, followed by manual deletion of false positives by the author (G.M.W.), 2) manual identification by the author (G.M.W.) of taxonomic neighbors in the WordNet database (https://wordnet.princeton.edu/), and 3) extraction of 2,435 unique target-response pairs from aphasic naming data that were previously coded as exhibiting a semantic relation (thematic or taxonomic) (Walker et al., 2018). Phonological relationships were identified using string processing rules in accordance with the PNT scoring instructions (Roach et al., 1996), checking if the target and response share the first or last phoneme, or any two phonemes in any position, or any single phoneme in the same syllable and word position aligned from left to right. Finally, “exception” lists were generated for each item, containing responses that were not easily classified by the scoring rules, such as semantically related verbs being coded as descriptions (i.e., non-naming attempts). These lists were generated by running the scoring program on a large set of data and manually inspecting the discrepancies between human and computer scorers for computer-attributable scoring errors. When trained and tested on independent sets of real, human-coded aphasic picture naming data (training set size = 18,011 errors; testing set size = 19,893 errors), the auto-scoring program had 92% and 90% agreement with human raters on semantic and phonological relatedness, respectively. The computer scorer was not biased toward identifying a semantic relation relative to human scorers when they disagreed; the computer identified a semantic relationship in 52% of their disagreements. The computer scorer was biased toward identifying a phonological relation relative to human scorers; the computer identified a phonological relationship in 86% of their disagreements. Regardless of the source of the bias (computer versus human error), if anything, the computer is more likely to identify a mixed relationship, which is a conservative position with respect to the MPT-Naming model’s assumptions. These results indicate that the scoring program is accurate enough for our simulation purposes.
Simulated phonological errors did not result in any mixed errors for 158 of the 175 PNT items (90.3%). The relative frequency of phonologically generated mixed errors for the remaining 17 items are listed in Table B1.
Table B1.
Targets that resulted in mixed errors from simulated errors at the phonological level. The middle column shows the percentage of the 1,000 simulated phonological errors that resulted in a mixed error, while the right column shows the mixed neighbors that were obtained from simulated phonological errors.
| Target | % Mixed | Mixed Neighbors |
|---|---|---|
| pig | 9.8 | pug |
| bat | 5.8 | cat, rat |
| cat | 4.6 | bat, rat |
| camel | 4.3 | cattle |
| cow | 4.1 | sow |
| boot | 3.9 | suit |
| vase | 2.8 | case |
| snake | 2.3 | snail |
| snail | 2.1 | snake |
| pirate | 1.8 | parrot, pilot |
| duck | 1.6 | buck, dove |
| monkey | 1.6 | donkey |
| can | 1.3 | pan |
| fireman | 1.1 | foreman |
| saddle | 1.1 | cattle |
| vest | 0.1 | chest |
| dog | 0.1 | hog |
Footnotes
Declaration of Interests
The authors declare no competing interests.
Walker et al. (2018) used the same scoring protocol as Foygel and Dell (2000), but additionally included frequencies of non-naming trials and also split non-words into two categories based on the response’s phonological relation to the target. Unlike Foygel and Dell (2000), Walker et al. (2018) analyzed responses to each item, rather than frequencies over the entire test.
With one exception: the Sem ability is measured directly on the probability scale, without an item difficulty counterpart. This ability governs the probability of a lexical item intruding that is neither semantically nor phonologically related to the target. While items may differ with respect to the amount of semantic or phonological competition that is induced by accessing their representation through a spreading activation network, it is assumed that lexical items do not vary in terms of how much they elicit unrelated responses. These responses typically derive from perseverations or visual recognition errors that depend on the participants’ abilities to successfully access the lexicon rather than to navigate it.
One participant from the University of South Carolina archive who was included in Walker et al. (2018) was excluded due to the inability to produce any naming attempts, which cannot be fit by the SP model.
For the individual test, the number of parameters (1,057) appears to exceed the number of trial observations (175), and thus the degrees of freedom in the data. This violation of model fitting determinacy is illusory, however, because the MPT-Naming model is never fit to a single test when estimating item parameters (and person parameters, simultaneously). The number of MPT-Naming parameters that are fit to the full data set are (364 × 6) + (175 × 6) + 1 = 3,235, well below the degrees of freedom in the data, which are 364 × 175 = 63,700. Essentially, by contextualizing an individual’s responses within our knowledge of how other people with aphasia respond to each item, we can gain a better understanding of their overt response frequencies. Generating cross-validation predictions does not require any more model fitting (i.e., the parameters are already fixed from fitting the training data).
Making item-level predictions is essentially a betting problem, or more academically, an optimal decision problem. When betting on the outcome of a series of weighted coin tosses that have a fixed binomial probability of .6 weighted toward Heads with an even payout (i.e., predicting Heads or Tails results in 1 win), the expected value is greater for a strategy of always betting on Heads (the mode of the outcome probabilities) than a strategy of betting Heads 60% of the time and Tails 40% of the time. The same is true if bets are allowed to be split, assuming a fixed payout regardless of outcome; there is a higher expected value to going all-in on Heads than to splitting the bet with 60% on Heads and 40% on Tails. An example solution to this betting problem is presented in Walker et al (2018). The result from this binomial situation (flipping a weighted coin) extends to the multinomial situation (rolling a weighted die). The goal of cross-validation at the item-level is to make the best possible bets about the response type on each new naming trial given the information encoded in the parameters of the model after fitting previous trials. Predicting the posterior probability mode is the optimal decision strategy, because it yields the highest expected value in terms of the number of accurate predictions.
As pointed out by a reviewer, the number of participants that are better fit by the MPT model than the SP model is relatively small, making one wonder if one model is truly better than another since both fit the vast majority of cases about equally well. We would offer a sporting match analogy to interpret the comparison: Each model is a team, and 353 out of 365 attempts to score were blocked by the other team, but one team scored 11 times while the other team scored once. In this analogy, it is not difficult to select a winning team, and it is doubtful that spectators would judge the teams’ performances to be about equal.
Analyses were also performed using a liberal criterion to identify non-nouns, that is, identifying any word for which the noun form was not the primary usage of the word according to the part-of-speech dictionary. This approach yielded 2,263 formal errors from 141 participants who produced at least five formal errors and at least one non-noun for analysis; the median NFER was .16, ranging from .03 to .50. The results were qualitatively the same as using the conservative criterion, except that the item-level risk associations with S-P and LexPhon only exhibited trends in the predicted directions, rather than significant associations (p = .066 and .056, respectively).
References
- Bamber D (2018). Statisticians should not tell scientists what to think In Studies in Computational Intelligence (Vol. 808, pp. 63–82). Springer Verlag; 10.1007/978-3-030-04263-9_5 [DOI] [Google Scholar]
- Batchelder WH (1998). Multinomial processing tree models and psychological assessment. Psychological Assessment, 10(4), 331–344. 10.1037/1040-3590.10.4.331 [DOI] [Google Scholar]
- Batchelder WH, & Riefer DM (1999). Theoretical and empirical review of multinomial process tree modeling. Psychonomic Bulletin & Review, 6(1), 57–86. 10.3758/BF03210812 [DOI] [PubMed] [Google Scholar]
- Batchelder WH, & Riefer DM (2007). Using Multinomial Processing Tree Models to Measure Cognitive Deficits in Clinical Populations. [Google Scholar]
- Belke E, Brysbaert M, Meyer AS, & Ghyselinck M (2005). Age of acquisition effects in picture naming: Evidence for a lexical-semantic competition hypothesis. Cognition, 96(2). 10.1016/j.cognition.2004.11.006 [DOI] [PubMed] [Google Scholar]
- Best W (1996). When Racquets are Baskets but Baskets are Biscuits, Where Do the Words Come From? A Single Case Study of Formal Paraphasic Errors in Aphasia. Cognitive Neuropsychology, 13(3), 443–480. 10.1080/026432996381971 [DOI] [Google Scholar]
- Bozeat S, Lambon Ralph MA, Patterson K, Garrard P, & Hodges JR (2000). Non-verbal semantic impairment in semantic dementia. Neuropsychologia, 38(9), 1207–1215. Retrieved from http://www.ncbi.nlm.nih.gov/pubmed/10865096 [DOI] [PubMed] [Google Scholar]
- Brysbaert M, & Biemiller A (2017). Test-based age-of-acquisition norms for 44 thousand English word meanings. Behavior Research Methods, 49(4), 1520–1523. 10.3758/s13428-016-0811-4 [DOI] [PubMed] [Google Scholar]
- Brysbaert M, & Ellis AW (2016). Aphasia and age of acquisition: are early-learned words more resilient? Aphasiology, 30(11), 1240–1263. 10.1080/02687038.2015.1106439 [DOI] [Google Scholar]
- Busemeyer JR, & Wang Y-M (2000). Model Comparisons and Model Selections Based on Generalization Criterion Methodology. Journal of Mathematical Psychology, 44(1), 171–189. 10.1006/JMPS.1999.1282 [DOI] [PubMed] [Google Scholar]
- Caramazza A, & Hillis AE (1990). Where Do Semantic Errors Come From? Cortex, 26(1), 95–122. 10.1016/S0010-9452(13)80077-9 [DOI] [PubMed] [Google Scholar]
- Cardillo G (2010). MyFisher: the definitive function for the Fisher’s exact and conditional test for any RxC matrix. [Google Scholar]
- Chen Q, & Mirman D (2012). Competition and cooperation among similar representations: Toward a unified account of facilitative and inhibitory effects of lexical neighbors. Psychological Review, 119(2), 417–430. 10.1037/a0027175 [DOI] [PMC free article] [PubMed] [Google Scholar]
- Cuetos F, Aguado G, Izura C, & Ellis AW (2002). Aphasic naming in Spanish: Predictors and errors. Brain and Language, 82(3), 344–365. 10.1016/S0093-934X(02)00038-X [DOI] [PubMed] [Google Scholar]
- Cuetos F, Barbón A, Urrutia M, & Domínguez A (2009). Determining the time course of lexical frequency and age of acquisition using ERP. Clinical Neurophysiology, 120(2), 285–294. 10.1016/j.clinph.2008.11.003 [DOI] [PubMed] [Google Scholar]
- Dabul B (2000). Apraxia Battery for Adults. Austin: Pro-Ed. [Google Scholar]
- DeLeon J, Gottesman RF, Kleinman JT, Newhart M, Davis C, Heidler-Gary J, … Hillis AE (2007). Neural regions essential for distinct cognitive processes underlying picture naming. Brain, 130(5), 1408–1422. 10.1093/brain/awm011 [DOI] [PubMed] [Google Scholar]
- Dell GS (1986). A spreading-activation theory of retrieval in sentence production. Psychological Review, 93(3), 283–321. Retrieved from http://www.ncbi.nlm.nih.gov/pubmed/3749399 [PubMed] [Google Scholar]
- Dell GS, Chang F, & Griffin ZM (1999). Connectionist models of language production: Lexical access and grammatical encoding. Cognitive Science, 23(4), 517–542. 10.1207/s15516709cog2304_6 [DOI] [Google Scholar]
- Dell GS, Lawler EN, Harris HD, & Gordon JK (2004). Models of errors of omission in aphasic naming. Cognitive Neuropsychology, 21(2–4), 125–145. 10.1080/02643290342000320 [DOI] [PubMed] [Google Scholar]
- Dell GS, Martin N, & Schwartz MF (2007). A Case-Series Test of the Interactive Two-step Model of Lexical Access: Predicting Word Repetition from Picture Naming. Journal of Memory and Language, 56(4), 490–520. 10.1016/j.jml.2006.05.007 [DOI] [PMC free article] [PubMed] [Google Scholar]
- Dell GS, Schwartz MF, Martin N, Saffran EM, & Gagnon DA (1997). Lexical access in aphasic and nonaphasic speakers. Psychological Review, 104(4), 801–838. Retrieved from http://www.ncbi.nlm.nih.gov/pubmed/9337631 [DOI] [PubMed] [Google Scholar]
- Dunn LM, & Dunn LM (1997). PPVT-III: Peabody Picture Vocabulary Test. American Guidance Service. [Google Scholar]
- Erdfelder E, Auer T-S, Hilbig BE, Aßfalg A, Moshagen M, & Nadarevic L (2009). Multinomial Processing Tree Models. Zeitschrift Für Psychologie / Journal of Psychology, 217(3), 108–124. 10.1027/0044-3409.217.3.108 [DOI] [Google Scholar]
- Foygel D, & Dell GS (2000). Models of Impaired Lexical Access in Speech Production. Journal of Memory and Language, 43(2), 182–216. 10.1006/JMLA.2000.2716 [DOI] [Google Scholar]
- Fromkin VA (1971). The Non-Anomalous Nature of Anomalous Utterances. Language, 47(1), 27–52. [Google Scholar]
- Gagnon DA, Schwartz MF, Martin N, Dell GS, & Saffran EM (1997). The Origins of Formal Paraphasias in Aphasics’ Picture Naming. Brain and Language, 59(3), 450–472. 10.1006/BRLN.1997.1792 [DOI] [PubMed] [Google Scholar]
- Garrett M (1980). Levels of processing in sentence production, 177–220. [Google Scholar]
- Goldrick M (2011). Theory selection and evaluation in case series research. Cognitive Neuropsychology, 28(7), 451–465. 10.1080/02643294.2012.675319 [DOI] [PubMed] [Google Scholar]
- Goldrick M, & Rapp B (2002). A restricted interaction account (RIA) of spoken word production: The best of both worlds. Aphasiology. 10.1080/02687040143000203 [DOI] [Google Scholar]
- Goldrick M, & Rapp B (2007). Lexical and post-lexical phonological representations in spoken production. Cognition, 102(2), 219–260. 10.1016/j.cognition.2005.12.010 [DOI] [PubMed] [Google Scholar]
- Howard D, & Patterson K (1992). The Pyramids and Palm Trees Test: A test of semantic access from words and pictures. Thames Valley Test Company. [Google Scholar]
- Hulme C, Roodenrys S, Brown GDA, Schweickert R, Martin S, & Stuart G (1997). Word-frequency effects on short-term memory tasks: Evidence for a redintegration process in immediate serial recall. Journal of Experimental Psychology: Learning Memory and Cognition, 23(5), 1217–1232. 10.1037/0278-7393.23.5.1217 [DOI] [PubMed] [Google Scholar]
- Kertesz A (1982). The Western Aphasia Battery. New York: Grune & Stratton, Inc. [Google Scholar]
- Kittredge AK, Dell GS, Verkuilen J, & Schwartz MF (2008). Where is the effect of frequency in word production? Insights from aphasic picture-naming errors. Cognitive Neuropsychology, 25(4), 463–492. 10.1080/02643290701674851 [DOI] [PMC free article] [PubMed] [Google Scholar]
- Levelt WJM (1989). Speaking: From intention to articulation. Cambride, MA: MIT Press. [Google Scholar]
- Levelt WJM, Roelofs A, & Meyer AS (1999). A theory of lexical access in speech production. Behavioral and Brain Sciences, 22(01), 1–75. 10.1017/S0140525X99001776 [DOI] [PubMed] [Google Scholar]
- Martin N, & Dell GS (2019). Maintenance versus transmission deficits: The effect of delay on naming performance in aphasia. Frontiers in Human Neuroscience, 13, 406 10.3389/FNHUM.2019.00406 [DOI] [PMC free article] [PubMed] [Google Scholar]
- Martin N, Gagnon DA, Schwartz MF, Dell GS, & Saffran EM (1996). Phonological facilitation of semantic errors in normal and aphasic speakers. Language and Cognitive Processes, 11(3), 257–282. 10.1080/016909696387187 [DOI] [Google Scholar]
- Martin N, Schwartz MF, & Kohen FP (2007). Assessment of the ability to process semantic and phonological aspects of words in aphasia: A multi-measurement approach. 10.1080/02687030500472520 [DOI] [Google Scholar]
- Martin RC, Shelton JR, & Yaffee LS (1994). Language Processing and Working Memory: Neuropsychological Evidence for Separate Phonological and Semantic Capacities. Journal of Memory and Language, 33(1), 83–111. 10.1006/jmla.1994.1005 [DOI] [Google Scholar]
- Mirman D, Strauss TJ, Brecher AR, Walker GM, Sobel P, Dell GS, & Schwartz MF (2011). A large, searchable, web-based database of aphasic performance on picture naming and other tests of cognitive function. Cognitive Neuropsychology, (August). 10.1080/02643294.2011.574112 [DOI] [PMC free article] [PubMed] [Google Scholar]
- Neufeld RWJ (2015). Mathematical and Computational Modeling in Clinical Psychology In Busemeyer JR (Ed.), The Oxford Handbook of Computational and Mathematical Psychology (pp. 341–362). Oxford University Press. [Google Scholar]
- Nickels L, & Howard D (1994). A frequent occurrence? Factors affecting the production of semantic errors in aphasic naming. Cognitive Neuropsychology, 11(3), 289–320. 10.1080/02643299408251977 [DOI] [Google Scholar]
- Nickels L, & Howard D (1995). Aphasic naming: What matters? Neuropsychologia, 33(10), 1281–1303. 10.1016/0028-3932(95)00102-9 [DOI] [PubMed] [Google Scholar]
- Nickels L, & Howard D (2004). Dissociating Effects of Number of Phonemes, Number of Syllables, and Syllabic Complexity on Word Production in Aphasia: It’s the Number of Phonemes that Counts. Cognitive Neuropsychology, 21(1), 57–78. 10.1080/02643290342000122 [DOI] [PubMed] [Google Scholar]
- Nozari N, Kittredge AK, Dell GS, & Schwartz MF (2010). Naming and repetition in aphasia: Steps, routes, and frequency effects. Journal of Memory and Language, 63(4), 541–559. 10.1016/j.jml.2010.08.001 [DOI] [PMC free article] [PubMed] [Google Scholar]
- Rapp B, & Goldrick M (2000). Discreteness and interactivity in spoken word production. Psychological Review, 107(3), 460–499. 10.1037/0033-295X.107.3.460 [DOI] [PubMed] [Google Scholar]
- Riefer DM, & Batchelder WH (1988). Multinomial modeling and the measurement of cognitive processes. Psychological Review, 95(3), 318–339. 10.1037/0033-295X.95.3.318 [DOI] [Google Scholar]
- Roach A, Schwartz MF, Martin N, Grewal RS, & Brecher AR (1996). The Philadelphia Naming Test: Scoring and Rationale. Clinical Aphasiology, 24, 121–133. Retrieved from http://eprints-prod-05.library.pitt.edu/215/1/24-09.pdf [Google Scholar]
- Roelofs A (1992). A spreading-activation theory of lemma retrieval in speaking. Cognition, 42(1–3), 107–142. 10.1016/0010-0277(92)90041-F [DOI] [PubMed] [Google Scholar]
- Roelofs A (1997). The WEAVER model of word-form encoding in speech production. Cognition, 64(3), 249–284. 10.1016/S0010-0277(97)00027-9 [DOI] [PubMed] [Google Scholar]
- Roelofs A (2000). WEAVER++ and other computational models of lemma retrieval and word-form encoding. Aspects of Language Production. [Google Scholar]
- Roelofs A (2004). Error Biases in Spoken Word Planning and Monitoring by Aphasic and Nonaphasic Speakers: Comment on Rapp and Goldrick (2000). Psychological Review, 111(2), 561–572. 10.1037/0033-295X.111.2.561 [DOI] [PubMed] [Google Scholar]
- Schwartz MF, Dell GS, Martin N, Gahl S, & Sobel P (2006). A case-series test of the interactive two-step model of lexical access: Evidence from picture naming. Journal of Memory and Language, 54(2), 228–264. 10.1016/J.JML.2005.10.001 [DOI] [PMC free article] [PubMed] [Google Scholar]
- Tochadse M, Halai AD, Lambon Ralph MA, & Abel S (2018). Unification of behavioural, computational and neural accounts of word production errors in post-stroke aphasia. NeuroImage: Clinical, 18, 952–962. 10.1016/J.NICL.2018.03.031 [DOI] [PMC free article] [PubMed] [Google Scholar]
- Ueno T, Saito S, Rogers TT, & Lambon Ralph MA (2011). Lichtheim 2: Synthesizing Aphasia and the Neural Basis of Language in a Neurocomputational Model of the Dual Dorsal-Ventral Language Pathways. Neuron, 72(2), 385–396. 10.1016/j.neuron.2011.09.013 [DOI] [PubMed] [Google Scholar]
- Walker GM (2016). Computational Modeling of Speech Production and Aphasia. University of California, Irvine: Retrieved from https://escholarship.org/uc/item/1cp5g22d#supplemental [Google Scholar]
- Walker GM, & Hickok G (2016). Bridging computational approaches to speech production: The semantic–lexical–auditory–motor model (SLAM). Psychonomic Bulletin & Review, 23(2), 339–352. 10.3758/s13423-015-0903-7 [DOI] [PMC free article] [PubMed] [Google Scholar]
- Walker GM, Hickok G, & Fridriksson J (2018). A cognitive psychometric model for assessment of picture naming abilities in aphasia. Psychological Assessment, 30(6), 809–826. 10.1037/pas0000529 [DOI] [PMC free article] [PubMed] [Google Scholar]
- Ward G (1996). Moby Part-of-Speech II. Retrieved from https://archive.org/details/mobypartofspeech03203gut [Google Scholar]
- Yarkoni T, & Westfall J (2017). Choosing Prediction Over Explanation in Psychology: Lessons From Machine Learning. Perspectives on Psychological Science, 12(6), 1100–1122. 10.1177/1745691617693393 [DOI] [PMC free article] [PubMed] [Google Scholar]
- Ziegler W (2002). Psycholinguistic and Motor Theories of Apraxia of Speech. Seminars in Speech and Language, 23(4), 231–244. 10.1055/s-2002-35798 [DOI] [PubMed] [Google Scholar]
Associated Data
This section collects any data citations, data availability statements, or supplementary materials included in this article.