Abstract
Pathogenic alterations in the DPM2 gene have been previously described in patients with hypotonia, progressive muscle weakness, absent psychomotor development, intractable seizures, and early death. We identified biallelic DPM2 variants in a 23-year-old male with truncal hypotonia, hypertonicity, congenital heart defects, intellectual disability, and generalized muscle wasting. His clinical presentation was much less severe than that of the three previously described patients. This is the second report on this ultra-rare disorder. Here we review the characteristics of previously reported individuals with a defect in the DPM complex while expanding the clinical phenotype of DPM2-Congenital Disorders of Glycosylation. In addition, we offer further insights into the pathomechanism of DPM2-CDG disorder by introducing glycomics and lipidomics analysis.
Keywords: CDG, muscle weakness, lipidomics, intellectual disability, dolichophosphomannose
1. INTRODUCTION
Congenital disorders of glycosylation (CDG) consist of an expanding group of rare disorders resulting from defects in the glycosylation of proteins and lipids. The majority of known CDG defects are due to deficiencies in enzymes in the N-linked glycosylation pathway. The onset of symptoms of these disorders often occurs during infancy, though there is a wide range of manifestations from severe developmental delay, hypotonia, and multisystem disease to hypoglycemia and protein-losing enteropathy with normal development. One type of N-linked CDG results from pathogenic alterations in the dolichyl-phosphate mannosyltransferase polypeptide 2, regulatory subunit gene (DPM2). The encoded protein is part of the heterotrimeric dolichol-phosphate-mannose synthase (DPMS) complex, a key enzyme in N- and O-linked glycosylation as well as glycosylphosphatidylinositol (GPI)-anchor synthesis. DPMS is composed of DPM1, DPM2, and DPM3 (Figure 1). DPM1 is the catalytic subunit of DPMS while DPM2 and DPM3 have been described as regulatory and tethering subunits respectively (Maeda and Kinoshita, 2008). Mutations in any of the three DPMS subunits can lead to a CDG. So far, 12 cases of DPM1-CDG have been reported (Kim et al, 2000; Imbach et al, 2000; Garcia-Silva et al, 2004; Dancourt 2006; Yang et al, 2013; Bursle et al, 2016; Medrano et al, 2019). The most common clinical findings were elevated CK, coagulopathy, hypotonia, dysmorphic features, developmental delay, seizures etc. One patient had severe gastrointestinal involvement (Bursle et al, 2016). Transferrin isoelectric focusing (TIEF) results of most patients indicated CDG type I consistent with the DPMS localization and involvement in N-glycosylation pathway. Most of the patients had perinatal or early onset of clinical symptoms and were diagnosed at an early age. In contrast, three out of six known DPM3-CDG individuals had adult onset of the disorder (Van der Berg et al, 2017; Svahn et al, 2019). Most common clinical presentations were elevated CK, dilated cardiomyopathy and limb weakness. Only one patient with CNS involvement was reported (Fu et al, 2019). TIEF in two patients was suggestive of CDG-I (Svahn et al, 2017), one patient had a mildly abnormal TIEF result with increased trisialo and disialo transferrin (Lefeber et al, 2009), another patient had increased disialotransferrin (Tol et al, 2019) while one patient’s result was normal (Van der Berg et al, 2019). DPM2-CDG has so far been the smallest out of three DPSM related CDG. To date, there has been only one report of DPM2-CDG published in 2012, which described patients with pathogenic alterations in DPM2 (Barone et al., 2012). All three patients included in the report had a severe clinical presentation characterized by hypotonia, progressive muscle weakness and wasting, absent psychomotor development, intractable seizures, liver involvement, abnormal coagulation factors and early mortality (between 7 months and 3 years of age). TIEF was done in only one patient and was characteristic of CDG type I pattern.
Figure 1.
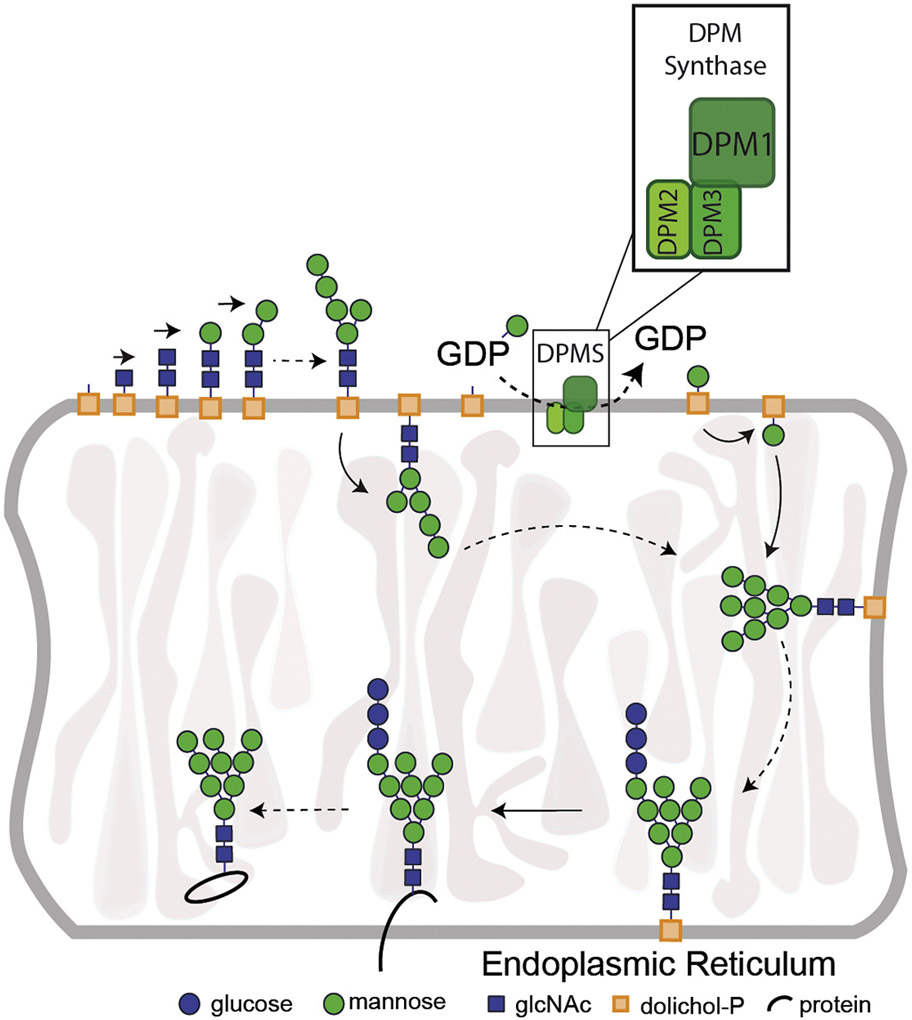
Simplified presentation of the role of DPMS (DPM1, DPM2, DPM3 complex) in N-glycosylation pathway. Abbreviations: DPMS-Dolichol Phosphate Mannose Synthase; DPM1- Dolichol phosphate mannose synthase subunit 1; DPM2- Dolichol Phosphate Mannose Synthase Subunit 2; DPM3- Dolichol Phosphate Mannose Synthase Subunit 3; GDP- Guanosine Diphosphate; P-Phosphate.
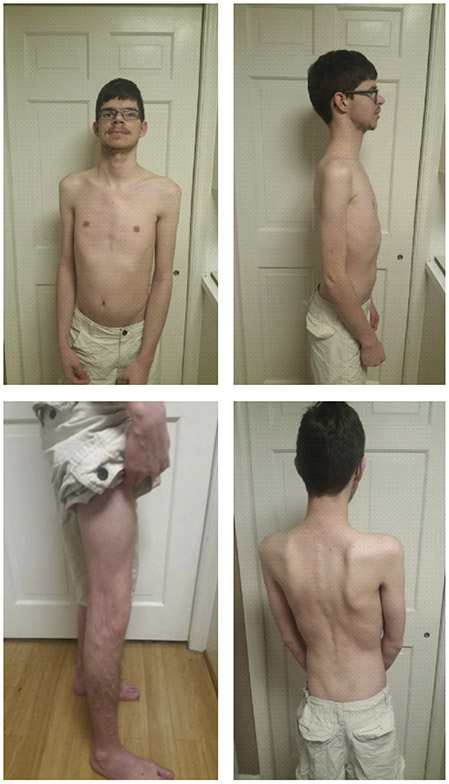
Here we report on an adult male with truncal hypotonia, hypertonicity, congenital heart defects, intellectual disability, and generalized muscle wasting (Figure 2) who was referred to genetic evaluation at 18-years-of age. Laboratory studies which included POLG sequencing and whole genome microarray analysis were normal while serum transferrin isoelectric focusing (TIEF) was mildly abnormal (Figure 3). Whole exome sequencing (WES) detected two novel heterozygous variants in the DPM2 gene (Figure 4). This case is the fourth case with DPM2-CDG and expands the phenotypes associated with this rare metabolic disorder.
Figure 2.
Adult patient with DPM2-CDG presenting with hypotonia and no dysmorphic features.
Figure 3.
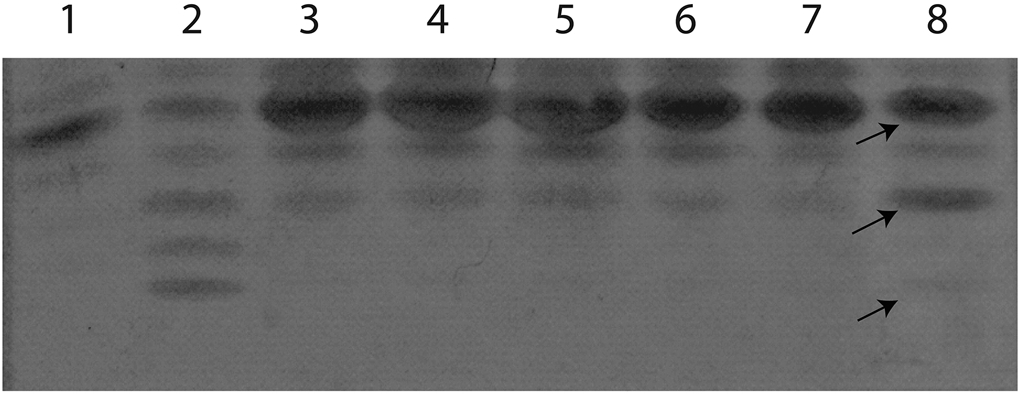
Transferrin isoelectric focusing (TIEF). Abnormal TIEF, showing decreased tetrasialo transferrin with elevated disialotransferrin isoforms in the patient (lane 8). Lane 1, healthy control; lane 2, PGM1-CDG positive control; lanes 3-7, normal controls. Differences in specific TIEF bands of the patients are indicated with arrows. Arrows from top to bottom- 1. tetrasialotransferrin, 2. disialotransferrin, 3. asialotransferrin
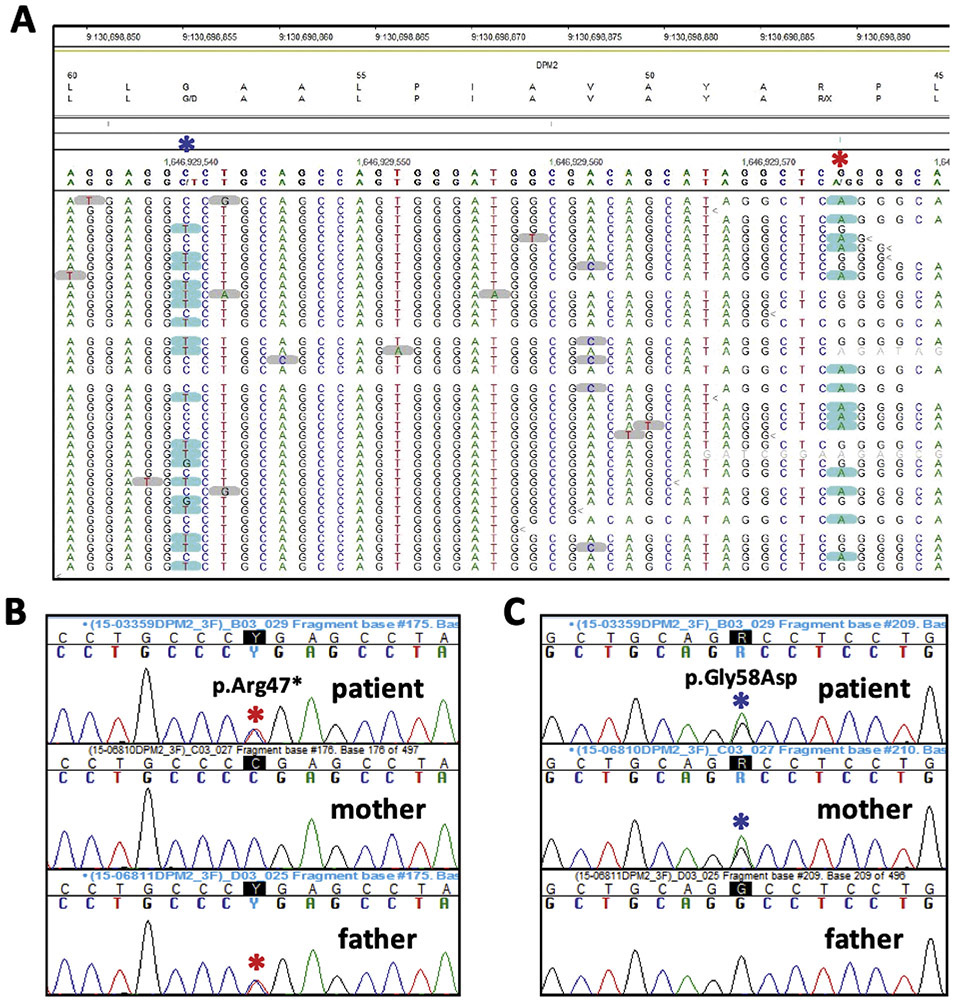
Figure 4.
Results of Whole Exome Sequencing. The reads from the NGS data indicate the two DPM2 alterations are on opposite alleles (A; note the genomic sequence is from the reverse strand). Sanger sequencing confirmed the p.Arg47* (c.139C>T) alteration was inherited from the father (B) while the p.Gly58Asp (c.173G>A) change was maternal in origin (C).
2. MATERIALS AND METHODS
2.1. Exome sequencing
The Agilent SureSelectXT Human All Exon V5 kit was used to target the exonic regions of the genome (coding sequences and splice junctions of known protein-coding genes) using genomic DNA from the patient and his parents. The targeted regions were sequenced using the Illumina NextSeq® 500 System with 150 base pair paired-end reads. Using NextGENe® software and an in-house bioinformatics pipeline, the DNA sequence was aligned and compared to the human genome build 19 (hg19/NCBI build 37). The Cartagenia Bench Lab NGS software was used to filter and analyze sequence variants identified in the patient and compare them to the sequences of family members.
2.2. Sanger sequencing
Variants reported by WES were validated by Sanger sequencing. In addition, segregation analysis of the candidate variants was performed. Variant nomenclature adhered to the Human Genome Variation Society (HGVS) guidelines. Patient’s fibroblasts were collected by scraping in PBS and pellet was obtained by centrifugation. Genomic DNA was then extracted from the pellet. Based on genomic sequence (GenBank accession number NC_000020.11), primers (available on demand) were designed to amplify the different exons of the DMP1 and DMP2 gene including at least 50 bp of the flanking intronic regions. Standard PCR reactions were based on 1 μl DNA and 0.2 μl Platinum® Taq polymerase (Invitrogen) in a final volume of 25 μl. Reaction conditions were 3 min at 95°C, then 10 cycles of 30 s at 95°C, 30 s at 65°C (−1°C each cycle) and 1 min at 72°C, followed by 25 cycles of 30 s at 95°C, 30 s at 55°C and 1 min at 72°C. Then the reaction was completed with a final elongation of 5 min at 72°C. The BigDye® Terminator Ready reaction cycle sequencing kit v.3.1 (Applied Biosystems) was used for the sequencing of the resulting PCR product. Finally, the analysis of the results was performed on an ABI3100 Avant (Applied Biosystems).
2.3. Transferrin isoelectric focusing
Transferrin Isoelectric Focusing (TIEF) was carried out essentially as described by van Eijk and van Noort ((1992) Electrophoresis 13:354–358). Plasma samples were incubated for 30 min with 10 mM ferric citrate and 0.5 mM sodium hydrogen carbonate (2:1) in a ratio of 10:3 (plasma to solution) to saturate the transferrin with iron. The iron-saturated plasma was diluted 5 times with water and applied to a hydrated immobiline gel (pH 4–7) on an Ultraphore system (Amersham Pharmacia Biotech). After IEF, the transferrin isoforms were detected by adding rabbit anti-human transferrin antibody (Dako, Glostrup, Denmark) and the gels were stained with Coomassie blue. The relative amounts of the transferrin isoforms were determined by scanning the stained gel using an Image master Labscan, Ver. 3.00 (Amersham Pharmacia Biotech) and quantified using Image master 1D gel analysis, Ver. 4.10, software (Amersham Pharmacia Biotech).
2.4. Glycome analysis
Serum matrix-assisted laser desorption ionization time-of-flight mass spectrometry (MALDI-TOF MS) total N-glycan analysis and glycan analysis of intact transferrin and Apolipoprotein CIII (ApoCIII) were performed as described previously (Ferreira et al, 2018; Balakrishnan et al, 2019).
2.5. Cell culture
Primary skin fibroblasts from patient and 8 healthy controls (Coriell Institute for Medical Research, USA) were cultured at 37°C under 5% CO2 in Minimum Essential Medium α (MEMα, Gibco, Life Technologies) supplemented with 1 mM nonessential amino acids, 10% fetal bovine serum, antimycotic (amphotericin B 0.125 μg/ml) and antibiotics (penicillin 100 IU/ml, streptomycin 100 μg/ml). Fibroblasts were grown in a 175 cm2 tissue culture dish and 1×10⁷ cells were harvested for analysis.
2.6. Western blotting
Protein was obtained by lysing the harvested cells in RIPA buffer supplemented with protease inhibitors (ThermoFisher Scientific, USA). Protein concentration was determined using Pierce BCA assay (ThermoFisher Scientific, USA).
For DPM1 protein expression, 20 μg total protein was prepared in Novex NuPAGE LDS Sample Buffer (ThermoFisher Scientific, USA) with Novex NuPAGE Sample Reducing Agent (ThermoFisher Scientific, USA) and denatured at 70°C for 10 minutes. For DPM2 protein expression, 30 μg total protein was prepared in Novex NuPAGE LDS Sample Buffer (ThermoFisher Scientific, USA) with Novex NuPAGE Sample Reducing Agent (ThermoFisher Scientific, USA) and denatured at 95°C for 5 minutes.
Healthy and patient- derived samples were loaded onto a Novex NuPAGE 10% Bis-Tris Gel (ThermoFisher Scientific, USA) and electrophoresed at 200 Volts for 55 minutes in Novex NuPAGE MOPS SDS Running Buffer (ThermoFisher Scientific, USA) supplemented with 0.25% NuPAGE antioxidant (AO) (Invitrogen Corporation, USA). PageRuler prestained protein ladder (ThermoFisher Scientific, USA) was used to monitor protein separation. After the separation, proteins were transferred to a 0.45 μm pore size Novex nitrocellulose membrane (ThermoFisher Scientific, USA) at 30 Volts for 1.5 hours in an ice bath using 1x Transfer buffer (ThermoFisher Scientific, USA) with an additive of 10% Methanol. Ponceau staining was applied to ensure equal protein loading. The membrane was cut according to the expected target protein band. DPM1 blot was incubated in SEA BLOCK blocking buffer, while DPM2 blot was rocked for one hour in 5% BSA (ThermoFisher Scientific, USA) in TBST (1x TBS (BioRAD, USA) supplemented with 0.1% Tween 20 (ThermoFisher Scientific, USA) blocking Buffer at room temperature. Immunodetection was performed using goat polyclonal anti-human DPM1 (1:500, Santa Cruz Biotechnology sc-15836), rabbit polyclonal anti-human DPM2 (1:250. Thermo Fisher Scientific, PA5-71442), monoclonal mouse anti-GAPDH (1:20,000, Invitrogen; AM4300) and monoclonal mouse anti-β-Actin (AbCam; 1:10000). DPM1 and BACT antibodies were diluted in SEA BLOCK Blocking Buffer and the membrane was rocked overnight in a 4 °C cold room. For DPM2/GAPDH blot antibodies were diluted in 5%BSA/TBST Blocking Buffer and the membrane was rocked 72 h in a 4 °C cold room. Following six 10-minute-washes with 1x Phosphate Buffered Saline (PBS) supplemented with 0.1% Tween 20 (Sigma Aldrich, USA). The membrane was incubated with Pierce DyLight 800-conjugated rabbit anti-goat (1:10000, Thermo Scientific SA5-10082) and DyLight 680-conjugated goat anti-mouse antibody (Thermoscientific 35518; 1:10000) for one hour at room temperature, before being washed six times, 10 minutes each, in 0.1% PBS-Tween. The membrane was visualized on a Licor Odyssey CLx Infrared Imaging System (LI-COR Biosciences, USA). Signal intensity was quantified offline by Odyssey software (Version 2.0). Measured intensities of DPM1 protein bands were normalized with beta-Actin intensity. Measured intensities of DPM2 protein bands were normalized with GAPDH intensity.
ICAM1 protein expression was analyzed by a similar western blotting protocol as DPM1, with the following exceptions: 20 μg enriched hydrophobic protein was resolved by 10% SDS-PAGE; transfer time was extended to two hours; membrane Blocking Solution (Invitrogen Corporation, USA) was used for membrane blocking and antibody dilution. The primary antibody was rabbit anti-ICAM1 (Santa Cruz, sc7891; 1:4000), and the secondary antibody used was Pierce DyLight 800-conjugated goat anti-rabbit (Thermoscientific 35571; 1:5000). The loading mass control, Beta-Integrin (ITGB1), was probed separately, after the same blot was visualized and blocked in membrane Blocking Solution for one hour at room temperature. The primary antibody, mouse anti-Integrin-B1 (Santa Cruz, sc374429) was diluted at 1:300 and the secondary antibody; DyLight 680-conjugated goat anti-mouse (Thermoscientific 35518) was diluted 1:5000.
To assess LAMP2 protein expression, Novex NuPAGE LDS Sample Buffer (ThermoFisher Scientific, USA) and 10% β-mercaptoethanol (ThermoFisher Scientific, USA) were added to 20 μg of total protein lysate and denatured at 95°C for 5 minutes. Next, the samples were separated on a Novex NuPAGE 4-12% Bis-Tris Gel (ThermoFisher Scientific, USA) at 200V for 1h at room temperature. The proteins were transferred to the 0.45 μm pore size Novex nitrocellulose membrane (ThermoFisher Scientific, USA) at 30 Volts for 3 hours in an ice bath using 1x Transfer buffer (ThermoFisher Scientific, USA) and 10% Methanol. The membrane was later blocked in 5% milk in PBS for 1h at room temperature and incubated) at 4°C overnight with primary antibodies in 5% milk in PBS (Mouse LAMP2 1:1000 MA1-205, abcam; Rabbit BACT 1:5000 Cat# AC026 ABclonal). The membrane then was washed 3 times, 10min in PBST followed by an 1h incubation with secondary antibodies (1:5000 Donkey anti-Mouse Invitrogen Cat#SA510172 Dy-light 800; 1:5000 Donkey anti-Rabbit Invitrogen Cat#SA5-10043 Dy-light 680) in 5% milk in PBS at 4°C. Washing steps were repeated (3 times, 10min, PBST) with an additional wash in PBS (10min). BACT and LAMP2 bands were visualized and quantified by OddysayFC scanner.
2.7. Immunohistochemistry
Immunohistochemistry with antibodies for ICAM1, as a cellular marker for N-glycosylation defects, was applied in order to evaluate the glycosylation content. Immunohistochemistry experiments were performed on cells seeded on glass coverslips and cultured for four days. Cells were washed once with PBS, fixed in 4% Paraformaldehyde (PFA; Sigma Life Science, USA) for 10 minutes, and permeabilized with 0.1% Saponin and 0.1% BSA in PBS for 15 minutes at room temperature. After washing three times with PBS, cells were blocked in PBS containing 5% Normal Donkey serum (NDS; Jackson ImmunoResearch, USA) for one hour at room temperature. Cells were incubated with a primary antibody mouse-anti-ICAM1 (Thermo Scienctific, MA5-13021; 1:500) for three nights at 4 °C. Two coverslips were incubated only with 5% NDS and served as negative controls. Coverslips from a wild type were used as positive controls. Following three washes with PBS, cells were incubated with biotinylated Donkey anti-mouse (Jackson ImmunoResearch, cat. No. 715-065-151; 1:400) and then streptavidin-conjuguated Cy3 (Jackson ImmunoResearch, cat. No. 016-160-084) with a final concentration of 1 μg/mL. The primary and secondary antibodies and the streptavidin-conjugated fluorphore were diluted in PBS containing 5% NDS. After staining, the coverslips were washed in three changes of PBS, 10 minutes each, before being mounted with VectorShield Mounting Medium containing DAPI (Vector Laboratories, USA). The microscopic slides were viewed using a fluorescence Olympus BX51 System Microscope with an Olympus DP80 Color Camera (Olympus, Japan).
2.8. ICAM1 RT-qPCR
RNA was extracted from harvested cells by using RNeasy Mini kit (QUIAGEN). RNA concentration was determined by NANO drop (ThermoFisher Scientific, USA).
Complementary DNA (cDNA) was synthesized using Superscript™ III First-Strand Synthesis system (ThermoFisher). Primarily, 8 μl of RNA, 1 μl of random hexamers and 1 μl 100mM dNTP was added to the PCR tube and incubated at 65°C for 5min. Then, 2 μl of 10xRT buffer, 4 μl of 25mM MgCl2, 2 μl of 0.1M DTT, 1 μl of RNaseOUT, 1 μl of Superscript III Reverse Transcriptase (RT) was added to the mixture. cDNA synthesis was performed using T100 thermal cycler (Bio-Rad) (10 min at 25 °C, 50 min at 50 °C, 5 min at 95 °C, 4°C until cool).
Primer Bank was used to obtain primers for the genes of interest (Spandidos et al, 2008; Radenkovic et al, 2019). SYBR green PCR Master Mix protocol was followed during the preparartion of the qPCR sample (1.1 μL of cDNA, 1.1 μL of primer mix, 5,5 μL SYBR Green, 3.3 μL RNase free water). Samples in triplicates were added to the 384 well plate and the following PCR program was run: 30 sec, 95 °C; 40x 15 sec, 95 °C; 1 min, 60 °C. Machine built in protocol was used to quantify the melt curve analysis. Next, Ct values were exported from the program and analysed. Pffafl, 2001 method was used to calculate relative ICAM1 expression against three housekeeping genes (BACT, GADH, 18sRNA). The experiment was repeated twice.
2.9. Lipid extraction
To cell pellets equivalent to 1×10⁷ fibroblast cells, deuterated lipid standards (Avanti Polar Lipids, Alabaster, AL) was added as internal standards. Cellular lipids were extracting using a modified Bligh and Dyer method (Lee et al, 2017). With neutral and acidic extraction via liquid-liquid extraction, cellular lipids were dried and kept at −80 °C until mass spectrometry analysis.
2.10. Liquid chromatography-tandem mass spectrometry for lipidomics
The lipid extracts were analyzed using Orbitrap Fusion Tribrid ID-X mass spectrometer (ThermoFisher Scientific, USA) coupled to Vanquish Horizon UHPLC (ThermoFisher Scientific, USA). A Hypersil Gold Vanquish C18 UHPLC column (2.1×150mm, 1.9 μm) was used to separate the endogenous lipids. Cellular lipids were analyzed in both positive and negative ion mode using mobile phase A consisted of water:acetonitrile=6:4 (v/v) and mobile phase B of isopropanol:methanol:acetonitrile=8:1:1 (v/v/v). For both mobile phases, 10 mM ammonium formate and 0.1% formic acid were used as modifiers. A binary gradient was applied to elute lipids according to their physicochemical properties within 20 min. All samples were run in triplicate in randomized order.
2.11. Data analysis for lipidomics
Cellular lipids from fibroblasts were identified using LipidSearch (ThermoFisher Scientific, USA), based on precursor mass and its corresponding fragment ions from tandem mass spectra. As database of LipidSearch lacks theoretical fragment ions of dolichols, endogenous dolichols analyzed in this study (dolichol 15-21) were determined based on the precursor mass, retention time and tandem mass spectra of dolichol standards (Indofine Chemical Company, Inc, USA). Quantiative measurement of lipids was accomplished using Pyquant, which calculated peak areas of lipids based on retention time and precursor mass of annotated lipids (Mitchell et al, 2016). Peak areas of all lipid subspecies were referenced to those of deuterated internal standards. We applied Student’s t-test to calculate p-value of each species between controls and the patient.
2.12. Literature review
Database search (PubMed, OMIM) was performed from the date of the first DPMS report until September 2020. Following terms were used: dolichol phosphate mannose synthase; DPM1-CDG; DPM2-CDG; DPM3-CDG; DPMS, DPM1, DPM2, DPM3 deficiency.
3. RESULTS
3.1. Clinical features
The patient is a 23-year-old male with truncal hypotonia, lower extremity hypertonicity, bicuspid aortic valve, aortic stenosis, intellectual disability, and generalized muscle wasting (Figure 2). After an unremarkable pregnancy, delivery, and perinatal period, he was appreciated to have developmental delay when he could not sit without support until 20 months and walk until 2.5 years of age. He was referred for genetic evaluation at 18 years of age because of suspected muscular dystrophy suggested by thin habitus, muscle wasting, and increased serum creatine kinase level (6000 U/L). His height was at the 10th centile but weight and head circumference were less than the 3rd centile. No dysmorphic facial features were observed. He was noted to have tight heel cords but significant truncal hypotonia leading to a very broad-based gait. Laboratory studies which included POLG sequencing and whole genome microarray analysis were normal. Serum transferrin isoelectric focusing was mildly abnormal (Figure 3) suggestive of possible CDG.
3.2. WES results
Whole exome sequencing (WES) identified two heterozygous alterations in the DPM2 gene (c.139C>T, p.Arg47*; c.173G>A, p.Gly58Asp) which were confirmed to be in trans by parental studies (Figure 4). Neither variant has been previously reported in the publicly available SNP databases or the Human Gene Mutation Database. The p.Gly58Asp missense change is predicted to be deleterious by multiple algorithms (Mutation Taster, LRT, PolyPhen2, and SIFT). Patient fibroblasts showed lower DPM2 expression (~60% of control, Figure 5). No quantifiable DPM1 protein expression was detected (Figure 5A) confirming the deleterious effects of the DPM2 alleles identified by WES. In order to assess the effect of the alleles in vitro, we performed western blot analysis of DPM1, a DPMS subunit, whose expression depends on DPM2 and DPM3.
Figure 5.
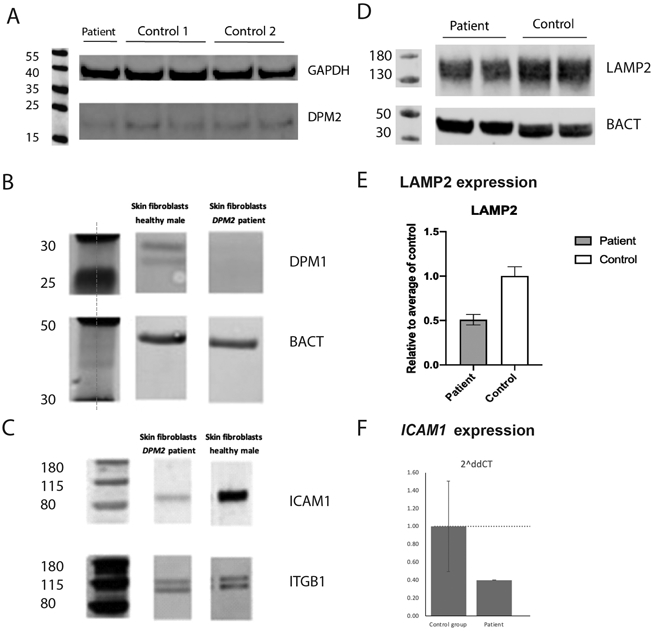
Western blot and RT-qPCR analysis. Fibroblasts from the patient showed decreased DPM2 expression compared to 2 healthy controls by Western blot (A). In addition, no quantifiable DPM1 protein expression was detected (B, note DPM1 expression is dependent on normal DPM2 and DPM3 expression). The patient’s fibroblasts also revealed a significant decrease in ICAM1 protein expression, suggesting abnormal N-linked glycosylation (C). Fibroblast from the patient show decreased LAMP2 expression compared to the healthy control (D, E). Fibroblasts from the patient present with a decreased expression of ICAM1 compared to the healthy controls (n=3) (F).
3.4. Glycosylation studies
As deleterious mutations in DPM2 were previously reported to cause DPM2-CDG and our patient’s TIEF results were slightly abnormal with increased disialotransferrin and little to absent asialotransferrin (Figure 3), we further evaluated the glycosylation status of patient fibroblasts in vitro. To achieve this, we performed ICAM1 western blot, immunohistochemistry and mRNA expression studies.
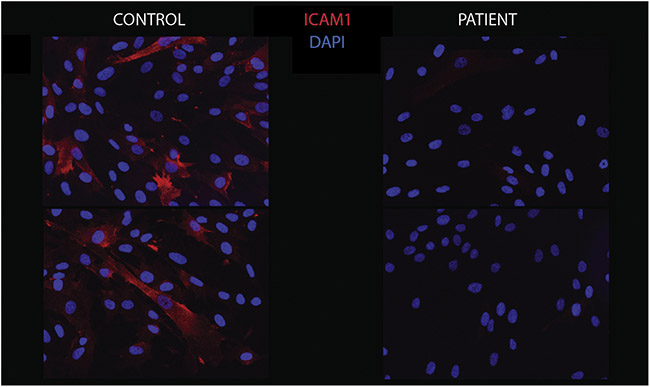
Our experiments revealed a significant decrease in ICAM1 protein expression in the patient’s fibroblasts (Figure 5B) and ICAM-1 immunostaining was also decreased (Figure 6). Furthermore, ICAM1 expression was relatively lower in the patient cells compared to the controls (Figure 5E).
Figure 6.
ICAM1 immunohistochemistry. Fibroblasts from the patient (right) showed a significant decrease in ICAM1 protein expression by immunofluorescence staining compared to the control (left), indicative of a decrease in cell surface N-linked glycosylation.
ICAM1 has been implicated in several other disorders (Witkowska and Borawska, 2004; Lawson and Wolf, 2006), therefore the use of other CDG biomarkers is recommended. We performed additional glycosylation studies in the patient’s fibroblasts by evaluating LAMP2 expression as well as glycomics analysis. Similarly, we observed decreased expression of LAMP2 in the patient (Figure 5C, D) further corroborating the glycosylation abnormalities and a possible CDG.
Though, Matrix-assisted laser desorption ionization time-of-flight mass spectrometry (MALDI-TOF MS) N-glycan analysis was normal, glycomics analysis revealed increases in Transferrin Mono-oligo/Di-oligo (0.38) and A-oligo/Di-oligo (0.019) ratio (Table 1). This result is consistent with a CDG type I profile, patient’s TIEF profile (Figure 3) and comparable to the results reported in the other DPM2-CDG patients (Barone et al, 2012).
Table 1.
Results of glycomic analysis of intact transferrin and ApoCIII
| Ratio | Normal | Patient |
|---|---|---|
| Mono-oligo/Di-oligo Ratio | <=0.06 | 0.38 |
| A-oligo/Di-oligo Ratio | <=0.011 | 0.019 |
| Tri-sialo/Di-oligo Ratio | <=0.05 | 0.04 |
| Apo CIII-1/Apo CIII-2 Ratio | <=2.91 | 1.12 |
| Apo CIII-0/Apo CIII-2 Ratio | <=0.48 | 0.30 |
3.5. Alterations in fibroblast lipidomics
Given the implication of DPMS in GPI anchor synthesis, we performed lipidomics analysis in patient fibroblasts. Cellular lipids from 30 subclasses of phospholipids, sphingolipids, sterols, glycerides, free fatty acids, acyl carnitines, acylethanolamines were quantified and compared with those of 8 healthy controls. Changes in subclasses of lipids were analyzed by adding normalized peak area of subspecies within each class.
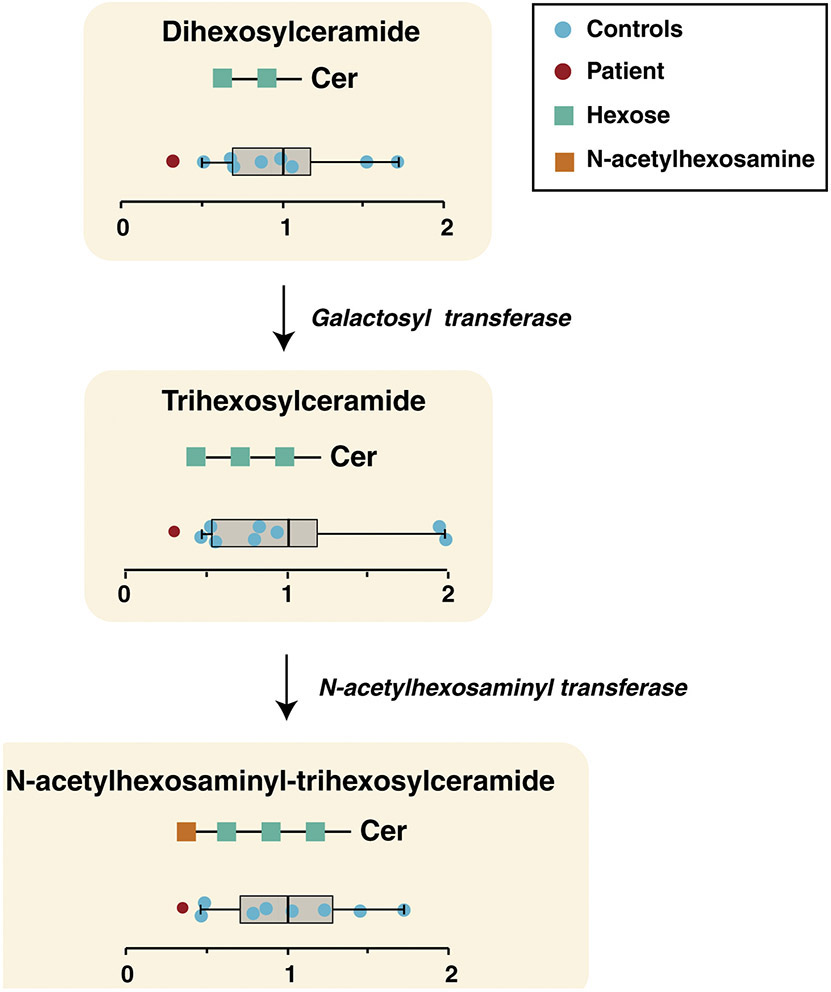
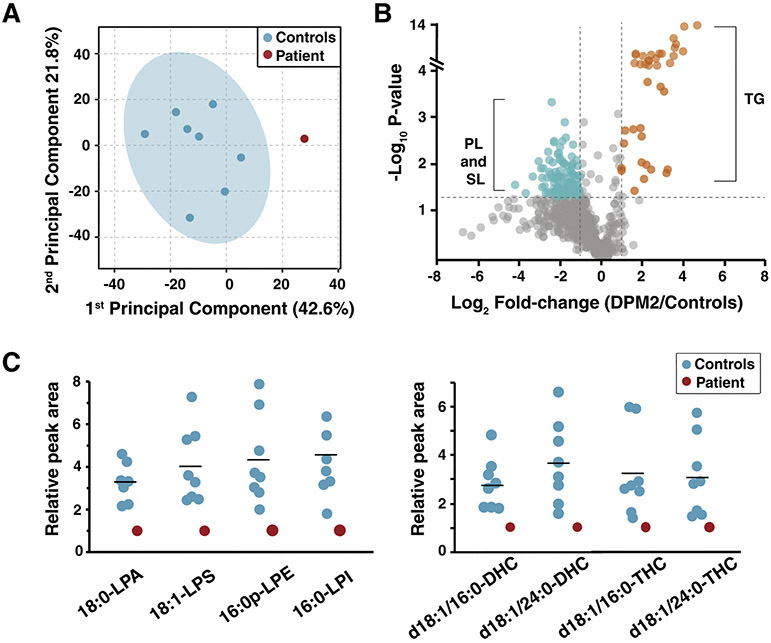
We observed significant differences in lysophospholipids especially lysophosphatidylserine (LPS) and lysophosphatidic acid (LPA) (Figure 7). In addition to lysophospholipids, alterations in the ceramide pathway were observed as the total dihexosylceramide (DHC), trihexosylceramide (THC) and N-acetylglucosamine-trihexosylceramide were down-regulated in patient fibroblasts. (Figure 8). As DHC, the precursor of complex ceramide containing hexose moieties, was significantly decreased in the patient, downstream ceramides were decreased as well.
Figure 7. Relative abundance of lipids in DPM2-mutant and control fibroblasts.
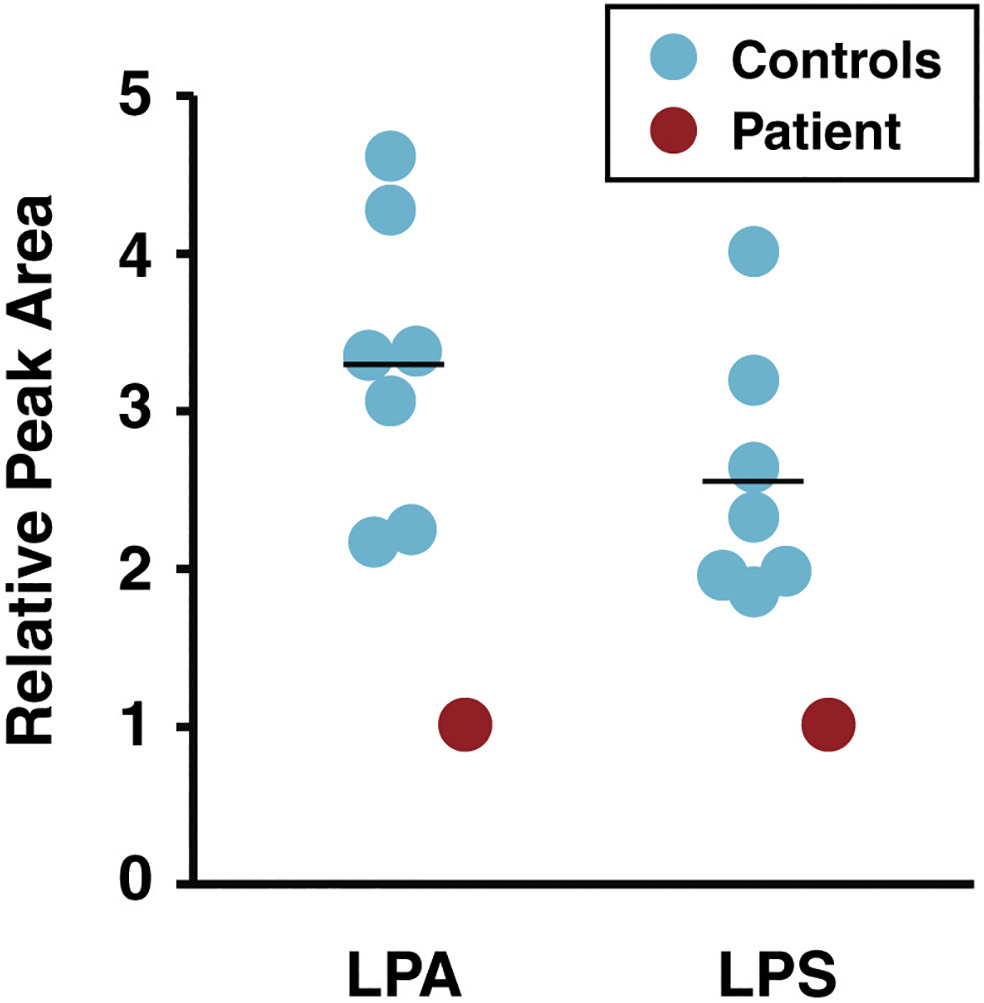
Relative peak areas reflecting abundance of lysophosphatidic acid (LPA) and lysophosphatidylserine (LPS) from lipidomic analysis of fibroblasts from controls (blue) and the DPM2 patient (red) are shown as circles. The horizontal line indicates average values in each group.
Figure 8. Lipid alterations in ceramide biosynthesis pathway.
The pathway for biosynthesis of ceramides is shown with individual ceramide classes indicated as a schematic within yellow rectangles along with their relative abundance in controls (blue circle) and the patient (red circle). The whiskers represent minimum and maximum values observed for controls. Left and right ends of the box indicate the first and third quartiles of the abundance in controls, respectively, while the vertical line inside the box represents the mean abundance. The enzyme galactosyl transferase catalyzes transfer of hexose (green squares) to produce trihexosylceramide from dihexosylceramide and N-acetylhexosaminyl transferase synthesizes N-acetylhexosaminyl-trihexosylceramide by transferring N-acetylhexosamine (orange square) to trihexosylceramide.
Principal component analysis based on individual lipid subspecies shows that the lipidome from controls and patient fibroblasts are distinct (Figure 9A). Although many subspecies from phospholipids and sphingolipids were decreased (blue) in the patient, triglycerides (orange) were increased (Figure 9B). The lipid subspecies that showed significant decrease in the patient were among the three most abundant species in each class including 18:0-LPA, 18:1-LPS, 16:0p-lysophosphatidylethanolamine, 16:0-lysophosphatidylinositol, d18:1/16:0-DHC, d18:1/24:0-DHC, d18:1/16:0-THC and d18:1/24:0-THC (Figure 9C). As high abundance subspecies showed a significant decrease, the total levels of LPA, LPS, DHC and THC were also decreased significantly in the patient (Figure 7 and 8).
Figure 9. Alterations in lipid subspecies from multiple classes of lipids in the DPM2 patient.
(A) Principal component analysis on untargeted lipidomics of control fibroblasts (blue) and DPM2 patient-derived fibroblasts (red) is illustrated. (B) Changes of individual lipid subspecies in the DPM2 patient with reference of controls is shown as a volcano plot. Each circle represents fibroblast lipid species analyzed in the study. Lipid species that were increased significantly in the DPM2 patient (fold-change>2 and p<0.05) are shown in orange while those that were decreased (are shown in blue. The lipid species that were not significantly altered are depicted in gray. While lipid species that were increased in the patient were mainly triglyceride (TG) subspecies, those that were decreased were mainly phospholipid (PL) and sphingolipid (SL) subspecies. (C) Relative peak areas of high abundance phospholipids (left panel) and sphingolipids (right panel) subspecies that were decreased in the DPM2 patient (red) compared to controls (blue) are shown. The horizontal line indicates average values in each group.
*Abbreviations: DHC: dihexosylceramide, LPA: lysophosphatidic acid; LPS: lysophosphatidylserine; LPE: lysophosphatidylethanolamine; LPI: lysophosphatidylinositol; PL: phospholipid; SL: sphingolipid; TG: triglycerol; THC: trihexosylceramide.
4. DISCUSSION AND CONCLUSION
Here we report on the fourth DPM2-CDG patient who presented with truncal hypotonia, hypertonicity, congenital heart defects, microcephaly, intellectual disability, and generalized muscle wasting and whose diagnosis was implicated by WES at 19-years of age. Further laboratory and clinical studies supported DPM2 deficiency diagnosis (Figure 3, Figure 5A), while glycosylation abnormalities were demonstrated by decreased expression of ICAM1 (Figure 5B), LAMP2 (Figure 5C, D), mildly abnormal TIEF (Figure 3) and glycomics analysis (Table 1).
Up to date, there have been 21 reported individuals with pathogenic variants in DPMS complex (12 DPM1-CDG, 3 DPM2-CDG, 6 DPM3-CDG). The most common clinical presenting signs were progressive microcephaly, hypotonia, developmental delay, elevated CK and seizures. A brief overview of the 21 patients’ characteristics is presented in Table 2.
Table 2.
Overview of reported patients with DPMS related CDG (DPM1, DPM2, DPM3-CDG)
| No. | PROBAND | Patient 1 | Patient 2 | Patient 3 | Patient 4 | Patient 5 | Patient 6 | Patient 7 | Patient 8 | Patient 9 | Patient 10 | Patient 11 | Patient 12 | Patient 13 | Patient 14 | Patient 15 | Patient 16 | Patient 17 | Patient 18 | Patient 19 | Patient 20 | Patient 21 |
|---|---|---|---|---|---|---|---|---|---|---|---|---|---|---|---|---|---|---|---|---|---|---|
| Publication | current | Kim et al, 2000 | Kim et al, 2000 | Imbach et al, 2000 | Imbach et al, 2000 | Garcia Silva et al, 2004 | Dancourt et al, 2006 | Dancourt et al, 2006 | Yang et al, 2013 | Bursle et al, 2016 | Medrano et al, 2019 | Medrano et al, 2019 | Medrano et al, 2019 | Barone et al, 2012 | Barone et al, 2012 | Barone et al, 2012 | Lefeber et al, 2009 | Van Der Berg et al, 2017 | Svahn et al, 2019 | Svahn et al, 2019 | Tol et al, 2019 | Fu et al, 2019 |
| Age*/Sex | 23yo/M | 3yo/M | 10mo/NA | 3y 4mo/M | 19 mo/F | 9yo/F | 14yo/B | 30mo/F | 9mo/M | 10yo/F | 25yo/F | 11yo/F | 8yo/F | 36mo† F | 16mo†/M | 9mo†/M | 27yo/F | 57yo/F | 26yo/M | 48yo/M | 10yo/F | 8yo/F |
| Gene | DPM2 | DPM1 | DPM1 | DPM1 | DPM1 | DPM1 | DPM1 | DPM1 | DPM1 | DPM1 | DPM1 | DPM1 | DPM1 | DPM2 | DPM2 | DPM2 | DPM3 | DPM3 | DPM3 | DPM3 | DPM3 | DPM3 |
| Genetic mutation | c.139C>T; c.173G>A | Homozygous c.274C>G; | c.274C>G; 20q13.13 13-BP DEL | c.274C>G; c.628delC | c.274C>G; c.628delC | Homozygous c.742T>C | Homozygous g.IVS4–5T>A | Homozygous g.IVS4–5T>A | Homozygous c.455 G>T | c.1A>C c.274C>G | Homozygous c.742T>C | Homozygous c.742T>C | c.742T>C; c.564-1G>A | c.4-1G>C c.68A>G | Homozygous c.68A>G | Homozygous c.68A>G | Homozygous c.254T>C | Homozygous c.131T>G | c.41T-C DEL 1q.22 | c.41T-C 1q.22 DEL | Homozygous c.254T>C | c.124C>G; c.254T>A |
| Facial Dysmorphism | − | − | + | + | + | + | − | − | − | + | + | + | + | + | + | + | − | − | − | − | − | − |
| Progressive microcephaly | + | + | + | + | + | + | + | + | + | + | + | − | + | + | + | + | − | − | − | − | − | − |
| Inverted nipples | − | + | − | − | − | + | − | − | − | − | − | − | − | − | − | − | − | − | − | − | − | − |
| Feeding difficulties | − | + | − | − | + | + | − | − | − | + | − | + | + | + | − | − | − | − | − | − | ||
| Developmental delay | + | +++ | + | +++ | +++ | ++ | +++ | + | + | ++ | + | + | + | +++ | +++ | +++ | − | − | − | − | − | + |
| Intellectual disability | + | NA | NA | NA | NA | ++ | ++ | NA | NA | + | + | + | + | NA | NA | NA | − | − | − | − | + | |
| Seizures | − | + | + | ++ | ++ | ++ | ++ | − | ++ | + | + | + | + | ++ | ++ | ++ | − | − | − | + | − | + |
| Liver involvement | − | − | − | ++ | ++ | − | − | + | − | − | − | + | + | ++ | − | − | − | − | − | − | − | |
| Neurological involvement | − | + | + | + | +++ | ++ | ++ | ++ | − | + | + | + | + | ++ | + | + | − | − | + | + | − | + |
| Muscle involvement | + | +++ | +++ | + | + | + | + | ++ | + | + | + | + | + | +++ | +++ | +++ | + | ++ | + | +++ | + | + |
| Coagulopathy | − | + | + | + | + | + | + | − | − | − | − | + | + | + | − | − | − | − | − | − | − | − |
| Cardiac involvement | + | − | − | − | − | − | − | − | − | − | − | − | − | + | − | + | +++ | + | − | |||
| Ophthalmologic involvement | + | +++ | +++ | − | + | + | ++ | + | − | − | + | + | + | + | − | − | − | − | − | − | − | − |
| Transaminases | − | + | − | ++ | + | − | − | − | − | − | − | − | − | + | − | − | + | − | − | − | + | − |
| CK | ++ | + | +++ | ++ | + | + | − | − | ++ | ++ | − | − | − | ++ | ++ | ++ | ++ | ++ | ++ | ++ | + | ++ |
| TIEF | Midly abnormal | increased disialo Tf, but very little, if any, asialo Tf | increased disialo Tf, little, if any, asialo Tf | CDG type I | CDG type I | CDG type I | CDG type I | CDG type I | CDG type I | Increased disialotransferrin | Increased asialo and disialo transferrin | Increased asialo and disialo transferrin | Increased asialo and disialo transferrin | increased disialotransferrin | NA | NA | First CDG type I, Repeat: mildly abnormal;increased disialo- but also trisialotransferrin | Normal | CDG type I | CDG type I | Increased disialotransferrin | NA |
age at the time of the publication; NA- not applicable; - normal/absent, +− mild, ++ moderate, +++ severe presentation/symptoms
deceased.
Our patient has several overlapping clinical features with other reported patients (Table 2). However, in comparison to the previously reported DPM2-CDG patients, our patient has a milder phenotype and is also the only adult DPM2-CDG patient described up to date. Additionally, he has congenital heart defects, which were previously not described in DPM2-CDG. Nevertheless, cardiac involvement has been reported in four out of six DPM3 patients (Table 2). Overall, cardiac complications are not uncommon in CDG and occur in about 20% of CDG patients. Congenital heart defects have been reported across different CDG subtypes affecting not only N-glycosylation disorders (e.g. PMM2-CDG, PGM1-CDG) but also dolichol synthesis (e.g. DK1-CDG) and GPI anchor synthesis disorders (e.g. PIGA-CDG) (Marques da Silva et al, 2017). Considering DPM2 is involved both in N-Glycosylation and GPI-anchor synthesis, congenital heart defects in our patient further corroborate the DPM2-CDG diagnosis.
We performed further molecular characterization of DPM2-CDG by introducing lipidomics analysis in the fibroblasts of our patient. The results revealed significant decreases in dihexosylceramide (DHC), N-acetylhexosaminyl-trihexosylceramide, lysophosphatidylinositol, lysophosphatidylserine and lysophosphatidic acid (LPA) (Figure 7 and 8) in the patient compared to healthy controls (n=8).
Shlyonsky et al. have reported that LPA leads to increased expression of genes encoding ICAM1; thus, decreased LPA in the patient also correlates with the decreased expression of ICAM1 (Shlyonsky et al., 2014). In addition, the receptors for LPA are a G-protein coupled receptors that play an influential role in mitogenic activity and developmental processes mediated by LPA (van Leeuwen et al., 2003 and Sheng et al., 2015). Short stature (10th centile) and low weight (<3rd centile) of the patient correlate with reduction in cellular growth-inducing properties of LPA.
Furthermore, DHC refers to ceramide containing two hydrophilic sugar moieties with lactosylceramide (LacCer) being the most abundant form of DHC (Kosinka et al., 2014). The decrease in DHC is notable because its production is necessary for generation of superoxide in a time- and concentration-dependent manner and superoxide is known to induce ICAM1 expression through nuclear factor kappa B (Bhunia et al., 1998). Thus, decreased DHC (LacCer) in DPM2 is in line with decreased expression of ICAM1 in the patient’s fibroblasts.
ICAM1 (Intracellular Adhesion Molecule 1) is a highly glycosylated protein which is used to assess in vitro glycosylation abnormalities. It has been suggested that the defects in the glycosylation machinery influence the ICAM1 protein expression, hence the downregulation of ICAM1 has been used as a universal biomarker for CDG (He et al, 2012). Since DPM2 is involved in an important step of N-glycosylation (Figure 1), we decided to investigate ICAM1 expression in patient’s fibroblasts.
In our study, we not only observed significantly reduced ICAM1 protein expression but also slightly decreased ICAM1 expression in DPM2 patient fibroblasts. Previously, lower ICAM1 protein expression in CDG was linked to abnormal glycosylation (He et al, 2012). However, it has been recently reported that ICAM1 expression is also downregulated in PGM1-CDG patients (Radenkovic et al, 2019).
Considering that the glycosylation abnormalities in the patient fibroblasts were additionally shown by the decreased LAMP2 expression (Figure 5), slightly abnormal TIEF (Figure 3) and abnormal glycomics results (Table 1), it is highly likely that both glycosylation and lipid abnormalities contribute to the decrease of ICAM1 expression in our patient.
These observations are crucial, as ICAM1 is widely used to confirm CDG diagnosis in vitro. In order to avoid incorrect diagnosis and further confirm glycosylation abnormalities in patients, additional glycosylation studies such as LAMP2 western blotting or glycomics analysis are highly recommended.
LAMP2 (Lysosomal Associated Membrane Protein 2) is another highly glycosylated protein whose role has been implicated in autophagy and lysosomal biogenesis (Eskelinen et al, 2002; Eskelinen, 2006). It has recently emerged as a CDG biomarker, as it was demonstrated that glycosylation defects can affect its expression and molecular weight (Potelle et al, 2016; Morelle et al, 2017). The clear role of LAMP2 protein, however, has so far not been established. Therefore, it is possible that not only glycosylation, but other factors are responsible for the downregulation of LAMP2 in our patient’s fibroblasts. Specifically, ER stress has been linked to autophagy (Nakashima et al, 2019). Since the DPMS complex is located in ER membrane, it is possible that the ER stress resulting from DPMS instability could contribute to the downregulation of LAMP2 in DPM2-CDG.
Finally, DPM2-CDG was previously described as lethal muscular dystrophy syndrome and thus might be underreported. We hence recommend DPM2-CDG should also be considered in adult patients with hypotonia, progressive muscle weakness, muscle wasting, etc. whose microarray and POLG results turn out normal. In this regard, WES, TIEF and other laboratory investigations could be crucial in order to correctly diagnose the patient.
ACKNOWLEDGEMENTS
We sincerely thank the patient and his family.
This work was funded by the grant titled Frontiers in Congenital Disorders of Glycosylation (1U54NS115198-01) from the National Institute of Neurological Diseases and Stroke (NINDS) and the National Center for Advancing Translational Sciences (NCATS), and the Rare Disorders Clinical Research Network (RDCRN), at the National Institute of Health.
Footnotes
Publisher's Disclaimer: This is a PDF file of an unedited manuscript that has been accepted for publication. As a service to our customers we are providing this early version of the manuscript. The manuscript will undergo copyediting, typesetting, and review of the resulting proof before it is published in its final form. Please note that during the production process errors may be discovered which could affect the content, and all legal disclaimers that apply to the journal pertain.
CONFLICTS OF INTEREST
Authors have no conflicts of interest to declare.
REFERENCES
- Balakrishnan B, Verheijen J, Lupo A, Raymond K, Turgeon C, Yang Y, Carter KL,Whitehead KJ, Kozicz T, Morava E, Lai K. A novel phosphoglucomutase deficient mouse model reveals aberrant glycosylation and early embryonic lethality.J. Inherit. Metab. Dis 2019. 42 (5), 998–1007. [DOI] [PMC free article] [PubMed] [Google Scholar]
- Barone R, Aiello C, Race V et al. : DPM2-CDG: A Muscular Dystrophy–Dystroglycanopathy Syndrome with Severe Epilepsy. Ann Neurol 2012; 72: 550–558. [DOI] [PubMed] [Google Scholar]
- Bhunia AK, Arai T, Bulkley G, Chatterjee S. Lactosylceramide mediates tumor necrosis factor-alpha-induced intercellular adhesion molecule-1 (ICAM-1) expression and the adhesion of neutrophil in human umbilical vein endothelial cells. J Biol Chem. 1998;273(51):34349–34357. [DOI] [PubMed] [Google Scholar]
- Dancourt J et al. A new intronic mutation in the DPM1 gene is associated with a milder form of CDG Ie in two French siblings. Pediat. Res 2006, 59: 835–839. [DOI] [PubMed] [Google Scholar]
- Eskelinen EL et al. Role of LAMP-2 in lysosome biogenesis and autophagy., 2002. 13(9), 3355–3368. [DOI] [PMC free article] [PubMed] [Google Scholar]
- Eskelinen E-L Roles of LAMP-1 and LAMP-2 in lysosome biogenesis and autophagy. Molecular Aspects of Medicine, 2006. 27(5-6), 495–502. [DOI] [PubMed] [Google Scholar]
- Ferreira CR, Xia ZJ, Clement A, et al. A recurrent de novo heterozygous COG4 substitution leads to Saul-Wilson syndrome,disrupted vesicular trafficking, and altered proteoglycan glycosylation. Am J Hum Genet. 2018. 103(4):553–567 [DOI] [PMC free article] [PubMed] [Google Scholar]
- Fu J, Ma M, Song J, Pang M, Yang L, Li G, Zhang J. Novel mutations in DPM3 cause dystroglycanopathy with central nervous system involvement. Clin Genet. 2019. December;96(6):590–591 [DOI] [PubMed] [Google Scholar]
- Garcia-Silva MT et al. Congenital disorder of glycosylation (CDG) type Ie: a new patient. J. Inherit. Metab. Dis 2004. 27: 591–600, [DOI] [PubMed] [Google Scholar]
- He P, Ng BG, Losfeld ME, Zhu W, Freeze HH.. Identification of intercellular cell adhesion molecule 1 (ICAM-1) as a hypoglycosylation marker in congenital disorders of glycosylation cells. J Biol Chem. 2012. 287:18210–18217. [DOI] [PMC free article] [PubMed] [Google Scholar]
- Imbach T et al. Deficiency of dolichol-phosphate-mannose synthase-1 causes congenital disorder of glycosylation type Ie. J. Clin. Invest 2000; 105: 233–239 [DOI] [PMC free article] [PubMed] [Google Scholar]
- Kim S et al. Dolichol phosphate mannose synthase (DPM1) mutations define congenital disorder of glycosylation Ie (CDG-Ie). J. Clin. Invest 2000; 105: 191–198. [DOI] [PMC free article] [PubMed] [Google Scholar]
- Kosinska MK, Liebisch G, Lochnit G, Wilhelm J, Klein H, Kaesser U, Lasczkowski G, Rickert M, Schmitz G, Steinmeyer J. Sphingolipids in human synovial fluid—a lipidomic study. PLoS One. 2014. March 19;9(3):e91769. doi: 10.1371/journal.pone.0091769. PMID: 24646942; PMCID: PMC3960152. [DOI] [PMC free article] [PubMed] [Google Scholar]
- Lawson C, Wolf S (2009). ICAM-1 signaling in endothelial cells. Pharmacol. Rep 61 (1), 22–32. doi: 10.1016/S1734-1140(09)70004-0 [DOI] [PubMed] [Google Scholar]
- Lee JW, Mok HJ, Lee DY et al. UPLC-QqQ/MS-Based Lipidomics Approach To Characterize Lipid Alterations in Inflammatory Macrophages. J Proteome Res. 2017; 16:1460–1469. [DOI] [PubMed] [Google Scholar]
- Lefeber DJ, et al. Deficiency of Dol-P-Man synthase subunit DPM3 bridges the congenital disorders of glycosylation with the dystroglycanopathies. Am. J. Hum. Genet 85: 76–86, 2009. [DOI] [PMC free article] [PubMed] [Google Scholar]
- Maeda Y and Kinoshita T. Dolichol-phosphate mannose synthase: Structure, function and regulation Maeda, Y., & Kinoshita, T. (2008). Dolichol-phosphate mannose synthase: Structure, function and regulation. Biochimica Et Biophysica Acta (BBA) - General Subjects, 1780(6), 861– [DOI] [PubMed] [Google Scholar]
- Marques da Silva et al. Cardiac complications of congenital disorders of glycosylation (CDG): a systematic review of the literature., 40(5), 657–672. [DOI] [PubMed] [Google Scholar]
- Medrano C, Vega A, Navarrete R, Ecay MJ, Calvo R, Pascual SI, Ruiz-Pons M, Toledo L, García-Jiménez I, Arroyo I, Campo A, Couce ML, Domingo-Jiménez MR, García-Silva MT, González-Gutiérrez-Solana L, Hierro L, Martín-Hernández E, Martínez-Pardo M, Roldán S, Tomás M, Cabrera JC, Mártinez-Bugallo F, Martín-Viota L, Vitoria-Miñana I, Lefeber DJ, Girós ML, Serrano Gimare M, Ugarte M, Pérez B, Pérez-Cerdá C. Clinical and molecular diagnosis of non-phosphomannomutase 2 N-linked congenital disorders of glycosylation in Spain. Clin Genet. 2019. May;95(5):615–626. [DOI] [PubMed] [Google Scholar]
- Mitchell CJ, Kim MS, Na CH, Pandey A. PyQuant: A Versatile Framework for Analysis of Quantitative Mass Spectrometry Data. Mol Cell Proteomics. 2016; 15:2829–2838. [DOI] [PMC free article] [PubMed] [Google Scholar]
- Morelle W, Potelle S, Witters P, Wong S, Climer L, Lupashin V, et al. Galactose Supplementation in Patients With TMEM165-CDG Rescues the Glycosylation Defects. (2017). The Journal of Clinical Endocrinology & Metabolism, 102(4), 1375–1386. [DOI] [PMC free article] [PubMed] [Google Scholar]
- Nakashima et al. Endoplasmic reticulum stress disrupts lysosomal homeostasis and induces blockade of autophagic flux in human trophoblasts., 2019. Sci Rep 9(1), 11466. [DOI] [PMC free article] [PubMed] [Google Scholar]
- Potelle S, Morelle W, Dulary E, Duvet S, Vicogne D, Spriet C, Krzewinski-Recchi M-A, Morsomme P, Jaeken J, Matthijs G, De Bettignies G, Foulquier F. Glycosylation abnormalities in Gdt1p/TMEM165 deficient cells result from a defect in Golgi manganese homeostasis. Hum Mol Genet. (2016) ;25(8): 1489–1500 [DOI] [PubMed] [Google Scholar]
- Radenkovic S, Bird MJ, Emmerzaal TL, Wong SY, Felgueira C, Stiers KM, et al. The Metabolic Map into the Pathomechanism and Treatment of PGM1-CDG. (2019). American Journal of Human Genetics, 104(5), 835–846. [DOI] [PMC free article] [PubMed] [Google Scholar]
- Sheng X, Yung YC, Chen A, Chun J. Lysophosphatidic acid signalling in development. Development. 2015;142(8):1390–1395. [DOI] [PMC free article] [PubMed] [Google Scholar]
- Shlyonsky V, Naeije R, & Mies F (2014). Possible Role of Lysophosphatidic Acid in Rat Model of Hypoxic Pulmonary Vascular Remodeling. Pulmonary Circulation, 471–481. [DOI] [PMC free article] [PubMed] [Google Scholar]
- Spandidos A et al. A comprehensive collection of experimentally validated primers for Polymerase Chain Reaction quantitation of murine transcript abundance. (2008). BMC Genomics 9, 633. [DOI] [PMC free article] [PubMed] [Google Scholar]
- Svahn J et al. Dilated cardiomyopathy and limb-girdle muscular dystrophy-dystroglycanopathy due to novel pathogenic variants in the DPM3 gene. Neuromusc. Disord 29: 497–502, 2019. [DOI] [PubMed] [Google Scholar]
- van Tol W, Michelakakis H, Georgiadou E, van den Bergh P, Moraitou M, Papadimas GK, Papadopoulos C, Huijben K, Alsady M, Willemsen MA, Lefeber DJ. Toward understanding tissue-specific symptoms in dolichol-phosphate-mannose synthesis disorders; insight from DPM3-CDG. J Inherit Metab Dis. 201 [DOI] [PubMed] [Google Scholar]
- van Eijk HG1 and van Noort WL: the analysis of human serum transferrins with the PhastSystem: quantitation of microheterogeneity. Electrophoresis 1992. 13: 354–358. [DOI] [PubMed] [Google Scholar]
- Van den Bergh PYK et al. A homozygous DPM3 mutation in a patient with alpha-dystroglycan-related limb girdle muscular dystrophy. Neuromusc. Disord 27: 1043–1046, 2017. [DOI] [PubMed] [Google Scholar]
- van Leeuwen FN, Giepmans BN, van Meeteren LA, Moolenaar WH. Lysophosphatidic acid: mitogen and motility factor. Biochem Soc Trans. 2003;31(Pt 6): 1209–1212. [DOI] [PubMed] [Google Scholar]
- Witkowska AM, Borawska MH (2004). Soluble intercellular adhesion molecule-1 (sICAM-1): an overview. Eur. Cytokine Netw 15 (2), 91–98. [PubMed] [Google Scholar]
- Yang AC et al. Congenital disorder of glycosylation due to DPM1mutations presenting with dystroglycanopathy-type congenital muscular dystrophy. Molec. Genet. Metab 2013; 110: 345–351. [DOI] [PMC free article] [PubMed] [Google Scholar]


