

Abstract
Background:
In the Medicare Advantage (MA) program, private plans receive capitated payments that are adjusted based on their enrollees’ number and type of clinical conditions. Plans have the ability to review charts to identify additional conditions that are not present in claims data, thereby increasing risk-adjusted payments. Recently the Government Accountability Office (GAO) released a report raising concerns about the use of these chart reviews as a potential tool for upcoding.
Objectives:
To measure the extent to which plans receive additional payments for chart reviews, and the variation in chart reviews across plans.
Research Design:
In this cross-sectional study we use 2015 MA Encounter data to calculate how many additional diagnoses codes were added for each enrollee using chart reviews. We then calculate how these additional diagnosis codes translate to additional reimbursements across plans.
Subjects:
14,021,692 beneficiaries enrolled in 510 MA contracts in 2015
Measures:
Individual and contract level hierarchical condition category codes, total plan reimbursement
Results:
Chart reviews were associated with a $2.3 billion increase in payments to plans, a 3.7 percent increase in Medicare spending to MA plans. Just 10% of plans accounted for 42% of the $2.3 billion in additional spending attributed to chart-review. Among these plans, the relative increase in risk score from chart review was 17.2%. For-profit plans engaged in chart reviews substantially more frequently than non-profit plans.
Conclusions:
Given the substantial and highly variable increase in payments attributable to chart review, further investigation of the validity of this practice and its implications for Medicare spending is needed.
Keywords: Medicare Advantage, risk adjustment, upcoding
Introduction
Over a third of all Medicare beneficiaries are now enrolled in a Medicare Advantage (MA) plan with that number only expected to grow over the next decade.1 MA differs from traditional Medicare in that plans are paid on a capitated basis by the Centers for Medicare and Medicaid Services to cover the needs of their enrollees each year. To reduce adverse selection, CMS risk-adjusts these capitated payments using hierarchical condition category (HCC) codes, chronic conditions reported by plans each year based on underlying enrollee diagnoses.2 While this risk-adjustment may have reduced some adverse selection,3 there is concern that plans may “upcode” or artificially inflate how sick their enrollees appear to maximize payment rates.4
In December 2019, the federal Government Accountability Office (GAO) released a report detailing the ability for MA plans to submit “chart reviews” to CMS with their patient encounter data which may add or delete diagnoses present on a patient’s records.5 The GAO found that 99.3% of these chart reviews added new diagnoses, raising concerns about the impact of these reviews on plan reimbursement.5 However, it is still not well understood if there is plan level variation in the use of chart reviews, and the plan characteristics that are associated with their use. In this brief, we expand on the GAO’s analysis and demonstrate detailed geographic and contract-level differences in the use of these reviews nationally.
Methods
Our primary source of data for this analysis was the 100% 2015 Medicare Advantage inpatient, outpatient, and carrier encounter files. The MA encounter files are newly released by CMS and contain two types of records: regular encounter claims, and chart review claims. While the data included in the regular claims included in the file are generated by the provider, chart review observations may be used by contracts to add or delete diagnoses for a given enrollee. In addition to the encounter data, we used the Master Beneficiary Summary file to identify enrollees’ contracts, as well as publicly available data from CMS on plan characteristics.
For each enrollee we compiled a list of ICD codes present in the encounter claims first without the use of chart reviews, and then with the inclusion of diagnoses from chart reviews. Using CMS’s HCC algorithm, we then calculated for each enrollee what their observed HCC score would have been including those diagnoses added and removed by chart reviews, and without the inclusion of any chart reviews. We calculated at the enrollee level the average and percent difference in HCC score attributable to chart reviews alone (by subtracting the HCC score exclusive of chart reviews, from the total HCC score including chart reviews). We then aggregated HCC scores to the contract level.
MA payers submit bids to CMS in the form of contracts. Each contract can include one or more plans that include different benefit packages. We therefore conducted our analyses at the contract level as that is the level at which risk adjusted payments are calculated. Using publicly available reimbursement data from CMS6, we calculated what each contract’s capitated payment rate would be with and without chart reviews and calculated how much additional reimbursement each contract received with the inclusion of chart reviews.
We first calculate the percent change in HCC score and classify contracts into enrollment weighed quintiles. We then compare the percent change in HCC score across different contract characteristics adjusting for each other characteristic using a standard ordinary least squares (OLS) linear model with robust standard errors. The variables we include in the models have been used to describe MA contracts in prior literature.7,8 We also compared geographic differences in chart reviews, identified the contracts that engaged in chart reviews the most frequently, and compared differences in characteristics between contracts that engaged in chart reviews and those that did not. All analysis was conducted in Stata 16.
Results
Our analysis included 14,021,692 beneficiaries enrolled in 510 MA contracts in 2015. In Table 1 we present compare contract characterizes across enrollee weighed quintiles in percent change in HCC score attributable to chart reviews. Of all enrollees in Medicare Advantage, 4.5% had a change in HCC scores as a result of chart reviews. Across all contracts there was a 0.028 absolute or 4.1 percent change in mean HCC score attributable to chart reviews. Among contracts in the highest quintile of absolute change in HCC score, there was a mean increase of 0.085. Contracts in the highest quintile of relative change in HCC score with chart review averaged a 10.0 percent increase in HCC score. On average across contracts there was a $6,155,812 increase in total reimbursements and a $231.8 increase in per-capita reimbursements attributable to chart reviews. Among contracts in the highest quintile of total increase in contract reimbursement with chart review, there was an average increase of $15,669,842 in contract reimbursements attributable to chart reviews. In total, we estimate that across all contracts there was a $2,302,273,942 increase in total reimbursements nationally attributed to chart reviews alone.
Table 1:
Quintiles of Increased HCC Score and Payment Attributable to Chart Reviews
| % Change in HCC Score | ||||||
|---|---|---|---|---|---|---|
| Contract Characteristics | Quintile 1 (0.0 to 0.7%) | Quintile 2 (0.7% to 2.5%) | Quintile 3 (2.6% to 3.7%) | Quintile 4 (3.8% to 6.7%) | Quintile 5 (6.7% to 42.4%) | All Enrollees |
| n of Contracts | 158 | 95 | 50 | 97 | 97 | 510 |
| n on Enrollees | 3,247,707 | 2,404,310 | 2,789,250 | 2,864,388 | 2,716,037 | 14,021,692 |
| % of enrollees | 23.16 | 17.15 | 19.89 | 20.43 | 19.37 | 100% |
| % for profit | 60% | 70% | 78% | 75% | 85% | 72% |
| % Change in HCC Score (%) | ||||||
| Mean | 0.2 | 1.5 | 3.1 | 5.0 | 12.6 | 4.1 |
| Min | 0.0 | 0.7 | 2.6 | 3.8 | 6.7 | 0 |
| 25% Percentile | 0.0 | 1.0 | 2.8 | 4.4 | 8.0 | .43 |
| Median | 0.1 | 1.5 | 3.2 | 5.0 | 10.0 | 2.3 |
| 75% Percentile | 0.4 | 1.9 | 3.4 | 5.7 | 15.3 | 5.4 |
| Max | 0.7 | 2.5 | 3.8 | 6.7 | 42.4 | 42.4 |
| Absolute Change in HCC Score | ||||||
| Mean | 0.002 | 0.010 | 0.022 | 0.035 | 0.085 | 0.028 |
| Min | 0.000 | 0.004 | 0.009 | 0.016 | 0.026 | 0.000 |
| 25% Percentile | 0.000 | 0.006 | 0.017 | 0.029 | 0.050 | 0.003 |
| Median | 0.001 | 0.010 | 0.021 | 0.034 | 0.073 | 0.016 |
| 75% Percentile | 0.003 | 0.013 | 0.024 | 0.039 | 0.112 | 0.037 |
| Max | 0.013 | 0.028 | 0.048 | 0.069 | 0.250 | 0.250 |
| Total Change in Reimbursements ($) | ||||||
| Mean | 629,667 | 1,945,754 | 5,391,353 | 6,761,950 | 15,669,842 | 6,155,812 |
| Min | 0 | 0 | 8,213 | 9,140 | 14,502 | 0 |
| 25% Percentile | 4,553 | 203,167 | 294,687 | 457,621 | 2,049,842 | 124,116 |
| Median | 35,990 | 796,796 | 1,585,148 | 2,526,931 | 9,544,612 | 11,62,545 |
| 75% Percentile | 216,315 | 2,839,595 | 6,060,950 | 7,443,862 | 22,078,226 | 6,202,971 |
| Max | 18,028,994 | 11,978,731 | 55,885,716 | 34,119,664 | 95,789,072 | 95,789,072 |
| Percent Change in Reimbursements (%) | ||||||
| Mean | 0.2 | 1.2 | 2.6 | 4.0 | 10.0 | 3.7 |
| Min | 0.0 | 0.4 | 1.6 | 1.9 | 3.7 | 0.0 |
| 25% Percentile | 0.0 | 0.7 | 2.1 | 3.3 | 6.2 | 0.5 |
| Median | 0.2 | 1.1 | 2.5 | 3.8 | 9.2 | 2.5 |
| 75% Percentile | 0.4 | 1.5 | 3.0 | 4.4 | 12.8 | 4.6 |
| Max | 1.5 | 2.5 | 4.0 | 8.6 | 28.6 | 28.6 |
| Per Capita Change in Reimbursements ($) | ||||||
| Mean | 14.9 | 84.2 | 172.6 | 268.4 | 639.0 | 231.8 |
| Min | 0.0 | 24.1 | 93.2 | 74.6 | 99.7 | 0.0 |
| 25% Percentile | 1.6 | 50.3 | 131.9 | 214.7 | 346.5 | 34.7 |
| Median | 9.2 | 75.4 | 165.3 | 254.9 | 541.0 | 140.1 |
| 75% Percentile | 26.1 | 110.9 | 203.0 | 308.6 | 843.6 | 295.0 |
| Max | 80.2 | 216.2 | 311.8 | 739.6 | 1,592.6 | 1592.6 |
Notes: Results display contract level outcomes associated with chart reviews. Using the MA encounter data, HCC scores were calculated for each enrollee first with the inclusion of codes added via chart reviews, and then excluding those codes. The HCC scores were then aggregated to the contract level and we calculated the % increase in HCC codes from baseline attributable to chart reviews alone. These % increases in HCC scores were then divided into enrollee weighed quintiles. Each column is a quintile, and each row are the contract level measures from within that quintile.
In Figure 1 we show the increase in reimbursements attributable to chart reviews by decile of HCC score increase. Contracts in the top decile accounted for 42% of the total national increase in reimbursement attributable to chart review and had double the mean increase in reimbursements as the contracts in the 9h decile.
Figure 1:
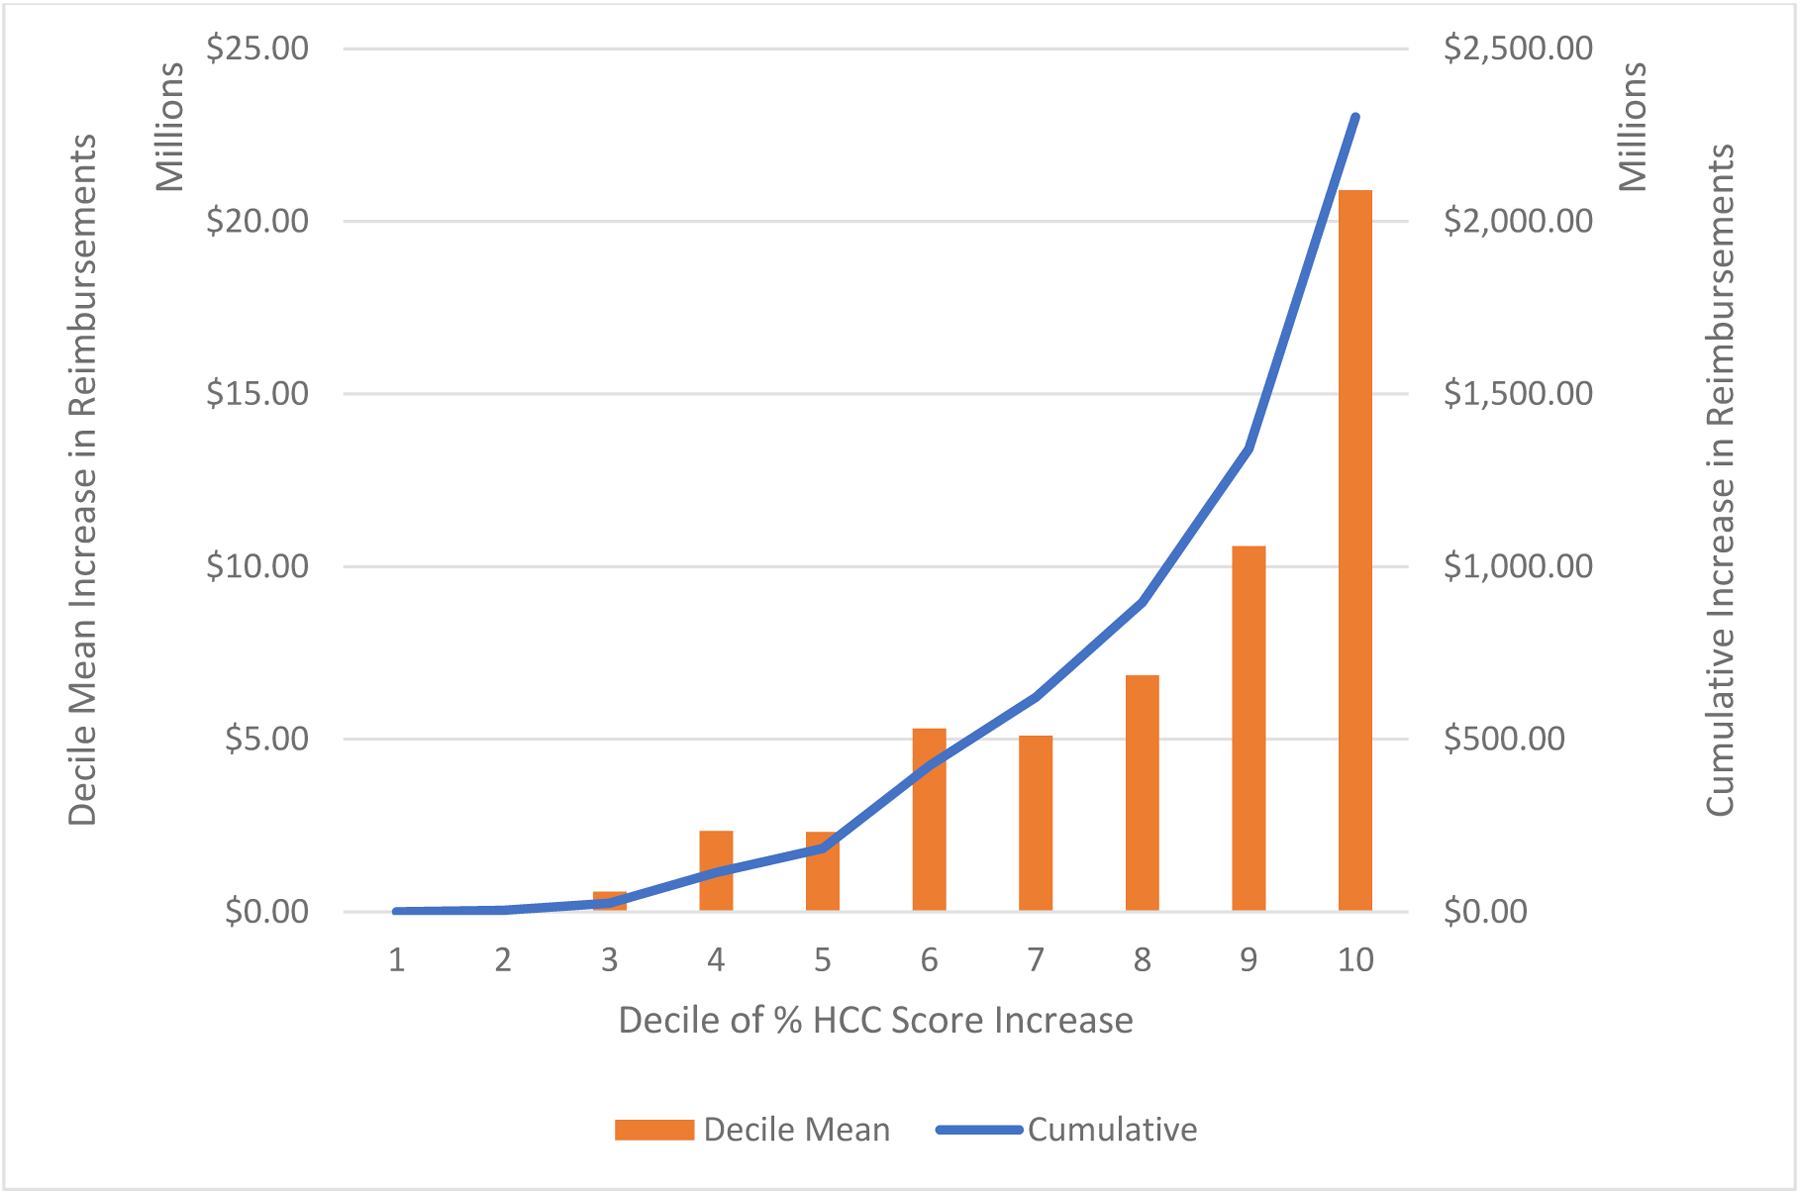
Increase in Reimbursements by Decile of Increased HCC Score
Notes: The x-axis is deciles of percent increased HCC score at the contract level. The left y-axis and bars represent the average increase in contract reimbursements within each decile in millions of dollars. The right y-axis and line represent the cumulative increased reimbursements attributable to chart reviews with each subsequent decile in millions of dollars.
In Table 2 we present adjusted percent changes in HCC scores by contract characteristics. Contracts with higher premiums and fewer dually eligible enrollees, and PPOs all tended to have significantly lower percent changes in HCC scores than other contracts.
Table 2:
Relative Change in HCC Score Attributable to Chart Reviews, by Plan Characteristics
| Variable | Adjusted % | 95% CI | p-value | |
|---|---|---|---|---|
| National Status | ||||
| Contract Operates in One State | 5.3 | 3.9 | 6.6 | 0.27 |
| Contract Operates in Multiple States | 4.3 | 3.7 | 5 | Ref |
| Tax Status | ||||
| For-profit | 4.8 | 4.1 | 5.6 | 0.44 |
| Not-for-profit | 3.9 | 2.6 | 5.1 | Ref |
| $10 increase in premium | −1.0 | −2.1 | −0.0 | 0.049 |
| 1% increase in rural enrollees | −1.2 | −4.0 | 1.8 | 0.456 |
| 1% increase in dual enrollees | −3.3 | −5.5 | −1.1 | 0.004 |
| Plan Type | ||||
| Health Maintenance Organization | 5.0 | 4.3 | 5.7 | Ref |
| Preferred Provider Organization | 3.4 | 1.9 | 4.9 | 0.05 |
| Other | 1.8 | −2.2 | 5.8 | 0.072 |
| Overall Star Rating | ||||
| 2.5 stars | 2.6 | −0.2 | 5.4 | Ref |
| 3 stars | 6.1 | 4.2 | 8.0 | 0.627 |
| 3.5 stars | 6.6 | 5.4 | 7.9 | 0.001 |
| 4 stars | 5.0 | 3.6 | 6.3 | 0.000 |
| 4.5 stars | 4.0 | 2.3 | 5.7 | 0.003 |
| 5 stars | 2.6 | −1.2 | 6.4 | 0.083 |
| Unrated | 2.1 | 0.7 | 3.5 | 0.791 |
| Census Region | ||||
| Northeast | 4.9 | 3.6 | 6.2 | Ref |
| Midwest | 4.6 | 3.1 | 6.0 | 0.769 |
| South | 5.1 | 4.0 | 6.4 | 0.789 |
| West | 3.5 | 2.3 | 4.7 | 0.159 |
Notes: National status is defined by if the contract operates in only one state vs in multiple states as indicated in the contract’s service area files. Tax status, plan premium, plan type, and overall star ratings are identified from publicly reported CMS landscape files. The contract level premium is calculated as the enrollment weighed average of all plan premiums within a given contract. Rurality is based on the percent of the contract’s enrollees that live in a rural county. The Census Region variable is based on where the majority of a contract’s enrollee’s lived in 2015 based on the Master Beneficiary Summary File. The adjusted column and associated confidence intervals are the adjusted marginal means calculated from a linear regression model with an outcome of % change in HCC score and all of the variables in the table included as covariates. P-values are from the OLS linear regression model. The model R2 was 0.15.
In Table 3 we present the characteristics of contracts that performed no chart reviews to the contracts that received the greatest increase in HCC scores attributable to chart reviews. The 24 contracts that did not perform any chart reviews were more often operating nationally, and were more often non-profit than contracts that performed the most chart reviews. 92% of contracts in the highest quintile of chart reviews were for-profit compared to 61.1% of the contracts that did not engage in any chart reviews. Contracts that did not perform chart review also tended to have more duals and rural enrollees.
Table 3:
Characteristics of contracts by how much chart reviews affected their HCC Scores
| No Chart Reviews | 2nd to 4th Quintile of Chart Reviews | 5th Quintile of Chart Reviews | p-value of 5th quintile vs 1–4th quintiles | |
|---|---|---|---|---|
| n | 24 | 319 | 102 | |
| National Status, n(%) | 0.36 | |||
| Single States | 40.5% | 59.7% | 65.6% | |
| Multiple States | 59.5% | 32.9% | 34.3% | |
| Tax Status | 0.006 | |||
| For-profit | 61.1% | 72.6% | 92.0% | |
| Not-for-profit | 38.9% | 27.4% | 8.0% | |
| Mean Premium, $ | 33 | 79 | 65 | 0.19 |
| % Rural | 32.4 | 20.0 | 18.5 | 0.43 |
| % Dual | 57.9 | 30.2 | 26.7 | 0.16 |
| Plan Type, n(%) | 0.47 | |||
| HMO | 94.4% | 74.3% | 73.6% | |
| PPO | 5.6% | 23.9% | 25.3% | |
| Other | 0.0% | 1.7% | 1.1% | |
| Overall Star Rating, n (%) | <0.001 | |||
| 2.5 | 0.0% | 4.4% | 0.0% | |
| 3 | 0.0% | 10.7% | 3.3% | |
| 3.5 | 4.8% | 20.0% | 20.7% | |
| 4 | 2.4% | 20.4% | 21.7% | |
| 4.5 | 0.0% | 15.2% | 10.9% | |
| 5 | 0.0% | 3.3% | 0.0% | |
| Unrated | 92.9% | 25.6% | 8.7% | |
| Census Region, n (%) | 0.037 | |||
| Northeast | 26.7% | 24.7% | 18.7% | |
| Midwest | 26.7% | 22.5% | 16.0% | |
| South | 40.0% | 27.3% | 33.3% | |
| West | 6.7% | 25.5% | 32.0% |
Notes: This exhibit displays the characteristics of contracts that either do not perform chart reviews, fall within the average increase in HCC score with chart reviews (the 2nd-4th quintiles of percent HCC Increase) and the contracts that increased their HCC scores the most from chart reviews (the 5th quintile). P-values are from chi-square tests of statistical significance comparing the values in the 5th quintile with that of all other quintiles.
In Table 4 we present the top 20 companies by their average percent increase in HCC scores attributable to chart reviews. The percent increases in HCC scores from these contracts ranged from 6.8 to 37.6%. The company level increases in total reimbursements attributable to chart reviews ranged from $385,605 to $481,245,082.
Table 4:
Parent companies that received highest % increase in HCC Score
| Parent Company Name | Average Percent Increase in HCC Attributable to Chart Reviews | Per Capita Reimbursement Increase Attributable to Chart Reviews | Total Reimbursement Increase Attributable to Chart Reviews | State of Operation |
|---|---|---|---|---|
| Liberty Health Advantage, Inc. | 37.6 | $1,197.54 | $5,869,130 | New York |
| Triple-S Management Corporation | 34.4 | $463.06 | $42,988,871 | Puerto Rico |
| Senior Whole Health | 20.8 | $1,204.00 | $25,281,976 | Massachusetts |
| AvMed, Inc. | 20.2 | $809.49 | $33,490,936 | Florida |
| Health First, Inc. | 19.7 | $1,228.12 | $481,245,082 | New York |
| Universal American Corp. | 16.7 | $678.03 | $41,659,520 | Multiple |
| Aetna Inc. | 16.3 | $1,118.49 | $31,081,928 | Multiple |
| UAB Health System | 14.6 | $917.79 | $123,123,061 | Alabama |
| Medical Card System, Inc. | 14.5 | $219.38 | $406,319 | Puerto Rico |
| Care Wisconsin First, Inc. | 11.3 | $395.64 | $70,771,590 | Wisconsin |
| WellCare Health Plans, Inc. | 10.8 | $412.92 | $12,200,237 | Multiple |
| Cambia Health Solutions, Inc. | 10.8 | $872.81 | $95,362,166 | Multiple |
| Health Net, Inc. | 10.5 | $572.65 | $700,528 | Multiple |
| Constellation Health, LLC. | 10.3 | $133.77 | $120,295,424 | Puerto Rico |
| Care1st Health Plan | 8.7 | $308.28 | $22,840,752 | Arizona |
| MVP Health Care, Inc. | 8.6 | $728.74 | $385,605 | Multiple |
| InnovaCare Inc. | 8.0 | $117.14 | $22,078,226 | Puerto Rico |
| Catholic Health Care System | 8.0 | $243.75 | $20,866,603 | Multiple |
| BlueCross BlueShield of Tennessee | 7.0 | $274.04 | $5,489,050 | Tennessee |
| Presbyterian Healthcare Services | 6.8 | $479.12 | $14,877,995 | New Mexico |
Notes: This exhibit displays the 20 Medicare Advantage parent organizations that had the highest percent increase in contract level HCC scores across their owned contracts. If a parent company owns multiple contracts, the percent represents the enrollment weighed average percent increase from across each of their contracts.
In Supplemental Digital Content 1 we present a map of % increase in HCC attributable to chart reviews by enrollee residential state. Puerto Rico had the largest increase (14.9%) followed by Delaware (13.1%), Nebraska (9.2%), Kansas (8.8%), and Iowa (8.8%). The states with the lowest percent increases were Montana (0.7%), North Dakota (0.7%), Michigan (0.7%), South Carolina (1.2%), and Rhode Island (1.5%).
Conclusions
We find that in 2015, increases in HCC scores attributable to chart reviews alone were associated with $2.3 billion increase in payments to MA contracts. There was substantial variation nationally and across contracts in the use of chart reviews with 10% of contracts accounting for 42% of increased reimbursements. Lower rated, lower premium, and for-profit contracts tended to have the largest increases in HCC scores attributable to reviews alone.
Our findings align with that of the recent GAO report,5 and build on them in several key ways. We find that there is substantial variation in these practices nationally and across contracts of different characteristics and that the majority of the increased payments are attributable to the top quintile of contracts. We also provide an indication as to which contracts have used these chart reviews the most.
Our finding that for-profit contracts performed chart reviews more frequently may be driven by an increased incentive for maximizing revenue in these entities. Contracts with lower premiums typically submit lower bids to CMS during the rating setting process. Increased coding of risk may help these contracts to generate more revenue. Smaller MA plans may not have ability to invest in creating that initial infrastructure, especially if they have a smaller market share or their enrollees are distributed across a wider network of physicians.
There was substantial state variation in the use of chart reviews. The states with the greatest increases in coding are those which tend to have higher MA enrollment, while states that had the smallest increases tended to have minimal MA penetration. It may be more cost effective for contracts to perform chart reviews in areas where larger numbers of enrollees could be impacted.
The prevalence of these chart reviews may be of concern to policymakers. While there are a number of legitimate reasons why a contract may add more diagnoses codes for their enrollees, there is substantial variation in how often these reviews are used. Contracts that have a greater ability to conduct chart reviews may benefit financially over those that do not have the resources to report this information. Further, this method of adding more diagnoses codes that are found in charts but not claims would not result in additional payments for Traditional Medicare, which may create further imbalances in payments between these programs. When a service provider submits claims, they likely included all of the conditions that affected the care the patient received. It is unclear if MA plans should be paid more for those conditions that did not affect care enough to be recorded in the initial record.
It also cannot be ruled out that these chart reviews are a method by which upcoding may occur. It is well understood that MA contracts inflate the number of coded diagnoses among their enrolled population,9–11 so much so that CMS tries to account for upcoding in annual payment rate setting. While assessing the validity of added codes is outside the scope of this study, the amount of payment tied to chart reviews appears to be substantial. Notably, the contracts that used chart reviews most frequently tended to be of poorer quality and have lower premiums. As lower rated contracts don’t receive payment bonuses from CMS, there may be an increased incentive for these contracts to maximize their payments through other means.
Moving forward, it is important for CMS and policymakers to undertake more oversight over the use of chart reviews in MA. While some additional diagnostic coding may be valuable, with the amount of reimbursement involved it is vital to ensure the validity and appropriateness of chart-reviewed data. Further, contracts that lack the resources to conduct these reviews may be at a structural disadvantage relative to other contracts in their maximizing risk-adjusted payments.
Our study has several limitations. First, it is not likely all MA contracts reported claims to the encounter data accurately and completely. We cannot determine if all chart review observations are included in these data; however, HCC scores from the encounter data will be incorporated into future risk adjustment calculation. Therefore, the files still provide valuable insight into how reimbursement may be affected. Second, as we do not have access to detailed medical records or internal contract data, we cannot determine if diagnoses added by chart reviews are valid. Some proportion of the diagnosis codes added by chart reviews are a legitimate attempt to address adverse selection through more accurate coding. Third, we can only calculate an approximation of each enrollee’s and contract’s HCC score. We only have access to the diagnoses present in the encounter files and cannot ascertain what other diagnoses may be separately reported by contracts to CMS. Additionally, the HCC score has been demonstrated to underpredict spending among high-cost enrollees, however, the HCCs are what CMS uses to derive risk-adjusted payment rates to MA plans.12
Chart reviews in Medicare Advantage encounter data provide the opportunity for contracts to substantially increase their reimbursements. We found that chart reviews increased the mean risk-score by 3.7%, translating to an increase of $2.3 billion risk-adjusted payments nationally. The payments were highly variable with the 10% of contracts with the greatest increase in risk scores from chart-review accounting for 42% of increased payments nationally. Given the substantial and highly variable increase in payments attributable to chart review, further investigation of the validity of this practice and its implications for Medicare spending is needed.
Supplementary Material
Funding:
This work is funded by the NIH NIA P01AG027296-11.
Footnotes
Conflicts of Interest: The authors have no conflicts of interest to report.
References
- 1.Neuman P, Jacobson GA. Medicare Advantage Checkup. N Engl J Med. 2018. November 29;379(22):2163–72. [DOI] [PubMed] [Google Scholar]
- 2.Brown J, Duggan M, Kuziemko I, Woolston W. How Does Risk Selection Respond to Risk Adjustment? New Evidence from the Medicare Advantage Program. Am Econ Rev. 2014. October;104(10):3335–64. [DOI] [PubMed] [Google Scholar]
- 3.Newhouse JP, McGuire TG. How Successful Is Medicare Advantage? Milbank Q. 2014. June 1;92(2):351–94. [DOI] [PMC free article] [PubMed] [Google Scholar]
- 4.Geruso M, Layton T. Upcoding: Evidence from Medicare on Squishy Risk Adjustment. J Polit Econ. 2020. March 1;128(3):984–1026. [DOI] [PMC free article] [PubMed] [Google Scholar]
- 5.GAO. Billions in Estimated Medicare Advantage Payments From Chart Reviews Raise Concerns [Internet]. 2019. Available from: https://oig.hhs.gov/oei/reports/oei-03-17-00470.pdf
- 6.Centers for Medicare and Medicaid Services. Medicare Advantage Ratebooks and Supporting Data [Internet]. [cited 2020 May 13]. Available from: https://www.cms.gov/Medicare/Health-Plans/MedicareAdvtgSpecRateStats/Ratebooks-and-Supporting-Data
- 7.Welch WP, Sen AP, Bindman AB. Concentration of Physician Services Across Insurers and Effects on Quality: Early Evidence From Medicare Advantage. Med Care. 2019. October;57(10):795–800. [DOI] [PubMed] [Google Scholar]
- 8.Meyers DJ, Trivedi AN, Mor V, Rahman M. Comparison of the Quality of Hospitals That Admit Medicare Advantage Patients vs Traditional Medicare Patients. JAMA Netw Open. 2020. January 3;3(1):e1919310–e1919310. [DOI] [PMC free article] [PubMed] [Google Scholar]
- 9.Geruso M, Layton T. Upcoding: Evidence from Medicare on Squishy Risk Adjustment [Internet]. National Bureau of Economic Research; 2018. April [cited 2019 Aug 16]. Report No.: 21222. Available from: http://www.nber.org/papers/w21222 [Google Scholar]
- 10.Jacobs PD, Kronick R. Getting What We Pay For: How Do Risk-Based Payments to Medicare Advantage Plans Compare with Alternative Measures of Beneficiary Health Risk? [Internet]. Health Services Research. 2018. [cited 2019 Jul 1]. Available from: https://onlinelibrary.wiley.com/doi/abs/10.1111/1475-6773.12977 [DOI] [PMC free article] [PubMed]
- 11.Kronick R, Welch WP. Measuring Coding Intensity in the Medicare Advantage Program. Medicare Medicaid Res Rev [Internet]. 2014. July 17 [cited 2019 Aug 16];4(2). Available from: https://www.ncbi.nlm.nih.gov/pmc/articles/PMC4109819/ [DOI] [PMC free article] [PubMed] [Google Scholar]
- 12.Wagner TH, Upadhyay A, Cowgill E, Stefos T, Moran E, Asch SM, et al. Risk Adjustment Tools for Learning Health Systems: A Comparison of DxCG and CMS-HCC V21. Health Serv Res. 2016;51(5):2002–19. [DOI] [PMC free article] [PubMed] [Google Scholar]
Associated Data
This section collects any data citations, data availability statements, or supplementary materials included in this article.