

Abstract
Background & Aims:
There are currently no approved treatments for cancer cachexia. One of the main barriers to developing a treatment for this indication is the lack of consensus on clinically important tools for assessing functional impairment in this setting. This issue is of critical importance because functional improvement is likely to be required for approval by regulatory agencies. This cross-sectional study aimed to evaluate various functional performance measures and establish their association with body composition, energy expenditure, biomarkers, and patient-reported quality of life (QOL).
Methods:
Physical function, body composition, energy expenditure, cytokines, testosterone, and patient-reported QOL were compared between men with solid tumors with cachexia (CAC; N=48), without cachexia (CNC; N=48), and weight-stable patients without cancer (CON; N=37). Receiver Operator Characteristic curves and multivariate regression were performed to identify functional impairment cut-points and predictors of physical function, respectively.
Results:
Patients with CAC displayed lower total lean and appendicular lean mass, stair climb power (SCP), upper body strength, and bioavailable testosterone, and displayed higher energy expenditure than CNC or CON (p≤0.03); CAC showed lower handgrip, respiratory quotient, and appetite, and higher cytokines and fatigue than CON (p≤0.032). A cut-point of 336 Watts for SCP provided 78% sensitivity and 77% specificity for classification of CAC (p=0.001); SCP also performed better than other measures tested when compared to CON-derived normatives. Upper body strength exhibited moderate sensitivity and specificity for classification of CAC (p≤0.02). Elevated relative energy expenditure and cytokines negatively predicted, and muscle mass positively predicted, various muscle strength outcomes.
Conclusion:
Stair climb power and upper body strength may have potential as discriminatory tests for functional impairment in patients with cancer cachexia.
Keywords: cancer cachexia, functional impairment, stair climb, energy expenditure, muscle strength
INTRODUCTION
Cachexia is a complex metabolic syndrome characterized by loss of muscle mass with or without loss of fat mass, not reversed by nutritional supplementation, and leading to progressive functional impairment [1-4]. The host response to tumor burden can increase production of cytokines, such as interleukin (IL)-6 and tumor necrosis factor (TNF) [5, 6], decrease anabolic tone [7, 8], and centrally suppress appetite [6, 9], leading to increased resting energy expenditure (REE), weight loss, and reduced quality of life (QOL) [2, 10]. Cancer cachexia is most prevalent in gastric, pancreatic, and esophageal cancer (80%), followed by head and neck cancer (70%), and lung, colorectal, and prostate cancer (60%) [11].
There is currently no effective treatment for cancer cachexia and one of the main barriers to its development is the lack of consensus on clinically important tools for assessing functional impairment in the oncology setting [12]. Some Phase II studies have reported significant improvements in stair climb power (SCP) [13], handgrip strength (HGS) [14, 15], or the short physical performance battery (SBBP) [16] in the intervention group(s) compared to placebo. However, Phase III interventional clinical trials seeking approval for this indication have failed to induce a clinically significant improvement in physical function using these tools in spite of causing significant increases in lean body mass [17-21].
This is likely because lean body mass and muscle function do not necessarily increase or decrease proportionately to each other [22] as was reported in a study involving patients with lung cancer where self-reported physical function and global QOL were reduced only when skeletal muscle index dropped below a gender-specific threshold [23]. In addition, cancer patients with cachexia displayed reduced performance in activities of daily living and worse survival than patients without cachexia, but neither weight loss nor muscle loss individually were associated with survival or functional impairment [24]. These observations suggest that a more comprehensive evaluation involving objective measures such as maximal muscle strength, HGS, SBBP, and the 6-minute walk test [25] and subjective measures such as European Organisation for Research and Treatment of Cancer QLQ-C30 or Karnofsky Performance Score [2] of physical function may be more useful in this setting.
Therefore, it is critical to improve our understanding of the relationship between body composition and muscle function in the setting of cachexia, including identification of which physical function parameters are most affected in this setting, to better inform future trial interventions and/or endpoints for assessment of cachexia treatment response. Also, determining cut-points for functional performance measures could help select patients for inclusion in clinical trials. The purpose of this study was to evaluate the utility of various functional performance measures in cancer patients and establish their association with other parameters commonly assessed in this setting including weight loss history, body composition, REE, QOL, and different biomarkers. We hypothesized that physical function would be significantly worse in patients with cancer cachexia than weight stable patients with or without cancer, and that functional performance can be used to discriminate between cancer patients with or without cachexia. We hypothesized that functional performance would be positively associated with muscle mass, QOL, and testosterone and negatively associated with weight loss, energy expenditure, and cytokines.
MATERIALS AND METHODS
Study Participants
Men with histologically confirmed solid tumors were recruited from the Michael E. DeBakey Veterans Affairs Medical Center (MEDVAMC) in Houston, TX, and the Veterans Affairs Puget Sound Health Care System (VAPSHCS) in Seattle, WA. Tumor-bearing patients were further categorized into patients with cachexia (CAC) or without cachexia (CNC). Cachexia was defined by weight loss ≥5% over the prior six months, ≥10% over the prior ten months, ≥2% over any period plus body mass index (BMI) ≤20, or appendicular skeletal muscle index (ASMI) <7.26 kg/m2 and weight loss >2% [2]. Weight stable, non-cancer control participants (CON) were also recruited from MEDVAMC, VAPSHCS, and from their respective surrounding communities.
Healthy weight was extracted from electronic medical records or participant interview, defined as stable body weight 2-5 years prior to diagnosis (CAC or CNC) or to study enrollment (CON). Participants were excluded for 1) other causes of cachexia: liver disease (aspartate or alanine transferase ≥3x upper limit of normal), renal failure (creatinine ≥2.5 mg/dL), untreated thyroid disease, class III-IV congestive heart failure, AIDS, other cancer diagnosed within the past five years other than non-melanoma skin cancer, or severe chronic obstructive pulmonary disease requiring use of home O2; 2) active, uncontrolled infection; 3) uncontrolled diabetes mellitus (HbA1c ≥9%); 4) actively receiving a concurrent investigational agent; or 5) current use (<one month) of testosterone, high dose steroids (20 mg of prednisone/day), or megestrol.
Ethical Approval
The protocol was approved by the MEDVAMC and VAPSHCS Institutional Review Boards and their Research and Development Committees and was conducted in compliance with the Declarations of Helsinki and its amendments and the International Conference on Harmonization Guideline for Good Clinical Practices.
Study Measures
For this cross-sectional study, participants reported in the morning after fasting overnight. A blood sample was obtained before 10AM to measure circulating inflammatory and hormone markers followed by assessment of body composition, REE, physical function, and patient-reported outcomes.
Body Composition and Energy Expenditure
Body composition was measured by dual-energy x-ray absorptiometry (Hologic Inc., Marlborough, MA) for lean body mass (LBM), appendicular LBM (ALM), fat mass, percent body fat, and ASMI [26]. Absolute REE (kcals/d) and respiratory quotient (VCO2/VO2 ratio), as a measure of relative utilization of carbohydrates and fat, were assessed by indirect calorimetry in the supine position, using the average of the last 20 minutes from 30-minute data collection (Vmax Encore, Vyaire Medical, Inc., Mettawa, IL). Percent predicted REE is expressed as the ratio of absolute REE/predicted REE; relative REE is expressed as the ratio of absolute REE/LBM.
Physical Function
Physical function was assessed by handgrip strength (HGS; Jamar Hydraulic Dynamometer, J.A. Preston Corp., Clifton, NJ), SCP, and one-repetition maximum (1RM) muscle strength of different muscle groups. To assess SCP, participants climbed a flight of standard hospital stairs (13 steps, 15.3 cm each) at the highest possible speed, according to their capabilities [27]. Two-three trials were attempted, and the shortest time employed to complete the test was recorded and transformed into power: Watts (W) = [body mass (kg) x acceleration of gravity (9.81 m/s2) x vertical distance (1.99m)] / time (seconds). Muscle strength was measured according to American College of Sports Medicine strength testing guidelines [28] for upper body [chest press, latissimus pull-down, upper back seated row] and lower body [hip extension, knee extension, knee flexion] muscle groups (Kaiser Sports Health Equipment, Inc., Fresno, CA). Relative strength was calculated for each muscle group as 1RM (kg)/LBM (kg).
Quality of Life
Clinician-rated physical function scores were assessed by European Cooperative Oncology Group [29] and Karnofsky Performance Score [30]. Patient-reported outcomes included Anderson Symptom Assessment Scale [31], and Functional Assessment of Chronic Illness Therapy-Fatigue [32]. All scores were converted as necessary so that larger numbers indicate better QOL. Total possible Functional Assessment of Chronic Illness Therapy-Fatigue score was adjusted on an individual basis for omitted/missing values and is reported here as relative score (total score divided by total possible score).
Inflammatory Biomarkers
Inflammatory cytokines in plasma were detected by V-PLEX Human Pro-inflammatory Panel 1 from Meso Scale Discovery company (Cat# N05049A-1, MSD, Rockville, MD). The V-PLEX kit contains IL-1β, IL-6, and TNF spotted in each well as sandwich immunoassays as we have previously described [33]. A protocol provided by the manufacturer was used for this assay. In brief, the plasma samples and controls were diluted in 2-fold before adding to the 96-well V-PLEX plate. The plate was incubated at room temperature with shaking for 2 hours followed by 3 washes in phosphate buffered saline with .05% Tween 20 (PBS/T). After adding 1x detection antibody solution, the plate was incubated at room temperature with shaking for another 2 hours. After another 3 washes in PBS/T, the Read Buffer T containing electrochemiluminescent SULFO-TAG labelled detection antibody was added. The V-PLEX plate was read on MSD Sector Imager (Rockville, MD) and the data was analyzed by Discovery Workbench v4.0. software (Rockville, MD). Total testosterone (TT; ng/mL) and sex-hormone binding globulin (ng/mL), in plasma were analyzed via liquid-chromatography tandem mass spectroscopy as previously reported [34]. Bioavailable testosterone was calculated (cBT; ng/dL) with theoretical association constants for testosterone with sex-hormone binding globulin and albumin [35].
Statistical Analysis
SPSS v18 (SPSS, Inc., Chicago, IL) was used for statistical analysis. Comparison across groups was analyzed using Kruskal-Wallis ANOVA for continuous variables or Fisher’s exact test for categorical variables. Statistical significance was 2-sided, α≤0.05. Data are reported as median (SEM) or N (%). Kaplan Meier curves and Cox regression were used to assess survival. Receiver Operator Characteristics (ROC) curves were used to assess the performance of individual functional assessments for correctly categorizing presence or absence of cachexia. A cut point was identified for each individual physical function parameter with the best available combination of sensitivity (rate of true positives) and specificity (1-specificity = rate of false positives) outcomes. Multivariate regression was performed using cancer diagnosis as a forced variable and using the following conditional variables: stage, BMI, 6-month relative weight change, fat mass, ALM, ASMI, REE %predicted, respiratory quotient, REE/LBM, IL-6, TNF, cBT, and patient-reported outcomes. Dependent variables included SCP, HGS, chest press-1RM, latissimus pull-down-1RM, upper back seated row-1RM, hip extension-1RM, knee flexion-1RM, and knee extension-1RM. ROC curves and multivariate regression were analyzed using only cancer patient data.
RESULTS
Study Participants
Demographic information is provided for CAC (N=48), CNC (N=48), and CON (N=37) in Table 1. Compared to CNC, CAC displayed smaller proportions of genitourinary tumors and stage 1 tumors, and greater proportions of “other” tumors (2-squamous cell, 1-malignant myxoid, 1-neuroendocrine), stage 4 tumors, and recent chemotherapy exposure (p≤0.04; Table 1). Sample sizes provided in Tables and Figures reflect the number of subjects who completed each assessment. The CAC group exhibited significantly lower body weight, BMI (p≤0.003; Table 1), LBM, and ALM (p≤0.003; Figure 1) and significantly greater recent weight loss (p<0.001; Table 1) compared to CNC or CON. Total fat mass was also reduced in CAC compared to CNC (p=0.029, Figure 1).
Table 1.
Demographics and descriptive characteristics
| Med (SEM) or N (%) | CAC N=48 |
CNC N=48 |
CON N=37 |
p-value |
|---|---|---|---|---|
| Age (yrs) | 66.6 (1.1) | 64 (1.3) | 64 (1.6) | 0.31 |
| Ht (cm) | 175.3 (1.4) | 177.8 (1.1) | 177.8 (1.0) | 0.67 |
| Healthy Wt (kg) | 85.9 (3.3) | 96.4 (3.1) | 87.3 (2.5) | 0.09 |
| Study Visit Wt (kg) | 73.1 (2.8) | 94.1 (3.0)a | 87.3 (2.4) a | <0.001 |
| BMI (kg/m2) | 24.3 (0.8) | 30.1 (0.8)a | 27.0 (0.8) a | <0.001 |
| 6-mo Wt change (%) | −8.9 (0.9) | −0.8 (0.4)a | −1.2 (0.5) a | <0.001 |
| 12-mo Wt change (%) | −10.4 (1.3) | −0.9 (0.6)a | −0.5 (0.6) a | <0.001 |
| Ethnicity | 0.49 | |||
| White, non-Hispanic | 36 (75.0) | 31 (64.6) | 24 (64.9) | |
| White, Hispanic | 6 (12.5) | 3 (6.3) | 5 (13.5) | |
| Black | 5 (10.4) | 6 (12.5) | 6 (16.2) | |
| Asian/Pacific Islander | 1 (2.1) | 4 (8.3) | 1 (2.7) | |
| Native American | 0 (0.0) | 1 (2.1) | 0 (0.0) | |
| Unknown | 0 (0.0) | 3 (6.3) | 1 (2.7) | |
| Tumor System | 0.01 | |||
| Gastrointestinal | 29 (60.4) | 21 (43.8) | - | |
| Genitourinary | 15 (31.3) | 27 (56.2)a | - | |
| Other | 4 (8.3) | 0 (0.0)a | - | |
| Stage | <0.001 | |||
| 1 | 3 (6.3) | 17 (35.4)a | - | |
| 2 | 17 (35.4) | 19 (39.6) | - | |
| 3 | 9 (18.8) | 8 (16.7) | - | |
| 4 | 16 (33.3) | 4 (8.3)a | - | |
| Undetermined | 3 (6.3) | 0 (0.0) |
≤0.05 vs CAC
Fig. 1.
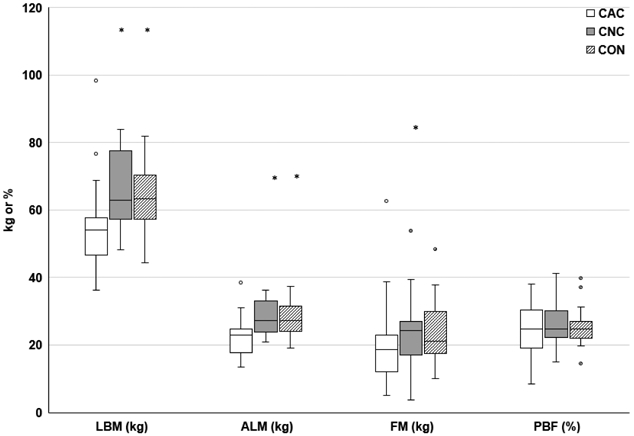
Body Composition
*p≤0.05 vs. CAC. LBM, lean body mass; ALM, appendicular lean mass; FM, fat mass; PBF, percent body fat; kg kilograms. Body composition assessed via dual energy x-ray absorptiometry. CAC (N=23), CNC (N=22), and CON (N=26)
Respiratory quotient and energy expenditure
Respiratory quotient was significantly lower in CAC vs CON (p=0.032, Figure 2A); however, there were no differences across groups in VO2 or VCO2 (L/min, data not shown). Absolute REE (kcals/d) was not different across groups, but percent predicted REE and relative REE (REE/LBM) were significantly elevated in CAC (p≤0.047; Figure 2B-D).
Fig. 2.
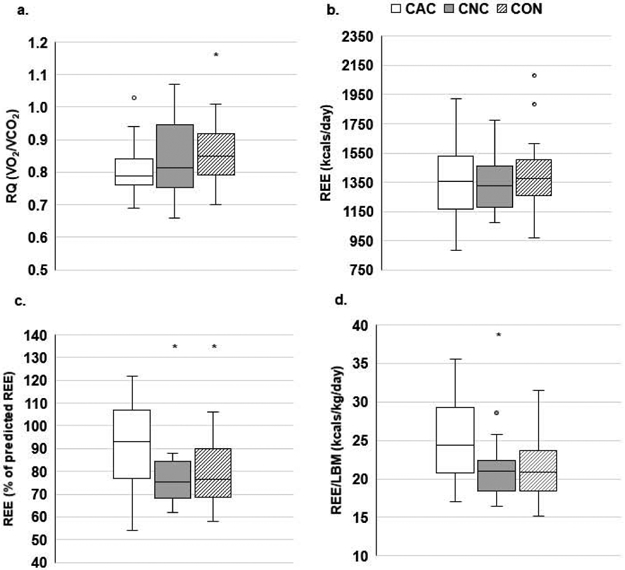
Energy expenditure
*p≤0.05 vs. CAC. RQ, respiratory quotient; REE, resting energy expenditure; LBM, lean body mass. Metabolic demand measured by RQ (A), absolute REE (B), % predicted REE [(absolute REE/predicted REE)*100] (C), and relative REE (D). A-C: CAC (N=32), CNC (N=20), CON (N=24), D: CAC (N=20), CNC (N=29), CON (N=24)
Functional performance
Physical function as measured by SCP and chest press-1RM was significantly lower in CAC compared to CNC or CON (p≤0.03; Figure 3A, D); HGS, latissimus pull-down-1RM, and upper back seated row-1RM were significantly lower in CAC compared to CON only (p≤0.018; Figure 3C-D). There were no differences across groups for lower body 1RM or for relative strength (1RM/LBM; data not shown), except for a trend for upper back seated row (1RM/LBM; p=0.052).
Fig. 3.
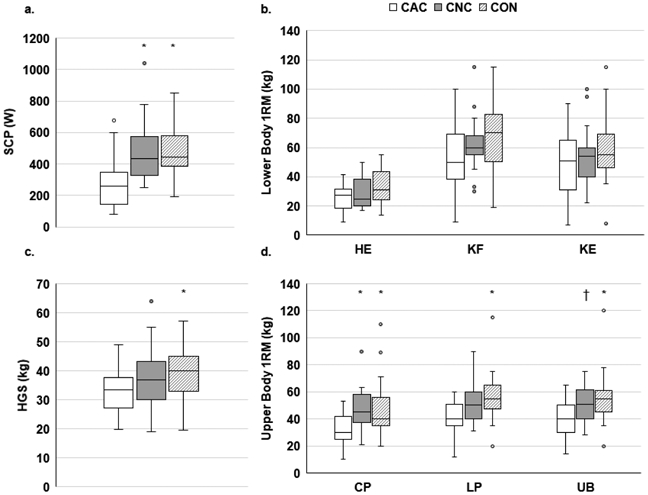
Physical function
*p≤0.05 vs. CAC; †p=0.071 vs. CAC. SCP, stair climb power; W, Watts; 1RM, one-repetition maximum; HE, hip extension; KF, knee flexion; KE, knee extension; HGS, handgrip strength; CP, chest press; LP, latissimus pull-down; UB, upper back seated row. Physical function assessed via SCP (A), lower body strength (B), HGS (C), or upper body strength (D). A: CAC (N=20), CNC (N=18), CON (N=23), B: CAC (N=16-20), CNC (N=16-19), CON (N=20-25), C: CAC (N=40), CNC (N=42), CON (N=35), D: CAC (N=19), CNC (N=20), CON (N=24-25)
ROC Curves were analyzed using individual physical function as continuous variables and a dichotomous cachexia grouping variable. The area under the curve was significant for SCP, chest press-1RM, latissimus pull-down-1RM, and upper back seated row-1RM (p≤0.035) and the associated cut-points, sensitivity, and specificity for each parameters’ ability to discriminate between cancer patients with or without cachexia is provided in Table 3. The proportion of CON patients performing worse than the ROC-derived cut-points are also provided. Stair climb power displayed the largest area under the curve and the highest specificity and sensitivity for discriminating between cancer patients with or without cachexia.
Table 3.
ROC Curves to determine functional impairment in cancer patients
| Physical Function Parameter |
p-value | AUC | Parameter Cut-point |
Sensitivity | Specificity | Proportion of CON Below Cut-point N (%) |
|---|---|---|---|---|---|---|
| SCP (W) (30-y, 18-n) | 0.001 | 0.802 | 336 | 0.78 | 0.77 | 4 (17.4) |
| Chest Press (kg) (19-y, 19-n) | 0.008 | 0.751 | 38.5 | 0.74 | 0.68 | 9 (37.5) |
| Lat Pull (kg) (19-y, 19-n) | 0.028 | 0.709 | 46.5 | 0.63 | 0.74 | 6 (24.0) |
| Upper Back (kg) (19-y, 20-n) | 0.02 | 0.717 | 46.0 | 0.65 | 0.68 | 7 (28.0) |
ROC, Receiver Operator Characteristics; AUC, area under the curve; CON, non-cancer control group; y, cachexia; n, no cachexia; SCP, stair climb power; W, watts; kg, kilograms.
Functional performance percentiles (10th, 25th, and 50th) were derived from CON patient data. The proportions of CAC and CNC patients performing worse than these CON-derived 10th, 25th, or 50th percentiles are provided in Figure 4 for the parameters with significant ROC areas: SCP, chest press-1RM, latissimus pull-down-1RM, upper back seated row-1RM. Stair climb power displayed the largest proportions of CAC patients performing below each CON-derived percentile. Lower body strength and HGS are not displayed due to lack of difference across groups (data not shown).
Fig. 4.
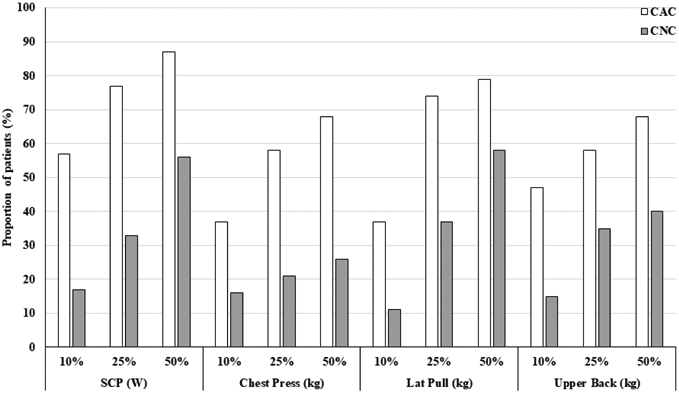
Proportion of cancer patients with physical function below CON percentiles
SCP, stair climb power; W, Watts; kg, kilograms. Proportion of CAC or CNC with physical function falling below the 10th, 25th, and 50th percentiles of physical function derived from CON data for SCP or upper body 1RM measures. SCP: CAC (N=30), CNC (N=18); 1RM: CAC (N=19), CNC (N=19)
Patient-reported outcomes
Patient-reported appetite and fatigue on the Anderson Symptom Assessment Scale were significantly worse in CAC than CON (p≤0.017); there was also a trend for a difference in breathlessness, overall wellness, and total Anderson Symptom Assessment Scale score across groups (Table 2). Patient-reported physical well-being, fatigue, and total score on the Functional Assessment of Chronic Illness Therapy-Fatigue were significantly worse in CAC than CON (p≤0.022; Table 2).
Table 2.
Function rating and patient-reported quality of life
| Med (SEM) | CAC N=48 |
CNC N=46 |
CON N=36 |
p-value |
|---|---|---|---|---|
| KPS | 90.0 (1.3) | 100.0 (1.0)c | 100.0 (0.8)ab | <0.001 |
| ECOG | 1.0 (0.1) | 0.0 (0.1)a | 0.0 (0.1)a | <0.001 |
| ASAS | ||||
| Pain | 7.0 (0.4) | 8.0 (0.4) | 8.0 (0.4) | 0.29 |
| Fatigue | 7.0 (0.4) | 8.0 (0.4) | 9.0 (0.4) a | 0.015 |
| Nausea | 10.0 (0.4) | 10.0 (0.2) | 10.0 (0.2) | 0.24 |
| Depression | 10.0 (0.4) | 10.0 (0.3) | 10.0 (0.3) | 0.88 |
| Anxiety | 10.0 (0.4) | 8.0 (0.4) | 9.5 (0.4) | 0.24 |
| Drowsiness | 9.0 (0.4) | 9.0 (0.3) | 10.0 (0.3) | 0.10 |
| Breathlessness | 10.0 (0.4) | 10.0 (0.3) | 10.0 (0.3) | 0.09 |
| Appetite | 6.0 (0.4) | 8.0 (0.4) | 8.5 (0.4) a | 0.014 |
| Sleeplessness | 6.0 (0.4) | 6.0 (0.4) | 7.0 (0.4) | 0.13 |
| Overall wellness | 6.0 (0.3) | 8.0 (0.4) | 8.0 (0.3) | 0.09 |
| Total | 74.5 (2.6) | 81.0 (2.5) | 82.5 (2.3) | 0.053 |
| FACIT-F | ||||
| Physical Well-being | 71.4 (2.8) | 85.7 (3.1) | 89.3 (3.0)a | 0.002 |
| Social Well-being | 71.4 (3.1) | 78.6 (3.7) | 71.4 (5.1) | 0.93 |
| Emotional Well-being | 88.3 (2.7) | 79.2 (2.4) | 85.4 (2.5) | 0.14 |
| Functional Well-being | 65.5 (3.2) | 75.0 (3.8) | 78.6 (3.9) | 0.16 |
| Fatigue | 72.1 (3.6) | 73.1 (3.5) | 82.9 (3.1) a | 0.012 |
| Total | 70.6 (2.4) | 77.8 (2.5) | 80.6 (2.7) a | 0.022 |
p≤0.05 vs CAC
p=0.066 vs CNC
p=0.08 vs CAC; KPS, Karnofsky Performance Score; ECOG, European Cooperative Oncology Group; ASAS, Anderson Symptom Assessment Scale; FACIT-F, Functional Assessment of Chronic Illness Therapy-Fatigue. All scores were converted as necessary so that larger numbers indicate better QOL. Total possible FACIT-F score was adjusted on an individual basis for omitted/missing values and is reported here as relative score (total score divided by total possible score).
Biomarkers
Circulating levels of IL-6 and TNF were significantly higher in CAC compared to CON (p≤0.009; Figure 5A) with a trend for elevated TNF levels in CAC vs CNC (p=0.098); there was no difference across groups in proportion of participants with detectable levels of IL-1β (p=0.53, not shown). There was no difference across groups for circulating TT (Figure 5B); however, levels of cBT were significantly lower (p≤0.022; Figure 5C) and sex-hormone binding globulin were significantly higher in CAC compared to CNC or CON (p<0.001 for both, data not shown). There was a trend (p=0.11) for a difference across groups for incidence of hypogonadism (<70ng/dL cBT): CAC (34.1%), CNC (15.0%), CON (19.4%).
Fig. 5.
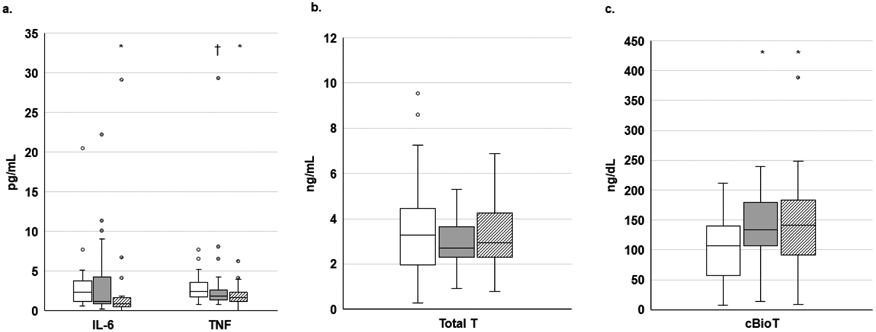
Circulating cytokines and testosterone
*p≤0.05 vs CAC; †p=0.098 vs CAC; IL, interleukin; TNF, tumor necrosis factor; T, testosterone; cBio, calculated bioavailable. Circulating cytokines (A), Total T (B), or cBio T (C). A-C: CAC (N=43-44), CNC (N=34-40), CON (N=29-31)
Regression
Multivariate regression was performed to identify significant predictors (p<0.05) of individual physical function outcomes (Table 4). Patient-reported outcomes included in the model were: fatigue and appetite from the Anderson Symptom Assessment Scale and fatigue and physical well-being from the Functional Assessment of Chronic Illness Therapy-Fatigue. Handgrip strength was positively predicted by tumor stage, ALM, and ASAS appetite. Power produced during SCP was positively predicted by cBT. Chest press and Lat Pull strength were each negatively predicted by REE/LBM. Chest Press strength was also negatively predicted by TNF and positively predicted by tumor stage and ASMI. Upper Back strength was positively predicted by ALM and 6-month relative weight change and negatively predicted by TNF. Hip Extension was positively predicted by ALM while Knee Flexion and Extension were each negatively predicted by REE/LBM. Knee extension was also negatively predicted by TNF and ASAS appetite.
Table 4.
Regression models for prediction of physical function for cancer patients
| Dependent Variable | N | R2 | Significant Predictors |
Unstd. B (95% CI) |
p-value |
|---|---|---|---|---|---|
| HGS (kg) | 29 | 0.47 | Stage | 4.42 (1.66-7.18) | 0.004 |
| ALM | 0.82 (0.33-1.31) | 0.003 | |||
| ASAS appetite | 1.38 (0.15-2.61) | 0.038 | |||
| SCP (W)a | 27 | 0.18 | cBT | 0.78 (−0.58-2.17) | 0.042 |
| Chest Press (kg) | 27 | 0.76 | REE/LBM | −1.22 (−2.20- −0.24) | 0.025 |
| Stage | 4.92 (1.69-8.15) | 0.007 | |||
| TNF | −1.95 (−3.58- −0.32) | 0.029 | |||
| ASMI | 4.32 (1.18-7.46) | 0.013 | |||
| Lat Pull (kg) | 27 | 0.40 | REE/LBM | −2.07 (−3.13- −1.01) | 0.001 |
| Upper Back (kg) | 28 | 0.76 | ALM | 1.70 (1.13-2.27) | <0.001 |
| 6-mo % wt change | 0.81 (0.08-1.54) | 0.04 | |||
| TNF | −2.72 (−4.43- −1.01) | 0.005 | |||
| Hip Extension (kg) | 22 | 0.49 | ALM | 1.50 (0.76-2.24) | 0.01 |
| Knee Flexion (kg) | 28 | 0.57 | REE/LBM | −1.70 (−2.90- −0.50) | 0.01 |
| TNF | −5.18 (−8.24 −2.12) | 0.003 | |||
| ASAS appetite | −3.18 (−5.75 −0.61) | 0.024 | |||
| Knee Extension (kg) | 28 | 0.48 | REE/LBM | −2.70 (−3.98- −1.42) | <0.001 |
Body mass index (BMI) not included in SCP prediction model. HGS, handgrip strength; kg, kilograms; SCP, stair climb power; W, watts; ALM, appendicular lean mass; ASAS, Anderson Symptom Assessment Scale; cBT, calculated bioavailable testosterone; REE, resting energy expenditure; LBM, lean body mass; TNF, tumor necrosis factor; ASMI, appendicular skeletal muscle index. Regression models including cancer patient data to determine significant predictors of physical function. Forced variable: tumor; conditional variables: stage, BMI, 6-mo relative weight change, fat mass, ALM, ASMI, REE %predicted, respiratory quotient, REE/LBM, IL-6, TNF, cBioT, and patient-reported outcomes.
Survival
Survival was significantly worse in CAC than CNC (p=0.002; Figure 6); there were no deaths in CON during the study period. There were no significant predictors of survival from Cox regression using cancer patient data only (not shown).
Fig. 6.
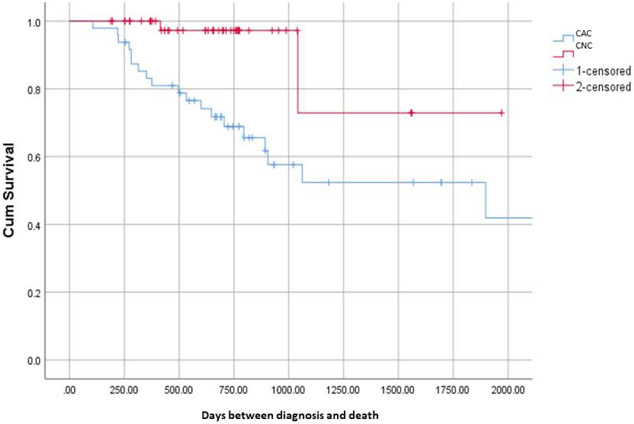
Kaplan Meier Survival Curve
Cumulative survival for CAC vs. CNC (p=0.002)
DISCUSSION
The main findings of this study were functional performance cut-points with sufficient sensitivity and specificity for discriminating between cancer patients with or without cachexia for SCP and upper body strength. Higher cBT was associated with better SCP performance, while elevated relative energy expenditure (REE/LBM) and cytokines were associated with worse upper and lower body strength. Over half of the patients with cachexia performed below the 10th percentile of control group SCP, and over one-third performed below the 10th percentile of control group upper body strength.
There are currently no established criteria for functional impairment measured by SCP or muscle strength in the geriatric or oncology settings. In contrast, the recommended functional impairment cut-point for HGS is between 26-30 kg in healthy older men [36, 37]. While we did not find that HGS was a predictor of cachexia, our observations suggest that SCP and/or upper body strength may be appropriate endpoints for assessing functional impairment in cancer cachexia. Particularly, SCP and chest press strength were the only functional outcomes that were significantly lower in CAC than both CON and CNC. Lower body strength was not reduced in CAC, which was unexpected considering that group’s reduced muscle mass and SCP.
The discrepancy between the impact on lower body strength and power might be explained by different energy demands of those tasks. The creatine phosphate system supplies energy during the first 5-10 seconds of muscle contraction, while anaerobic glycolysis is the predominant energy-producing system thereafter (up to 2-3 minutes) [38]. The nature of the SCP test involves numerous rapid contractions, with each trial typically lasting <10 seconds. In contrast, strength testing involves development of longer, slower contractions performed individually with a rest period over a few minutes. While both tasks are anaerobic, the creatine phosphate system may be more impacted by cancer cachexia than anaerobic glycolysis. In addition, SCP requires greater cardiopulmonary demand and balance than strength testing, suggesting that cachexia may have a greater impact on more complex functional tasks.
The SCP ROC analyses produced a criterion with the highest sensitivity and specificity for discriminating between cancer patients with or without cachexia. This cut-point of 336W resulted in a low proportion (17.4%) of CON patients being classified as functionally impaired, similar to the incidence (11-31%) of functional impairment (difficulty with activities of daily living) in healthy men over 60 years of age without sarcopenia [39]. The ROC-derived criterion in the current study for upper body strength would result in much larger proportions (24-37.5%) of CON patients classified as functionally impaired, making SCP a more conservative option.
In the cancer setting, HGS may not be an optimal clinical end-point for assessing functional impairment due to its inconsistent association with low muscularity. A strong correlation was reported between HGS and computed tomography-derived skeletal muscle index (SMI) in a cohort of GI cancer patients undergoing chemotherapy, but there was poor agreement between functional impairment and muscle wasting, with higher incidence of low SMI (80%) than low HGS (30%) [40]. In the current study HGS did not discriminate between cancer patients with or without cachexia despite ALM being a predictor of greater HGS. Other reports have shown that the relationship between cachexia and functional impairment differs based on the assessment tool. In a cohort of geriatric oncology patients, there was a greater incidence of cachexia in patients with functional impairment assessed via instrumental activities of daily living than those without impairment, but no difference in cachexia incidence between those with or without functional impairment assessed via the Short Physical Performance Battery [24].
In the geriatric population, the loss of strength is seen more rapidly than the loss of muscle mass, and the maintenance/regain of mass is not associated with maintenance/regain of strength, implying a detrimental impact on muscle quality [22]. Indices of muscle quality, such as relative strength, may be informative at identifying patients at risk of functional impairment and for assessing efficacy of interventions to improve mass and function in aging adults [41]. We did not observe differences across groups in the current study for relative upper body strength or for relative or absolute lower body strength, which was unexpected considering the reduced muscle mass and SCP performance in the cachexia group. These observations do not support the premise of muscle quality being an important factor in cancer cachexia assessment.
In healthy adults, voluntary weight loss results in reduced REE [42]. This is often not observed after involuntary weight loss, as in the current study, where REE was not different across groups despite reduced muscle mass and body weight in patients with cancer cachexia. Instead, these patients often display elevated relative energy expenditure, which is frequently associated with inflammation [43]. Here we report that elevated REE/LBM and circulating TNF were negatively associated with measures of upper and lower body strength. These observations suggest that inflammation and energy expenditure may play a role in the development of muscle function loss in this setting. In patients with various tumor types, a skeletal muscle TNF gene polymorphism was associated with weight loss and low SMI, suggesting a cytokine-related susceptibility for cachexia [44]. In colorectal cancer patients, fat-free mass and the inflammatory marker C-reactive protein were predictors of REE [45]. This relationship between hypermetabolism, inflammation, and low muscularity as effectors of reduced physical function is clinically relevant as treatment strategies are in development for cancer cachexia targeting cytokines [46] and energy expenditure [15]. Our observations suggest that upper body strength may be an appropriate endpoint for future interventions targeting energy expenditure and/or inflammation.
In this study, cBT predicted SCP performance, suggesting a positive effect of androgens on muscle power, and supporting the hypothesis that the androgen receptor could be explored as a therapeutic target for functional improvement in cancer cachexia. This premise was explored by a Phase II study where SCP increased in cancer patients who received the selective androgen receptor modulator enobosarm vs placebo [13]. However, improvement in SCP was not achieved in a Phase III trial of enobosarm vs placebo [17]. Other measures of functional performance have been considered the primary endpoint for several Phase III studies [18-21]. Most of these studies recruited patients based on muscle mass or weight loss, despite that muscle mass and function are not always correlated [22]. This emphasizes the importance for determining functional performance criteria to better inform trial interventions, endpoints, or inclusion criteria for assessment of cachexia treatment response. In addition, as cancer patients are evaluated for treatment trajectory including chemotherapy, radiotherapy, and/or surgical resection, functional performance criteria could be evaluated for utility as risk stratification tools for improved treatment selection in the geriatric oncology setting.
The strengths of this study include assessment of multiple functional parameters, total and segmental body composition by dual-energy x-ray absorptiometry, testosterone by liquid-chromatography tandem mass spectroscopy, and patient perspective using clinically validated QOL assessments. While dual-energy x-ray absorptiometry can be limited by inability to detect edema, no patients presented with edema at clinical exam. Additionally, causation cannot be deduced due to the cross-sectional design.
Our results suggest that SCP and upper body strength performance may discriminate between cancer patients with or without cachexia. The cut-points detected here for these measures may help select patients for inclusion in clinical trials and may be useful in monitoring response to treatment interventions if confirmed by larger studies.
Acknowledgements
We would like to acknowledge the National Institutes of Health (NIH) National Institute of Diabetes and Digestive and Kidney Diseases funded Nutrition Obesity Research Center (DK035816) and Diabetes Research Center (P30 DK017047) at the University of Washington. We also thank the VAPSHCS R&D Mass Spectrometry Assay Core. JG receives research support from the U.S. Department of Veterans Affairs (BX002807), the Congressionally Directed Medical Research Program (PC170059), and from the NIH (R01CA239208, R01AG061558, R01AR067319).
Funding This research did not receive any specific grant from funding agencies in the public, commercial, or not-for-profit sectors.
Footnotes
Publisher's Disclaimer: This is a PDF file of an unedited manuscript that has been accepted for publication. As a service to our customers we are providing this early version of the manuscript. The manuscript will undergo copyediting, typesetting, and review of the resulting proof before it is published in its final form. Please note that during the production process errors may be discovered which could affect the content, and all legal disclaimers that apply to the journal pertain.
Conflicts of Interest These authors report no conflicts of interest.
References
- 1.Coussens LM, Werb Z. Inflammation and cancer. Nature 2002;420(6917):860–7. [DOI] [PMC free article] [PubMed] [Google Scholar]
- 2.Fearon K, Strasser F, Anker SD, et al. Definition and classification of cancer cachexia: an international consensus. Lancet Oncol 2011;12(5):489–95. [DOI] [PubMed] [Google Scholar]
- 3.Laviano A, Koverech A, Mari A. Cachexia: clinical features when inflammation drives malnutrition. Proc Nutr Soc 2015;74(4):348–54. [DOI] [PubMed] [Google Scholar]
- 4.Mantovani A, Allavena P, Sica A, et al. Cancer-related inflammation. Nature 2008;454(7203):436–44. [DOI] [PubMed] [Google Scholar]
- 5.Batista ML Jr., Peres SB, McDonald ME, et al. Adipose tissue inflammation and cancer cachexia: possible role of nuclear transcription factors. Cytokine 2012;57(1):9–16. [DOI] [PubMed] [Google Scholar]
- 6.Plata-Salaman CR. Brain cytokine production and action in anorexia and cachexia. Cytokine 2001;15(1):1–3. [DOI] [PubMed] [Google Scholar]
- 7.Del Fabbro E, Hui D, Nooruddin ZI, et al. Associations among hypogonadism, C-reactive protein, symptom burden, and survival in male cancer patients with cachexia: a preliminary report. J Pain Symptom Manage 2010;39(6):1016–24. [DOI] [PubMed] [Google Scholar]
- 8.Garcia JM, Li H, Mann D, et al. Hypogonadism in male patients with cancer. Cancer 2006;106(12):2583–91. [DOI] [PubMed] [Google Scholar]
- 9.Mondello P, Mian M, Aloisi C, et al. Cancer cachexia syndrome: pathogenesis, diagnosis, and new therapeutic options. Nutr Cancer 2015;67(1):12–26. [DOI] [PubMed] [Google Scholar]
- 10.Quinten C, Coens C, Mauer M, et al. Baseline quality of life as a prognostic indicator of survival: a meta-analysis of individual patient data from EORTC clinical trials. Lancet Oncol 2009;10(9):865–71. [DOI] [PubMed] [Google Scholar]
- 11.Laviano A, Meguid MM. Nutritional issues in cancer management. Nutrition 1996;12(5):358–71. [DOI] [PubMed] [Google Scholar]
- 12.Garcia JM. What is next after anamorelin? Curr Opin Support Palliat Care 2017;11(4):266–271. [DOI] [PMC free article] [PubMed] [Google Scholar]
- 13.Dobs AS, Boccia RV, Croot CC, et al. Effects of enobosarm on muscle wasting and physical function in patients with cancer: a double-blind, randomised controlled phase 2 trial. Lancet Oncol 2013;14(4):335–45. [DOI] [PMC free article] [PubMed] [Google Scholar]
- 14.Garcia JM, Boccia RV, Graham CD, et al. Anamorelin for patients with cancer cachexia: an integrated analysis of two phase 2, randomised, placebo-controlled, double-blind trials. Lancet Oncol 2015;16(1):108–16. [DOI] [PubMed] [Google Scholar]
- 15.Stewart Coats AJ, Ho GF, Prabhash K, et al. Espindolol for the treatment and prevention of cachexia in patients with stage III/IV non-small cell lung cancer or colorectal cancer: a randomized, double-blind, placebo-controlled, international multicentre phase II study (the ACT-ONE trial). J Cachexia Sarcopenia Muscle 2016;7(3):355–65. [DOI] [PMC free article] [PubMed] [Google Scholar]
- 16.Wright TJ, Dillon EL, Durham WJ, et al. A randomized trial of adjunct testosterone for cancer-related muscle loss in men and women. J Cachexia Sarcopenia Muscle 2018;9(3):482–496. [DOI] [PMC free article] [PubMed] [Google Scholar]
- 17.Crawford J, Johnston M, Hancock M, et al. Enobosarm, a selective androgen receptor modulator (SARM) increases lean body mass (LBM) in advanced NSCLC patients: updated results of two pivotal, international phase 3 trials. Support Care Cancer 2014;22(suppl 1):S30. [Google Scholar]
- 18.Currow D, Temel JS, Abernethy A, et al. ROMANA 3: a phase 3 safety extension study of anamorelin in advanced non-small-cell lung cancer (NSCLC) patients with cachexia. Ann Oncol 2017;28(8):1949–1956. [DOI] [PMC free article] [PubMed] [Google Scholar]
- 19.Mantovani G, Maccio A, Madeddu C, et al. Randomized phase III clinical trial of five different arms of treatment in 332 patients with cancer cachexia. Oncologist 2010;15(2):200–11. [DOI] [PMC free article] [PubMed] [Google Scholar]
- 20.Temel JS, Abernethy AP, Currow DC, et al. Anamorelin in patients with non-small-cell lung cancer and cachexia (ROMANA 1 and ROMANA 2): results from two randomised, double-blind, phase 3 trials. Lancet Oncol 2016;17(4):519–31. [DOI] [PubMed] [Google Scholar]
- 21.Madeddu C, Dessi M, Panzone F, et al. Randomized phase III clinical trial of a combined treatment with carnitine + celecoxib +/− megestrol acetate for patients with cancer-related anorexia/cachexia syndrome. Clin Nutr 2012;31(2):176–82. [DOI] [PubMed] [Google Scholar]
- 22.Goodpaster BH, Park SW, Harris TB, et al. The loss of skeletal muscle strength, mass, and quality in older adults: the health, aging and body composition study. J Gerontol A Biol Sci Med Sci 2006;61(10):1059–64. [DOI] [PubMed] [Google Scholar]
- 23.Bye A, Sjoblom B, Wentzel-Larsen T, et al. Muscle mass and association to quality of life in non-small cell lung cancer patients. J Cachexia Sarcopenia Muscle 2017;8(5):759–767. [DOI] [PMC free article] [PubMed] [Google Scholar]
- 24.Dunne RF, Roussel B, Culakova E, et al. Characterizing cancer cachexia in the geriatric oncology population. J Geriatr Oncol 2019;10(3):415–419. [DOI] [PMC free article] [PubMed] [Google Scholar]
- 25.Dunne RF, Loh KP, Williams GR, et al. Cachexia and Sarcopenia in Older Adults with Cancer: A Comprehensive Review. Cancers (Basel) 2019;11(12). [DOI] [PMC free article] [PubMed] [Google Scholar]
- 26.Baumgartner RN, Koehler KM, Gallagher D, et al. Epidemiology of sarcopenia among the elderly in New Mexico. Am J Epidemiol 1998;147(8):755–63. [DOI] [PubMed] [Google Scholar]
- 27.Vandewalle H, Peres G, Monod H. Standard anaerobic exercise tests. Sports Med 1987;4(4):268–89. [DOI] [PubMed] [Google Scholar]
- 28.Pescatello LS, Arena R, Riebe D Thompson PD ACSM’s Guidelines for Exercise Testing and Prescription, 9th ed. Baltimore, MD: Lippincott Williams & Wilkins; 2014. [DOI] [PubMed] [Google Scholar]
- 29.Oken MM, Creech RH, Tormey DC, et al. Toxicity and response criteria of the Eastern Cooperative Oncology Group. Am J Clin Oncol 1982;5(6):649–55. [PubMed] [Google Scholar]
- 30.Yates JW, Chalmer B, McKegney FP. Evaluation of patients with advanced cancer using the Karnofsky performance status. Cancer 1980;45(8):2220–4. [DOI] [PubMed] [Google Scholar]
- 31.Palmer JL, Fisch MJ. Association between symptom distress and survival in outpatients seen in a palliative care cancer center. J Pain Symptom Manage 2005;29(6):565–71. [DOI] [PubMed] [Google Scholar]
- 32.Butt Z, Lai JS, Rao D, et al. Measurement of fatigue in cancer, stroke, and HIV using the Functional Assessment of Chronic Illness Therapy - Fatigue (FACIT-F) scale. J Psychosom Res 2013;74(1):64–8. [DOI] [PMC free article] [PubMed] [Google Scholar]
- 33.Garcia JM, Splenser AE, Kramer J, et al. Circulating inflammatory cytokines and adipokines are associated with increased risk of Barrett's esophagus: a case-control study. Clin Gastroenterol Hepatol 2014;12(2):229–238 e3. [DOI] [PMC free article] [PubMed] [Google Scholar]
- 34.Harrington LB, Marck BT, Wiggins KL, et al. Cross-sectional association of endogenous steroid hormone, sex hormone-binding globulin, and precursor steroid levels with hemostatic factor levels in postmenopausal women. J Thromb Haemost 2017;15(1):80–90. [DOI] [PMC free article] [PubMed] [Google Scholar]
- 35.Vermeulen A, Verdonck L, Kaufman JM. A critical evaluation of simple methods for the estimation of free testosterone in serum. J Clin Endocrinol Metab 1999;84(10):3666–72. [DOI] [PubMed] [Google Scholar]
- 36.Alley DE, Shardell MD, Peters KW, et al. Grip strength cutpoints for the identification of clinically relevant weakness. J Gerontol A Biol Sci Med Sci 2014;69(5):559–66. [DOI] [PMC free article] [PubMed] [Google Scholar]
- 37.Cruz-Jentoft AJ, Baeyens JP, Bauer JM, et al. Sarcopenia: European consensus on definition and diagnosis: Report of the European Working Group on Sarcopenia in Older People. Age Ageing 2010;39(4):412–23. [DOI] [PMC free article] [PubMed] [Google Scholar]
- 38.McArdle WD, Katch FI, Katch VL. Exercise physiology: nutrition, energy, and human performance: Lippincott Williams & Wilkins; 2010. [Google Scholar]
- 39.Janssen I, Heymsfield SB, Ross R. Low relative skeletal muscle mass (sarcopenia) in older persons is associated with functional impairment and physical disability. J Am Geriatr Soc 2002;50(5):889–96. [DOI] [PubMed] [Google Scholar]
- 40.Moreau J, Ordan MA, Barbe C, et al. Correlation between muscle mass and handgrip strength in digestive cancer patients undergoing chemotherapy. Cancer Med 2019;8(8):3677–3684. [DOI] [PMC free article] [PubMed] [Google Scholar]
- 41.Fragala MS, Kenny AM, Kuchel GA. Muscle quality in aging: a multi-dimensional approach to muscle functioning with applications for treatment. Sports Med 2015;45(5):641–58. [DOI] [PubMed] [Google Scholar]
- 42.Leibel RL, Rosenbaum M, Hirsch J. Changes in energy expenditure resulting from altered body weight. N Engl J Med 1995;332(10): 621–8. [DOI] [PubMed] [Google Scholar]
- 43.Falconer JS, Fearon KC, Plester CE, et al. Cytokines, the acute-phase response, and resting energy expenditure in cachectic patients with pancreatic cancer. Ann Surg 1994;219(4):325–31. [DOI] [PMC free article] [PubMed] [Google Scholar]
- 44.Johns N, Stretch C, Tan BH, et al. New genetic signatures associated with cancer cachexia as defined by low skeletal muscle index and weight loss. J Cachexia Sarcopenia Muscle 2017;8(1):122–130. [DOI] [PMC free article] [PubMed] [Google Scholar]
- 45.Purcell SA, Wallengren O, Baracos VE, et al. Determinants of change in resting energy expenditure in patients with stage III/IV colorectal cancer. Clin Nutr 2019; 10.1016/j.clnu.2018.12.038. [DOI] [PubMed] [Google Scholar]
- 46.Hong DS, Hui D, Bruera E, et al. MABp1, a first-in-class true human antibody targeting interleukin-1alpha in refractory cancers: an open-label, phase 1 dose-escalation and expansion study. Lancet Oncol 2014;15(6):656–66. [DOI] [PubMed] [Google Scholar]