

Abstract
Objective:
To identify factors that accurately predict 1-year survival for liver transplant recipients with a MELD score ≥40.
Background:
Although transplant is beneficial for patients with the highest acuity (MELD ≥40), mortality in this group is high. Predicting which patients are likely to survive for >1 year would be medically and economically helpful.
Methods:
The Scientific Registry of Transplant Recipients database was reviewed to identify adult liver transplant recipients from 2002 through 2016 with MELD score ≥40 at transplant. The relationships between 44 recipient and donor factors and 1-year patient survival were examined using random survival forests methods. Variable importance measures were used to identify the factors with the strongest influence on survival, and partial dependence plots were used to determine the dependence of survival on the target variable while adjusting for all other variables.
Results:
We identified 5309 liver transplants that met our criteria. The overall 1-year survival of high-acuity patients improved from 69% in 2001 to 87% in 2016. The strongest predictors of death within 1 year of transplant were patient on mechanical ventilator before transplantation, prior liver transplant, older recipient age, older donor age, donation after cardiac death, and longer cold ischemia.
Conclusions:
Liver transplant outcomes continue to improve even for patients with high medical acuity. Applying ensemble learning methods to recipient and donor factors available before transplant can predict survival probabilities for future transplant cases. This information can be used to facilitate donor/recipient matching and to improve informed consent.
Keywords: liver transplantation, outcomes, predictors
Patients in United States with model for end-stage liver disease (MELD) scores of 40 or more (that is, those with the highest acuity) have a 3-month waitlist mortality of approximately 71%; in contrast, the 3-month waitlist mortality in patients with MELD scores <19 is 6%.1 The MELD scoring system for allocating livers in the United States was implemented in 2002 and prioritizes allocation to the sickest patients on the waiting list.1,2 To further increase the chance of timely delivery of a suitable donor liver to these high-acuity patients, the Share 35 allocation system was implemented in 2013. This system prioritizes local and regional candidates with a MELD score of more than 35 over local candidates with MELD scores of less than 35.2,3
Patients undergoing liver transplantation with MELD scores ≥40 have more severe end-stage liver disease, often have renal failure, are more likely to be in the intensive care unit, and are older than those with lower MELD scores.4 These patients are a surgical challenge, tend to use more blood products and intensive care unit days, and often require renal replacement therapy.4 For a transplant center, there are also significant financial costs and regulatory pressures with each high MELD transplant. For example, because many payors pay fixed fees for liver transplants, the increased intensive care days and longer hospitalization and increased use of resources can be a burden.4,5
The posttransplant outcomes for recipients with MELD ≥40 depend on a complex interaction between donor and recipient factors. Since the implementation of Share 35, these patients often receive multiple donor offers,5 and surgeons often need to choose which liver will optimize patient and graft survival for that patient. The success of the transplant may depend on the particular combination of donor and recipient, and might change if a given donor organ were transplanted into different recipient. Aside from blood group matching and recipient urgency, limited data guide this decision other than the experience of the individual surgeon. Scoring indices such as the donor risk index attempt to use the characteristics of the donor livers to quantify their quality, but these indices are also not very accurate.6,7
Random survival forests (RSF), an ensemble tree method for analysis of right-censored data, has been shown to be highly accurate and offer improved discrimination over traditional semi-parametric (Cox proportional hazards) and fully parametric survival analysis. In particular RSF are robust to departures from the proportional hazards assumption or misspecification of the parametric survival function, integrate handling of interactions among predictors and nonlinear predictor effects, and provide a built-in framework for imputation of missing predictor values. RSF has been used to study the relationships between prognostic factors and survival in settings including coronary artery bypass grafting,8 systolic heart failure,9 breast cancer,10 and head and neck cancer.11 Recently RSF has been used to examine prognostic factors for patient survival after kidney transplantation.12,13
There are very few studies looking at identifying factors to avoid futility in patients with a MELD ≥40.4 Single-center studies are limited by sample size in their power to obtain meaningful conclusions.4 The objective of the study is to train a statistical learning algorithm to predict the survival of patients transplanted with a MELD ≥40. These findings may be used to influence donor and recipient selection to improve survival in this extremely ill population.
METHODS
Data Processing
An SRTR standard analysis file of all United States liver transplants was used for the analysis. We included all adult (18 years or older at transplant) liver alone or liver-kidney deceased donor recipients who were transplanted from 2002 (when MELD scores began to be recorded) through 2016 with a MELD of ≥40. We excluded Status 1 recipients and recipients approved for MELD exception points.
Statistical Analysis
We summarized all continuous covariates as median (25th, 75th percentile); categorical covariates as frequency (percentage) by whether or not the recipient was alive 1 year after transplant. We tested for univariable difference using Wilcoxon rank sum tests (continuous covariates) and Pearson Chi-squared test. Causes of death were summarized by death within 30 days and between 31 days and 1 year.
To predict the 1-year survival of patients transplanted with a MELD ≥40 and assess the relative importance of potential predictors, a RSF of 1000 trees was grown using the full set of 44 candidate predictor variables given in Tables 1 and 2, using 0.632 subsampling without replacement, the log-rank rule for splitting nodes, 7 predictors tried per node with 10 random splits considered for continuous predictors, and average terminal node size set to 15 individuals. Recipient follow-up time was calculated as time from the transplant date to the date of death or last follow up. Because our interest was in 1-year survival, we then censored follow up at 365 days after the transplant. Out-of-bag (OOB) survival predictions for each individual were obtained by averaging the predictions of trees not trained on that participant and used to compute the concordance index (C-index) and forest error rate (1 – C-index). Details on OOB survival predictions are given below. An adaptive tree imputation algorithm for forests8 was used to impute missing data for predictor variables.
TABLE 1.
Recipient Factors With Missing Data Rates and 1-yr Survival Outcomes
| Level | Alive at 1 yr | Died by 1 yr | P-value | Missing (%) |
|---|---|---|---|---|
| n | 4054 | 882 | ||
| Mechanical ventilator (%) | ||||
| No | 3342 (82.4) | 620 (70.3) | <0.001 | 0 |
| Yes | 712 (17.6) | 262 (29.7) | ||
| Age (median [IQR]) | 53.00 [46, 59] | 56.00 [49, 61] | <0.001 | 0 |
| Previous liver transplant (%) | ||||
| No | 3749 (92.5) | 749 (84.9) | <0.001 | 0 |
| Yes | 305 (7.5) | 133 (15.1) | ||
| Previous abdominal surgery (%) | ||||
| No | 2186 (54.5) | 382 (43.7) | <0.001 | 1 |
| Yes | 1828 (45.5) | 493 (56.3) | ||
| Encephalopathy (%) | ||||
| None | 618 (15.3) | 118 (13.4) | <0.001 | 0.1 |
| 1–2 | 2225 (54.9) | 413 (46.9) | ||
| 3–4 | 1208 (29.8) | 349 (39.7) | ||
| Serum sodium mEq/L(median [IQR]) | 136.00 [133, 139] | 137.00 [134, 140] | <0.001 | 11.6 |
| Diabetes (%) | ||||
| No | 3084 (77.3) | 608 (70.5) | <0.001 | 1.7 |
| Yes | 904 (22.7) | 255 (29.5) | ||
| Dialysis prior week (%) | ||||
| No | 1709 (42.2) | 313 (35.5) | <0.001 | 0 |
| Yes | 2343 (57.8) | 569 (64.5) | ||
| Serum creatinine mg/dL (median [IQR]) | 2.80 [1.70, 4.10] | 2.82 [1.57, 4.00] | 0.18 | 0 |
| Portal vein thrombosis (%) | ||||
| No | 3595 (89.3) | 745 (85.5) | 0.002 | 0.7 |
| Yes | 433 (10.7) | 126 (14.5) | ||
| Bilirubin mg/dL (median [IQR]) | 30.45 [20, 39.90] | 31.40 [20.9, 41.5] | 0.067 | 0 |
| Ascites (%) | ||||
| Absent | 281 (6.9) | 61 (6.9) | 0.053 | 0.1 |
| Slight | 1454 (35.9) | 279 (31.7) | ||
| Moderate | 2315 (57.2) | 540 (61.4) | ||
| INR (median [IQR]) race (%) | 2.90 [2.3, 3.7] | 2.80 [2.3, 3.6] | 0.044 | 0 |
| White | 3383 (83.4) | 730 (82.8) | 0.044 | 0 |
| Asian | 192 (4.7) | 40 (4.5) | ||
| Black | 424 (10.5) | 89 (10.1) | ||
| Multi | 10 (0.2) | 7 (0.8) | ||
| Native | 42 (1.0) | 13 (1.5) | ||
| Pacific | 3 (0.1) | 3 (0.3) | ||
| BMI (median [IQR]) | 28.70 [25, 33.36] | 28.09 [24.3, 33.1] | 0.021 | 0.1 |
| Albumin mg/dL(median [IQR]) | 3.20 [2.7, 3.7] | 3.10 [2.5, 3.7] | 0.008 | 0 |
| ALT (median [IQR]) | 49.00 [30.00, 82.00] | 54.00 [34.00, 104.75] | <0.001 | 32.7 |
| Previous malignancy (%) | ||||
| No | 3699 (93.9) | 789 (92.3) | 0.076 | 2.9 |
| Yes | 239 (6.1) | 66 (7.7) | ||
| Peripheral vascular disease (%) | ||||
| No | 2782 (98.7) | 637 (98.0) | 0.208 | 29.7 |
| Yes | 38 (1.3) | 13 (2.0) | ||
| TIPSS (%) | ||||
| No | 3573 (88.6) | 774 (88.5) | 0.86 | 0.6 |
| Yes | 458 (11.4) | 101 (11.5) | ||
| Cerebrovascular disease (%) | ||||
| No | 2796 (99.1) | 646 (99.2) | 0.821 | 29.6 |
| Yes | 26 (0.9) | 5 (0.8) | ||
| Variceal bleeding (%) | ||||
| No | 297 (90.0) | 80 (89.9) | 1 | 91.5 |
| Yes | 33 (10.0) | 9 (10.1) | ||
| COPD (%) | ||||
| No | 2739 (98.0) | 630 (97.2) | 0.235 | 30.2 |
| Yes | 57 (2.0) | 18 (2.8) | ||
| Kidney-liver (%) | ||||
| LI | 3418 (84.3) | 740 (83.9) | 0.76 | 0 |
| KI LI | 636 (15.7) | 142 (16.1) | ||
| Ethnicity (%) | ||||
| Nlatin | 3199 (78.9) | 708 (80.3) | 0.385 | 0 |
| Latino | 855 (21.1) | 174 (19.7) | ||
| Hypertension (%) | ||||
| No | 2186 (78.1) | 500 (77.2) | 0.6 | 30.2 |
| Yes | 613 (21.9) | 148 (22.8) | ||
| Sex (%) | ||||
| F | 1401 (34.6) | 292 (33.1) | 0.434 | 0 |
| M | 2653 (65.4) | 590 (66.9) | ||
| Angina (%) | ||||
| No | 426 (97.9) | 114 (98.3) | 1 | 88.8 |
| Yes | 9 (2.1) | 2 (1.7) | ||
| Bacterial peritonitis (%) | ||||
| No | 3424 (87.7) | 725 (85.4) | 0.078 | 3.7 |
| Yes | 481 (12.3) | 124 (14.6) | ||
| Hospitalization in prior 90 d (%) | ||||
| No | 438 (17.8) | 95 (16.6) | 0.542 | 38.7 |
| Yes | 2016 (82.2) | 476 (83.4) |
An additional 373 recipients who were followed for less than 1 yr and were alive at last follow up are not shown in this table but are included in all subsequent analyses. Factors are listed in order from highest to lowest variable importance.
ALT indicates alanine aminotransferase; BMI, body mass index; COPD, chronic obstructive pulmonary disease; INR, international normalized ratio; TIPSS, transjugular intrahepatic portosystemic shunt.
TABLE 2.
Donor Factors With Missing Data Rates and 1-yr Survival Outcomes
| level | Alive at 1 yr | Died by 1 yr | P-value | Missing (%) |
|---|---|---|---|---|
| n | 4054 | 882 | ||
| Donor age in years,(median [IQR]) | 37.00 [24, 50] | 41.00 [26, 53.8] | <0.001 | 0 |
| Cold ischemia time (h) (median [IQR]) | 6.37 [5, 8] | 6.75 [5.3, 8.5] | <0.001 | 3.8 |
| Donor COD (%) | ||||
| Anoxia | 893 (22.0) | 190 (21.5) | 0.001 | 0 |
| Cerebrovascular/stroke | 1430 (35.3) | 373 (42.3) | ||
| CNS tumor | 16 (0.4) | 3 (0.3) | ||
| Head trauma | 1641 (40.5) | 294 (33.3) | ||
| Other | 74 (1.8) | 22 (2.5) | ||
| Donor BMI (median [IQR]) | 25.87 [22.79, 29.71] | 26.01 [23.15, 30.46] | 0.115 | 0 |
| Donation after cardiac death (%) | ||||
| No | 3969 (97.9) | 850 (96.4) | 0.01 | 0 |
| Yes | 85 (2.1) | 32 (3.6) | ||
| Donor sex (%) | ||||
| F | 1564 (38.6) | 347 (39.3) | 0.675 | 0 |
| M | 2490 (61.4) | 535 (60.7) | ||
| Donor shared (%) | ||||
| No | 2499 (61.6) | 562 (63.7) | 0.267 | 0 |
| Yes | 1555 (38.4) | 320 (36.3) | ||
| Donor ethnicity (%) | ||||
| Nlatin | 3280 (80.9) | 706 (80.0) | 0.572 | 0 |
| Latino | 774 (19.1) | 176 (20.0) | ||
| Donor race (%) | ||||
| White | 3320 (81.9) | 704 (79.8) | 0.563 | 0 |
| Asian | 119 (2.9) | 30 (3.4) | ||
| Black | 569 (14.0) | 138 (15.6) | ||
| Multi | 7 (0.2) | 3 (0.3) | ||
| Native | 19 (0.5) | 4 (0.5) | ||
| Pacific | 20 (0.5) | 3 (0.3) | ||
| Donor inotropic support (%) | ||||
| No | 1865 (46.6) | 370 (42.9) | 0.05 | 1.5 |
| Yes | 2134 (53.4) | 492 (57.1) | ||
| Donor 3+ inotropic agents (%) | ||||
| No | 3294 (97.9) | 756 (97.7) | 0.681 | 16.1 |
| Yes | 71 (2.1) | 18 (2.3) | ||
| Donor CDC high risk (%) | ||||
| No | 3134 (85.0) | 689 (88.0) | 0.029 | 9.4 |
| Yes | 555 (15.0) | 94 (12.0) | ||
| Donor AST (median [IQR]) | 42.00 [25.00, 76.00] | 41.00 [25.00, 76.00] | 0.884 | 0.3 |
An additional 373 recipients who were followed for less than 1 yr and were alive at last follow up are not shown in this table but are included in all subsequent analyses. Factors are listed in order from highest to lowest variable importance.
AST indicates aspartate aminotransferase; BMI, body mass index; CDC, Centers for Disease Control; COD, cause of death.
Variable importance14 (VIMP) for each predictor was calculated by permuting the predictor’s values and measuring the resulting increase in the forest error rate. Subsampling was used to construct confidence intervals and p-values for VIMP.15 Using a 1-sided P-value ≤ 0.2 for selection, 22 predictor variables were selected and used to grow a new forest, using the same parameters as above except with 5 candidate predictors per node, to produce the final model. The VIMP P-value threshold for including a predictor variable in the final forest was chosen using the following procedure. Five imputed data sets were created by running the imputation algorithm using 5 random seeds. A RSF was grown for each data set, OOB error rates were determined, and VIMPs with P-values were extracted for each forest. Using 1-sided P-value thresholds of 0.2, 0.1, 0.05, 0.025, and 0.01, 5 new forests for each data set were grown using only the predictors that met these thresholds, and the OOB error rates and numbers of predictors selected were recorded. The results of this procedure are shown in Supplemental Figure S1, http://links.lww.com/SLA/C334. The P-value threshold of 0.2 resulted in an average of 21.2 predictors selected and produced the lowest average error rates: lower than including all 44 predictors, similar to the 0.1 and 0.05 thresholds, and lower than the more stringent 0.025 and 0.01 thresholds.
To interpret the relationships between the most important predictor variables and 1-year recipient survival, partial dependence,16 and individual conditional expectation17 plots were used for visualization. The individual conditional expectations are the OOB 1-year survival predictions for each transplant recipient created by varying the predictor variable of interest and leaving the remaining predictors unchanged. The partial dependence for that variable is then the average of the individual conditional expectations.
OOB Validation
To test the model’s ability to predict new data that were not used in estimating it, OOB predictions were used throughout the analysis. OOB prediction refers to predicting each participant’s survival using only those trees which did not include that participant, as an estimate of how well the model will predict survival for new individuals. The overall C-index and error rate, permutation VIMP, and partial dependence and individual conditional expectation plots are all computed using OOB predictions.
All analyses were conducted using R version 3.6.118 including the package randomForestSRC version 2.9.219 (Fast Unified Random Forests for Survival, Regression, and Classification). The R code used to process the SRTR data and grow the forest is available at https://github.com/ev000ans/MELD40.
RESULTS
Study Population
During the study period, 5309 patients in the United States with MELD score ≥40 received liver transplants who met inclusion criteria. Liver transplant alone was performed in 4484 patients, combined liver and kidney transplants in 825 patients. The most common causes of end-stage liver disease were hepatitis C, hepatitis B, alcohol, and nonalcoholic steatohepatitis, with hepatitis C being the most common. Table 1 shows the recipient characteristics for the study cohort by 1-year survival status and the percentage of missing data; Table 2 similarly summarizes the donor characteristics. Median recipient age and donor age were higher in those who died by 1 year after the transplant (the nonsurvivors) than in those who survived longer (the survivors) (recipient age: 56 vs 53, donor age: 41 vs 37, P < 0.001 for both). Previous abdominal surgery (56% vs 46%, P < 0.001), portal vein thrombosis (14% vs 11%, P = 0.002), dialysis within the week before transplant (64% vs 58%, P < 0.001), encephalopathy (3–4 category: 40% vs 30%, P < 0.001) and diabetes (30% vs 23%, P < 0.001) were more frequent in the non-survivors compared to survivors at 1 year.
Postoperative Outcomes
Of the 5309 patients, 882 (16.6%) died within the first year. There was no difference in survival between recipients of liver transplant alone and kidney-liver transplant (83% vs 82%, P = NS). NS). Death occurred within 30 days for 322 recipients (36% of those who died within the first year), most commonly due to cardiovascular and multisystem organ failure (Table 3). The majority of deaths between 30 days and 1 year were due to infection (28%) and multisystem organ failure (29%) (Table 3).
TABLE 3.
Causes of Death Within 1 yr After Liver Transplant
| 0–30 d (n = 322) |
31 d to 1 yr (n = 560) |
|
|---|---|---|
| Cause of death, n (%) | ||
| 1a. Sepsis: bacterial | 38 (11.8) | 146 (26.1) |
| 1b. Sepsis: fungal | 4 (1.2) | 12 (2.1) |
| 2. Cardiovascular | 84 (26.1) | 56 (10.0) |
| 3. Cerebrovascular | 25 (7.8) | 9 (1.6) |
| 4. Hemorrhage | 18 (5.6) | 12 (2.1) |
| 5. Malignancy | 1 (0.3) | 25 (4.5) |
| 6. Multisystem organ failure | 76 (23.6) | 161 (28.7) |
| 7. Brain death | 8 (2.5) | 8 (1.4) |
| 8. Pulmonary embolism | 19 (5.9) | 3 (0.5) |
| 9. ARDS | 11 (3.4) | 25 (4.5) |
| 10. Other | 38 (11.8) | 103 (18.4) |
ARDS indicates acute respiratory distress syndrome.
Forty-four donor and recipient factors were included in an RSF model of 1-year survival. VIMP was calculated for each factor and shown in Figure 1. Of the 44 predictors considered, 22 (shown in black in Fig. 1) were selected based on VIMP significance testing to be included in the final RSF model used for prediction. These predictors and their relationship to 1-year survival are shown in partial dependence plots (Figs. 2 and 3). The 1-year posttransplant survival of recipients with MELD score ≥40 improved over time, from 69% in 2001 to 87% in 2016 (Fig. 2). The strongest predictors of death within the first year included patient on mechanical ventilator, prior liver transplant, higher donor age, longer cold ischemia, higher recipient age, and donation after cardiac death (DCD) donors (Fig. 3). One-year survival was lower for patients on mechanical ventilator (77%) than for patients not on mechanical ventilator (84%). Recipient age >50 years and donor age >45 years conferred a progressive decrease in survival for each additional year of age, with 1-year survival decreasing from 86% at recipient age 50% to 67% at recipient age 75, and from 84% at donor age 45% to 76% at donor age 75. The other notable recipient factors negatively affecting survival included recipient portal vein thrombosis, previous abdominal surgery, recipient peripheral vascular disease, and recipient history of cardiac or cerebrovascular disease (Fig. 3). The OOB C-index for the final 22-predictor model was 0.662. OOB predicted 1-year survival for this cohort had a median of 84% (25th–75th percentiles 77%–90%, range 42%–99%); conditional OOB survival predictions using 2016 for transplant year had a median of 88% (25th–75th percentiles 83%–92%, range 56%–99%).
FIGURE 1.
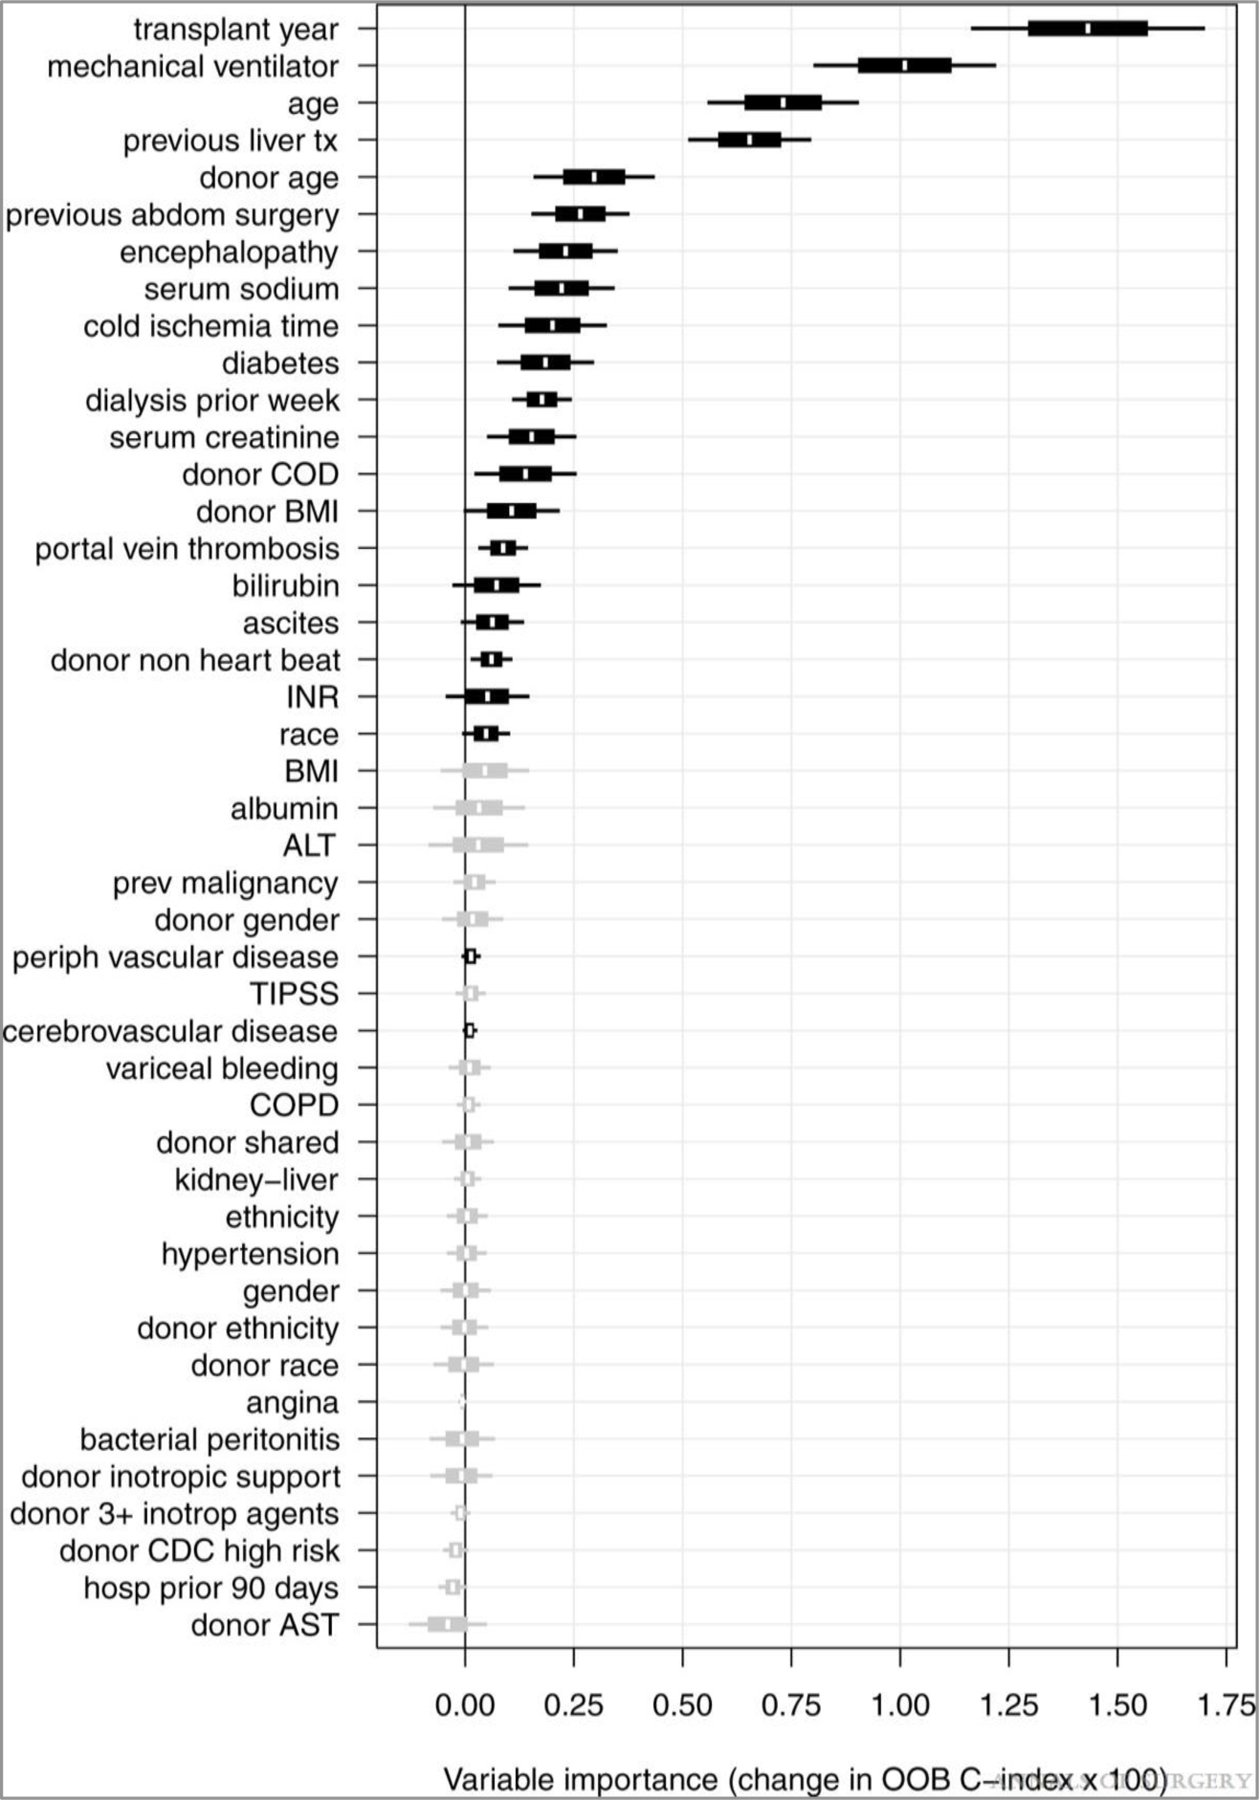
Variable importance (VIMP) plot. VIMP for the full set of 44 candidate predictors are shown with 60% (box) and 90% (whiskers) confidence intervals. Twenty-two predictors selected for the final model are shown in black.
FIGURE 2.
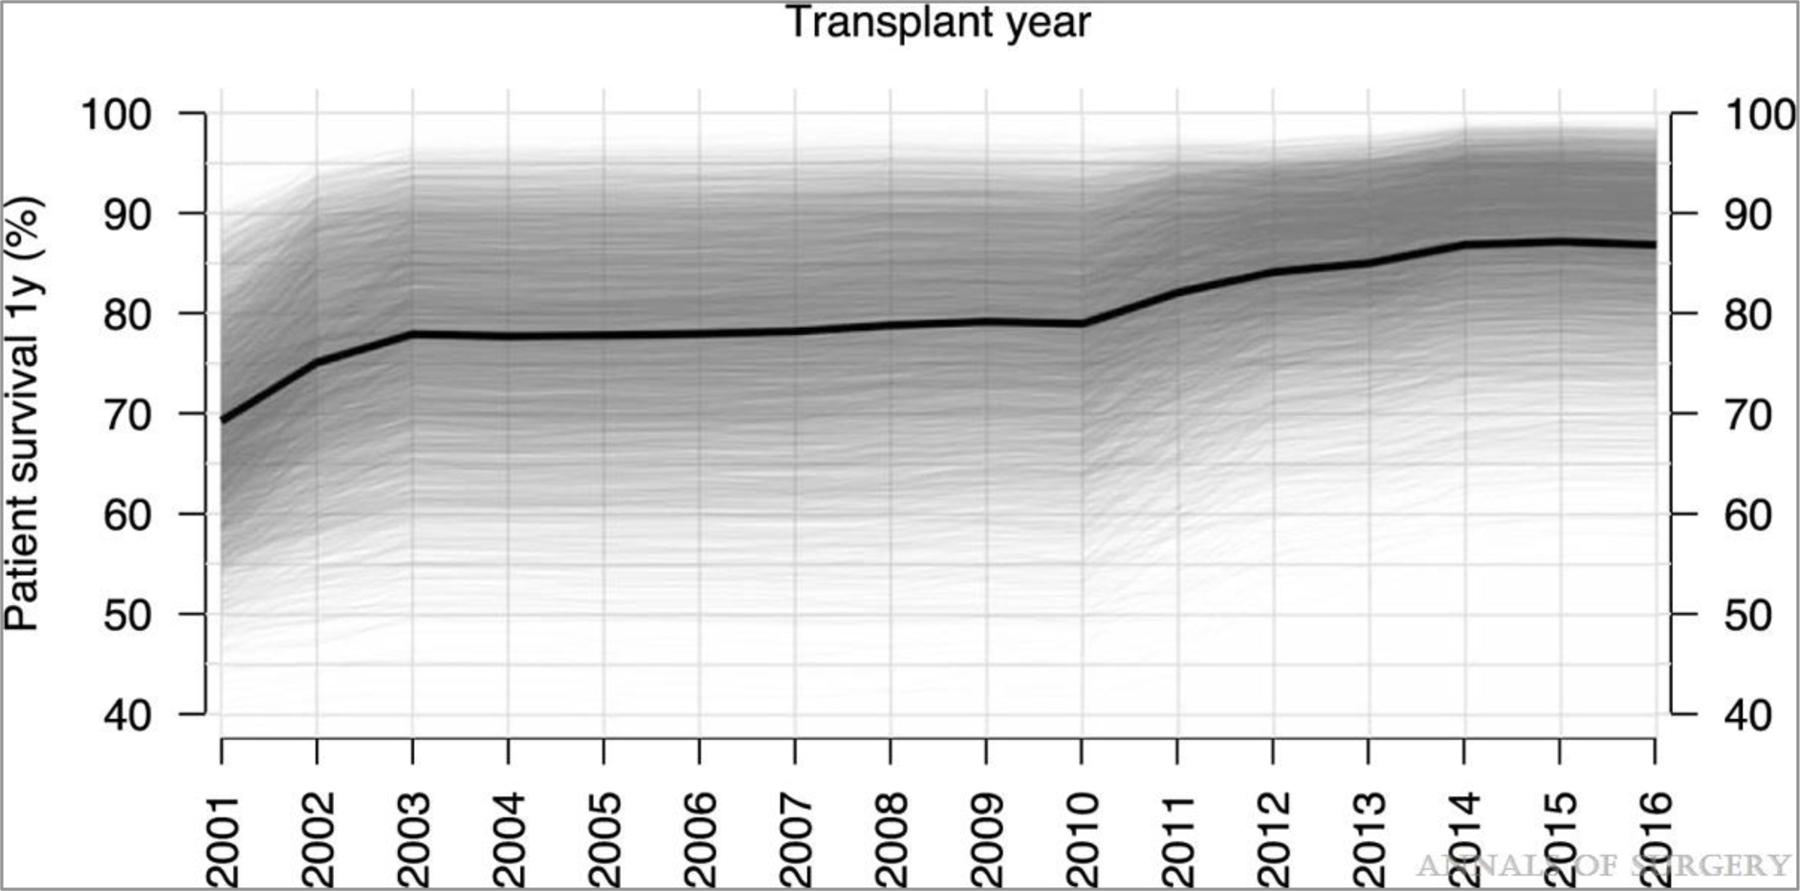
Partial 1-yr survival dependence by year of transplant. Overall partial dependence is shown in black, and individual conditional expectations in semi-transparent grey.
FIGURE 3.
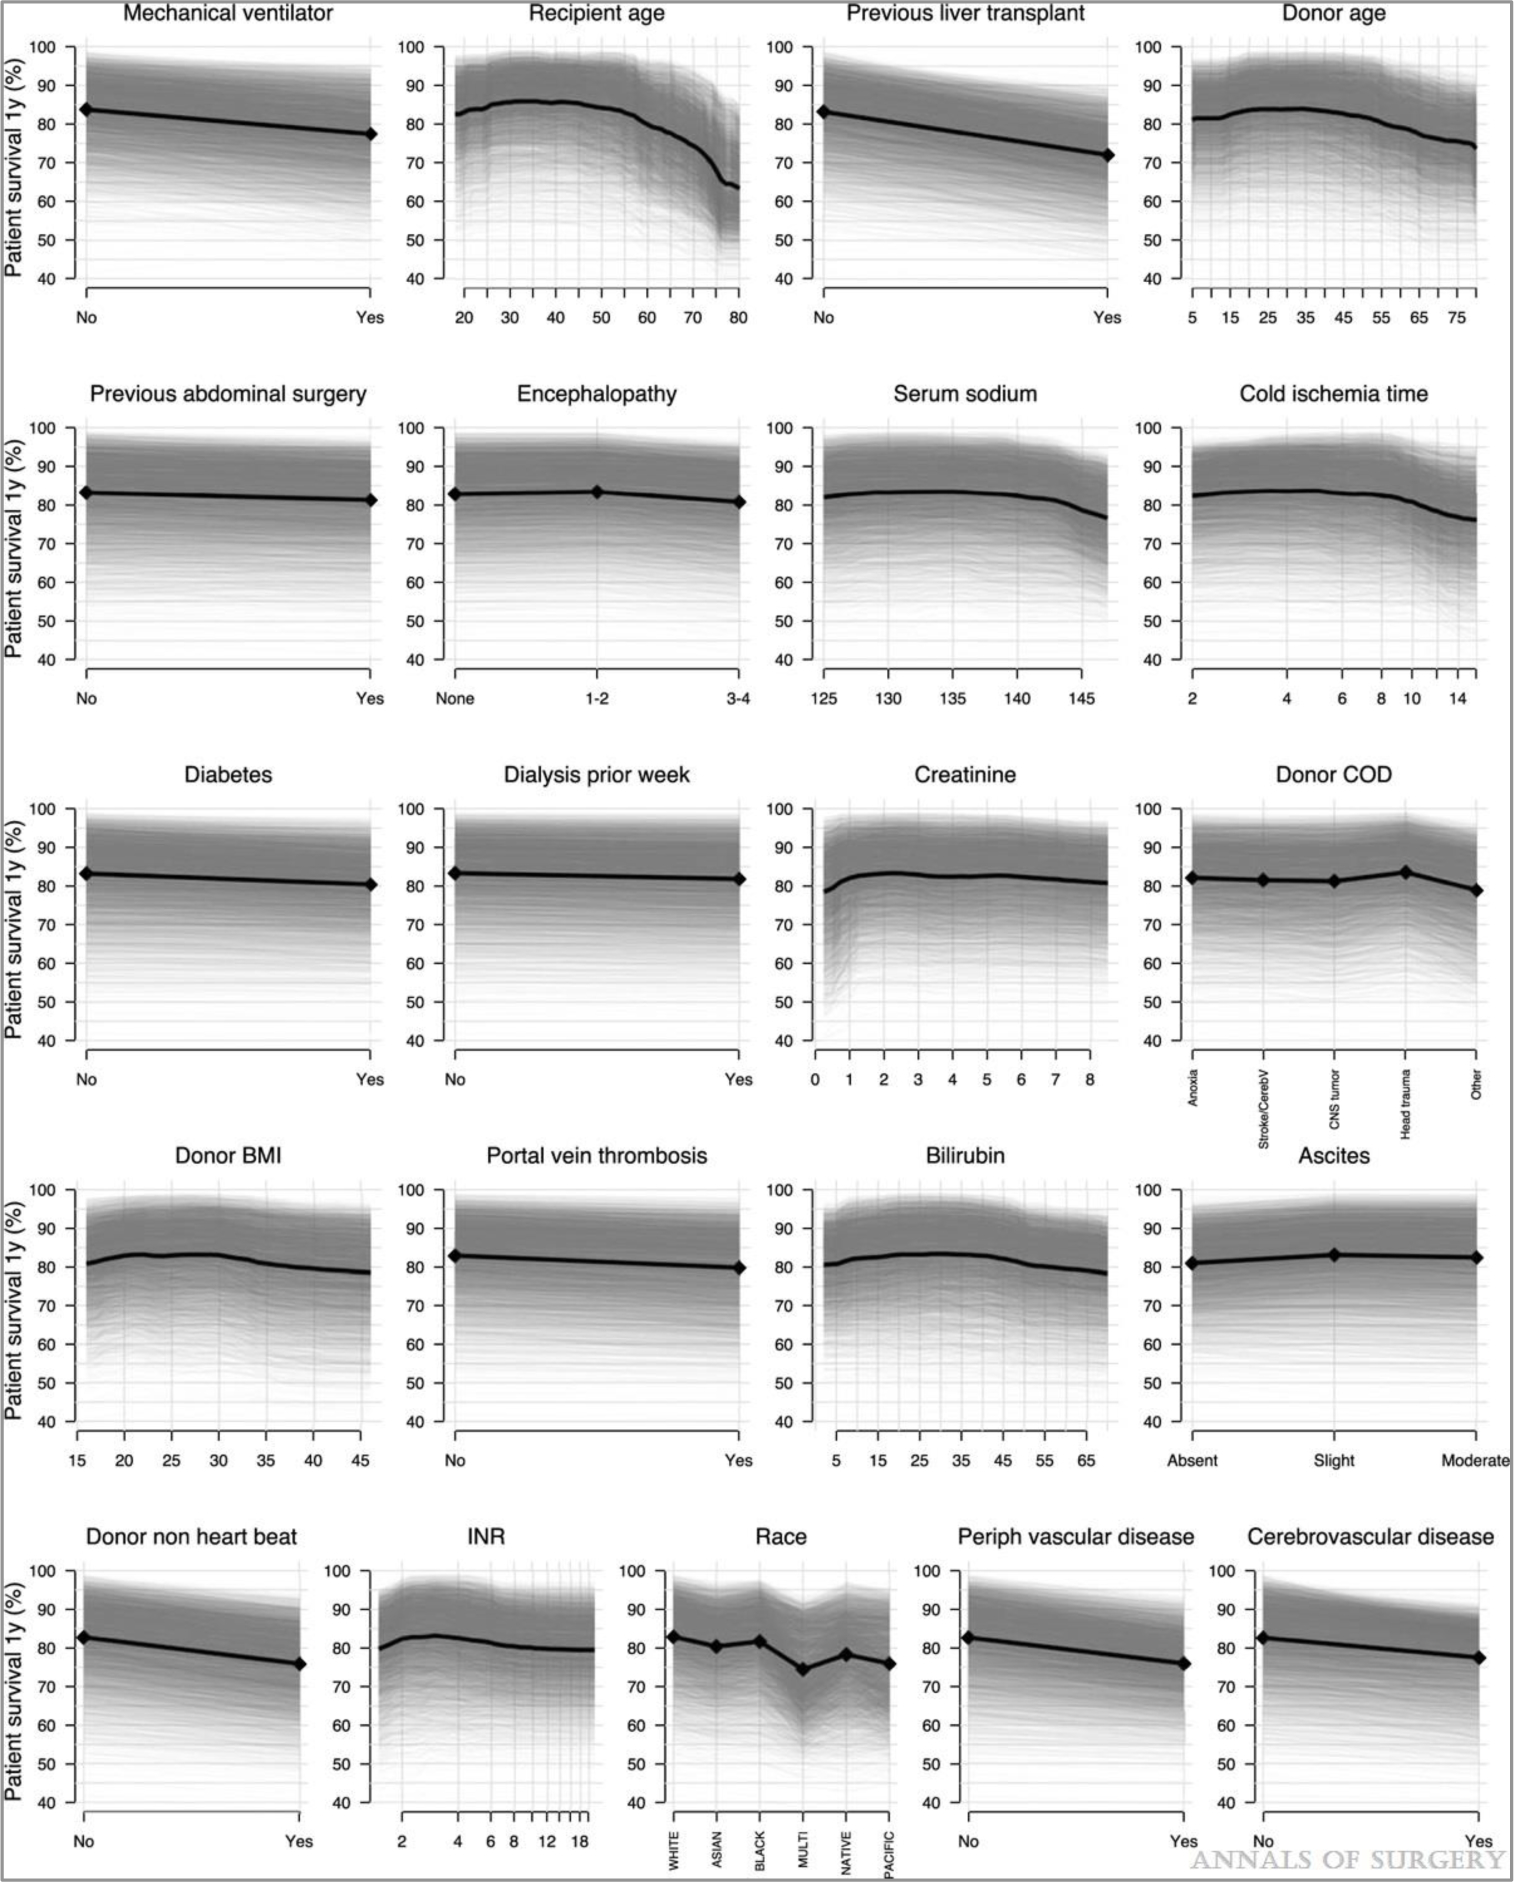
Partial 1-yr survival dependence for each predictor. Overall partial dependence for each characteristic is shown in black, and individual conditional expectations in semi-transparent grey. Panels are ordered from highest to lowest VIMP. VIMP indicates variable importance.
Prediction Model of Outcomes
Survival predictions for new cases can be obtained by passing their donor and recipient characteristics through the final 22-predictor RSF model, using the latest cohort year (2016) for the transplant year predictor to reflect current survival rates. Predicted survival curves for 4 hypothetical example cases are shown in Figure 4. Recipient 1, a lower-risk candidate based on their characteristics profile, is shown paired with either the lower-risk Donor A or higher-risk Donor B. Recipient 2, a higher-risk candidate, is paired with the lower-risk Donor C or higher-risk Donor D. Predicted survival differs across these 4 cases, with 1-year survival probabilities of 92% (1A), 82% (1B), 74% (2C), and 61% (2D).
FIGURE 4.
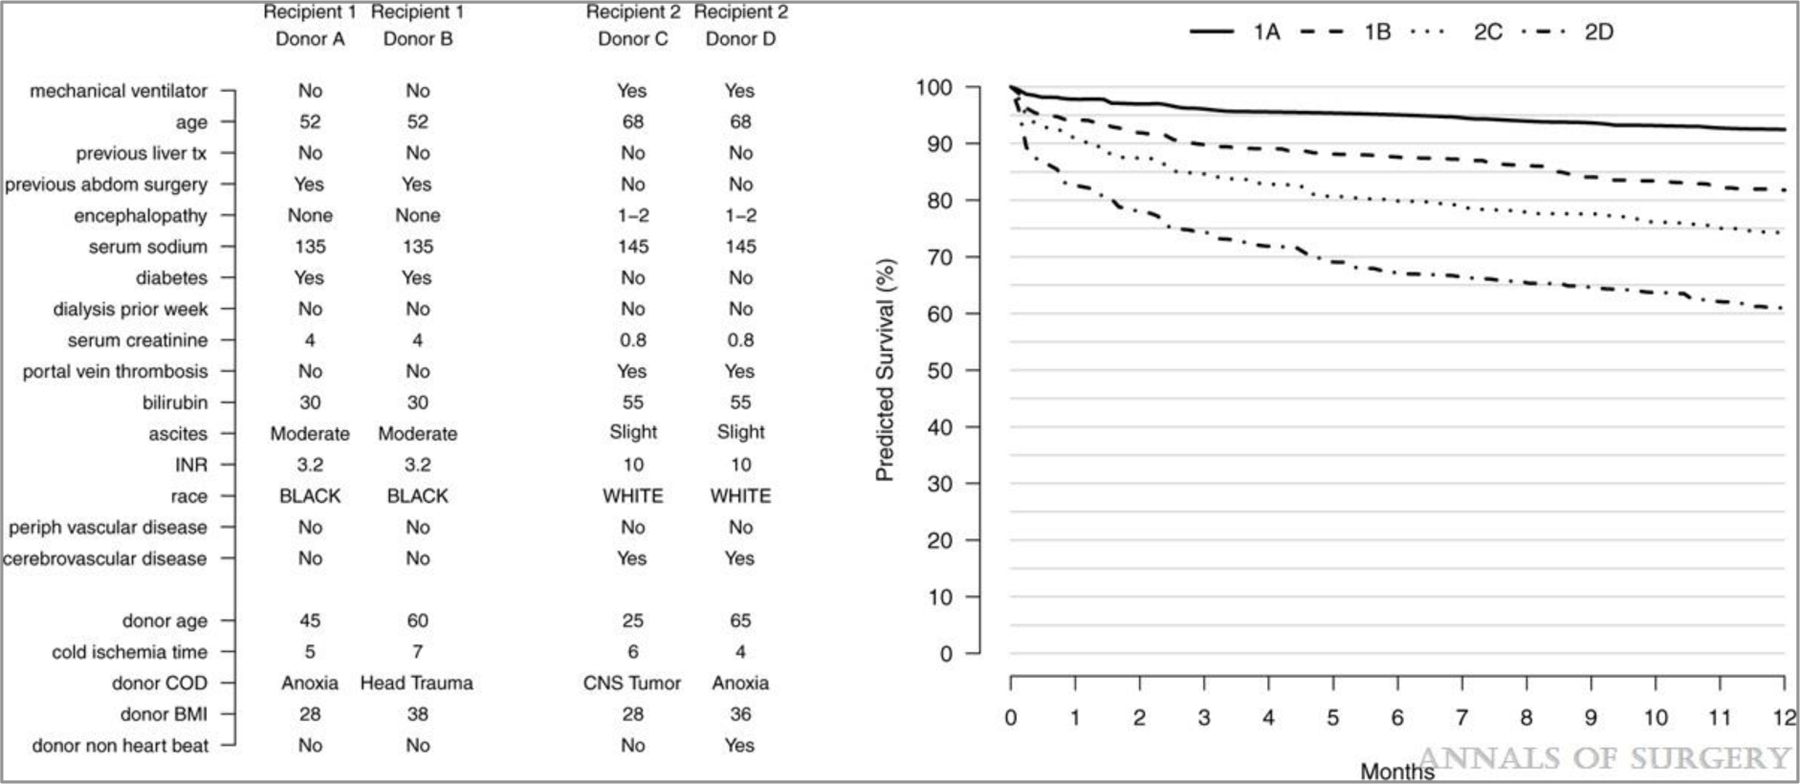
Predicting outcomes. Donor and recipient characteristics of 4 hypothetical example cases are shown on the left. Predicted survival curves for these cases are shown on the right.
DISCUSSION
In the last 2 decades, both donor and recipient phenotypes have changed. In the United States, the introduction of the MELD score and the prioritization of the sickest candidates for liver transplantation led to an increase in the number of patients with MELD ≥40 being transplanted. And there has been increased use of extended criteria donor liver grafts in order expand the donor pool and to decrease the time to transplantation.3,4 Because patient survival after transplant depends on the preoperative medical conditions of both the recipient and the donor, transplant surgeons are often faced with the difficult decision of whether to accept offers of higher-risk donor livers for high-acuity recipients or to wait for the next offer. To date, there have been a number of risk predictor models developed to predict patient survival after liver transplantation.4–7,20–24
MELD alone does not show good enough performance in identifying patients with high rates of post-liver-transplant mortality, even using uncapped MELD >40.20 D-MELD was developed as a product of 2 quantifiable variables (donor age and calculated preoperative MELD). D-MELD scoring can quickly and accurately estimate risk for various donor/recipient combinations at the bedside.21 Although the strength of D-MELD is its simplicity, the calculation ignores risk factors that we and others have shown to be significant. D-MELD has other limitations: the authors proposed to eliminate donor/recipient matches with D-MELD >1600, resulting in only donors less than 54 years old being considered for potential recipients with MELD >30. Such a policy is unrealistic because it would eliminate a significant number of donors for the high MELD population.
The SRTR offers a risk-adjusted Cox model to project patient survival after liver transplantation.25 The model combines an extensive list of donor and recipient covariates and is an effective auditing tool because a transplant program’s observed outcomes can be compared to the expected outcomes; however, predicted outcomes for individual patients are not easily obtained. In contrast, the proposed random forest modeling can be used to predict outcomes for a particular recipient and donor allograft before transplantation.
Rana et al performed a univariate and multivariate analysis on 21,673 liver transplant recipients in the SRTR database and identified 13 recipient factors, 4 donor factors, and 2 operative factors (warm and cold ischemia times) as significant predictors of 3-month recipient mortality after liver transplantation.20 The most significant risk factors were 2 previous transplants, warm ischemia time >90 minutes, and being on life support before transplant. They developed 2 different risk scores to predict survival outcomes after liver transplantation: a pre-allocation score (P-SOFT) to predict posttransplant survival outcomes for patients still on the wait list, and a score generated at the time of transplantation (SOFT) that takes into account donor factors and cold ischemia times and recipient factors.20 Warm ischemia was excluded because it cannot reliably be predicted before transplantation. The SOFT score ranged from 5 to 40 points. Using the SOFT score, the 3-month patient survival of recipients with <5 points was 97%; 6–15 points, 94%, 16–35 points 84%, 36–40 points, 62%, and with >40 points, 38%.20 This study, although comprehensive, did not specifically address the subset of patients with a MELD score of 40 or more.
Dutkowski et al evaluated 37,255 patients in the United Network for Organ Sharing database from 1987 to 2010, excluding partial liver transplants, DCD donors, combined liver transplants, and those that received exception points.7 The primary outcome was 3-month patient survival. Dutkowski et al reported that 6 factors were significant predictors: MELD score, cold ischemia time, recipient age, donor age, previous liver transplantation, and life support at the time of transplant. A balance of risk score was calculated with a range from 0 to 27 points, with scores above 18 reflecting an exponential increase in 3-month mortality.7 The strongest predictor was recipient MELD score (0–14) points, followed by retransplantation (0 or 4 points), recipient age (0–3 points), life support before transplant (0 or 3 points), and donor age (0 or 1 point). However, when validated in a single-center, the balance of risk score only had a moderate predictive accuracy.26
In a single-center study, Petrowsky et al were the first to report on risk factors specifically for liver transplant recipients with MELD ≥40.4 Among their 169 recipients, 37 (22%) had 3-month or in-hospital mortality. A multivariate analysis identified MELD score, cardiac risk, age-adjusted Charlson comorbidity index ≥6, and pretransplant septic shock as independent predictors of 3-month mortality, with the greatest risk from cardiac disorders and age-adjusted Charlson comorbidity index ≥6. Petrowsky et al’s risk index uses the following parameters: MELD per point = 0.5, pretransplant septic shock = 3 points, cardiac risk = 4 points, age-adjusted Charlson comorbidity index >6 = 5 points. A score of ≥26 identified patients with an extremely high risk, defined by a 50% death rate at 3 months posttransplant. In contrast, recipients with scores of ≤22 had an excellent 3-month survival rate of 93%. The model predicted 3-month mortality risk of 10%, 30%, and 50% of patients with scores of 20, 25, 28, respectively.4 However, the small population drawn from a single-center limits the generalizability of these results.
Our study differs from previous publications in that we examined 44 donor and recipient variables in over 5000 recipients, and we developing a risk score for 1-year rather than 3-month patient survival. Similar to Rana et al20 and Dutkowski et al, we found that retransplants, patients on mechanical ventilator before transplantation, and older recipients had inferior outcomes.7 Similar to Dutkowski et al we found that donor age and cold ischemia were important; in contrast, we found receiving a DCD donor liver was a strong predictor of 1-year mortality. And we showed that applying ensemble learning methods to variables that are easily available before transplantation, we could predict that survival of a patient using a particular donor (Fig. 3). This modeling would be helpful to make decisions for future transplants. We are currently working to implement a web-based application where users can use this model to produce predicted 1-year survival curves based on the donor and recipient factors they enter.
Given the current scarcity of livers, a consideration is whether high-acuity recipients should be prioritized for a second transplantation over similarly high-acuity recipients waiting for their first transplant, who have a much better prognosis after transplantation. Balancing the interests of individual patients with those of all patients on the waitlist is always a struggle.
Our study was limited to variables included in the SRTR database, and there may be other important predictors of survival that were not accounted for in this analysis. For example, we did not have information about donor steatosis, although we used donor body mass index as a surrogate marker. Of importance, for the factors included, very few data points were missing. Outcomes may also have be influenced by center-specific effects, and this was not considered in this analysis.
In summary, liver transplant outcomes for patients with MELD score ≥40 continue to improve. Ensemble learning methods can identify recipient and donor-specific factors that can be used to predict survival probabilities for future transplant recipients. These predictions may allow for improved confidence of the surgeon to proceed with transplantation of MELD ≥40 patients, and provide information to improve informed consent.
Supplementary Material
ACKNOWLEDGMENT
The authors thank Ellen R. Florek, BA for valuable assistance in preparation of the manuscript.
This research was supported by the National Institutes of Health's National Center for Advancing Translational Sciences, grant UL1TR002494. The content is solely the responsibility of the authors and does not necessarily represent the official views of the National Institutes of Health's National Center for Advancing Translational Sciences.
Footnotes
The authors declare no conflict of interest.
Supplemental digital content is available for this article. Direct URL citations appear in the printed text and are provided in the HTML and PDF versions of this article on the journal’s Web site (www.annalsofsurgery.com).
REFERENCES
- 1.Wiesner R, Edwards E, Freeman R, et al. Model for end-stage liver disease (MELD) and allocation of donor livers. Gastroenterology. 2003;124:91–96. [DOI] [PubMed] [Google Scholar]
- 2.Leventhal TM, Florek E, Chinnakotla S. Changes in liver allocation in United States. Curr Opin Organ Transplant. 2020;25:52–58. [DOI] [PubMed] [Google Scholar]
- 3.Edwards EB, Harper AM, Hirose R, et al. The impact of broader regional sharing of livers: 2-year results of “Share 35”. Liver Transpl. 2016;22:399–409. [DOI] [PubMed] [Google Scholar]
- 4.Petrowsky H, Rana A, Kaldas FM, et al. Liver transplantation in highest acuity recipients: identifying factors to avoid futility. Ann Surg. 2014;259:1186–1194. [DOI] [PubMed] [Google Scholar]
- 5.Artru F, Samuel D. Approaches for patients with very high MELD scores. JHEP Rep. 2019;1:53–65. [DOI] [PMC free article] [PubMed] [Google Scholar]
- 6.Feng S, Goodrich NP, Bragg-Gresham JL, et al. Characteristics associated with liver graft failure: the concept of a donor risk index. Am J Transplant. 2006;6:783–790. [DOI] [PubMed] [Google Scholar]
- 7.Dutkowski P, Oberkofler CE, Slankamenac K, et al. Are there better guidelines for allocation in liver transplantation? A novel score targeting justice and utility in the model for end-stage liver disease era. Ann Surg. 2011;254:745–753. discussion 753. [DOI] [PubMed] [Google Scholar]
- 8.Ishwaran H, Kogalur U, Blackstone E, et al. Random survival forests. Ann Appl Stat. 2008;2:841–860. [Google Scholar]
- 9.Hsich E, Gorodeski EZ, Blackstone EH, et al. Identifying important risk factors for survival in patient with systolic heart failure using random survival forests. Circ Cardiovasc Qual Outcomes. 2011;4:39–45. [DOI] [PMC free article] [PubMed] [Google Scholar]
- 10.Omurlu I, Ture M, Tokatli F. The comparisons of random survival forests and Cox regression analysis with simulation and an application related to breast cancer. Expert Syst Appl. 2009;36:8582–8588. [Google Scholar]
- 11.Datema FR, Moya A, Krause P, et al. Novel head and neck cancer survival analysis approach: random survival forests versus Cox proportional hazards regression. Head Neck. 2012;34:50–58. [DOI] [PubMed] [Google Scholar]
- 12.Scheffner I, Gietzelt M, Abeling T, et al. Patient survival after kidney transplantation: important role of graft-sustaining factors as determined by predictive modeling using random survival forest analysis. Transplantation. 2020;104:1095–1107. [DOI] [PubMed] [Google Scholar]
- 13.Mark E, Goldsman D, Gurbaxani B, et al. Using machine learning and an ensemble of methods to predict kidney transplant survival. PLoS One. 2019;14:e0209068. [DOI] [PMC free article] [PubMed] [Google Scholar]
- 14.Breiman L Random forests. Mach Learn. 2001;45:5–32. [Google Scholar]
- 15.Ishwaran H, Lu M. Standard errors and confidence intervals for variable importance in random forest regression, classification, and survival. Stat Med. 2019;38:558–582. [DOI] [PMC free article] [PubMed] [Google Scholar]
- 16.Friedman J Greedy function approximation: a gradient boosting machine. Ann Stat. 2001;29:1189–1232. [Google Scholar]
- 17.Goldstein A, Kapelner A, Bleich J, et al. Peeking inside the black box: visualizing statistical learning with plots of individual conditional expectation. J Comput Graph Stat. 2015;24:44–65. [Google Scholar]
- 18.The R Project for Statistical Computing. Available at: https://www.r-projec-t.org/. Accessed 2020.
- 19.Ishwaran H, Kogular U. RandomForestSRC: Fast Unified Random Forests for Survival, Regression, and Classification (RF-SRC). Published 2019. Available at: https://rdrr.io/cran/randomForestSRC/. Accessed December 1, 2019.
- 20.Rana A, Hardy MA, Halazun KJ, et al. Survival outcomes following liver transplantation (SOFT) score: a novel method to predict patient survival following liver transplantation. Am J Transplant. 2008;8:2537–2546. [DOI] [PubMed] [Google Scholar]
- 21.Halldorson JB, Bakthavatsalam R, Fix O, et al. D-MELD, a simple predictor of post liver transplant mortality for optimization of donor/recipient matching. Am J Transplant. 2009;9:318–326. [DOI] [PubMed] [Google Scholar]
- 22.Ghobrial RM, Gornbein J, Steadman R, et al. Pretransplant model to predict posttransplant survival in liver transplant patients. Ann Surg. 2002;236:315–322. discussion 322–313. [DOI] [PMC free article] [PubMed] [Google Scholar]
- 23.Lau L, Kankanige Y, Rubinstein B, et al. Machine-learning algorithms predict graft failure after liver transplantation. Transplantation. 2017;101:e125–e132. [DOI] [PMC free article] [PubMed] [Google Scholar]
- 24.de Boer JD, Braat AE, Putter H, et al. Outcome of liver transplant patients with high urgent priority: are we doing the right thing? Transplantation. 2019;103:1181–1190. [DOI] [PubMed] [Google Scholar]
- 25.Scientific Registry of Transplant Recipients. 2020. Available at: https://www.srtr.org/. Accessed April 4, 2020.
- 26.Jochmans I, Monbaliu D, Pirenne J. The balance of risk score for allocation in liver transplantation. Ann Surg. 2014;259:e34. [DOI] [PubMed] [Google Scholar]
Associated Data
This section collects any data citations, data availability statements, or supplementary materials included in this article.