

Abstract
Osteoarthritis is increasingly viewed as a heterogeneous disease with multiple phenotypic subgroups. Obesity enhances joint degeneration in mouse models of post-traumatic osteoarthritis (PTOA). Most models of PTOA involve damage to surrounding tissues caused by surgery/fracture; it is unclear if obesity enhances cartilage degeneration in the absence of surgery/fracture. We used a non-surgical animal model of load-induced PTOA to determine the effect of obesity on cartilage degeneration two weeks after loading. Cartilage degeneration was caused by a single bout of cyclic tibial loading at either a high or moderate load magnitude in adult male mice with severe obesity (C57Bl6/J+high fat diet), mild obesity (toll-like receptor 5 deficient, TLR5KO), or normal adiposity (C57Bl6/J mice+normal diet and TLR5KO mice in which obesity was prevented by manipulation of the gut microbiome). Two weeks after loading, cartilage degeneration occurred in limbs loaded at a high magnitude, as determined by OARSI scores (p<0.001). However, the severity of cartilage damage did not differ among groups. Osteophyte width and synovitis of loaded limbs did not differ among groups. Furthermore, obesity did not enhance cartilage damage in limbs evaluated six weeks after loading. Constituents of the gut microbiota differed among groups. Our findings suggest that, in the absence of surgery/fracture, obesity may not influence cartilage loss after a single mechanical insult, suggesting that either damage to surrounding tissues or repeated mechanical insult are necessary for obesity to influence cartilage degeneration. These findings further illustrate heterogeneity in PTOA phenotypes and complex interactions between mechanical/metabolic factors in cartilage loss.
Keywords: Microbiome, obesity, cartilage, osteoarthritis, post-traumatic osteoarthritis
INTRODUCTION
Osteoarthritis is characterized by degradation of joint cartilage and surrounding tissues. Although the symptoms of osteoarthritis are well defined, osteoarthritis is a heterogeneous disease characterized by multiple phenotypic subgroups1. Subgroups of osteoarthritis are distinguished by the primary contributor to pathophysiology, such as aging, trauma, or alterations to cartilage, synovium, or subchondral bone1. Although phenotypic subgroups of osteoarthritis have been proposed, relatively little is known about differences in pathogenesis among subgroups.
Post-traumatic osteoarthritis (PTOA) is caused by an initiating trauma that may include mechanical damage to cartilage, articular fracture, bone fracture and/or injury to surrounding soft tissues2,3. Following the traumatic event, a catabolic response leads to inflammation and cell death in cartilage, followed by an anabolic response2. The magnitude of catabolic and anabolic response following injury is influenced by the degree of damage to surrounding tissues.
Obesity has been implicated as a contributor to PTOA1. Individuals with obesity and/or metabolic syndrome have a greater risk of developing osteoarthritis, suggesting that factors associated with metabolic syndrome modulate the effects of mechanical loading on joint degeneration4–6. Obesity is thought to contribute to PTOA by causing increased local/systemic inflammation7.
Animal models provide a useful tool for to understand the role of obesity in the development of osteoarthritis. Most animal models of PTOA involve surgical trauma or fracture8. Animal models that initiate osteoarthritis through surgery (destabilization of the medial meniscus, DMM) or fracture involve injury and associated inflammatory responses in neighboring non-cartilaginous tissues. In mice, diet-induced obesity increases the progression of cartilage degeneration following DMM9, non-surgical intra-articular fracture10 and meniscal/ligamentous injury11. These findings suggest that local and/or circulating factors in obesity enhance osteoarthritis in the joint. A limitation of these studies is the inclusion of surgical trauma and/or fracture; yet the majority of PTOA cases in humans are not associated with such severe damage2. Therefore, non-invasive models that do not involve fracture may be more representative of human osteoarthritis8.
Cartilage degeneration mimicking osteoarthritis in humans can be generated in mice without surgery or fracture through direct application of loads to the knee joint12–14. An advantage of this approach is that the severity of cartilage degeneration can be modulated by adjusting the magnitude and frequency of applied loads12–14. Daily loading (5 min/day) or even a single, high-magnitude bout of in vivo loading leads to cartilage damage observable through histology within two weeks. We recently showed that cartilage degeneration in the mouse joint caused by daily low-magnitude loading is enhanced in animals with diet-induced obesity14. How obesity influences cartilage degeneration caused by a single bout of tibial loading is not known.
Here we examine the effects of obesity on cartilage degeneration caused by a single loading event in the absence of surgical trauma or fracture. Specifically, we ask if obesity and systemic inflammation influence early stages of cartilage degeneration after an acute mechanical overload. We expect increases in systemic inflammation associated with obesity to increase cartilage degeneration, particularly in the first few weeks after in vivo loading.
METHODS
Study Design
Animal procedures were approved by the local Institutional Animal Care and Use Committee. C57BL/6J and B6.129s1-Tlr5tm1Flv/J (TLR5KO) mice were acquired (Jackson Laboratory, Bar Harbor, ME, USA) and bred via homozygous mating in the same conventional facility to reduce variability in the gut microbiota. Breeder animals were housed in plastic cages filled with ¼-inch corn cob bedding (Andersons’ Lab Bedding, Maumee, OH, USA), provided standard laboratory chow (LM-485, Teklad Diets, Madison WI, USA), and provided an environmental enrichment hut (Ketchum Manufacturing; Brockville, ON, Canada).
The most common means of inducing obesity in mice is a high fat diet (HFD) that generates severe obesity and systemic inflammation15,16. The toll-like receptor 5 deficient mouse (TLR5KO) is a model of mild obesity17. Mild obesity and metabolic syndrome in the TLR5KO mice are a direct result of the gut microbiota; the phenotype can be removed by modulating the microbiome using chronic oral antibiotics14,17,18.
A first experiment examined the effect of different levels of adiposity on early stages of cartilage degeneration. At 4 weeks of age, male mice (n=88 total) were divided into four groups, each further divided into two load magnitudes (n=11/group, Table 1): 1) severe obesity (C57Bl6/J+HFD, HFD); 2) mild obesity (TLR5KO mouse+standard chow, TLR5KO); 3) animals with normal adiposity (C57Bl6/J+standard chow, WT); 4) TLR5KO mice with oral antibiotic dosing to disrupt the gut microbiota and prevent microbiome-induced adiposity (TLR5KO receiving antibiotics+normal diet, TLR5KO Amp+Neo). Animals on a HFD received a chow with 60% energy from fat (58Y1, Test Diet, St. Louis, MO, USA). Animals in the TLR5KO Amp+Neo group received chronic oral antibiotics in drinking water (1.0 g/L ampicillin and 0.5g/L neomycin, Millipore Sigma, Burlington, MA, USA) to prevent the development of the metabolic syndrome phenotype. Ampicillin and neomycin are poorly absorbed in the gut lining and influence the gut microbiota without directly affecting joint tissues. Assigned diets and antibiotic treatment were started at 4 weeks of age and continued until euthanasia. Animals were housed 3–4 per cage with others from the same treatment group. The study was limited to male mice because male mice are more vulnerable to weight gain and metabolic alterations resulting from a high-fat diet when compared to female mice19,20.
Table 1:
The experimental study examined four groups of animals submitted to tibial loading at two different load magnitudes (high magnitude: 9N and moderate magnitude: 6N, n=11/group/load magnitude).
| Group | Adiposity | Systemic Inflammation |
|---|---|---|
| Wild Type (WT, C57Bl/6J) | Normal | Normal |
| TLR5KO Amp+Neo | Normal | Normal |
| TLR5KO | Mild | Mild |
| High Fat Diet (HFD, C57Bl/6J) | Severe | Severe |
A second experiment of wild type (n=10) and HFD mice (n=12) was included to address potential time-dependent behavior of the development of PTOA, as observed in past studies14.
Non-surgical Induction of Cartilage Loss
At 20 weeks of age, mice were anesthetized (2% isoflurane, 1L/min) and cyclic compressive loading was applied to the left tibia to induce cartilage damage in the knee12. For the first experiment, a single bout of cyclic compressive loading was applied at one of two load magnitudes: high magnitude (9N maximum loading, n=11/group) or moderate magnitude (6N maximum loading, n=11/group). A bout of loading involved 1200 cycles at 4 Hz (5 minutes). Animals pertaining to the second experiment (WT and HFD groups only) received high-magnitude loading (9N maximum load). The right hindlimb was not mechanically loaded and served as a contralateral control. Animals from the first experiment were euthanized two weeks after loading to examine the response in the joint and animals from the second experiment were euthanized 6 weeks post-loading. Samples size was determined through a priori power analysis designed to detect an effect size of 4.2-fold difference in OARSI score as seen in a previous study12.
Upon euthanasia, knee joints and epididymal fat pads were harvested. Fecal pellets were collected one day prior to euthanasia.
Blood Serum Analysis
Blood was collected at euthanasia to measure serum concentrations of lipopolysaccharide (LPS) and serum amyloid A (SAA). Serum was analyzed at the Duke Molecular Physiology Biomarkers Shared Resource via an LPS EndoZyme kit (Hyglos; Bernried, Germany) and a Mouse SAA Quantikine ELISA kit (R&D Systems; Minneapolis, MN, USA). LPS is a microbially-derived inflammatory factor associated with increased intestinal permeability21. Serum amyloid A (SAA) is a marker of systemic inflammation22.
Epiphyseal Cancellous Bone and Subchondral Bone Plate Morphology
A subset of the specimens selected at random (n=6 per group) from the first experiment were scanned using microcomputed tomography (μCT35; Scanco Medical AG, Switzerland; 55 kVp, 145 mA, 600 ms integration time, 10 mm voxel size). Images were collected at the tibial subchondral bone plate and proximal epiphysis. A histogram directed approach was used to calculate thresholds by by mirroring the left-most point of the background curve over the maximum point (peak) of the background curve14,18. An average global threshold for all samples was used to segment mineralized and non-mineralized tissue (3506 HU for epiphysis and 2680 HU for subchondral bone plate)23. Measurements of trabecular microarchitecture of the proximal epiphysis included bone volume fraction (BV/ TV), trabecular thickness (Tb.Th), and trabecular separation (Tb.Sp). Measures of the subchondral bone plate included thickness and tissue mineral density (TMD).
Histology
Knee joints were fixed in paraformaldehyde, decalcified, and embedded in paraffin. Serial coronal sections, 6um thick, spaced at 90mm intervals were stained with Safranin O/Fast green for histological assessment through OARSI scoring24. OARSI scoring is a semi-quantitative scoring system that ranges from 0–6, where a score of 0 represents healthy cartilage and a score of 6 represents vertical clefts/erosion to the calcified cartilage extending >75% of the articular surface24. Localized thickness of cartilage was measured on 3 slides per joint, representing anterior, medial and posterior regions. The largest width of the osteophyte was measured using Osteomeasure (OsteoMetrics, Decatur, GA, USA). A subset of slides for the control and HFD groups were stained with H&E and scored for synovitis (as described elsewhere25).
Synovial fibrosis and inflammation characterized by fibroblast proliferation and the appearance of myofibroblasts is a hallmark of osteoarthritis26–28. Fibroblasts/myofibroblasts contribute to the inflammatory process in the joint as effector cells by releasing pro-inflammatory mediators28. Immunostaining to identify expansion of stromal cells and activated fibroblast/myofibroblasts in the joint capsule was performed at the Laboratory of Comparative Pathology of Weill Cornell Medicine, on a Leica Bond™ RX system using the Bond™ Polymer Refine Detection Kit (Leica Biosystems, Buffalo Grove, IL, USA). Sections were incubated with antibodies against alpha-smooth muscle actin (myofibroblast marker, Abcam, Cambridge, MA, USA) or vimentin (fibroblast marker, Cell Signaling, Danvers, MA, USA), followed by incubation with an appropriate secondary antibody and avidin-biotin complexes (Vector Laboratories, Burlingame, CA). Antibody reaction was visualized with 3–3’ Diaminobenzidine (Millipore Sigma, Burlington, MA, USA) followed by counterstaining with hematoxylin.
Gut Microbiota Analysis
Constituents of the gut microbiome are altered in conditions of obesity and are associated with susceptibility to osteoarthritis29. The gut microbiota composition was analyzed two weeks after a bout of high-magnitude loading. Microbial DNA was isolated from fecal pellets (n=6 per group, 2 per cage) using the Mo Bio PowerSoil DNA Isolation Magnetic kit (QIAGEN, Hilden, Germany). 16S rRNA libraries were prepared using the Earth Microbiome Project protocol with primers as described previously14. Paired-end 150×150 reads were imported into QIIME2 (version 2018.6) and demultiplexed. Sequences are publicly available through the Sequence Read Archive (accession number PRJNA615223, NCBI, Bethesda, Maryland, USA)30. DADA2 was used as a quality control method and poor-quality bases were trimmed. The core-metrics-phylogenetic method was used to compute diversity. Taxonomies were assigned using QIIME’s machine learning classifier trained on Greengenes sequences (version 13_8).
Statistical Analysis
The effect of load and group on OARSI score, micro-CT measures, and cartilage thickness were determined using a two-factor repeated measures ANOVA with individual included as a random effect to adjust for multiple samples per individual (JMP Pro 9.0.0). Group differences between histological scores, micro-CT measures, serum measures, body mass, and fat pad mass were determined using a one-way ANOVA with group as the factor followed by the Holm correction for multiple comparisons. Unless otherwise noted, statistical tests were performed with alpha= 0.05.
Standard statistical methods such as t-tests/ANOVA are not appropriate when comparing relative abundance of microbial taxa in the microbiome because the relative abundance sums to one31. For this reason, differences in the constituents of the microbiota among groups were determined using analysis of composition of microbes (ANCOM). ANCOM is a novel statistical framework based on compositional log-ratios that reduces the false discovery rate and increases power31. Differences between groups in the context of unweighted UniFrac distance were analyzed using permutational multivariate analysis of variance.
RESULTS
Obesity Phenotype
As expected, the HFD group was severely obese with a body mass 45% greater than WT mice (Fig. 1A). TLR5KO mice had mild obesity with an average body mass 13% greater than WT mice. HFD mice had the greatest body mass and fat pad mass (Fig. 1A–B). TLR5KO mice had a greater body mass and fat pad mass when compared to WT and TLR5KO Amp+Neo mice (Fig. 1A–B). Serum levels of SAA in the HFD mice greatly exceeded those of WT and TLR5KO Amp+Neo mice and often exceeded the range of sensitivity (6 times greater than the average in WT mice). Serum amyloid A levels in TLR5KO mice were intermediary (p<0.001, Fig. 1C). Serum lipopolysaccharide (LPS) did not differ among groups (Fig. 1D).
Figure 1:

The A) body mass and B) fat pad mass of animals 2 weeks after tibial compressive loading at a high magnitude (9N maximum load). Animals on a high fat diet were severely obese and TL5KO mice were mildly obese. C) Serum amyloid A was increased in high fat diet mice, while levels of SAA in TLR5KO were intermediary. Data points at 4000ng/mL represent samples that exceeded the measurable range for the mouse SAA ELISA; differences are reported using nonparametric analysis to include data points exceeding the measurable range. D) LPS did not differ among groups. Groups sharing the same letter are not significantly different from each other (p<0.05). Lines represent the mean value of the group.
Histology
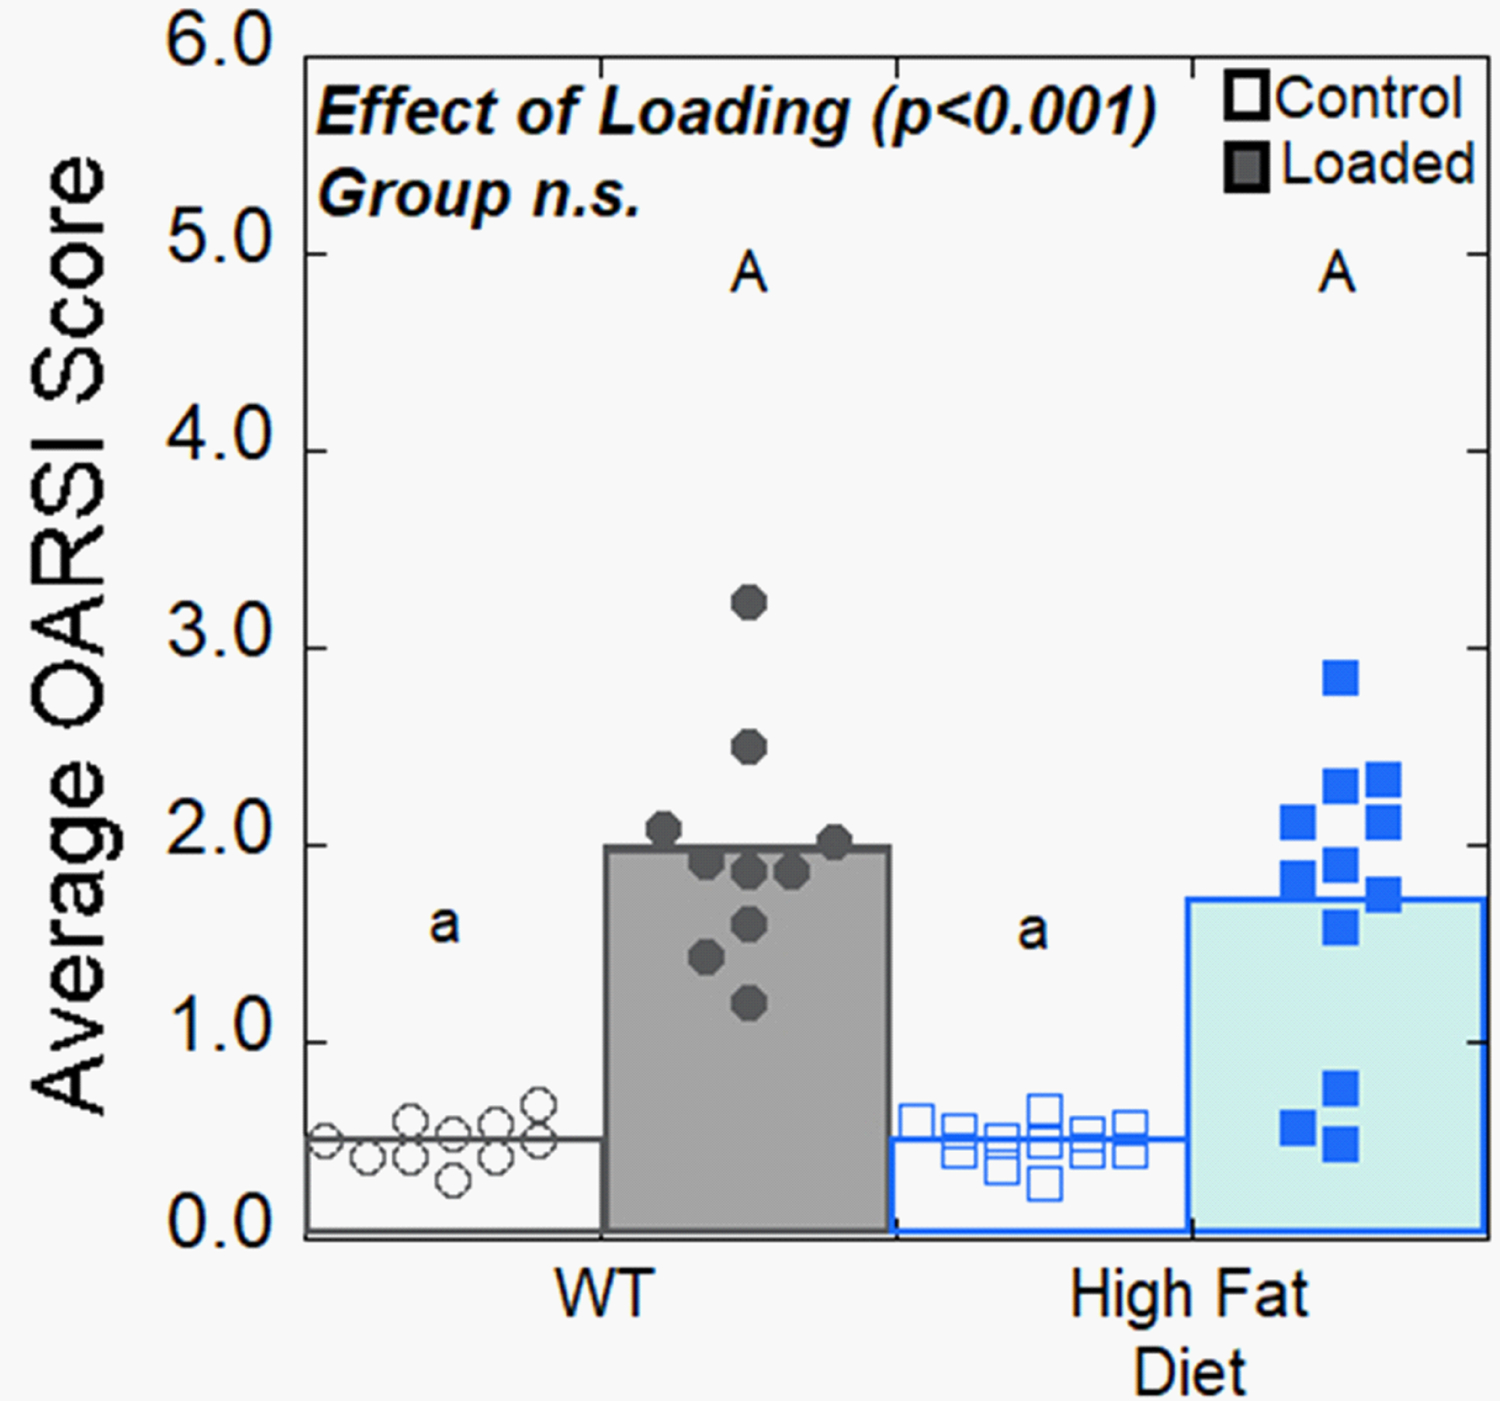
Two weeks after loading, the limbs of mice that were submitted to high-magnitude loading (9N maximum load) had cartilage degeneration as indicated by increased OARSI scores (2 times greater than control limbs, p<0.001). Loaded limbs exhibited cartilage fibrillations and loss of glycosaminoglycans. The amount of load-induced cartilage degeneration in loaded limbs did not differ among groups (Fig. 2A). Control limb OARSI scores were similar among groups. Osteophytes were only present on loaded limbs; osteophyte width was similar among groups (Fig. 2B). Cartilage thickness was decreased by 6.5% in loaded limbs (p<0.001, Fig. 2C). WT mice had lower cartilage thickness in both control and loaded limbs when compared to other groups (p < 0.001, on average WT cartilage thickness was 3.7% lower for control limbs and 4.6% for loaded limbs). Synovitis scores for WT and HFD groups were increased in loaded limbs, but the severity of synovitis did not differ among groups (Fig. S1A). Loaded limbs of HFD and WT mice had increased expansion of stromal cells through vimentin+ immunostaining at the joint lining when compared to control limbs, but there was no difference between groups. Immunostaining for activated fibroblasts/myofibroblasts did not differ between HFD and WT mice (Fig. S1B).
Figure 2:

Osteoarthritic joint pathology at two weeks after a single bout of high-magnitude loading (9N maximum load) is shown. A) Loading increased OARSI scores indicating joint damage, but loaded limb OARSI scores did not noticably differ among groups. Representative histological sections for OARSI scores of 0, 2 and 6 are shown on the right (yellow triangles indicate vertical clefts, yellow arrows indicate sever cartilage loss, samples taken from WT group). B) Loaded limbs developed osteophytes; osteophyte width was similar among groups. C) Cartilage thickness in loaded and control limbs was lower in the wild type mice. Open symbols represent control limbs; solid symbols represent loaded limbs. Solid bars represent mean value of loaded limbs for the group; white bars represent mean value of control limbs. Groups sharing the same letter are not significantly different from each other (p<0.05); lowercase letters refer to comparisons among control limbs, while uppercase letters indicate comparisons among loaded limbs.
In mice examined six weeks after a single bout of high-magnitude loading (9N maximum load), OARSI scores in the loaded limbs were 3.8 times greater than control limbs and similar in magnitude to those of loaded limbs at two weeks. No differences in OARSI scores were observed between loaded limbs in animals fed a HFD and those on a normal diet (Fig. 3).
Figure 3:
Osteoarthritic joint pathology at six weeks after a single bout of high-magnitude loading (9N maximum load) is shown. Loading increased OARSI score, but no differences in loaded limb OARSI scores were observed between groups. Open symbols represent control limbs; solid symbols represent loaded limbs. Solid bars represent mean value of loaded limbs for the group; white bars represent mean value of control limbs.
Limbs subjected to a bout of moderate-magnitude loading (6N maximum load) did not have OARSI scores different from control limbs at two weeks after loading (Fig. S2A). Osteophytes were observed in limbs loaded at the lower magnitude (p<0.001). Osteophyte width did not differ among groups (Fig. S2B).
Epiphyseal Cancellous Bone and Subchondral Bone Plate Morphology
Two weeks after high-magnitude loading, epiphyseal bone volume fraction (BV/TV) was reduced by 18% when compared to control limbs (p=0.001, Fig. 4A). Loaded limb BV/TV was greater in WT mice. BV/TV was lower in control limbs of HFD mice compared to WT and TLR5KO mice. Control limbs in WT mice had similar BV/TV to TLR5KO and TLR5KO Amp+Neo mice. Loading was associated with a 4.5% increase in trabecular separation (p=0.004, Fig. 4B). Trabecular separation in loaded limbs did not differ among groups. Loading was associated with an 8.34% decrease in trabecular thickness (p=0.001, Fig. 4C). Trabecular thickness was 10.9% lower in limbs from TLR5KO Amp+Neo when compared to other groups. The effect of loading on subchondral bone thickness was dependent on the group (p=0.044, Fig. 4D). WT mice had the greatest subchondral bone thickness in both loaded (20.2% increase) and control (16.0% increase) limbs compared to other groups. In loaded limbs, TLR5KO Amp+Neo, TLR5KO and HFD mice had similar subchondral bone plate thickness (Fig. 4D). Loading was associated with a 5.1% decrease in subchondral bone plate TMD (p<0.001, Fig. 4E). Control and loaded limbs of TLR5KO Amp+Neo had lower TMD compared to HFD and WT (Fig. 4E).
Figure 4:

Measures of epiphyseal and subchondral bone two weeks after a single bout of high-magnitude loading (9N maximum load) are shown. A) Bone volume fraction in loaded limbs was greater in wild type mice, while bone volume fraction in control limbs was lowest in high fat diet mice. B) Trabecular separation did not differ among groups in loaded limbs. C) Control limbs and loaded limbs from TLR5KO Amp+Neo mice had lower trabecular thickness. D) Wild type mice had a greater subchondral bone plate thickness (mm) when compared to other groups. E) Control and loaded limbs of TLR5KO Amp+Neo had lower subchondral bone plate TMD compared to HFD and WT. Groups sharing the same letter are not significantly different from each other (p<0.05). Lowercase letters indicate comparisons among control limbs, while uppercase letters indicate comparisons among loaded limbs.
Gut Microbiota Analysis
Constituents of the gut microbiota differed among groups. At the phylum level, Verrucomicrobia, Proteobacteria, Tenericutes and Actinobacteria were differentially abundant across groups (Fig. 5A). Principal coordinate (PCoA) analysis of unweighted UniFrac distance indicates community dissimilarity (beta diversity) that incorporates phylogenetic relationships. HFD mice and TLR5KO Amp+Neo mice had distinct microbial compositions from each other (p=0.002) and from both WT (p<0.005) and TLR5KO mice (p<0.004) (Fig. 5B). Community richness, represented by Shannon diversity (alpha diversity), was reduced by 50.1% in TLR5KO Amp+Neo mice (Fig. 5C). At the class level, Verrucomicrobiae, Gammaproteobacteria, Erysipelotrichi, Mollicutes, Actinobacteria and Coriobacteriia were differentially abundant across groups (Fig. S3). The genus Adlercreutzia, which has been found to be associated with increased body mass index in humans, was only present in HFD mice32.
Figure 5:

A) The gut microbial taxa at a phylum level of animals 2 weeks after tibial compressive loading at a high magnitude is shown. Each column represents the gut microbiota composition of a single mouse. An asterisk * represents features in the phylum taxonomic level that are differentially abundant across sample groups (detected with ANCOM). B) Principal coordinate analysis using unweighted UniFrac distance is shown. C) Bacterial diversity decreased in TLR5KO Amp+Neo mice via Shannon diversity measures.
DISCUSSION
We examined early stages of cartilage degeneration under conditions of obesity after an acute mechanical overload in the absence of surgical trauma or fracture. Severe/mild obesity did not enhance cartilage degeneration (indicated by OARSI score), suggesting limited effects of obesity on PTOA generated without severe damage to surrounding tissues as seen with surgery/fracture.
Our finding contrasts with prior studies showing enhanced joint degeneration in obese animals following PTOA induced by surgical trauma or joint fracture9,10. The current study differs from prior studies in: 1) the effect of obesity on the inflammation to surrounding joint tissues, 2) the effect of the stimulus on the biomechanical environments in the joint, 3) the magnitude of cartilage damage in obese mice, and 4) time after stimulus used to induce osteoarthritis. Regarding the severity of inflammation in the surrounding joint tissues, fracture-induced PTOA is associated with large increases in joint inflammation. Using an intra-articular fracture model, obesity increased synovial inflammation10. Although synovitis and inflammation can occur in association with an initial DMM surgery, DMM can have differential effects on joint inflammation, as demonstrated by two reports, one showing low-level synovitis following DMM33 while another did not find differences in synovitis34. Obesity increases synovial thickness and synovial inflammation in DMM9. In our study, obesity did not increase joint degeneration-induced synovial inflammation. We also did not detect an effect of obesity on the amount of activated fibroblasts/myofibroblasts in the synovium. These findings suggest that the effect of obesity on joint inflammation may depend on adaptive and healing processes activated through surgical/fracture techniques, although local measures of inflammatory molecules would be useful in further interpreting our results.
Osteoarthritis induced by surgery/fracture leads to alterations to subchondral bone, ligaments, menisci, joint capsule, and/or cartilage that cause sustained changes in mechanical stresses distributed within the joint. DMM disrupts joint structures, such as the infrapatellar fat pad, meniscotibial ligament and meniscus, that alter the stability of the joint. After DMM, the joint attempts to restabilize, resulting in uneven bone surfaces, abnormal patella shape, osteophyte formation, bone sclerosis and associated alterations in load distributions within the joint35. Intra-articular fracture models are also associated with alterations in mechanical stress within the joint as a result of changes in gait and presence of a fracture callus36,37. In contrast, tibial loading does not injure stabilizing tissues in the joint or change the gait of the loaded limb38,39, and changes in joint mechanics are limited to the development of osteophytes, which are thought to stabilize the joint rather than contribute to the progression of cartilage loss40,41. Although tibial loading changes joint structures, the apparent changes in joint biomechanics are not as severe as models that disrupt the joint capsule or fracture tissue. Another difference when comparing tibial loading applied for a single bout and models involving daily tibial loading, surgery, or tibial fracture is the magnitude of the mechanical stimulus.
The magnitude of change of cartilage loss varies across different models of PTOA. Surgical DMM resulted in a 58% increase in cartilage damage in obese mice when compared to lean mice9. Intra-articular fracture increased cartilage damage in obese mice by 80% when compared to lean mice10. The application of daily tibial loading for 6 weeks increased cartilage damage in obese mice by 35% when compared to lean mice14; however, a single bout of tibial loading in our study did not enhance cartilage damage in obese mice. The effect of obesity on cartilage degeneration may be due to interactions between mechanical and biological processes that depend on the model used to induce osteoarthritis. The presence or absence of a persistent altered joint biomechanical environment may explain the differences in magnitude of cartilage damage in different osteoarthritis models. Differences in the magnitude of change in cartilage damage show the importance of considering the technique used to induce PTOA to study the effect of obesity on cartilage damage. Although cartilage damage was not increased with obesity in our experiment, the model did promote greater cartilage degeneration than that seen by Guss and colleagues (in which obesity enhanced joint degeneration), making it unlikely that the absence of an effect of obesity was the result of the more mild form of cartilage loss as compared to DMM.
Another difference in our approach is the time period between the stimuli used to induce osteoarthritis and examination of the joint. Prior studies examined joint degeneration 8–12 weeks after surgery/fracture when severe osteoarthritis was established. The current study examined early stage joint degeneration (two weeks after induction), when catabolic processes within the joint are thought to dominate, yet damage to the cartilage is evident through histology. The short time period examined in the current study is unlikely to explain the differences from prior work because the second experiment examining joints six weeks after loading did not indicate an effect of obesity on severity of cartilage damage. Hence, in prior work the effect of obesity on cartilage degeneration was likely associated with damage and responses to surrounding tissues and/or changes in habitual stresses within the joint.
Our study is among the first to examine the gut microbiome in a mouse model of osteoarthritis in the context of obesity. Obese mice and antibiotic treated mice showed substantial differences in the taxanomic composition of the gut microbiota from each other and untreated animals. We did not associate components of the gut microbiota with osteoarthritis in this study because we did not observe differences in OARSI scores among groups. In a recent study, obesity-induced enhancement of joint degeneration following DMM was prevented through modulation of the gut microbiota by prebiotics9. Another study found that mice without a gut microbiota (germ-free) had reduced osteoarthritis severity following DMM42. Guss and colleagues studied the effects of obesity, metabolic syndrome and the microbiome on a tibial loading model of osteoarthritis14. In addition to observing enhanced joint degeneration in animals with severe obesity, oral antibiotic dosing applied to TLR5KO mice prevented load-induced increases in cartilage damage scores after six weeks of daily loading. In our study, the TLR5KO Amp+Neo group showed similar cartilage damage as other groups. We attribute the difference to the type of loading (single load vs daily loading). The gut microbiome is a complex network of microbes hence it is difficult to attribute a propensity to cartilage damage to one phyla, class or species (a phenotype may be the result of co-occurring taxa). Furthermore, more detailed sequencing techniques that report functional components (metagenomics) or activity (transcriptomics) may be necessary to understand the complex interaction between obesity, the gut microbiota and joint degeneration.
The current study has a number of novelties that strengthen our conclusions. First, TLR5KO mice provided levels of adiposity/metabolic syndrome more similar to the human population than the HFD model which is representative of morbid obesity43,44. Second, the in-vivo loading model did not use surgery or fracture to induce osteoarthritis-like pathology of the joint. As discussed above, other commonly used approaches of generating cartilage damage involve trauma to other surrounding tissues, which our findings suggest may have a separate contribution to cartilage degeneration. Additionally, a large proportion of PTOA cases in humans do not involve articular fracture2 or surgical trauma.
Some limitations must be considered when interpreting our results. First, HFD leads to high levels of blood glucose that could influence cartilage degradation without mechanical induction of osteoarthritis through means of oxidative stress and advanced glycation end-products45. However, high levels of blood glucose were unlikely to have influenced our results because control limbs from HFD mice did not have more cartilage degradation when compared to WT. Second, load magnitude was not adjusted for differences in body weight between groups. However, it is unlikely that adjusting applied loads for body weight would alter our conclusions because we previously detected the effect of obesity on cartilage damage at a lower magnitude (4.5N daily maximum load14). Third, because we used coronal sections to analyze cartilage degradation and osteophytes, we did not evaluate HFD-induced changes in the infrapatellar fat pad and the contribution of these changes to osteoarthritis. The infrapatellar fat pad from patients with knee osteoarthritis produces catabolic and inflammatory factors46–48and a pro-fibrotic phenotype that predates structural changes in articular cartilage in animals fed a HFD49. However, cartilage damage, subchondral bone changes and osteophyte formation observed through histology remain the primary indicators of osteoarthritis.
In the context of a variety of models, our findings suggest a complicated relationship between mechanical loading, obesity/systemic inflammation and cartilage degeneration in PTOA. The current study suggests that obesity and associated systemic inflammation does not always enhance joint degeneration, placing greater focus on the contributions of remodeling and repair processes in neighboring tissues (synovium/bone) and the effects of sustained changes in joint mechanics in obesity-associated osteoarthritis. The current study is consistent with recent lines of thought that osteoarthritis is not a homogeneous disease and displays multiple subgroups. Specifically, the current study suggests differences in trauma-driven osteoarthritis, synovitis-driven osteoarthritis and osteoarthritis associated with metabolic phenotypes1, and illustrates one method of differentiating among the three phenotypes in an animal model. Further understanding of PTOA as a heterogeneous disorder may help to indicate interventions directed toward the underlying causes and resulting improvements in disease prevention.
Supplementary Material
Acknowledgements
This research was supported in part by the Office of the Assistant Secretary of Defense for Health Affairs through the office of the Congressionally Directed Medical Research Programs under award number W81XWH-15-1-0239, the National Science Foundation Graduate Research Fellowships Program under the award number DGE-1650441, the National Institute of Health National Institute of Arthritis and Musculoskeletal and Skin Diseases (NIAMS) under the award numbers R21AR073454 and R21AR071534, and the Alfred P. Sloan Foundation. The content of the work is solely the responsibility of the authors and does not necessarily represent the official views of the funding sources.
The authors thanks Lyudmila Lukashova of the HSS microCT core facility, Hao Zhou for his assistance with making gut microbiota sequences publicly available, and the Cornell CARE staff for their assistance with animal care.
Footnotes
Disclosures
All authors have no conflicts of interest.
References
- 1.Mobasheri A, Rayman MP, Gualillo O, et al. 2017. The role of metabolism in the pathogenesis of osteoarthritis. Nat. Rev. Rheumatol 13(5):302–311. [DOI] [PubMed] [Google Scholar]
- 2.Anderson DD, Chubinskaya S, Guilak F, et al. 2011. Post-traumatic osteoarthritis: Improved understanding and opportunities for early intervention. J. Orthop. Res 29(6):802–809. [DOI] [PMC free article] [PubMed] [Google Scholar]
- 3.Blaker CL, Clarke EC, Little CB. 2017. Using mouse models to investigate the pathophysiology, treatment, and prevention of post-traumatic osteoarthritis. J. Orthop. Res 35(3):424–439. [DOI] [PubMed] [Google Scholar]
- 4.Aspden RM. 2011. Obesity punches above its weight in osteoarthritis. Nat. Rev. Rheumatol 7(1):65–68. [DOI] [PubMed] [Google Scholar]
- 5.de Boer TN, van Spil WE, Huisman AM, et al. 2012. Serum adipokines in osteoarthritis; comparison with controls and relationship with local parameters of synovial inflammation and cartilage damage. Osteoarthritis Cartilage 20(8):846–853. [DOI] [PubMed] [Google Scholar]
- 6.Courties A, Gualillo O, Berenbaum F, Sellam J. 2015. Metabolic stress-induced joint inflammation and osteoarthritis. Osteoarthritis Cartilage 23(11):1955–1965. [DOI] [PubMed] [Google Scholar]
- 7.Lieberthal J, Sambamurthy N, Scanzello CR. 2015. Inflammation in Joint Injury and Post-Traumatic Osteoarthritis. Osteoarthritis Cartilage 23(11):1825–1834. [DOI] [PMC free article] [PubMed] [Google Scholar]
- 8.Christiansen BA, Guilak F, Lockwood KA, et al. 2015. Non-Invasive Mouse Models of Post-Traumatic Osteoarthritis. Osteoarthritis Cartilage 23(10):1627–1638. [DOI] [PMC free article] [PubMed] [Google Scholar]
- 9.Schott EM, Farnsworth CW, Grier A, et al. 2018. Targeting the gut microbiome to treat the osteoarthritis of obesity. JCI Insight 3(8):e95997. [DOI] [PMC free article] [PubMed] [Google Scholar]
- 10.Louer CR, Furman BD, Huebner JL, et al. 2012. Diet-Induced Obesity Significantly Increases the Severity of Post-Traumatic Arthritis in Mice. Arthritis Rheum. 64(10):3220–3230. [DOI] [PMC free article] [PubMed] [Google Scholar]
- 11.Mooney RA, Sampson ER, Lerea J, et al. 2011. High-fat diet accelerates progression of osteoarthritis after meniscal/ligamentous injury. Arthritis Res. Ther 13(6):R198. [DOI] [PMC free article] [PubMed] [Google Scholar]
- 12.Ko FC, Dragomir CL, Plumb DA, et al. 2016. Progressive cell-mediated changes in articular cartilage and bone in mice are initiated by a single session of controlled cyclic compressive loading. J. Orthop. Res 34(11):1941–1949. [DOI] [PMC free article] [PubMed] [Google Scholar]
- 13.Ko FC, Dragomir C, Plumb DA, et al. 2013. In vivo cyclic compression causes cartilage degeneration and subchondral bone changes in mouse tibiae. Arthritis Rheum. 65(6):1569–1578. [DOI] [PMC free article] [PubMed] [Google Scholar]
- 14.Guss JD, Ziemian SN, Luna M, et al. 2019. The effects of metabolic syndrome, obesity, and the gut microbiome on load-induced osteoarthritis. Osteoarthritis Cartilage 27(1):129–139. [DOI] [PMC free article] [PubMed] [Google Scholar]
- 15.Kim K-A, Gu W, Lee I-A, et al. 2012. High Fat Diet-Induced Gut Microbiota Exacerbates Inflammation and Obesity in Mice via the TLR4 Signaling Pathway. PLoS ONE 7(10):e47713. [DOI] [PMC free article] [PubMed] [Google Scholar]
- 16.Wang C-Y, Liao JK. 2012. A Mouse Model of Diet-Induced Obesity and Insulin Resistance. Methods Mol. Biol. Clifton NJ 821:421–433. [DOI] [PMC free article] [PubMed] [Google Scholar]
- 17.Vijay-Kumar M, Aitken JD, Carvalho FA, et al. 2010. Metabolic syndrome and altered gut microbiota in mice lacking Toll-like receptor 5. Science 328(5975):228–231. [DOI] [PMC free article] [PubMed] [Google Scholar]
- 18.Guss JD, Horsfield MW, Fontenele FF, et al. 2017. Alterations to the Gut Microbiome Impair Bone Strength and Tissue Material Properties. J. Bone Miner. Res 32(6):1343–1353. [DOI] [PMC free article] [PubMed] [Google Scholar]
- 19.Hwang L-L, Wang C-H, Li T-L, et al. 2010. Sex Differences in High-fat Diet-induced Obesity, Metabolic Alterations and Learning, and Synaptic Plasticity Deficits in Mice. Obesity 18(3):463–469. [DOI] [PubMed] [Google Scholar]
- 20.Pettersson US, Waldén TB, Carlsson P-O, et al. 2012. Female Mice are Protected against High-Fat Diet Induced Metabolic Syndrome and Increase the Regulatory T Cell Population in Adipose Tissue. PLoS ONE 7(9). [DOI] [PMC free article] [PubMed] [Google Scholar]
- 21.Huang Z, Kraus VB. 2016. Does lipopolysaccharide-mediated inflammation have a role in OA? Nat. Rev. Rheumatol 12(2):123–129. [DOI] [PMC free article] [PubMed] [Google Scholar]
- 22.Cunnane G, Grehan S, Geoghegan S, et al. 2000. Serum amyloid A in the assessment of early inflammatory arthritis. J. Rheumatol 27(1):58–63. [PubMed] [Google Scholar]
- 23.Bouxsein ML, Boyd SK, Christiansen BA, et al. 2010. Guidelines for assessment of bone microstructure in rodents using micro-computed tomography. J. Bone Miner. Res. Off. J. Am. Soc. Bone Miner. Res 25(7):1468–1486. [DOI] [PubMed] [Google Scholar]
- 24.Glasson SS, Chambers MG, Van Den Berg WB, Little CB. 2010. The OARSI histopathology initiative - recommendations for histological assessments of osteoarthritis in the mouse. Osteoarthritis Cartilage 18 Suppl 3:S17–23. [DOI] [PubMed] [Google Scholar]
- 25.Lewis JS, Hembree WC, Furman BD, et al. 2011. Acute Joint Pathology and Synovial Inflammation is Associated with Increased Intra-Articular Fracture Severity in the Mouse Knee. Osteoarthritis Cartilage 19(7):864–873. [DOI] [PMC free article] [PubMed] [Google Scholar]
- 26.Scanzello CR, Goldring SR. 2012. The Role of Synovitis in Osteoarthritis pathogenesis. Bone 51(2):249–257. [DOI] [PMC free article] [PubMed] [Google Scholar]
- 27.Kasperkovitz PV, Timmer TCG, Smeets TJ, et al. 2005. Fibroblast-like synoviocytes derived from patients with rheumatoid arthritis show the imprint of synovial tissue heterogeneity: Evidence of a link between an increased myofibroblast-like phenotype and high-inflammation synovitis. Arthritis Rheum. 52(2):430–441. [DOI] [PubMed] [Google Scholar]
- 28.Li D, Wang H, He J-Y, et al. 2019. Inflammatory and fibrosis infiltration in synovium associated with the progression in developmental dysplasia of the hip. Mol. Med. Rep 19(4):2808–2816. [DOI] [PubMed] [Google Scholar]
- 29.Favazzo LJ, Hendesi H, Villani DA, et al. 2020. The gut microbiome-joint connection: implications in osteoarthritis. Curr. Opin. Rheumatol 32(1):92–101. [DOI] [PMC free article] [PubMed] [Google Scholar]
- 30.Leinonen R, Sugawara H, Shumway M. 2011. The Sequence Read Archive. Nucleic Acids Res. 39:D19–D21. [DOI] [PMC free article] [PubMed] [Google Scholar]
- 31.Mandal S, Van Treuren W, White RA, et al. 2015. Analysis of composition of microbiomes: a novel method for studying microbial composition. Microb. Ecol. Health Dis 26:27663. [DOI] [PMC free article] [PubMed] [Google Scholar]
- 32.Yun Y, Kim H-N, Kim SE, et al. 2017. Comparative analysis of gut microbiota associated with body mass index in a large Korean cohort. BMC Microbiol. 17(1):151. [DOI] [PMC free article] [PubMed] [Google Scholar]
- 33.McCulloch K, Huesa C, Dunning L, et al. 2019. Accelerated post traumatic osteoarthritis in a dual injury murine model. Osteoarthritis Cartilage 27(12):1800–1810. [DOI] [PubMed] [Google Scholar]
- 34.Kung LHW, Ravi V, Rowley L, et al. 2017. Comprehensive Expression Analysis of microRNAs and mRNAs in Synovial Tissue from a Mouse Model of Early Post-Traumatic Osteoarthritis. Sci. Rep 7(1):17701. [DOI] [PMC free article] [PubMed] [Google Scholar]
- 35.Fang H, Huang L, Welch I, et al. 2018. Early Changes of Articular Cartilage and Subchondral Bone in the DMM Mouse Model of Osteoarthritis. Sci. Rep 8(1):2855. [DOI] [PMC free article] [PubMed] [Google Scholar]
- 36.Adebayo OO, Holyoak DT, van der Meulen MCH. 2019. Mechanobiological Mechanisms of Load-Induced Osteoarthritis in the Mouse Knee. J. Biomech. Eng 141(7):070806. [DOI] [PMC free article] [PubMed] [Google Scholar]
- 37.Furman BD, Strand J, Hembree WC, et al. 2007. Joint degeneration following closed intraarticular fracture in the mouse knee: a model of posttraumatic arthritis. J. Orthop. Res. Off. Publ. Orthop. Res. Soc 25(5):578–592. [DOI] [PubMed] [Google Scholar]
- 38.Poulet B, de Souza R, Kent AV, et al. 2015. Intermittent applied mechanical loading induces subchondral bone thickening that may be intensified locally by contiguous articular cartilage lesions. Osteoarthritis Cartilage 23(6):940–948. [DOI] [PMC free article] [PubMed] [Google Scholar]
- 39.Main RP, Shefelbine SJ, Meakin LB, et al. 2020. Murine Axial Compression Tibial Loading Model to Study Bone Mechanobiology: Implementing the Model and Reporting Results. J. Orthop. Res [Epub ahead of print]. [DOI] [PMC free article] [PubMed] [Google Scholar]
- 40.Goldring SR. 2012. Alterations in periarticular bone and cross talk between subchondral bone and articular cartilage in osteoarthritis. Ther. Adv. Musculoskelet. Dis 4(4):249–258. [DOI] [PMC free article] [PubMed] [Google Scholar]
- 41.Felson DT, Gale DR, Elon Gale M, et al. 2005. Osteophytes and progression of knee osteoarthritis. Rheumatol. Oxf. Engl 44(1):100–104. [DOI] [PubMed] [Google Scholar]
- 42.Ulici V, Kelley KL, Azcarate-Peril MA, et al. 2018. Osteoarthritis induced by destabilization of the medial meniscus is reduced in germ-free mice. Osteoarthritis Cartilage 26(8):1098–1109. [DOI] [PMC free article] [PubMed] [Google Scholar]
- 43.Saklayen MG. 2018. The Global Epidemic of the Metabolic Syndrome. Curr. Hypertens. Rep 20(2):12. [DOI] [PMC free article] [PubMed] [Google Scholar]
- 44.Sturm R, Hattori A. 2013. Morbid Obesity Rates Continue to Rise Rapidly in the US. Int. J. Obes. 2005 37(6):889–891. [DOI] [PMC free article] [PubMed] [Google Scholar]
- 45.Duclos M 2016. Osteoarthritis, obesity and type 2 diabetes: The weight of waist circumference. Ann. Phys. Rehabil. Med 59(3):157–160. [DOI] [PubMed] [Google Scholar]
- 46.Gross J-B, Guillaume C, Gegout-Pottie P, et al. 2017. The infrapatellar fat pad induces inflammatory and degradative effects in articular cells but not through leptin or adiponectin. Clin. Exp. Rheumatol 35(1):53–60. [PubMed] [Google Scholar]
- 47.Clockaerts S, Bastiaansen-Jenniskens YM, Runhaar J, et al. 2010. The infrapatellar fat pad should be considered as an active osteoarthritic joint tissue: a narrative review. Osteoarthritis Cartilage 18(7):876–882. [DOI] [PubMed] [Google Scholar]
- 48.Ioan-Facsinay A, Kloppenburg M. 2013. An emerging player in knee osteoarthritis: the infrapatellar fat pad. Arthritis Res. Ther 15(6):225. [DOI] [PMC free article] [PubMed] [Google Scholar]
- 49.Barboza E, Hudson J, Chang W-P, et al. 2017. Pro-fibrotic infrapatellar fat pad remodeling without M1-macrophage polarization precedes knee osteoarthritis in diet-induced obese mice. Arthritis Rheumatol. 69(6):1221–1232. [DOI] [PMC free article] [PubMed] [Google Scholar]
Associated Data
This section collects any data citations, data availability statements, or supplementary materials included in this article.