Abstract
The ability to visualize and quantify apoptosis in vivo is critical to monitoring disease response to treatment and providing prognosis information. However, the application of current apoptosis labeling probes faces significant challenges including nonspecific tissue uptake, inefficient apoptotic cell labeling and short monitoring windows. Here we report a highly specific apoptosis labeling nanoparticle (NP) probe with Pisum sativum agglutinin (PSA) as tumor targeting ligand for prolonged in vivo apoptosis imaging. The NP (namely, IONP-Neu-PSA) consists of a magnetic iron oxide core (IONP) conjugated with PSA, and a reporter fluorophore. IONP-Neu-PSA demonstrated minimal cytotoxicity and high labeling specificity towards apoptotic cells in vitro. When applied in vivo, IONP-Neu-PSA tracks apoptotic tumor for a prolonged period of two weeks under near-IR imaging with low background noise. Moreover, IONP-Neu-PSA possess T2 contrast enhancing properties that can potentially enable apoptosis detection by magnetic resonance imaging (MRI). The high specificity for apoptotic cells, sustained fluorescent signal, and non-invasive imaging capability exhibited by IONP-Neu-PSA could provide a versatile tool for cancer treatment monitoring and pathological research.
Keywords: Apoptosis Detection, Cancers, Nanoparticle, Pisum sativum Agglutinin
Graphical Abstract
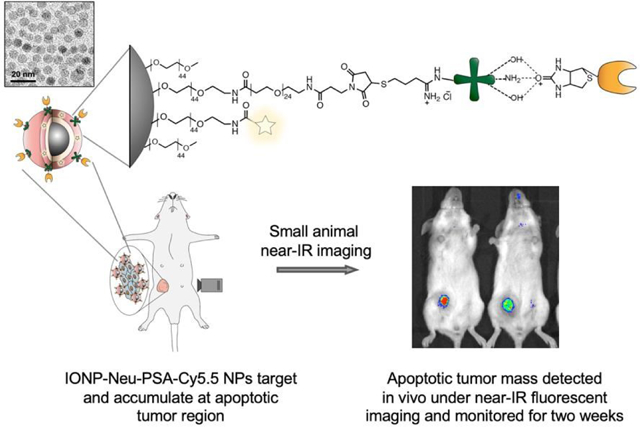
Pisum sativum agglutinins (PSA) were conjugated onto nanoparticle by first covalently linking neutravidins (Neu) onto a 10 nm IONP core and then attaching PSA to neu via biotin-avidin interaction. When administered into chemotherapeutic treated tumor-bearing mice, IONP-Neu-PSA-Cy5.5 particles were able to target apoptotic tumor mass and produced persistent fluorescent signal detectable under near-IR imaging modality in vivo.
Introduction
Monitoring therapeutic-induced tumor apoptosis can provide important insights in validation of existing treatment modalities and in turn facilitate the screening for new drugs.1–3 The most commonly used apoptosis detection methods use various probes to recognize the apoptosis-associated biomolecules including phosphatidylserine (PS) and caspases. The exposure of PS on the outer cell plasma membrane is a universal marker for apoptosis. PS can be specifically bound by annexin V for apoptotic cells labeling.4,5 Activation of caspases is another well-known hallmark of apoptosis. Substrate peptides are commonly utilized to track caspase activation in apoptotic cells. These peptides can produce detectable signal usually in the form of fluorescence upon their cleavage by the caspases activated in apoptotic cells.6,7
However, our current ability to capture therapy-induced tumor apoptosis is still very limited. The PS targeting annexin V has several limitations in vivo including nonspecific tissue uptake, a short blood half-life and monitoring window,8,9 and stringent conditions for optimal binding.10 Caspase-related apoptosis probes often suffer from nonspecific interactions with other cysteine proteases.11,12 Specifically, legumain and cathepsins are cysteine proteases present in non-apoptotic cells. Similar to caspases, they can also cleave substrate peptides and cause non-apoptotic cell labeling by caspases-related apoptosis probes. It has also been found that the activation of the terminal executioner caspase 3 could be an apoptosis independent event13 and hence raises questions on the reliability of caspase 3 based apoptosis targeting probes.
Nanoparticles (NPs) have demonstrated its relevance in clinical and in vivo studies over the years. It has been shown that NPs can be designed to be biocompatible and possess effective biokinetics in rodent and primate animal models.14,15 NPs conjugated with ligands that are highly specific to apoptotic cells afford an additional advantage of multi-valent targeting and prolonged blood circulation time.16 Therefore, NPs, with properly enabled imaging capability, can potentially provide prolonged apoptotic cell labeling and reveal more spatial-temporal details about tumor apoptosis in vivo. Nevertheless, many current NP-based apoptosis labeling systems are based on annexin V protein and caspase substrate17–19 and inevitably bear the limitations associated with both materials. Furthermore, current NP-based apoptosis labeling systems are typically larger than the size ideal for in vivo application (<100 nm) and have not been proven to be able to provide whole-body apoptosis patterning in vivo.19–21 Due to the severe obstacles mentioned above, the development of apoptosis tracking NPs remains largely at in vitro stage and lacks in vivo significance.
Here, we report the development of an imaging NP with small and uniform size and conjugated with an apoptosis marker biomolecule to track drug-induced apoptosis. The NP consists of a magnetic iron oxide core (IONP) coated with PEG to which tumor targeting Pisum sativum agglutinin (PSA) was conjugated through biotin-avidin interaction. Studies indicated the overexpression of cell surface glycoproteins as another potential universal apoptotic marker.22,23 PSA, a 49 kDa lectin, has been shown to successfully target apoptotic cells in various cell lines due to its high binding specificity towards mannosyl (Ka = 1.25 × 10⁵ M−1) and galactosyl glycans (Ka = 9 × 10⁴ M−1).24–26 These findings suggest PSA as a promising apoptosis targeting ligand. PEG is used to prevent NP from aggression. In this study, IONP-Neu-PSA size, serum stability, in vitro biocompatibility, in vitro and in vivo apoptosis targeting capabilities were investigated. Significantly, IONP-Neu-PSA demonstrated prolonged retention and reliable near-IR signal generation in chemotherapeutic-induced apoptotic 4T1 tumors in vivo.
Experimental
Materials and Methods
3-(triethoxysilyl)propyl succinic anhydride (SATES) was purchased from Gelest (Arlington, VA). 2000 MW mono-amine functionalized poly(ethylene) glycol (mPEG2K-NH2) was purchased from Laysan Bio (Arab, AL). Doxorubicin (Dox) was purchased from LC Laboratories (Woburn, MA). Paclitaxel was purchased from Sigma Aldrich (St. Louis, MO). Neutravidin was purchased from Thermo Fisher Scientific (Rockford, IL). Biotinylated Pisum sativum Agglutinin was purchased from Vector Laboratories (Burlingame, CA). The 2-iminothiolane (Traut’s reagent) was purchased from Molecular Biosciences (Boulder, CO). Cell culture medium RPMI1640 and antibiotic-antimycotic were purchased from Invitrogen (Carlsbad, CA). Sephacryl S-200 resin and HyClone Characterized Fetal bovine serum (FBS) were purchased from GE Healthcare Life Sciences (Pittsburgh, PA). NHS-PEG24-maleimide, and Annexin V-Alexa Fluor 488 were purchased from Thermo Fisher Scientific (Rockford, IL). NHS-Cy5 and NHS-Cy5.5 were purchased from Lumiprobe Corp. Pierce BCA protein assay kit was purchased from Thermo Fisher Scientific (Rockford, IL). Mini-Protean TGX Gels, Tris/Glycine buffer, 2X Laemmli sample buffer, 2-mercaptoethanol, Precision Plus Protein™ Kaleidoscope™ Prestained Protein Standards and Coomassie Stain were purchased from Bio-Rad (Hercules, CA). All other chemicals were purchased from Sigma-Aldrich (St. Louis, MO).
IONP-PEG-NH2 Synthesis
Oleic acid coated IONP (IOOA) was synthesized according to a previously published method.27 To further functionalize IOOA with polyethylene glycol (PEG) and primary amine groups, 50 mg of IOOA was first dissolved in 43 ml of anhydrous toluene in a 3-neck round-bottom flask connected to a Graham condenser. 50 μL of triethylamine was then added to the flask. The flask was then sealed with septa and purged with nitrogen. After the flask was heated to 100°C, 0.15 mL SATES was injected into the flask, followed by addition of 281.25 mg mPEG2K-NH2 dissolved in 7 mL of anhydrous toluene 15 mins after the SATES injection. 1 hour later, an additional 75 μL of SATES was injected into the flask and the solution was allowed to react for 6.75 hours. The solution was then transferred to a single-neck round-bottom flask and precipitated in hexane. The precipitate was re-suspended in tetrahydrofuran, sonicated for 10 mins and dispersed in hexane for precipitation. The precipitated pellet was then re-dispersed in 10 mL anhydrous THF and sonicated for 10 min. 93.75 mg of mPEG2K-NH2 and 281.25 mg of bis(amine) functionalized PEG (PEG2K-bis(amine), MW 2000) mixed in 12 mL anhydrous THF were added to the solution. The single-neck round-bottom flask was then sealed with septa and purged with nitrogen. 18.75 mg of N, N’-dicyclohexylcarbodiimide (DCC) dissolved in 2 mL anhydrous THF was added to the flask which was then placed in a sonication water bath at room temperature for 16 hours. The solution was then precipitated in hexane, then suspended in 20 ml ethanol followed by 10 mins of sonication. Hexane was then added to precipitate IONP-PEG-NH2 and the residual hexane was removed and the pellet dried with nitrogen. Finally, the precipitated pellet was re-suspended in deionized water (DI), sonicated for 10 mins and purified by size exclusion gel chromatography (Sephacryl S-200).
Surface functionalization of IONP-PEG-NH2
92 μL of neutravidin (1 mg/mL in DI water) was mixed with equal volume of PBS, followed by addition of 4 μL of Traut’s reagent (1 mg/mL in DI water). The solution was then mixed thoroughly and incubated at room temperature in the dark for 1 hour. Concurrently, Sephacryl S-200 size exclusion chromatography resin was packed into two empty PD10 columns and equilibrated with 20 mM HEPES buffer. 2 mg of IONP-PEG-NH2 in DI water was dispersed in PBS to achieve a final volume of 1 mL. 1.42 μL of 250 mM Succinimidyl-[(N-maleimidopropionamido) tetracosaethyleneglycol] ester (SM(PEG)24) DMSO solution, and 4.8 μL NHS-Cy5.5 or NHS-Cy5 (5 mg/ml in DMSO) were mixed with the IONP-PEG-NH2 solution. The solution was then incubated for 30 mins at room temperature in the dark followed by purification through a PD10 desalting column. The thiolated neutravidin solution was then mixed with IONP-PEG-NH2, incubated in the dark at room temperature for 30 mins, and purified by a pre-equilibrated S-200 column to obtain pure IONP-Neu-Cy5/Cy5.5. Finally, to conjugate PSA-biotin to IONP-Neu-Cy5/Cy5.5, PSA-biotin (5 mg/ml in PBS) was added to IONP-Neu-Cy5/Cy5.5 at 10% v/v and gently mixed on a shaker for 15 mins and then purified by another S-200 column.
Ferrozine assay
Ferrozine solution was prepared by dissolving 1.761 g ascorbic acid, 1.927 g ammonium acetate, 0.032 g ferrozine and 0.0135 g neocuproine in 10 mL of DI H2O. 1000 ppm Fe stock solution was diluted to 1 ppm, 2 ppm and 4 ppm with 10 mM HCl as Fe standards. 10 mM HCl was used as 0 ppm Fe control. To prepare the NP sample, 5 μL of NP solution was dissolved in 45 μL of concentrated HCl followed by 50 × dilution in DI H2O. 6 μL of the diluted NP solution was mixed with 694 μL of DI H2O and 90 μL of Ferrozine cocktail. 300 μL of each 0 ppm, 1 ppm, 2 ppm, and 4 ppm Fe standards were then mixed with 400 μL of DI H2O and 90 μL of Ferrozine cocktail. 10 minutes later, samples’ 562 nm absorbance was measured by a SpectraMax i3 multimode microplate reader (Molecular Devices). The resultant standard Fe concentration curve is shown in Figure S1 in Supplementary Information.
TEM imaging
TEM samples were prepared by addition of 4 μL of IONP-Neu-PSA solution to a Formvar/carbon coated 300-mesh copper grid (Ted Pella, Inc., Redding, CA) and allowed to dry. TEM images were acquired on a Tecnai G2 F20 electron microscope (FEI, Hillsboro, OR) operating at a voltage of 200 kV.
Hydrodynamic size and zeta-potential measurements of IONP-Neu-PSA
The hydrodynamic size and zeta potential of IONP-Neu-PSA were determined using a Zetasizer Nano-ZS (Malvern Instruments, Worcestershire, UK). The measurements were made in 20 mM HEPES buffer (pH 7.4) at room temperature. To test the size stability of IONP-Neu-PSA in physiological environment, IONP-Neu-PSA was mixed with RPMI 1640 cell culture medium (1% antibiotic-antimycotic and 10% fetal bovine serum) at a concentration of 10% v/v of IONP-Neu-PSA and placed in a 37°C water bath. Hydrodynamic size measurements were taken at 0, 5, 25, 50, 75, 100 and 125 hours after IONP-Neu-PSA was added to cell culture medium.
IONP bound PSA quantification
Sodium dodecyl sulphate poly acrylamide gel (SDS-PAGE) and bicinchoninic acid (BCA) protein assays were utilized to quantify the amount of PSA bound on IONP. Spin filter (100 kDa MWCO) flow through eluents of pure PSA, IONP-Neu-PSA-Cy5 and IONP-Neu-Cy5 were collected in triplicates for both SDS-PAGE and BCA analysis. 5 μL of each of the eluent samples was mixed with 4.75 μL 2× Laemmli sample buffer and 0.25 μL 2-mercaptoethanol. All samples were then heated in 90°C water bath for 5 mins to linearize proteins. SDS-PAGE gel casting cassette was assembled into a Mini-Protean Tetra Cell assembly (Bio-Rad) filled with 800 mL 1× Tris/Glycine buffer. All samples with linearized proteins and a kaleidoscope protein ladder sample were added to the gel and run for 90 mins under a constant voltage of 100 V. The gel was then subjected to Coomassie Blue staining. Specifically, the gel was washed three times with 200 mL of DI water immediately for 5 mins each with gentle shaking after electrophoresis. Then the gel was stained in 200 mL of Coomassie blue dye with gentle shaking for 45 mins followed by another DI water wash. The stained gel was placed in a Gel Doc XR imaging system (Bio-Rad) for imaging and post analysis. The quantitative protein assay was carried out by following the instruction in Pierce BCA protein assay kit. All eluent samples were subjected to BCA assay. A PSA standard curve was generated by fitting the PSA standard datapoints with known concentration to a second order polynomial curve.
FTIR analysis of IONP-Neu-PSA
IONP-Neu-PSA, IONP-Neu and IONP NPs were freeze-dried overnight. For each sample, 2 mg of dried NPs were mixed with 200 mg of KBr and pulverized into fine powders, and a pellet was prepared for characterization. FTIR spectra were obtained using a Nicolet 5-DXB FTIR spectrometer (Thermo, Boston, MA) with a resolution of 4/cm and averaging 64 runs.
In vitro MR imaging
T2-weighted imaging and quantitative T2 MR imaging scan sequences were used to investigate the contrast enhancing capabilities of IONP-Neu-PSA and IONP. MR imaging was conducted on a Bruker Avance III 600 MHz, 14 T wide bore spectrometer. IONP-Neu-PSA and IONP in PBS were pipetted into glass vials (3.25 mm I.D., 5 mm O.D., 200 μL volume) at concentrations of 100, 75, 50, and 25 μg Fe/mL. The vials were fixed in place inside a water reservoir; the water served as a homogeneous background signal to minimize magnetic susceptibility variations near samples. The secured vials were placed in a 25 mm single-channel 1H radiofrequency receiving coil (PB Micro 2.5). Quantitative T2 values were obtained using a multi-spin multi-echo (MSME) pulse sequence with TR = 2500 ms, TE = 6.7 + 6n ms (n = 0–16), and 78 × 156 μm2 in-plane resolution with 0.5 mm slice thickness for 14 slices. T2-weighted images were acquired with a Rapid Acquisition with Refocused Echoes (RARE) pulse sequence with TE = 6.78 ms, TR = 4000 ms, and 78 × 52 μm2 in-plane resolution with 0.5 mm slice thickness for 14 slices. Analysis of MRI data was performed using the FMRIB (Functional Magnetic Resonance Imaging of the Brain) Software Library (FSL)28 Bruker Paravision 5.1 analytic package and Osirix (Pixmeo). Processing stages for in vitro QT2 data included (i) region of interest (ROI) definition as a circular 100-voxel area residing within a sample cross section, (ii) automated mean T2 value and standard deviation calculation from within the 100-voxel ROI (using the Paravision 5.1 software package) and (iii) calculation of the transverse relaxation rate as the slope of the plot of R2 (computed as 1/T2 using FSL) versus Fe concentration determined through computation of the best-fit line via least-squares linear regression.
Cell Culture
4T1 mouse breast cancer cells (American Type Culture Collection, Manassas, VA) were cultured in RPMI1640 medium supplemented with 10% vol/vol FBS and 1% vol/vol antibiotic-antimycotic. Cultures were maintained in a 37°C, 5% CO2 humidified incubator.
Cell viability assay
Cytotoxicity of IONP-Neu-PSA was evaluated in the triple negative murine breast cancer cell 4T1. 4T1 cells were seeded into a 96 well microplate with 2000 cells/well. The cells were incubated with IONP-Neu-PSA at 50, 25, 12.5, 6.25, 3.13, 1.56, 0.78, 0.39, 0.19 μg/mL for three days. 100 μL Alarma Blue dye was added to each well and incubated for 2.5 hours. The plate was then transferred to a SpectraMax i3 multimode microplate reader (Molecular Devices) to quantitate the fluorescence signal at an excitation wavelength of 550 nm and an emission wavelength of 590 nm for cell viability quantification.
Bright field imaging of 4T1 cells
Bright field images of PTX treated and untreated 4T1 were imaged using a Nikon TE300 (Nikon, Tokyo, Japan) inverted microscope.
IONP-Neu-PSA cell binding characterized by flow cytometry
4T1 cells were seeded into total of nine wells in two 6 well microplates with six wells seeded at 150 × 103 cells/well and the other three at 75 × 103 cells/well. 10 μM PTX was added to three of the wells at 150 × 103 cells/well and 20 μM PTX was added to the other three wells also at 150 × 103 cells/well to induce apoptosis. The remaining three wells seeded at 75 × 103 cells/well were assigned as untreated controls. After 24 hours of incubation, each of IONP-Neu-Cy5 (30 μg/mL) and IONP-Neu-PSA-Cy5 (30 μg/mL) was added to one 20 μM PTX treated well, one 10 μM PTX treated well and one untreated well and incubated for 30 minutes. All the cells were then harvested and washed with cold PBS three times. 4T1 cells not treated with IONP-Neu-Cy5 or IONP-Neu-PSA-Cy5 were re-suspended in 100 μL 1X Annexin V binding buffer (10 mM HEPES, 140 mM NaCl, 2.5 mM CaCl2) with 5 μL Annexin V- Alexa Fluor 488 agent followed by addition of 400 μL 1X Annexin V binding buffer. All cells were analyzed by flow cytometry (FACSCanto II, BD Biosciences) and post-processed via FlowJo (Treestar, Inc., San Carlos, CA).
IONP-Neu-PSA cell binding characterized by confocal microscopy
Square glass coverslips were placed at the bottom of four wells in a 6 well plate. 4T1 cells were then seeded onto the glass covers at 150 × 103 cells/well in two wells and 75 × 103 cells/well in the other two. PTX (20 μM) was only added to the two wells with 150 × 103 cells/well cell seeding and incubated for 24 hours. 1 mL 1X Annexin V binding buffer containing 50 μL Annexin V-488 Alexa Fluor agent and 50 μg/mL propidium iodide was added to one PTX treated well and one untreated well. 30 μg/mL IONP-Neu-PSA-Cy5 and 50 μg/mL propidium iodide were added to the other two wells. After incubation for 30 min, cells on the coverslips were washed with cold PBS three times and mounted onto a glass slide with Prolong Gold mounting medium (Thermo Fisher Scientific). Confocal images of 4T1 cells were acquired using a Leica SP8X confocal laser scanning microscope (Leica, Germany).
Apoptosis monitoring In Vivo
All in vivo experiments were conducted strictly following all the federal guidelines and the animal protocols approved by Institutional Animal Care and Use Committee (IACUC) at University of Washington. The mice used in this study were five-week-old female BALB/cJ mice purchased from the Jackson Laboratories (Bar Harbor, Maine). Mice were housed in a vivarium and given one week to adapt to the new environment before any experimental procedures were performed. 1 × 10⁶ luciferase expressing 4T1 (4T1-Luc) cells were injected into mice mammary glands subcutaneously. 12 days after 4T1-Luc inoculation when tumors were palpable, 200 μL of 5 mg/ml Dox solution was injected into some of the mice via tail vein to induce tumor apoptosis. Mice receiving no Dox treatment were used as control. IONP-Neu-PSA-Cy5.5 was concentrated to 2.8 mg Fe/ml using a 30 kDa spin filters. 100 μL of the concentrated IONP-Neu-PSA-Cy5.5 was injected into mice via tail vein 3 days after Dox administration. Mice from both the control and Dox treated groups (n = 4) were imaged in a XENOGEN IVIS 200 system (PerkinElmer Inc.). Mice fur was kept intact throughout the study. Images were captured using Ex 710 nm and Em ICG (810 nm – 875 nm), and acquired at 6 hours, 1, 2, 4, 6, 8, 11, and 14 days after IONP-Neu-PSA injection.
Statistical analysis
Results were presented as mean ± standard deviation from three independent experiments unless otherwise stated. 10,000 events were collected for each condition to calculate the mean and standard deviation of the distributions in the in vitro apoptotic cell binding experiment. Two tailed student t-test was performed to evaluate the statistical significance. Datasets with p value greater than 0.05 are considered statistical non-significant.
Results and discussion
Design of IONP-Neu-PSA
Fig. 1 illustrates the configuration and synthesis process of IONP-Neu-PSA. The 10-nm IONP core was synthesized by thermal decomposition and was further modified by an established ligand exchange process to coat with amine functional PEG (PEG-NH2) to confer water solubility.29 The IONP core is biodegradable and has been shown to be safe for in vivo applications.30,31 The PEG-NH2 coating on the IONP serves to improve serum stability, prolong blood circulation time in vivo, and offer utility for bioconjugation via reactive primary amines.29,32,33 Neu was first thiolated by Traut’s reagent followed by conjugation with IONP via SM(PEG)24 bifunctional linker to create sufficient spacing between Neu and the IONP surface for flexible apoptotic cell binding.34 Biotinylated PSA was then conjugated to IONP via noncovalent biotin-avidin interactions to maintain the structural integrity and the functionality of PSA after conjugation. IONP-Neu-PSA was also labeled with reporter fluorophore, Cy5 for in vitro or Cy5.5 for in vivo optical monitoring.
Fig. 1.
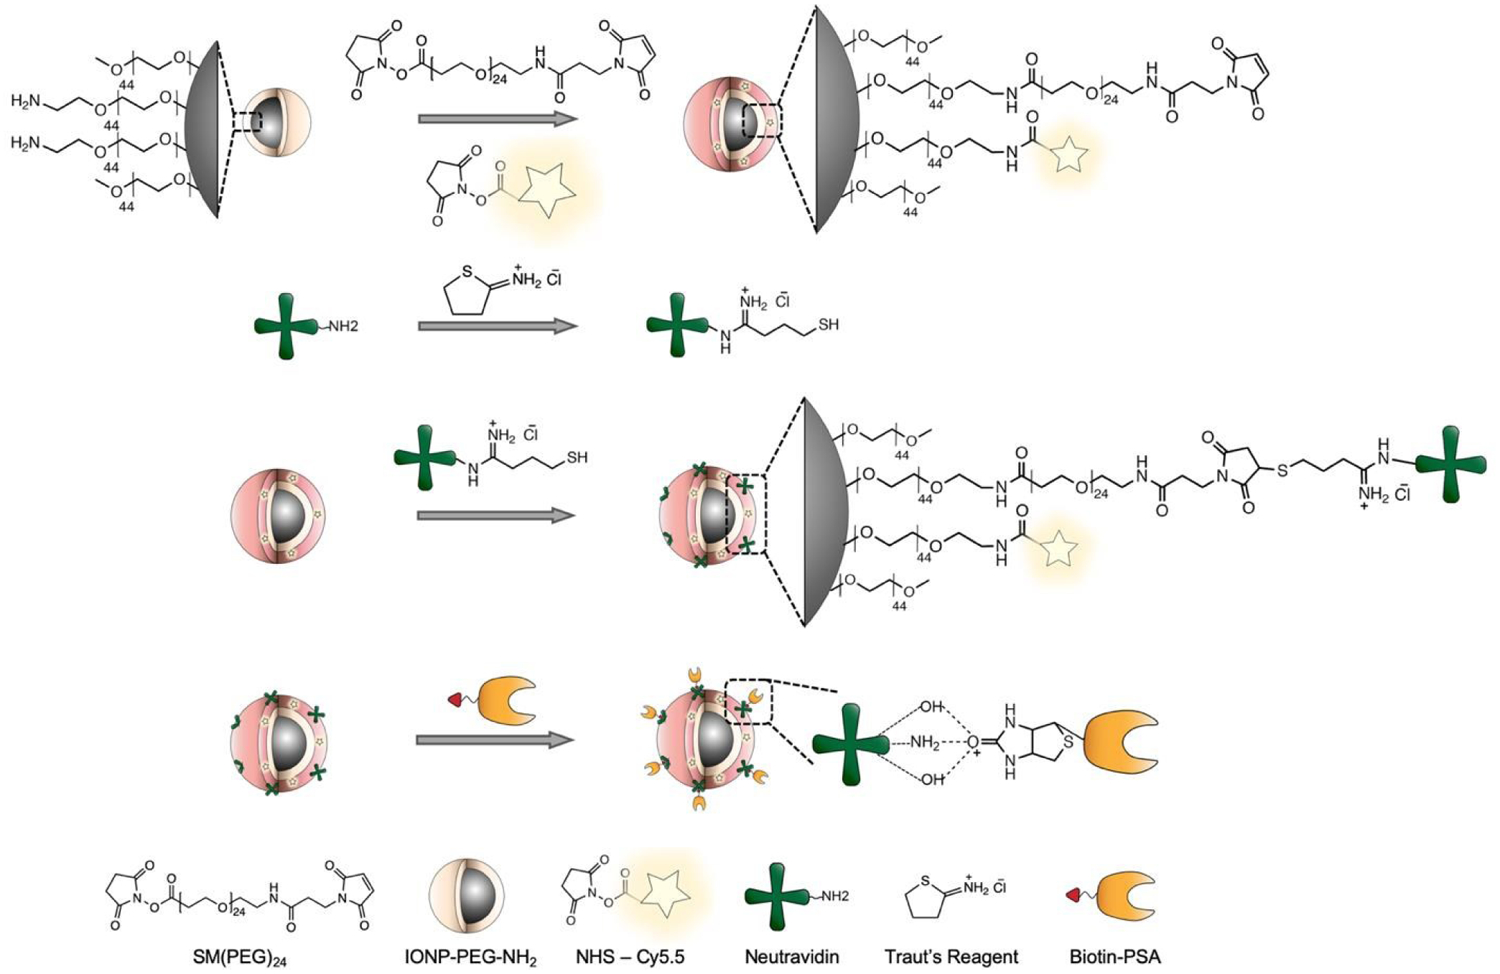
Illustration of IONP-Neu-PSA synthesis. IONP-PEG-NH2 was first functionalized with SM(PEG)24 and NHS activated fluorophores. Thiolated neutravidin was conjugated onto IONP via SM(PEG)24 bifunctional linker. Biotinylated PSA was then attached to neutravidin via avidin-biotin interaction.
NP bound PSA characterization and quantification
To validate the conjugation of Neu and subsequently PSA to IONP, FTIR analysis was performed for IONP, IONP-Neu and IONP-Neu-PSA. Compared to the IONP baseline spectrum, both IONP-Neu and IONP-Neu-PSA showed significant peak intensity increases at 3417 cm−1, 1623 cm−1, and 1380 cm−1. Peaks at 2965 cm−1 and 1048 cm−1 were unique to IONP-Neu-PSA (Fig. 2a), indicating successful attachment of PSA onto IONP-Neu. Peaks that were shared by both IONP-Neu and IONP-Neu-PSA are the common footprint of proteins in IR spectra. Chemical groups responsible for the peaks associated with these wavenumbers are summarized in Fig. 2b. The 3417 cm−1 peak corresponds to the stretching vibration of the dominating N-H bond with small contribution from the O-H bond.35,36 The stretching vibration of C=O and C-N bonds which are abundant in protein backbone is mainly responsible for the peak at 1623 cm−1.35 The intensity spike at 1380 cm−1 is primarily due to the increased amount of C-H bonds.37 The two peaks unique to IONP-Neu-PSA is explained by the increased presence of C-H groups (2965 cm−1) and alkyl amine (1048 cm−1) after PSA was bound to NP bound Neu protein.36
Fig. 2.
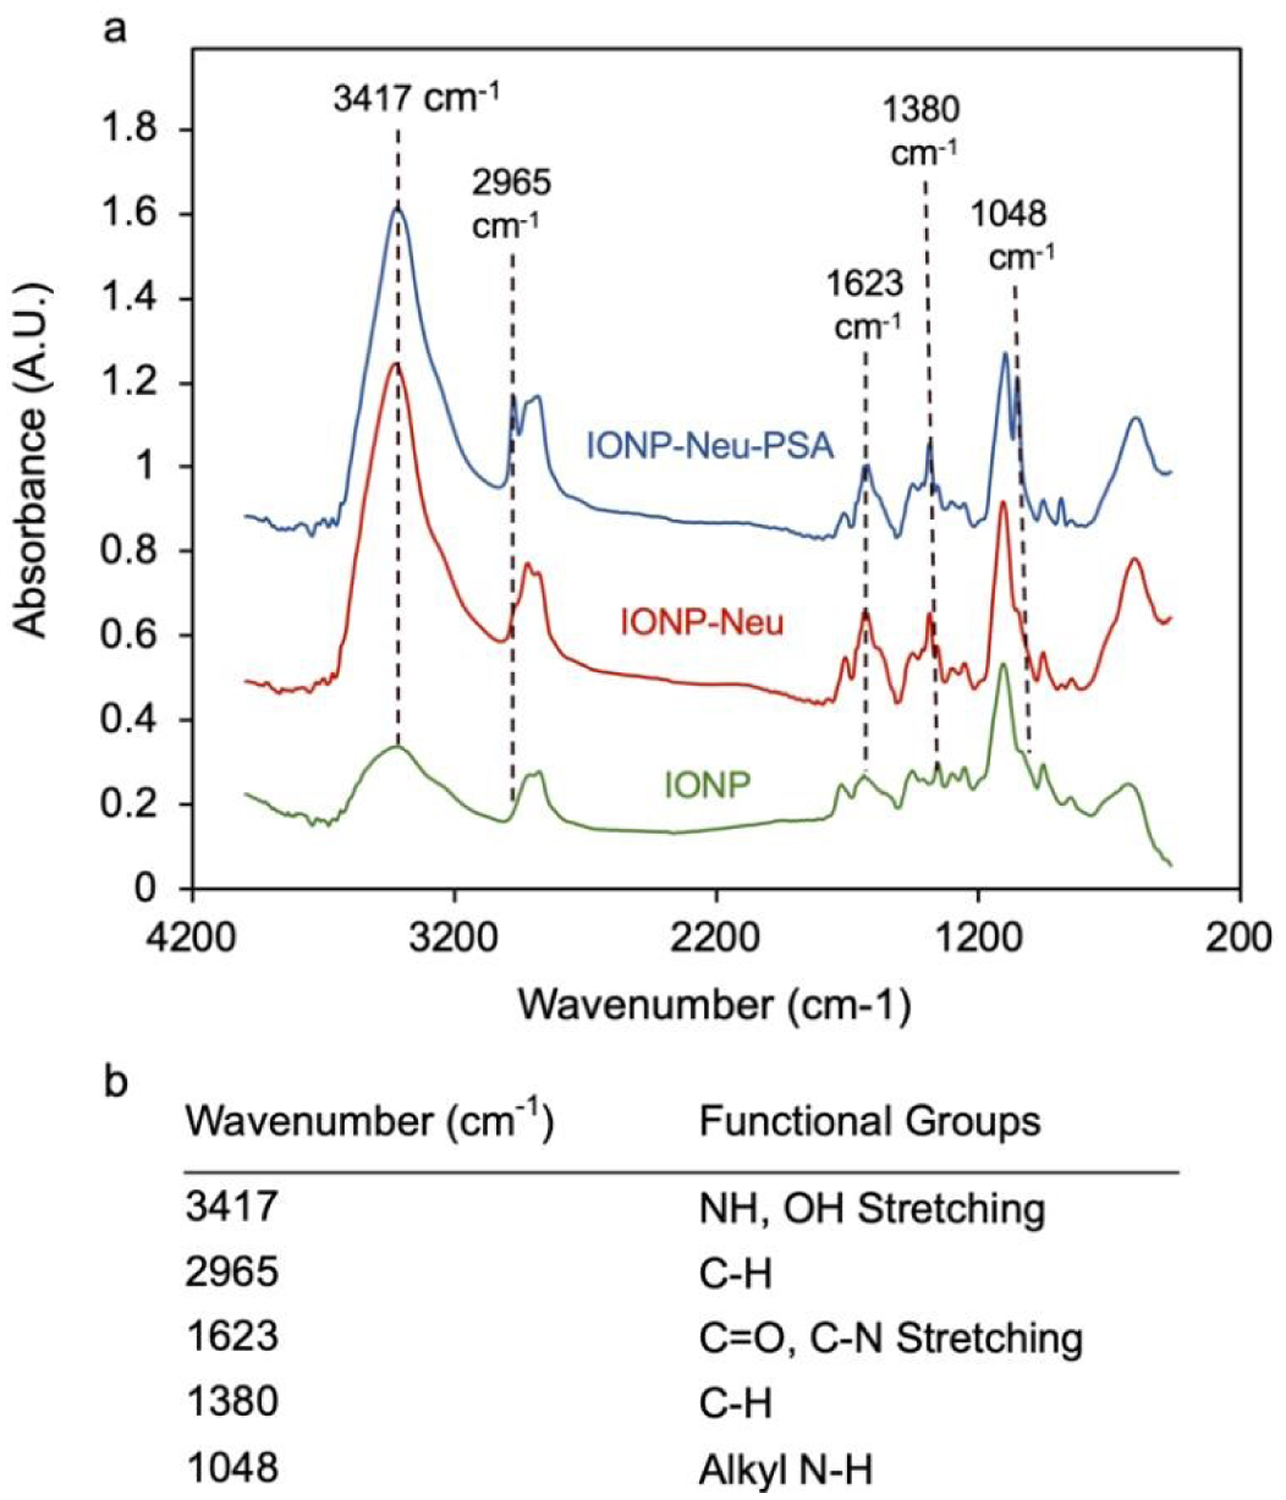
NP bound PSA characterization and quantification. (a) FTIR absorbance spectrum analysis of IONP-Neu-PSA and IONP-Neu with IONP as the control particle. Peak wavenumbers unique to IONP-Neu and IONP-Neu-PSA are delineated with dashed lines. (b) Summary table of the wavenumbers of interest with their corresponding functional groups.
To quantify the amount of PSA bound on IONP, free PSA contents from IONP-Neu-PSA, pure PSA and IONP-Neu samples were collected from the spin filter (100 kDa) flow through eluents. Pure PSA and IONP-Neu-PSA had the same PSA concentration before spin filtering. SDS-PAGE gel electrophoresis was performed to visualize the free PSA contents from the samples. The image of SDS-PAGE showed that the free PSA band produced from pure PSA control has higher intensity than that of IONP-Neu-PSA (Fig. 3a). No visible PSA band from IONP-Neu was observed. The same spin filtered samples were also analyzed by BCA protein quantification assay. BCA absorbance readings of IONP-Neu-PSA, pure PSA and IONP-Neu were fitted to the second order polynomial PSA standard curve. From the BCA data, the concentration of the free PSA content from IONP-Neu-PSA was evaluated to be 206 ± 14.16 μg/mL, which is 72.1% ± 4.95% of the 286 ± 6.78 μg/mL free PSA content from the pure PSA control (Fig. 3b). Quantitative analysis over the triplicate SDS-PAGE intensity data (Fig. S2, Supplementary Information) showed that the free PSA band intensity from IONP-Neu-PSA was 79.9% ± 6.4% of the band intensity from pure PSA control (Fig. 3c). This result suggests that the remaining 20.1% PSA was bound to IONP-Neu to form IONP-Neu-PSA, which is equivalent to 2.97 PSA molecules per IONP-Neu particle (Supplementary Information). The BCA assay result indicates that 27.9% of the PSA was conjugated onto IONP-Neu, which is equivalent to 4.12 PSA molecules bound by each IONP-Neu particle (Supplementary Information). Thus, each IONP-Neu-PSA contains 3 to 4 PSA molecules on average as corroborated by both SDS-PAGE and BCA assay data. After purification, no free PSA bands were observed from IONP-Neu-PSA in the non-reducing SDS-PAGE (Fig. S3, Supplementary Information), indicating successful removal of the excessive PSA from IONP-Neu-PSA solution.
Fig. 3.

Quantitation of PSA bound on IONP-Neu particles. (a) SDS-PAGE image of free PSA samples collected from the 100 kDa spin filter flow through of PSA control, IONP-Neu-PSA and IONP-Neu. (b) BCA protein assay with PSA standard curve ranging from 0–1000 mg/mL. The absorbances of the spin filter flow through of PSA control, IONP-Neu-PSA and IONP-Neu were measured and fitted to the PSA standard curve for free PSA concentration calculation. The inset is the enlarged linear portion of the curve at low concentrations. (c) Statistical analysis of the PSA concentration data from SDS-PAGE image and BCA protein assay. The concentration of PSA controls from SDS-PAGE and BCA were both normalized to 100%. P value < 0.05 is denoted as *, < 0.005 as ** and < 0.0005 as ***.
Physicochemical properties of IONP-Neu-PSA
The in vivo pharmacokinetics and biodistribution of nanosized substances are determined by their physicochemical properties. Low bioactivity has been the main challenge in delivery of NPs to desired sites of action in vivo. To avoid immune-recognition, reduce cytotoxicity, and bypass biological barriers, NPs should ideally possess a hydrodynamic size of 10–100 nm and a neutral or slightly negative surface charge.38,39 The hydrodynamic diameter of IONP-Neu-PSA was 34.5 ± 1.1 nm, which falls within the ideal size range for in vivo applications (Fig. 4a). The zeta potential of IONP-Neu-PSA was −2.20 ± 1.25 mV (Fig. 4b) which is well within the range for avoiding non-specific binding with cell surfaces and the extracellular matrix. TEM images of IONP-Neu-PSA show mono-dispersity with a 10 nm spherical core (Fig. 4c). IONP-Neu-PSA was evaluated for its serum stability in cell culture medium. IONP-Neu-PSA was mixed with cell culture medium supplemented with 10% fetal bovine serum at 1:9 ratio (v/v) and incubated at 37 °C; the hydrodynamic size was acquired over the time of incubation. IONP-Neu-PSA showed minimal size variation in cell culture medium over 125 hrs (Fig. 4d).
Fig. 4.
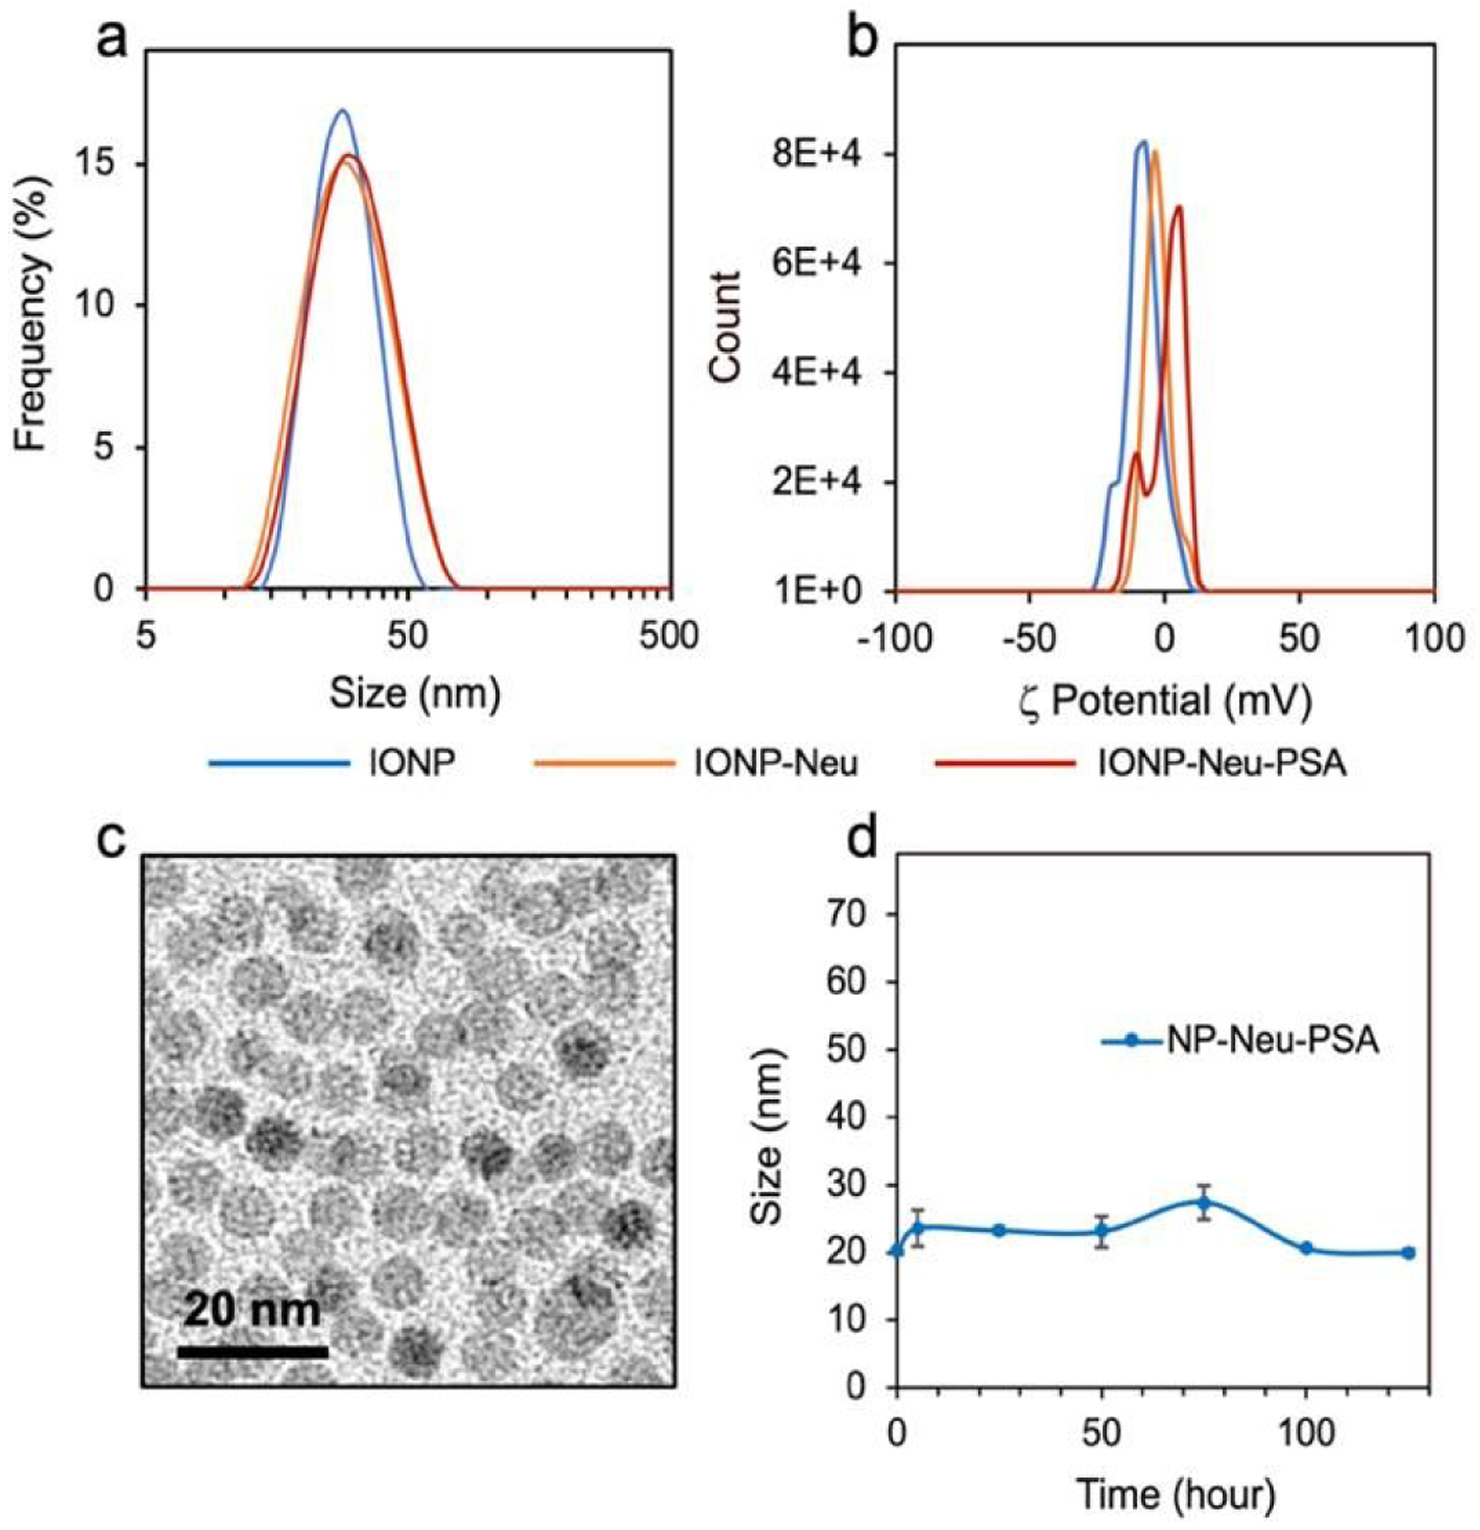
Physicochemical properties of IONP-Neu-PSA. (a) Hydrodynamic sizes in 20 mM and (b) Zeta potentials of IONP, IONP-Neu, IONP-Neu-PSA. (c) TEM image of IONP-Neu-PSA. (d) Serum stability of IONP-Neu-PSA, characterized by incubating IONP-Neu-PSA in 10% FBS (v/v) supplemented cell culture medium at 37°C for 125 hrs and measuring hydrodynamic size of IONP-Neu-PSA over time. There is no significant change in size data over time as characterized by the two-tailed student’s test (p > 0.05).
It is essential for IONP-Neu-PSA to exhibit serum stability to achieve high bioavailability at apoptotic sites. Appropriate NP surface chemistry can minimize protein corona formation and avoid opsonization which not only results in failed passage across biological barriers but also triggers the mononuclear phagocyte system (MPS) to sequester NPs.40,41 Consistent size of IONP-Neu-PSA in cell culture medium indicates that IONP-Neu-PSA can remain inert in serum to evade sequestration in vivo. The hydrodynamic size, zeta potential, and PSA labeling quantification is summarized in Table 1. T2 contrast enhancing properties of IONP-Neu-PSA was evaluated. The transverse relaxivity of IONP-Neu-PSA was 58.11 mM−1 s−1, suggesting that IONP-Neu-PSA inherited most of IONP’s transverse relaxivity (87.70 mM−1 s−1) after protein surface coating (Fig. S4, Supplementary Information). It has been shown that IONP conjugated with chitosan-grafted-PEG and chlorotoxin can effectively enhance MRI T2 contrast in vivo with a transverse relaxivity of 40.3 mM−1 s−1.42 Therefore, IONP-Neu-PSA has the potential as an apoptosis tracker under in vivo MRI.
Table 1.
Summary of size, zeta potential, and PSA quantitation for IONP, IONP-Neu, IONP-Neu-PSA.
| Sample | Size (nm) | ζ Potential (mV) | #PSA/NP |
|---|---|---|---|
| IONP | 26.9 ± 1.68 | −8.34 ± 0.80 | N/A |
| IONP-Neu | 31.4 ± 1.74 | −3.35 ± 0.66 | N/A |
| IONP-Neu-PSA | 33.2 ± 1.14 | −2.20 ± 1.25 | 3 – 4 |
Biocompatibility of IONP-Neu-PSA
For successful clinical application, an apoptosis probe should not cause cytotoxicity which could induce apoptosis and lead to false positive apoptosis detection. To evaluate the cellular compatibility of IONP-Neu-PSA, cell viability assays were performed on cancer cells treated with IONP-Neu-PSA. IONP-Neu-PSA was incubated with 4T1 cells for 72 hours and then the alamar blue cell viability assay was used to assess cytotoxicity. 4T1 breast cancer cells treated with IONP-Neu-PSA over the concentration range of 1–50 μg/ml remained near 100% viable (Fig. 5). These results indicate that IONP-Neu-PSA does not damage cells and induce apoptosis.
Fig. 5.
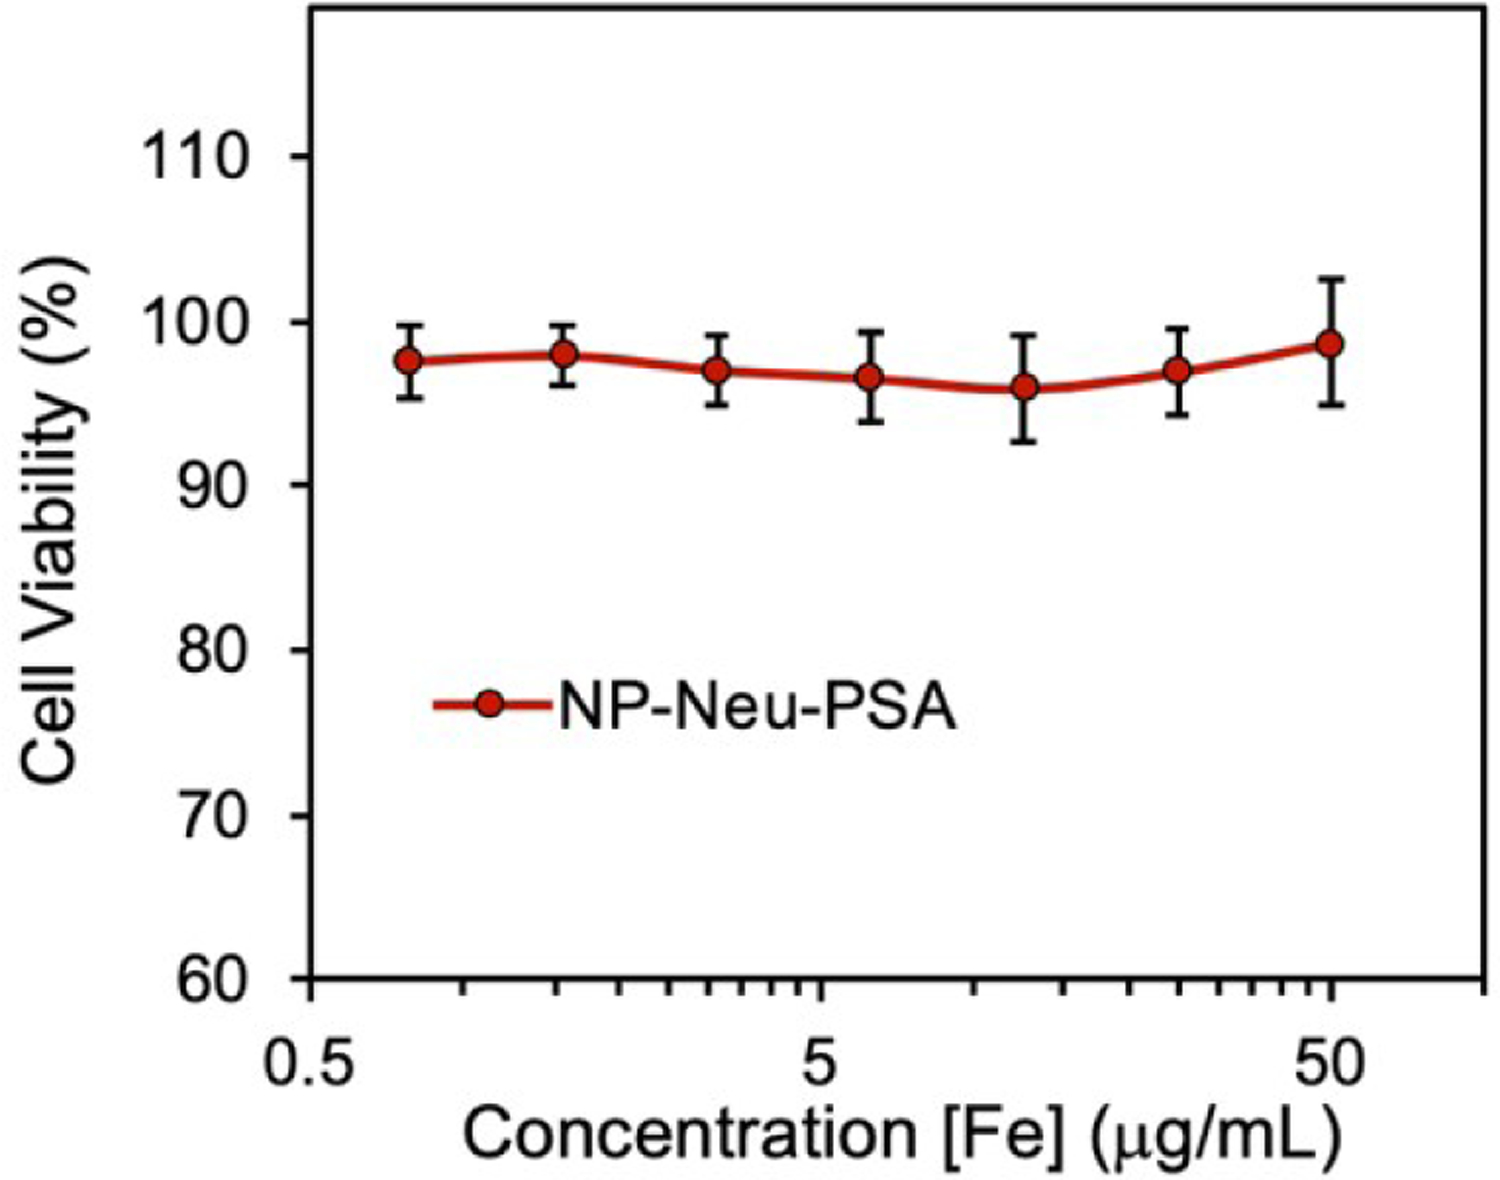
Viability of 4T1 breast cancer cells treated with IONP-Neu-PSA at various concentrations. 4T1 cells were incubated with IONP-Neu-PSA for 72 hours at 37°C and 5% CO2. All the data points at various [Fe] concentrations show no significant difference from each other as characterized by the two-tailed student t test (p > 0.05).
Apoptotic cell binding of IONP-Neu-PSA in vitro
To investigate the apoptotic cell binding capability of IONP-Neu-PSA, IONP-Neu-PSA and IONP-Neu (control NPs) were tagged with Cy5 fluorescent dye to form IONP-Neu-PSA-Cy5 and IONP-Neu-Cy5, respectively. Non-fluorescent chemotherapeutic drug paclitaxel (PTX) was used to induce cell apoptosis. A previous study showed that a dose of 10 μM PTX can inhibit 4T1 cell growth by more than 50%.43 In order to induce apoptosis on the majority of the cells, 4T1 cells were treated with 10 or 20 μM of PTX for 24 hours. 4T1 cells that were not treated with PTX were used as the negative control. IONP-Neu-PSA-Cy5 and IONP-Neu-Cy5 were then incubated with PTX treated 4T1 cells for 1 hour before analysis with a flow cytometer. Concurrently, commercially available Annexin V-Alexa Fluor 488 was applied to the same 4T1 treatment groups and served as a positive control. Based on the flow cytometry analysis, both Annexin V and IONP-Neu-PSA-Cy5 demonstrated successful labeling of apoptotic 4T1 cells (Fig. 6). IONP-Neu-Cy5 did not show a significant difference in signal intensity between PTX treated and untreated 4T1 cells (Fig. 6a), which indicates that IONP-Neu-Cy5 did not bind to apoptotic cells non-specifically without PSA. The flow cytometry analysis showed that IONP-Neu-PSA-Cy5 displayed a greater signal increase than Annexin V as the PTX concentration was increased (Fig. 6b and c). IONP-Neu-PSA-Cy5 showed a 166.5% and 632.5% increase in mean fluorescence intensity (MFI) in response to the 10 and 20 μM PTX treatments, respectively, as compared to the untreated cells (Fig. 6d). Comparatively, Annexin V only exhibited a 53.9% and 424.4% MFI increase in response to the 10 and 20 μM PTX treatments, respectively, as compared to the untreated cells. The PTX dosage-dependent apoptosis was also confirmed by bright field imaging (Fig. 6e). 4T1 cells treated with the higher PTX dosage displayed more pronounced growth inhibition (Fig. S5. Supplementary Information). In addition, at a higher PTX dosage, more 4T1 cells exhibited morphology change from the characteristic spindle-like normal cell morphology to the near-spherical unhealthy shape due to the loss of adhesion to cell culture plates. Apparently, an increase in PTX dosage from 0 μM (untreated) to 10 μM and subsequently to 20 μM increased the apoptotic sub-population in 4T1 cells. Since IONP-Neu-PSA-Cy5 NPs responded to the same increases in apoptotic cell sub-population with a greater increase in MFI than annexin V, IONP-Neu-PSA-Cy5 was shown to be more sensitive than annexin V in detecting apoptosis.
Fig. 6.
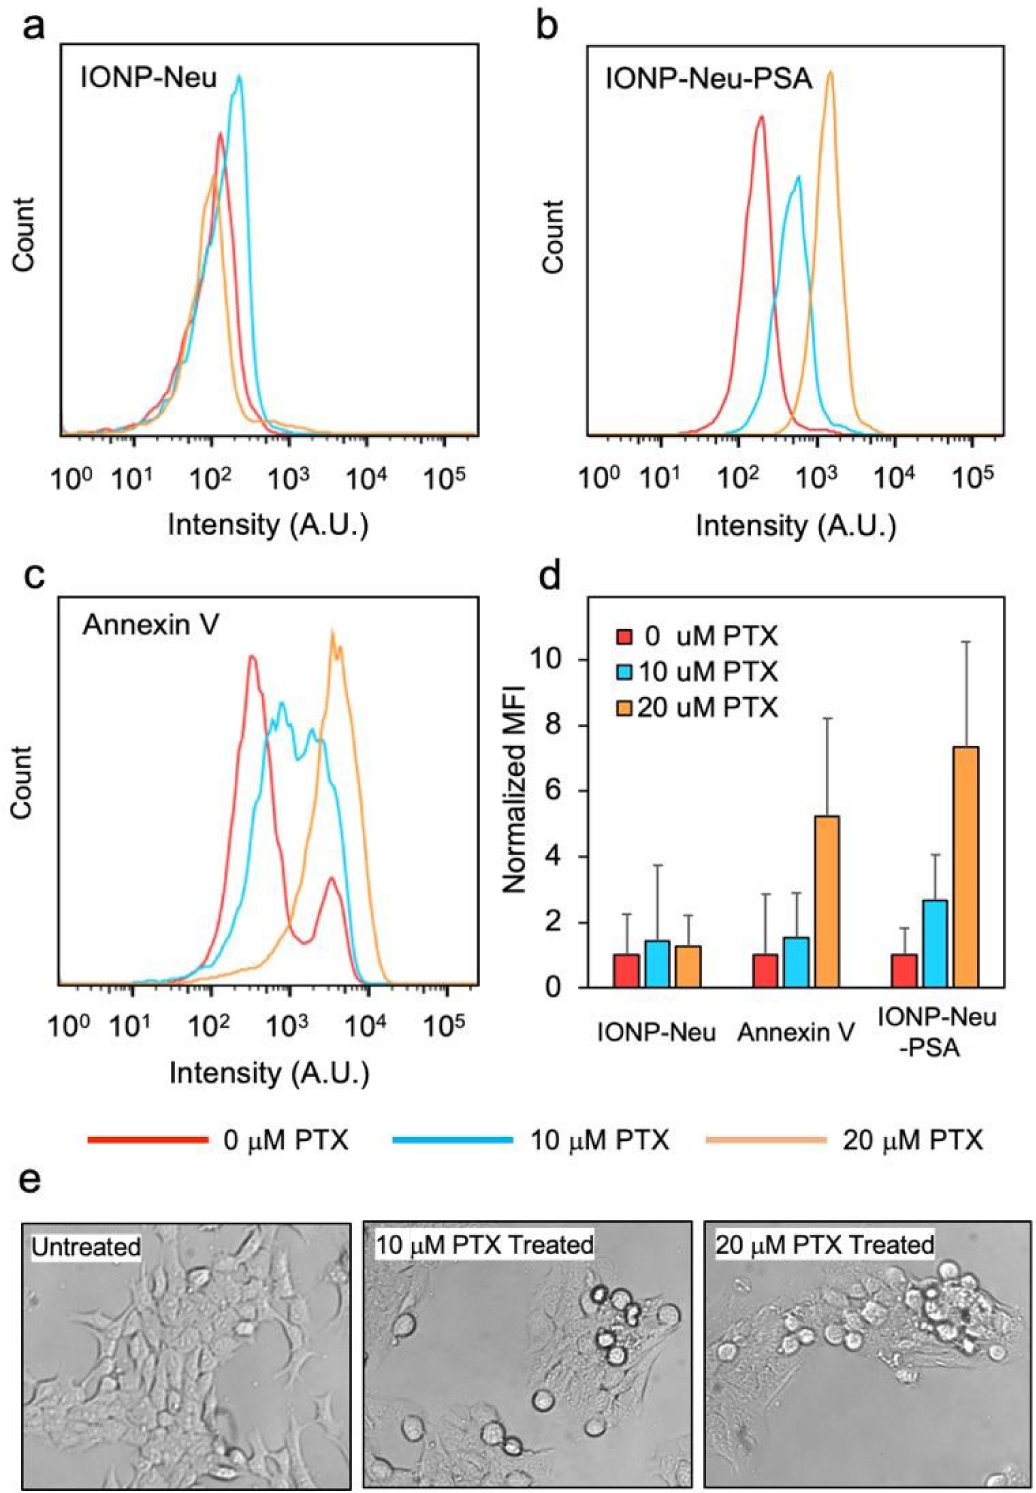
Assessment of apoptosis cell binding by IONP-Neu-PSA characterized by flow cytometry and optical imaging. Fluorescence intensity distributions of (a) IONP-Neu, (b) IONP-Neu-PSA and (c) Annexin V treated 4T1 cells. 4T1 cells were incubated with 0, 10, or20 μM of PTX for 24 hours to induce apoptosis prior to measurements. (d) Quantitation of apoptotic cell binding. The mean fluorescence intensity (MFI) of untreated 4T1 (0 μM PTX) control was normalized to 1 for IONP-Neu, Annexin V.
Confocal laser scanning microscopy was used to qualitatively confirm the apoptosis labeling by Annexin V and IONP-Neu-PSA (Fig. 7). Here, apoptosis of 4T1 cells was induced by treatment with 20 μM PTX. Untreated 4T1 cells served as the negative control. Annexin V-Alexa Fluor 488 and IONP Neu-PSA-Cy5 NPs were used to stain the cell plasma membrane. Propidium Iodide (PI) was used for cell nucleus staining. A chemotherapeutic drug-treated cell is at late apoptosis stages if its nucleus can be stained by PI.44,45 Annexin V and IONP-Neu-PSA-Cy5 both successfully labeled only the PTX-treated cells. However, slight background Annexin V staining on untreated cells was observed whereas IONP-Neu-PSA-Cy5 did not show any noticeable labelling on the untreated cells. This result corroborates with the flow cytometry data further confirming the superior apoptotic cells labelling specificity of IONP-Neu-PSA-Cy5. Notably, Annexin V concentrates mostly on the surface of the apoptotic cells whereas IONP-Neu-PSA-Cy5 traveled pass the membrane and resided within the cell. The mechanism of NP uptake in apoptotic cells is currently not well understood. NPs normally travel into cells via the receptor-ligand mediated endocytic pathway46,47 which requires cells to be biochemically active. Before loss of biochemical functions, apoptotic cells could possibly still uptake NPs via endocytosis. Yet other internalization mechanisms are also likely to be responsible.
Fig. 7.
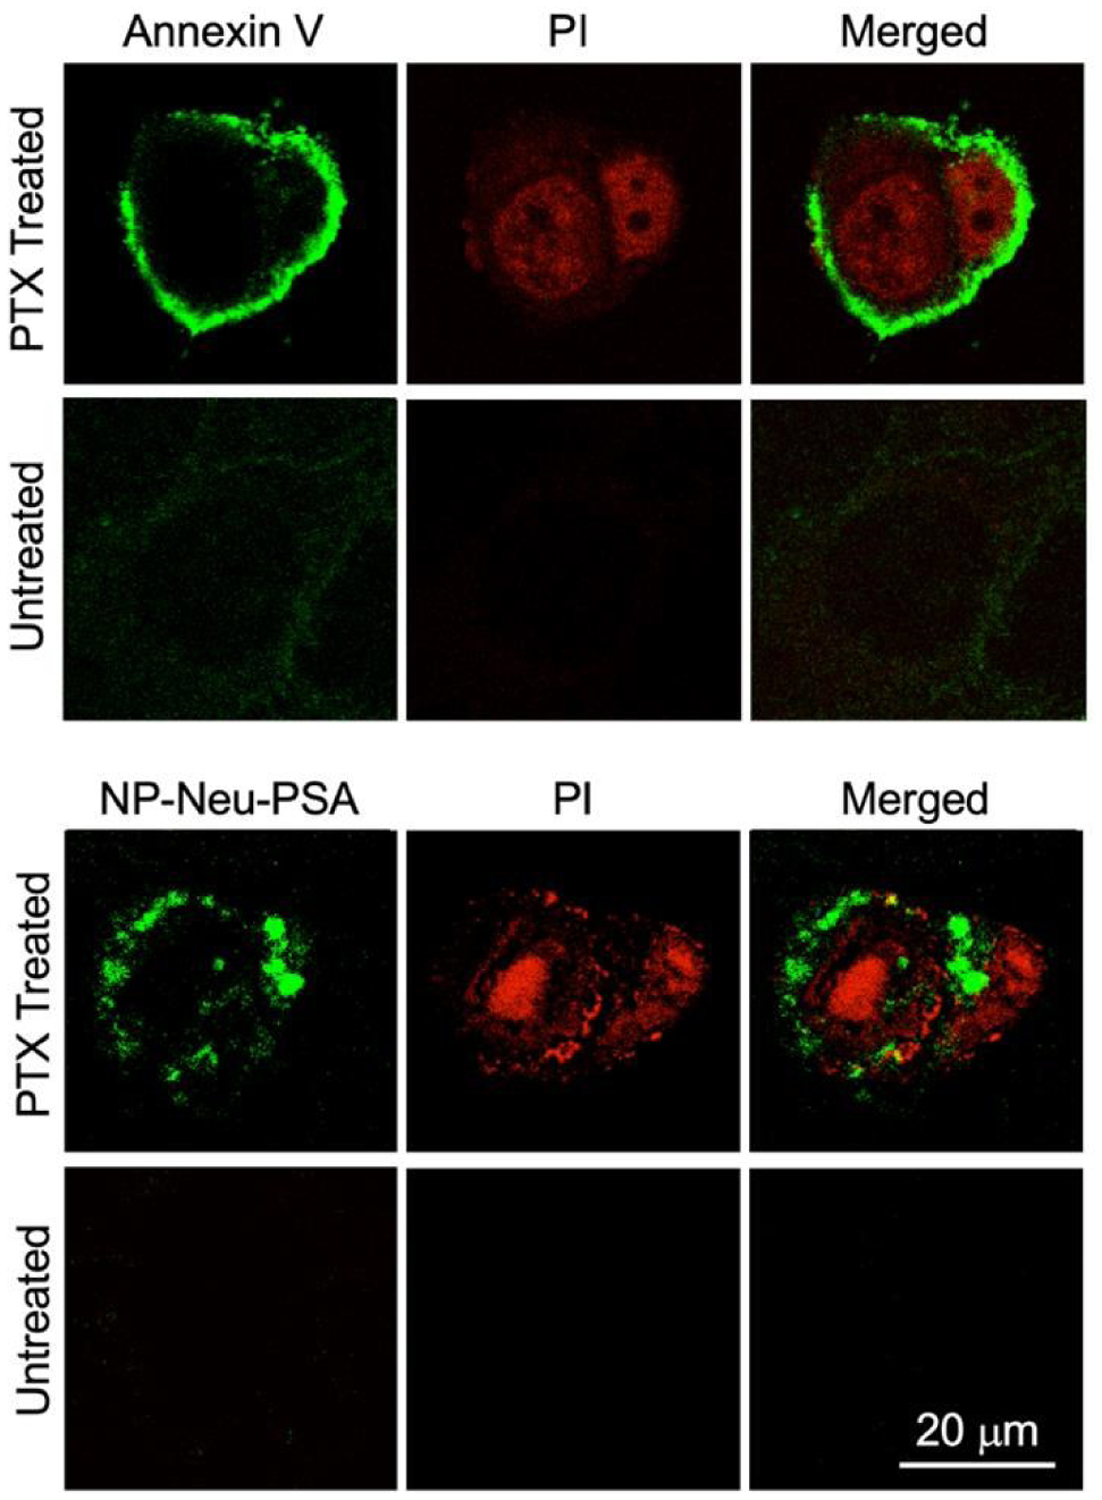
In vitro apoptotic cell labeling characterized by confocal microscopy. 4T1 cells were either treated with 20 μM PTX for 24 hours to induced apoptosis or received no PTX treatment as control. Both the treated and untreated cells were labeled with PI (red), and either Annexin V-AF488 (green) or IO NP-Neu-PSA-Cy5 (green). All the stained 4T1 cells were then mounted onto glass slides with anti-fade agent.
Real time apoptosis progression monitoring in vivo
IONP-Neu-PSA tagged with near-IR Cy5.5 fluorescent dye (IONP-Neu-PSA-Cy5.5) was administered to tumor bearing mice to evaluate the apoptosis labeling capability of IONP-Neu-PSA-Cy5.5 in vivo. Wild type Balb/cJ mice were first inoculated with 4T1 cells subcutaneously under the mammary fat pad to develop primary breast tumors. The injected 4T1 cells developed into palpable tumor spheroids in 12 days, at which point 200 μL of 5 mg/mL (40 mg/kg) hydrophilic chemotherapeutic drug doxorubicin (DOX) was administered intravenously to the tumor bearing mice to induce tumor apoptosis. Mice not administered DOX were used as negative controls. All mice received 100 μL of IONP-Neu-PSA-Cy5.5 (2.8 mg Fe/mL) administered via tail vein injection 72 hours after DOX treatment. All mice were then monitored by IVIS imaging (Excitation 710 nm, Emission filter ICG 810 nm – 875 nm) for 14 days.
Within the first 6 hours after IONP-Neu-PSA-Cy5.5 administration, intense Cy5.5 signal was found to accumulate in the lower abdominal region in mice, where liver and spleen are located, for both the DOX-treated and untreated mice (Fig. 8a). This phenomenon can be understood by considering the pharmacokinetics of NPs. After administered into bloodstream, most of the NPs will be phagocytosed by the mononuclear phagocyte system (MPS). Kupffer cells in liver and macrophages in splenic red-pulp play significant roles in MPS and are mainly responsible for eliminating foreign substances such as NPs.14,15,48 Therefore, it was expected that some IONP-Neu-PSA-Cy5.5 particles would initially accumulate in the liver/spleen region (abdominal region) (6h, Figure 8a), followed by a sharp decline in number (as indicated by the significant decrease in the fluorescence intensity in abdominal region) after most of the NPs had been cleared by the MPS (1d, Figure 8a). For the mice receiving no DOX treatment, weak and randomly distributed Cy5.5 signal was detected between days 1–6, indicating the nonspecific cellular uptake of IONP-Neu-PSA-Cy5.5 NPs in different organs and tissue. After day 6, the random Cy5.5 signal from untreated mice gradually dissipated and eventually disappeared completely by day 14. Notably in the tumor regions of untreated mice, the non-specific uptake signal quickly dropped to background level after day 1 and persisted at a similar level throughout the monitoring period (Fig. 8b). This observation further confirms that IONP-Neu-PSACy5.5 does not target untreated tumor cells (i.e., non-apoptotic cells). For the DOX treated mice, IONP-Neu-PSA-Cy5.5 NPs accumulated rapidly at the tumor site 6 hours after injection of IONP-Neu-PSA-Cy5.5 and started to emit clear persistent fluorescence signal at day 2. IONP-Neu-PSA-Cy5.5’s signal intensity reached optimum between day 6 and day 8 followed by slight decrease between day 11 and day 14.
Fig. 8.
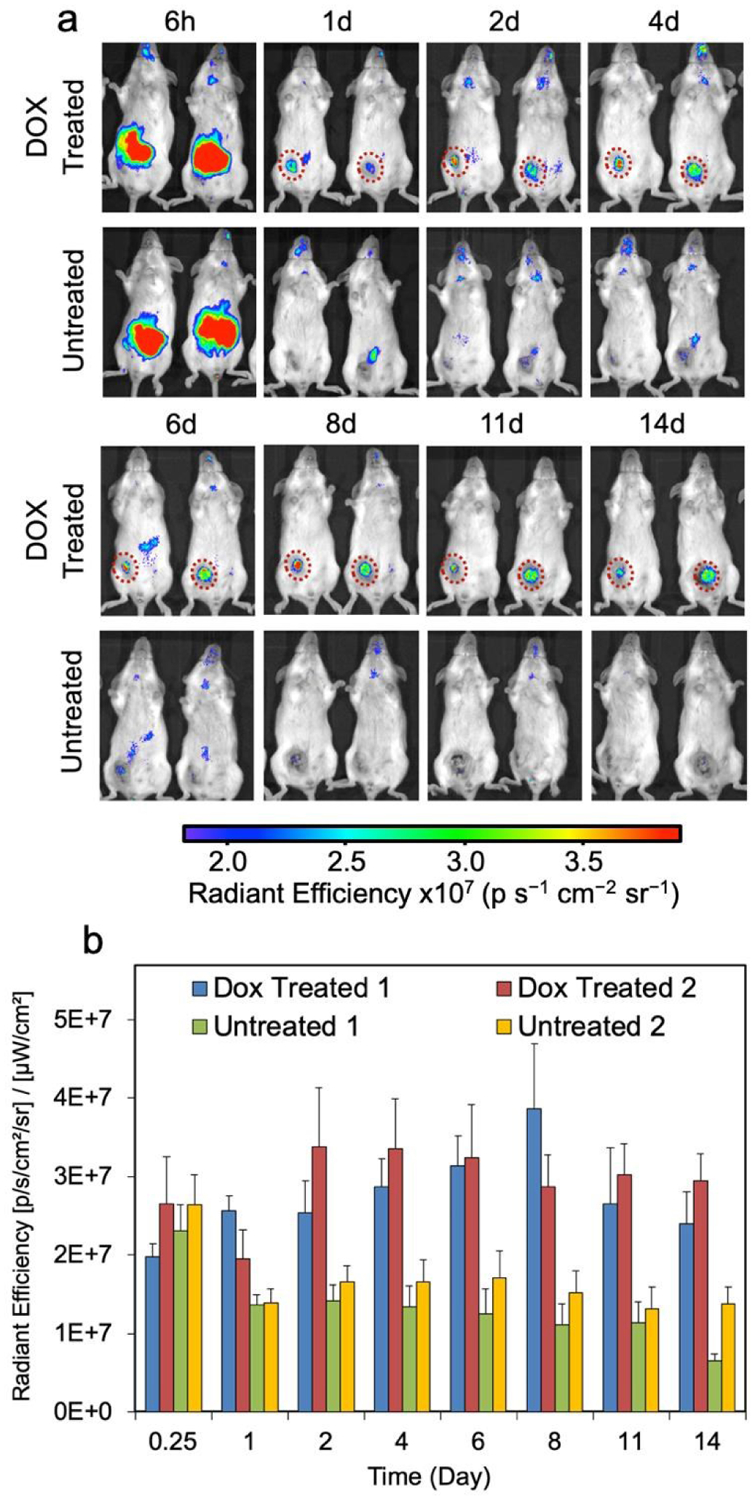
In vivo monitoring of apoptosis. (a) Representative Near-IR images of two groups of tumor-bearing mice, with one group treated with DOX and another group receiving no treatment. Mice were monitored with IVIS for 14 days starting 6 hours post IONP-Neu-PSA-Cy5.5 injection. IONP-Neu-PSACy5.5 labeled apoptotic tumor regions are highlighted with a red dashed circle. The left and right mouse of the untreated group in each image are designated as Untreated 1 and Untreated 2, respectively. (b) Quantitation of the near-IR fluorescent intensity in (a). The left mouse and the right mouse in the Dox treated panel are assigned as Dox Treated 1 and Dox Treated 2 respectively.
Macrophages can engulf apoptotic cells generated from normal tissue within 10 minutes so that these apoptosis events are virtually undetectable.49 On the other hand, tumor cells can effectively avoid clearance by phagocytes50,51 so that IONP-Neu-PSA-Cy5.5 NPs are trapped in apoptotic tumor mass to create a prolonged detection window. As a result, IONP-Neu-PSA-Cy5.5 was able to consistently colocalize with apoptotic tumor mass and precisely delineate the shape of apoptotic tumor mass between day 2 and day 14. In the long run, gradual decrease in fluorescence signal could indicate the clearance of apoptotic tumor cells. It is probable that as the apoptotic tumor cells are being cleared out, the IONP-Neu-PSA particles bound on or resided in the apoptotic cells would also be cleared out along with the apoptotic cells. Thus, IONP-Neu-PSACy5.5 could potentially reveal the changes in apoptotic cell population over time. Moreover, the high integrity of the signal from IONP-Neu-PSA-Cy5.5 remained unaffected with low background noise throughout the monitoring period. The fact that IONP-Neu-PSA-Cy5.5 primarily labels apoptotic tumor mass render it a reliable tool for evaluating long-term tumor treatment efficacy in vivo.
Conclusions
We have developed a NP that is highly selective and exhibits a persistent signal in monitoring of tumor apoptosis in vivo. IONP-Neu-PSA exhibited excellent mono-dispersity, sub-100 nm hydrodynamic size, a minimally negative surface charge, and serum stability which is ideal for in vitro and in vivo apoptosis labeling applications. IONP-Neu-PSA have T2 contrast enhancing property and can potentially serve as an apoptosis tracker with MRI. The NP bound PSA exhibits reliable apoptotic cell targeting in vitro and in vivo. Significantly, IONP-Neu-PSA-Cy5.5 demonstrates great utility in accurately labeling the apoptotic tumor mass in mice and generating near-IR fluorescent signal with outstanding integrity over an extended period of time. Therefore, IONP-Neu-PSACy5.5 may serve as a reliable probe for tumor apoptosis validation and a versatile tool for anticancer research.
Supplementary Material
Acknowledgments
This work was supported by NIH grants R01EB026890 and R01CA161953. We acknowledge the use of the equipment in Molecular Engineering and Science Institute’s molecular analysis facility supported by NSF (grant NNCI-1542101), UW W. M. Keck Microscopy Center (grant S10OD016240), 14T HRIM facility from Shared Instrumentation NIH Grant (S10RR029021), Department of Pathology’s flow cytometry core facility and the Department of Laboratory Medicine’s IVIS imaging suite at University of Washington.
Footnotes
Conflicts of interest
There are no conflicts to declare.
Footnotes relating to the title and/or authors should appear here.
Electronic Supplementary Information (ESI) available: [details of any supplementary information available should be included here]. See DOI: 10.1039/x0xx00000x
References
- 1.Niu G, Zhu L, Ho DN, Zhang F, Gao H, Quan Q, Hida N, Ozawa T, Liu G and Chen X, Theranostics, 2013, 3, 190–200. [DOI] [PMC free article] [PubMed] [Google Scholar]
- 2.Niu G and Chen X, Drugs in R & D, 2008, 9, 351–368. [DOI] [PubMed] [Google Scholar]
- 3.Laxman B, Hall DE, Bhojani MS, Hamstra DA, Chenevert TL, Ross BD and Rehemtulla A, Proceedings of the National Academy of Sciences, 2002, 99, 16551–16555. [DOI] [PMC free article] [PubMed] [Google Scholar]
- 4.Blankenberg FG, Katsikis PD, Tait JF, Davis RE, Naumovski L, Ohtsuki K, Kopiwoda S, Abrams MJ, Darkes M, Robbins RC, Maecker HT and Strauss HW, Proceedings of the National Academy of Sciences of the United States of America, 1998, 95, 6349. [DOI] [PMC free article] [PubMed] [Google Scholar]
- 5.Ke S, Wen X, Wu Q-P, Wallace S, Charnsangavej C, Stachowiak AM, Stephens CL, Abbruzzese JL, Podoloff DA and Li C, Journal of nuclear medicine : official publication, Society of Nuclear Medicine, 2004, 45, 108–115. [PubMed] [Google Scholar]
- 6.Niers JM, Kerami M, Pike L, Lewandrowski G and Tannous BA, Molecular therapy : the journal of the American Society of Gene Therapy, 2011, 19, 1090–6. [DOI] [PMC free article] [PubMed] [Google Scholar]
- 7.Shi H, Kwok RTK, Liu J, Xing B, Tang BZ and Liu B, Journal of the American Chemical Society, 2012, 134, 17972–17981. [DOI] [PubMed] [Google Scholar]
- 8.Boersma HH, Kietselaer BLJH, Stolk LML, Bennaghmouch A, Hofstra L, Narula J, Heidendal GAK and Reutelingsperger CPM, Journal of nuclear medicine : official publication, Society of Nuclear Medicine, 2005, 46, 2035–50. [PubMed] [Google Scholar]
- 9.Keen HG, Dekker BA, Disley L, Hastings D, Lyons S, Reader AJ, Ottewell P, Watson A and Zweit J, Nuclear Medicine and Biology, 2005, 32, 395–402. [DOI] [PubMed] [Google Scholar]
- 10.Tait JF, Smith C, Levashova Z, Patel B, Blankenberg FG and Vanderheyden J-L, Journal of nuclear medicine : official publication, Society of Nuclear Medicine, 2006, 47, 1546–53. [PubMed] [Google Scholar]
- 11.Edgington LE, Berger AB, Blum G, Albrow VE, Paulick MG, Lineberry N and Bogyo M, Nature Medicine, 2009, 15, 967–973. [DOI] [PMC free article] [PubMed] [Google Scholar]
- 12.Blum G, von Degenfeld G, Merchant MJ, Blau HM and Bogyo M, Nature Chemical Biology, 2007, 3, 668–677. [DOI] [PubMed] [Google Scholar]
- 13.Rosado JA, Lopez JJ, Gomez-Arteta E, Redondo PC, Salido GM and Pariente JA, Journal of Cellular Physiology, 2006, 209, 142–152. [DOI] [PubMed] [Google Scholar]
- 14.Chiarelli PA, Revia RA, Stephen ZR, Wang K, Jeon M, Nelson V, Kievit FM, Sham J, Ellenbogen RG, Kiem H-P and Zhang M, ACS Nano, 2017, 11, 9514–9524. [DOI] [PMC free article] [PubMed] [Google Scholar]
- 15.Lee MJ-E, Veiseh O, Bhattarai N, Sun C, Hansen SJ, Ditzler S, Knoblaugh S, Lee D, Ellenbogen R, Zhang M and Olson JM, PloS one, 2010, 5, e9536. [DOI] [PMC free article] [PubMed] [Google Scholar]
- 16.Jiang W, Kim BYS, Rutka JT and Chan WCW, Nature Nanotechnology, 2008, 3, 145–150. [DOI] [PubMed] [Google Scholar]
- 17.Zhang R, Lu W, Wen X, Huang M, Zhou M, Liang D and Li C, Journal of nuclear medicine : official publication, Society of Nuclear Medicine, 2011, 52, 958–64. [DOI] [PMC free article] [PubMed] [Google Scholar]
- 18.Schellenberger EA, Sosnovik D, Weissleder R and Josephson L, Bioconjugate Chemistry, 2004, 15, 1062–1067. [DOI] [PubMed] [Google Scholar]
- 19.Yuan Y, Ding Z, Qian J, Zhang J, Xu J, Dong X, Han T, Ge S, Luo Y, Wang Y, Zhong K and Liang G, Nano Letters, 2016, 16, 2686–2691. [DOI] [PubMed] [Google Scholar]
- 20.Kim K, Lee M, Park H, Kim JH, Kim S, Chung H, Choi K, Kim IS, Seong BL and Kwon IC, Journal of the American Chemical Society, 2006, 128, 3490–3491. [DOI] [PubMed] [Google Scholar]
- 21.Min Y, Li J, Liu F, Yeow EKL and Xing B, Angewandte Chemie - International Edition, 2014, 53, 1012–1016. [DOI] [PubMed] [Google Scholar]
- 22.Nauta AJ, Raaschou-Jensen N, Roos A, Daha MR, Madsen HO, Borrias-Essers MC, Ryder LP, Koch C and Garred P, European Journal of Immunology, 2003, 33, 2853–2863. [DOI] [PubMed] [Google Scholar]
- 23.Bilyy R and Stoika R, Autoimmunity, 2007, 40, 249–253. [DOI] [PubMed] [Google Scholar]
- 24.Bilyy RO and Stoika RS, Cytometry, 2003, 56A, 89–95. [DOI] [PubMed] [Google Scholar]
- 25.Bilyy RO, Antonyuk VO and Stoika RS, Journal of Molecular Histology, 2004, 35, 829–838. [DOI] [PubMed] [Google Scholar]
- 26.Tateno H, Nakamura-Tsuruta S and Hirabayashi J, Glycobiology, 2009, 19, 527–536. [DOI] [PubMed] [Google Scholar]
- 27.Park J, An K, Hwang Y, Park J-G, Noh H-J, Kim J-Y, Park J-H, Hwang N-M and Hyeon T, Nature Materials, 2004, 3, 891–895. [DOI] [PubMed] [Google Scholar]
- 28.Jenkinson M, Beckmann CF, Behrens TEJ, Woolrich MW and Smith SM, NeuroImage, 2012, 62, 782–790. [DOI] [PubMed] [Google Scholar]
- 29.Fang C, Bhattarai N, Sun C and Zhang M, Small, 2009, 5, 1637–1641. [DOI] [PMC free article] [PubMed] [Google Scholar]
- 30.Weissleder R, Stark D, Engelstad B, Bacon B, Compton C, White D, Jacobs P and Lewis J, American Journal of Roentgenology, 1989, 152, 167–173. [DOI] [PubMed] [Google Scholar]
- 31.Feng Q, Liu Y, Huang J, Chen K, Huang J and Xiao K, Scientific Reports, 2018, 8, 2082. [DOI] [PMC free article] [PubMed] [Google Scholar]
- 32.Chiarelli PA, Revia RA, Stephen ZR, Wang K, Jeon M, Nelson V, Kievit FM, Sham J, Ellenbogen RG, Kiem HP and Zhang M, ACS Nano, 2017, 11, 9514–9524. [DOI] [PMC free article] [PubMed] [Google Scholar]
- 33.Kievit F and Zhang M, Accounts of chemical research, 2011, 44, 853–862. [DOI] [PMC free article] [PubMed] [Google Scholar]
- 34.Krishnamurthy VM, Semetey V, Bracher PJ, Shen N and Whitesides GM, Journal of the American Chemical Society, 2007, 129, 1312–1320. [DOI] [PMC free article] [PubMed] [Google Scholar]
- 35.Krimm S and Bandekar J, Advances in protein chemistry, 1986, 38, 181–364. [DOI] [PubMed] [Google Scholar]
- 36.Lingegowsa DSC GS, Kumar K, Prasad AGD, MAHSA Zarei M, Romanian Journal of Biophysics, 2013, 22, 137–143. [Google Scholar]
- 37.Venyaminov SY and Kalnin NN, Biopolymers, 1990, 30, 1243–1257. [DOI] [PubMed] [Google Scholar]
- 38.Albanese A, Tang PS and Chan WCW, Annual Review of Biomedical Engineering, 2012, 14, 1–16. [DOI] [PubMed] [Google Scholar]
- 39.Chithrani BD, Ghazani AA and Chan WCW, Nano Letters, 2006, 6, 662–668. [DOI] [PubMed] [Google Scholar]
- 40.Blanco E, Shen H and Ferrari M, Nature Biotechnology, 2015, 33, 941–951. [DOI] [PMC free article] [PubMed] [Google Scholar]
- 41.Lundqvist M, Stigler J, Elia G, Lynch I, Cedervall T and Dawson KA, Nanoparticle size and surface properties determine the protein corona with possible implications for biological impacts, 2008. [DOI] [PMC free article] [PubMed]
- 42.Stephen ZR, Chiarelli PA, Revia RA, Wang K, Kievit F, Dayringer C, Jeon M, Ellenbogen R and Zhang M, Cancer Research, 2019, 79, 4776–4786. [DOI] [PMC free article] [PubMed] [Google Scholar]
- 43.Jeon M, Lin G, Stephen ZR, Kato FL and Zhang M, Advanced Therapeutics, 2019, 1900081. [Google Scholar]
- 44.Sawai H and Domae N, Biochemical and Biophysical Research Communications, 2011, 411, 569–573. [DOI] [PubMed] [Google Scholar]
- 45.Rieger AM, Nelson KL, Konowalchuk JD and Barreda DR, Journal of visualized experiments : JoVE, , DOI: 10.3791/2597. [DOI] [PMC free article] [PubMed] [Google Scholar]
- 46.Zhang S, Li J, Lykotrafitis G, Bao G and Suresh S, Advanced Materials, 2009, 21, 419–424. [DOI] [PMC free article] [PubMed] [Google Scholar]
- 47.Zhang S, Gao H and Bao G, ACS Nano, 2015, 9, 8655–8671. [DOI] [PMC free article] [PubMed] [Google Scholar]
- 48.Moghimi SM, Hunter AC and Andresen TL, Annual Review of Pharmacology and Toxicology, 2012, 52, 481–503. [DOI] [PubMed] [Google Scholar]
- 49.Lemke G, Nature Reviews Immunology, 2019, 19, 539–549. [DOI] [PMC free article] [PubMed] [Google Scholar]
- 50.Jaiswal S, Jamieson CHM, Pang WW, Park CY, Chao MP, Majeti R, Traver D, van Rooijen N and Weissman IL, Cell, 2009, 138, 271–285. [DOI] [PMC free article] [PubMed] [Google Scholar]
- 51.Oosterling SJ, van der Bij GJ, Meijer GA, Tuk CW, van Garderen E, van Rooijen N, Meijer S, van der Sijp JR, Beelen RH and van Egmond M, The Journal of Pathology, 2005, 207, 147–155. [DOI] [PubMed] [Google Scholar]
Associated Data
This section collects any data citations, data availability statements, or supplementary materials included in this article.


