

Abstract
Directed differentiation of human pluripotent stem cells to kidney organoids brings the prospect of drug screening, disease modelling and the generation of tissue for renal replacement. Currently, these applications are hampered by organoid variability, nephron immaturity, low throughput and limited scale. Here we apply extrusion-based 3D cellular bioprinting to deliver rapid and high throughput generation of kidney organoids with highly reproducible cell number and viability. We demonstrate that manual organoid generation can be replaced by 6- or 96-well organoid bioprinting and evaluate relative toxicity of aminoglycosides as a proof of concept for drug testing. In addition, 3D bioprinting enabled precise manipulation of biophysical properties including organoid size, cell number and conformation, with modification of organoid conformation substantially increasing nephron yield per starting cell number. This facilitated the manufacture of uniformly patterned kidney tissue sheets with functional proximal tubular segments. Hence, automated extrusion-based bioprinting for kidney organoid production deliver improvements in throughput, quality control, scale and structure, facilitating in vitro and in vivo applications of stem cell-derived human kidney tissue.
Keywords: pluripotent stem cell, kidney, kidney organoid, 3D bioprinting, nephrotoxicity
Introduction
Human pluripotent stem cells (hPSCs) represent a unique source of cells with the capacity to recreate models of early organogenesis. Recent advances in the directed differentiation of hPSCs to human kidney cell types 1–4, including our own protocol for the formation of 3D kidney organoids containing all key renal progenitor lineages, raise the prospect of the recreation of human kidney tissue from a single starting cell population. Such differentiation protocols, while hoped to facilitate drug screening or tissue engineering, require substantial improvements in scale-up, quality control and throughput for these applications to be realized (reviewed in Little and Combes, [2019] 5). Using our protocol 6,7, initial patterning of human pluripotent stem cells is performed as monolayer culture to day 7, by which time the culture has reached an intermediate mesoderm developmental stage, prior to kidney organoid formation (Figure 1A). Individual organoids are then generated manually by centrifuging a defined number of cells to form an aggregate which is placed on a Transwell filter for culture (Figure 1A). While approximately 20 organoids (5 × 10⁵ cells per organoid) can be generated from monolayer culture in a single well of a 6-well culture dish, the manual process of aggregating organoids is slow and imprecise as each organoid must be individually pelleted and placed onto a Transwell filter. The minimal organoid size is approximately 2 × 10⁵ cells due to the manual dexterity required to place a pellet smaller than this mass. Other protocols generate organoids via the placement of a specific cell number into a well-based low attachment format prior to subsequent differentiation 2 or by maintaining cultures as monolayers such that spontaneous but random formation of self-organizing kidney structures occurs across a field of non-renal cell types 1. All these approaches face challenges with respect to quality control and scale-up.
Figure 1. Generation of highly reproducible iPSC-derived kidney organoids via extrusion-based cellular bioprinting of day 7 intermediate mesoderm cell paste.

A. Diagram illustrating the protocol for manual versus bioprinted kidney organoid formation, comparing the relative cell count and speed of organoid generation between the two methods. B. Brightfield images of micromass cultures from day of printing (day 7 + 0) to day 20 of culture (day 7 + 20) depicting spontaneous nephron formation across time. Scale bars = 800μm. Images representative of ≥3 independent experiments. C. Wholemount immunofluorescence of a day 7 + 18 organoid showing patterned and segmented nephrons (distal tubule [E-CADHERIN, green], proximal tubule [LTL, blue], podocytes [NEPHRIN, white] and connecting segment/collecting duct [GATA3, red]). Scale bar =100μm. D. Wholemount immunofluorescence staining of day 7 + 18 bioprinted organoids showing proximal tubular segments (CD13, CUBN, LTL), tubular basement membranes (LAMININ), surrounding stroma (MEIS1/2/3), distal tubule/loop of Henle TAL (SLC12A1) and endothelium (CD31). Scale bars = 100μm. E. Brightfield (day 7 + 7) and wholemount immunofluorescence of manual and bioprinted kidney organoids generated simultaneously from the same batch of iPSC-derived intermediate mesoderm showing patterning and segmented nephrons in both (EPCAM, green: epithelium; LTL, blue: proximal tubule; NPHS1, white: glomeruli; GATA3, red: connecting segment/collecting duct). Scale bars = 100μm (brightfield) and 50μm (immunofluorescence). F. Demonstration of bioprinted kidney organoids showing the use of reduced numbers of cells at printing (500K, 400K, 300K) and the reproducibility of size across multiple wells (200K). G. 6-well Transwell® insert with 9 bioprinted organoids, each containing approximately 96,000 cells. H. Differentiation within bioprinted organoids is equivalent with reduced starting cell number. Images show H&E stained sections from mature organoids printed as either 2 × 10⁵ or 4 × 10⁵ cell organoids. Scale bar = 100μm. For C-E, H, images are representative of ≥ 3 stained organoids.
3D bioprinting of cellular bioinks, comprising either cells only (defined here as cell paste) or a combination of cells with hydrogels, enables the fabrication of tissues through an automated, spatially controlled, and reproducible deposition of living cells in defined geometric patterns 8–11. In addition to establishing some key features of native tissue architecture in vitro, bioprinting can also enhance reproducibility, improve throughput (both number and time) and provide finer resolution and smaller scale than can be achieved manually. Here we demonstrate the use of extrusion-based 3D bioprinting of cell paste to automate fabrication of self-organizing kidney organoids equivalent at the level of morphology, component cell types and gene expression to those previously reported via manual generation. The use of extrusion bioprinting to create a micromass culture on a Transwell filter facilitated the rapid generation of large numbers of highly reproducible kidney organoids. This was achieved using a variety of starting cell lines, including gene-edited fluorescence reporter induced hPSC (iPSC) lines 12. Fabrication was achieved in both a 6-well plate format, with multiple organoids per well, and a 96-well plate format with one organoid per well. The latter format was amenable to compound dosing suggesting the potential application of bioprinted organoids for toxicity testing. In addition, modifications to the 3D printing scripts to alter organoid biophysical properties were found to influence organoid morphogenesis, increasing the abundance of nephrons, conformation and maturity of epithelial structures. This facilitated the generation of kidney tissue sheets of increased area which have a higher nephron number and display evidence of functionality, providing a potential solution to scale-up for tissue manufacture.
Results
Bioprinting generates highly reproducible kidney organoids
The generation of kidney organoids and their placement on Transwell filters was a major target for automation. Starting with the same day 7 differentiation protocol as previously described 6,7, dissociation to a single cell suspension was used to create a wet cell paste free of any carrier hydrogel which was then loaded into a Hamilton syringe for automated deposition using a NovoGen MMX extrusion-based 3D cellular bioprinter (Figure 1A). This bioprinter format includes Hamilton syringe carriers that can be controlled with respect to mechanical volume extrusion, tip positioning (defined in X, Y and Z axes), tip movement, and speed. Automated scripting of the bioprinter enabled accurate deposition of a specific volume of cell paste at a defined needle tip location across a Transwell filter. The resulting bioprinted organoids were cultured as previously described 6,7 and showed spontaneous formation of nephrons across the subsequent 20 days of culture (Figure 1ABE). Immunofluorescence was used to establish the presence of classically patterned nephrons revealing the presence of podocytes (NEPHRIN), proximal tubules (LTL, CUBN), distal tubules/loop of Henle thick ascending limb (TAL; ECAD, SLC12A1) and connecting segments/ureteric epithelium (GATA3, ECAD) (Figure 1CD). The presence of additional cellular components, including endothelial cells (CD31) and renal stroma (MEIS1/2) was also evident (Figure 1D). Histological sections through bioprinted organoids revealed the presence of a contiguous connecting epithelium (ECAD, GATA3) across the width of the tissue from which individual nephrons radiated (Extended Data Figure 1ABC). It should be emphasised that cell paste represents cells only and does not incorporate any associated extracellular matrix or hydrogel matrix. The patterning achieved was compared to the outcome when the cell paste was centrifuged to remove all remaining media, creating a packed ‘dry’ cell paste (Supplementary methods). Subsequent culture of dry paste-derived organoids showed no evidence of nephron formation (Extended Data Figure 1D). Since kidney organoids show some variation between differentiation batches 13, to directly compare the cellular complexity of bioprinted with manually-pelleted organoids, the same monolayer differentiation was subjected to both approaches. The resulting kidney organoids were analysed using brightfield imaging and immunofluorescence, demonstrating that bioprinted kidney organoids showed morphological equivalence to manual kidney organoids (Figure 1E).
Bioprinting increases throughput and reduces organoid size
The automated process of bioprinting organoids applied here facilitated the deposition of approximately 1 micromass every 3 seconds (Supplementary Movie 1), with very high reproducibility of organoid diameter (Supplementary Table 1). While it is feasible to manually place micromasses consisting of as few as 2 × 10⁵ cells onto 24-well Transwell plates, bioprinting enabled accurate placement of multiple micromasses into the same filter (3 – 9 organoids per filter for 6-well plates) (Figure 1FG). It was also possible to reduce the number of cells used to generate the initial micromass without any loss of histological complexity within the organoid (Figure 1FH). The yield and throughput of the kidney organoid generation process could therefore be substantially increased, with kidney structure patterning evident in organoids bioprinted from as few as 4 × 10³ cells (Extended Data Figure 2AC). Indeed, the reproducibility of cell paste deposition, as assessed by volume printed and resulting mean diameter, showed a coefficient of variation between 1% and 4% (Supplementary Table 1).
The cell line transferability of bioprinting for kidney organoid generation was extensively evaluated using a variety of human induced pluripotent stem cell lines. Both control, reporter and patient-derived iPSC lines successfully generated kidney tissue when bioprinted in this fashion. For example, the use of a specific reporter line in which a blue fluorescent protein has been inserted under the control of the MAFB gene promoter (MAFBmTagBFP2) 14,15 facilitated the fluorescence imaging of viable tissue to visualise podocyte differentiation in the glomeruli that form at one end of each kidney nephron (Extended Data Figure 2B).
96-well format compound testing using bioprinted organoids
While the kidney plays a crucial role in the elimination of xenobiotics, the uptake of a variety of compounds via tubular specific solute channels places the kidney at risk for nephrotoxic injury 16. Preclinical screening for nephrotoxicity using primary renal proximal tubule epithelial cells (RPTEC) often fails to accurately predict organ-specific toxicity 17 owing to the rapid dedifferentiation of such cells in 2D culture, losing expression of key transporters and metabolic enzymes 18–20. While human kidney organoids have the potential to provide a more accurate and predictive tool for modelling drugs responses, this in part relies upon the capacity to generate large numbers of viable and reproducibly patterned organoids with a low coefficient of variation (cv). To this end, automated bioprinting was further scaled down (1.0 × 10⁵ starting cells per organoid) and adapted for fabrication of individual organoids onto 96-well Transwell filters (Figure 2AB). The accuracy of cell count and cell viability was reproducible across all 96 wells with overall cell viability ranging from 93 to 99% (Figure 2C). As a proof of concept for the application of this approach to nephrotoxicity testing, the effect of administration of a known podocyte toxin, the chemotherapeutic agent Doxorubicin 21, was first evaluated using bioprinted organoids after treatment for 72 hours in either 2μM or 10μM Doxorubicin (Figure 2D–F). Immunofluroescence staining of resulting organoids showed evidence of specific activation of caspase 3 and loss of MAFB staining within the podocytes of the organoid glomeruli in response to 10μM Doxorubicin (Figure 2D). Quantitative RT-PCR (qRT-PCR) showed the upregulation of the kidney injury molecule KIM1 (HAVCR) and the apoptotic indicator, Bcl2-associated X protein (BAX) at 10μM (Figure 2E). Doxorubicin also downregulated key podocyte markers NPHS1 and PODXL at 2μM, while the proximal tubule gene CUBN was only downregulated in response to 10μM Doxorubicin (Figure 3F), suggesting differential cell type-specific sensitivity with concentration. To further evaluate dose response, organoids were bioprinted into either 6-well or 96-well format and treated with 24nM - 25μM Doxorubicin, using ATP content as a viability readout. Viability was affected by Doxorubicin exposure in a dose-dependent fashion with both 6- and 96-well formats producing similar IC50 values in response to treatment (6-well IC50: 3.9 ± 1.8 μM; 96-well IC50: 3.1 ± 1.0 μM) (Figure 2G). This is in line with previously published IC50 values for renal epithelial cell lines such as HK2 (IC50 = 5uM) 22. Aminoglycosides are a class of broad-spectrum antibiotics commonly used to treat infections caused by Gram-negative pathogens 23. Kidney injury due to acute tubular necrosis is a common complication of aminoglycoside therapy due to high intracellular accumulation within proximal tubule cells. To assess the response of kidney organoids to this class of compound, organoids were bioprinted in a 96-well format and treated with a panel of known nephrotoxic aminoglycosides, including Amikacin, Tobramycin, Gentamycin, Neomycin and Streptomycin, across a wide concentration range. Cell viability as measured by cellular ATP content was decreased in a concentration-dependent fashion following 72 hour treatment with all aminoglycosides evaluated (Figure 2H). We conclude that bioprinting represents a practical approach to drug testing.
Figure 2. Application of bioprinted organoids for compound testing in 96-well format.

A. Bioprinted day 7 + 18 organoids within a 96-well Transwell format (1× 10⁵ cells per organoid). B. 96-well plate within plate holder on print stage. C. Quality control assessment of cell number per organoid and viability across a 96-well plate. Error bars show SD for cell number measurements (see Methods). D. Immunofluorescence after 10μM Doxorubicin treatment depicts podocytes (MAFB), apoptotic cells (cleaved caspase 3 [CC3]), distal tubules (cytokeratin 8/18; CCK8/18), proximal tubules (LTL) and nuclei (DAPI). Images representative of n = 3 experiments, Scale bars = 50μm. E. Expression of kidney injury molecule-1 (HAVCR) and apoptosis genes (CASP3, BAX) after Doxorubicin treatment (n = 3 per treatment group, n = 2 for controls). 10μM Doxorubicin increases HAVCR (p < 0.0001) and BAX (p = 0.04) expression. F. Expression of podocyte (NPHS1, PODXL) and proximal tubule (CUBN) genes after Doxorubicin treatment (n = 3 per treatment group, n = 2 for controls). NPHS1 and PODXL are decreased at both doses (p < 0.0001 for all). CUBN expression is decreased with 10μM treatment (p = 0.0019). For E. and F significance was determined by two-way ANOVA, with Dunnett’s multiple comparison test. **** = p < 0.0001, ** = p < 0.01. Error bars = SD, shaded bars = mean. G. Cell viability 72 hours after Doxorubicin treatment in 6-well (green) or 96-well (blue) format. 6-well data are n = 6 (control) or n = 3 (treatment) per dose from 3 independent experiments. 96-well data are minimum n = 1, maximum n = 3 per dose from a single experiment. Error bars = SD, shaded bars = mean. Curves represent a non-linear fit for each plate type, total n = 27 (6-well) or n = 22 (96-well). H. Application of 96-well bioprinted organoids for testing viability in response to aminoglycoside antibiotics. Curves represent a non-linear fit for each compound; n = 19 (Amikacin), n = 24 (Tobramycin), n = 30 (Gentamycin), n = 30 (Neomycin), n = 22 (Streptomycin).
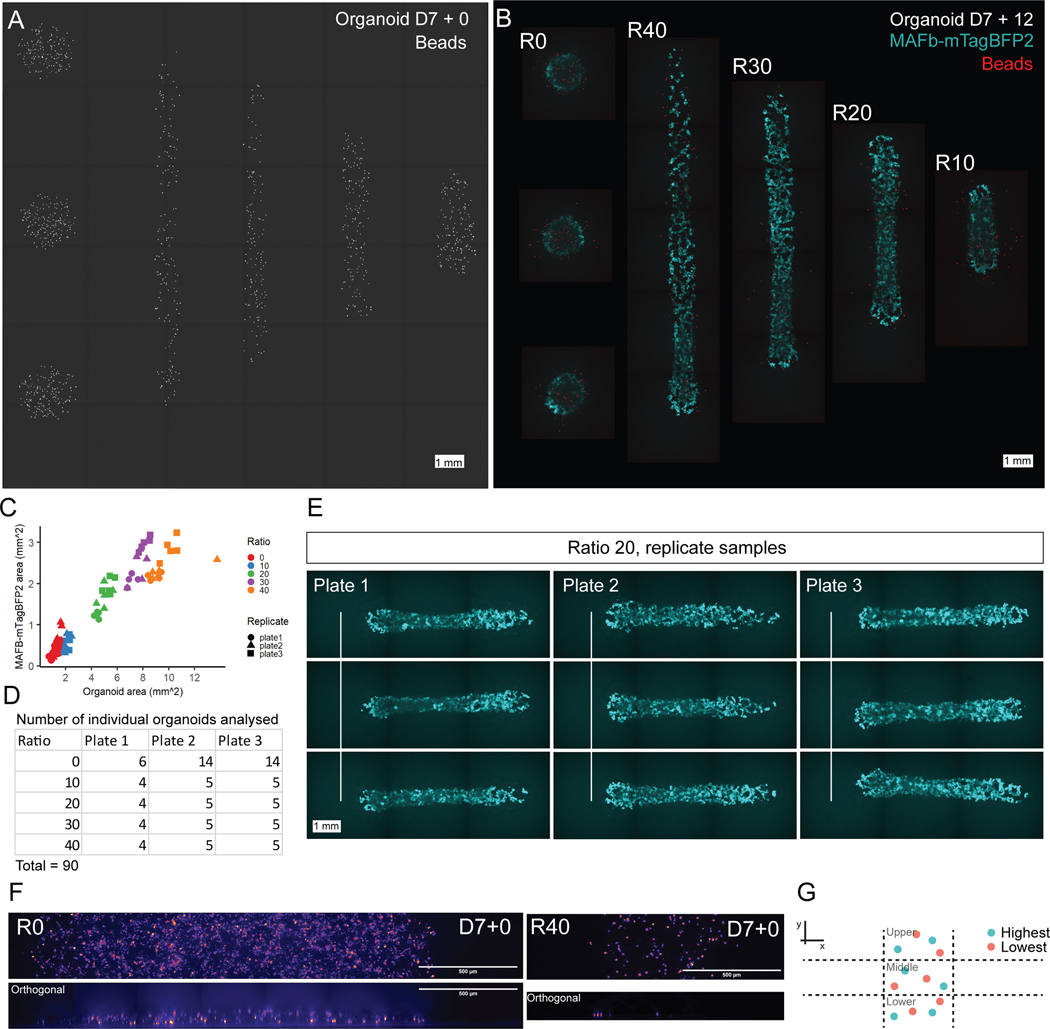
Figure 3. Use of extrusion bioprinting to alter organoid conformation.

A. Generation of organoids of increasing length from an identical starting cell number (1.1 × 10⁵ cells). Diagram illustrates the relative effect on organoid profile / height at bioprinting, moving from ratio 0 (no needle movement at extrusion) to ratio 40 (extrusion with needle movement across the Transwell surface), not to scale. Ratio refers to the ratio of tip movement to extrusion B. Ratio 0 and 40 cell paste depositions containing fluorescent beads to measure cell paste spread across the Transwell surface. Representative images from dataset used for quantification in C. Dotted lines marks the edge of cell paste. C. Quantification of beads density per unit of Transwell surface area. Higher ratios give more spreading and hence lower beads densities (n = 21 organoids total [n = 3 per condition, except for ratio 0 where n = 9]). D. Measured tissue height at D7+0, shortly after bioprinting (n = 27 organoids from 2 independent experiments). E. Measured organoid height at day 7 + 12 for organoids printed with varying conformations (n = 21 organoids). Red points in D and E represent mean value. Note that the Y-axis scale differs between D and E (also refer to Extended Data Figure 3). F. Fluorescence imaging of live organoids printed in varying conformations and generated using the MAFBmTAGBFP2 reporter line. Blue fluorescent protein marks glomerular area. G. Quantification of mTagBFP2 area versus organoid length in replicate bioprinted organoids of different conformations. Each point represents a single organoid (n = 90 organoids total, see Extended Data Figure 3). H. Immunofluorescence of representative bioprinted organoids from each conformation (n = 3 organoids stained) showing MAFBmTagBFP2 (glomeruli, endogenous blue fluorescence), epithelium (EPCAM, grey), proximal tubule (LTL, green) and connecting segment/collecting duct (GATA3, red). Scale bar = 100μm.
Organoid conformation impacts patterning and nephron number
As well as providing greater quality control and increased throughput, generating organoids via bioprinting allowed us to investigate the effect of changing organoid conformation on tissue morphology. Extrusion bioprinting allows control over the scale and conformation of the cellular micromass formed via precise positioning and movement of the needle tip in 3 dimensions as the cells are extruded. Changing the speed of tip movement for a given rate of cell extrusion allows fine control over tissue thickness as cells are spread, and subsequently aggregate, over larger surface areas (Figure 3A). Tissue conformations were defined in terms of the deposition ratio, given by the ratio of tip movement along the Transwell surface to the volume of cell suspension deposited. The bioprinter was programmed to create organoids comprising the same total cell number (1.1 × 10⁵ cells) but varying from a single point deposition (ratio 0, no tip movement at extrusion) to a line of cells ~12mm long (ratio 40, movement of 12 mm during extrusion) (Figure 3AF). The end result was the formation of a classical organoid structure, where the micromass is deposited as a ‘dot’, to organoids created as ‘lines’ of extruded cell paste. With increasing deposition ratios we increased the line length to maintain the same absolute number of starting cells in each organoid approximately equal (1.1 × 10⁵ cells) giving rise to thinner cell masses spread out over a larger surface area. To confirm this empirically, cell paste was spiked with fluorescent beads that would undergo a similar degree of spreading but were easily imaged and automatically quantified at printing (Figure 3B, Extended Data Figure 3). This allowed the calculation of number of beads per mm2 of Transwell surface area occupied (Figure 3C, Supplementary methods). As expected, bead density dropped as cells were spread over a greater distance, with approximately threefold difference between the most and least dense condition (Figure 3C). We also measured tissue height in the first 24 hours after bioprinting using 3D confocal microscopy. Measuring tissues where cells had been sparsely labelled allowed us to carefully identify the position of cells at the upper and lower limits of each organoid, confirming that higher deposition ratios gave rise to thinner tissue masses (Figure 3D, Extended Data Figure 3F–G).
We next generated replicate sets of organoids at the measured conformations and allowed them to differentiate and pattern for 12 days after bioprinting. The absolute tissue height of each organoid after 12 days of culture was measured and compared to the starting height at cell extrusion (Figure 3DE). While height increased in both conformations as they grew, the thicker starting organoids remained thicker after culture (Figure 3E). For these experiments, cell paste was generated using a MAFBmTagBFP2 reporter line 14,15. MAFBmTagBFP2 expression coincided with staining for the NPHS1 (nephrin) protein, illustrating the specificity of MAFB-driven blue fluorescence to the podocytes within the forming glomeruli (Extended Data Figure 4). Hence, fluorescence imaging of viable organoids enabled the quantification of MAFB-positive area as a surrogate for nephron number (Figure 3F, Extended Data Figure 3). Organoids with a long, thin starting conformation had a greater total mTagBFP2-positive glomerular area than small, thick organoids (Figure 3G), despite being derived from an equal number of starting cells. This trend was consistent across the gradient of densities and was likely due to a larger volume of nephron tissue overall, as all conditions contained glomerular structures. High resolution imaging of individual glomeruli in each conformation confirmed glomerular structures were of a similar size irrespective of organoid conformation (Extended Data Figure 4). Hence, thin organoids bioprinted with higher deposition ratio show increased nephron number.
As well as glomerular number, changes in organoid conformation appeared to affect organoid morphology, with unpatterned stromal tissue most apparent in the center of ratio 0 organoids (Figure 3H). To examine this shift in patterning further, bulk-RNA-sequencing (RNAseq) transcriptional profiling was performed to compare ratio 0 ‘dot’ organoids with ‘line’ organoids of two different lengths (ratio 20 and ratio 40), all generated simultaneously and with the same starting cell number. Genes related to epithelial formation (CDH1, EPCAM) and tubule patterning and function (HNF4A, CUBN, LRP2, SLC12A1) were upregulated at ratio 40 (R40), while genes related to vascular (FLT1, SOX17, PECAM) and stromal / fibroblast (THY1, DCN) development were upregulated at ratio 0 (R0) (Figure 4A, Supplementary Table 2). A GO analysis of pathway changes also suggested improved membrane transport, extracellular organization and cell-cell adhesion in R40 lines compared to bioprinted R0 dots (Figure 4B). Such changes may reflect changes in relative ratios of cell types or individual levels of gene expression within such cell types. High resolution imaging of ratio 0 and ratio 40 stained organoids showing the location of glomeruli (endogenous mTagBFP2), proximal tubules (HNF4A) and endothelial cells (SOX17) revealed the presence of a wide rim of tissue containing a vascular network in dots that was reduced in lines (Figure 4CD). These conventional micromass dots also showed a central core in which nephrons were not forming (Figure 4D; Supplementary Movie 2). Conversely, when organoids were bioprinted as a line, nephrons were present uniformly across the width of the tissue (Figure 4CD, Supplementary Movie 3).
Figure 4. Changing organoid conformation reduces unpatterned tissue and increases nephron number and maturation (also refer to Extended Data Figure 4).

A. Heatmap comparing scaled log counts per million expression values in bulk-RNAseq transcriptional profiles of ratio 0 (R0), ratio 20 (R20) and ratio 40 (R40) organoids. B. Heatmap of scaled log counts per million expression values of genes representing the top most significantly enriched GO terms in ratio 40 vs ratio 0 organoids. C. Immunofluorescence to validate transcriptional changes (n = 3 representative organoids stained per condition from total n = 90), illustrating a reduction in the endothelial marker SOX17 and an increase in the loop of Henle thick ascending limb (TAL) marker SLC12A1 as ratio increases. Scale bars = 100μm. D. 3D rendering of bioprinted organoids, illustrating the distinct morphology between a ratio 0 and a ratio 40 organoid. A single representative stained organoid from data in C was imaged at high resolution. Images are rendered to show the XY plane tilted at 45 degrees. Movies of these rendered images are provided as Supplementary data (Supplementary Movies 2 and 3).
Organoid conformations possess similar cellular compositions
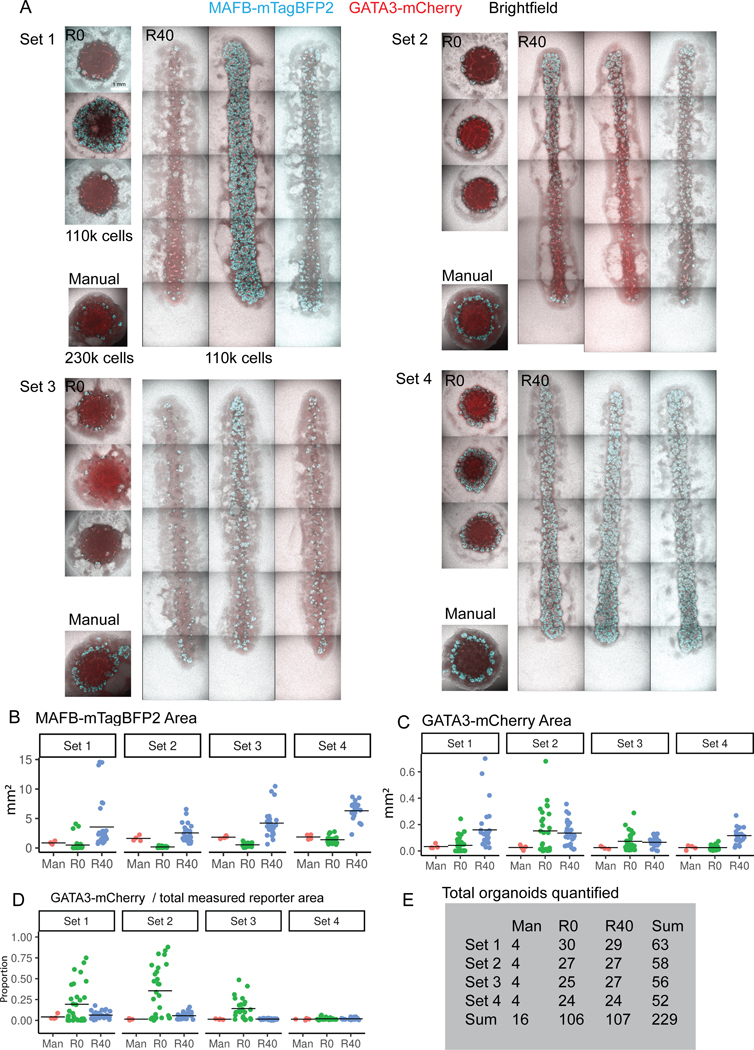
To determine whether transcriptional differences between organoids of differing conformation reflect relative cellular composition or maturation of individual component cell types, we performed extensive single cell RNAseq (scRNAseq) of the three organoid conformations (manual organoids, bioprinted ratio 0 deposition ‘dots’ [R0] and bioprinted ratio 40 deposition ‘lines’ [R40]). As we have previously reported variation in patterning between individual differentiation experiments 13, libraries were generated from 4 individual differentiation experiments. Each experiment represented a distinct starting pool of differentiated iPSC (MAFBmTAGBFP2GATA3mCherry) cells bioprinted to produce both R0 dots and R40 lines, as well as to generate manual organoids in parallel. Cells from replicate experiments were antibody barcoded before being pooled to produce a single library per conformation, thus retaining information about variability between replicates (Figure 5A, Supplementary Methods). Resulting scRNAseq libraries resolved approximately 9000 to 13000 individual cell transcriptomes per organoid conformation. Image quantification of glomerular (MAFBmTagBFP2) and distal nephron (GATA3mCherry) area for all organoids generated (n = 229 organoids, from 4 replicate sets across 10 plates) confirmed the previously observed organoid morphology for all conformations, with a clear and quantifiable increase in abundance of nephrons in bioprinted lines, despite the same starting cell number (Figure 5B, Extended Data Figure 5). Indeed, bioprinted lines contained a greater area of glomeruli even when compared to manual organoids which were made with a larger starting cell number (manual: 2.3 × 10⁵, R40: 1.1 × 10⁵, Figure 5B, Extended Data Figure 5).
Figure 5. Single cell RNAseq comparison of manual organoids, bioprinted R0 ‘dots’ and bioprinted R40 ‘lines’.

A. A single scRNAseq library per condition was generated from multiple barcoded organoids sets. R40 and R0 were generated from 1.1 × 10⁵ cells, manual organoids from 2.3 × 10⁵ cells. B. MAFB reporter area is increased, indicating greater nephron number in R40 organoids. Bars indicate mean. R40-Man, p = 2.1 × 10⁻⁵, R40-R0, p = 2 × 10⁻¹⁶ (two-sided t-tests with the Holm correction for multiple comparisons). See Extended Data Figure 5. C. UMAP of stromal lineage scRNAseq data. See Extended Data Figure 6F and Supplementary Table 5. D. Cluster proportions by replicate and condition. P-value is stated where p < 0.2 (one-way ANOVA). Red diamonds represent mean for n = 4. E. UMAP of nephron lineage scRNAseq data. See Extended Data Figure 6D and Supplementary Table 4. F. Cluster proportion per condition. P-values as for D. For cluster 4, p = 0.021 for R40 vs Man (Tukey multiple comparison test, following ANOVA). G. Total number of filtered differentially expressed (DE) genes per pseudo-bulk comparison for nephron clusters. (Adjusted p-value < 0.05, Benjamini-Hochberg correction, see Supplementary Methods). Full gene lists and p-values are in Supplementary Data 1. H. R40 proximal tubule cells show significantly increased expression of genes associated with proximal tubule maturity (SLC30A1, SLC51B, FABP3, SULT1E1) and decreased expression of genes associated with early immature tubule (SPP1, JAG1) compared to manual organoids. Violin plots show the distribution of normalised single cell expression values, with individual cell values overlayed. I. Total number of filtered DE genes per pseudo-bulk comparison for stromal clusters (Supplementary Data 1). J. RSPO3 and WNT5A are significantly increased in R40 vs manual stromal cluster 2 cells. K, L. Genes associated with nephron progenitor identity are significantly increased in K. R40 vs Manual (HOXA11, FOXC2) and L. R40 vs R0 (EYA1, SIX1) stromal cluster 3 cells.
Single cell datasets across all experiments were integrated using Seurat (25), allowing the broad identification of endothelial, stromal and nephron clusters in all organoid conformations (Extended Data Figure 6A–C, Supplementary Table 3). To determine the cell types contributing to the differential gene expression seen in the bulk profiling (Figure 4), the combined transcriptional profile of each main cell type was used to recreate a ‘pseudo bulk’ expression profile (Supplementary Methods). This confirmed that genes upregulated in bulk RNAseq of R0 dots were markers of endothelial cells, while genes upregulated in R40 lines were nephron markers (Extended Data Figure 6H).
Re-clustering of the stromal cells present within all organoid conformations revealed 10 distinct clusters (Figure 5C, Supplementary Table 5. While there was a trend towards an increase in cluster 7 (expressing WNT5A, LHX9) and a decrease in cluster 10 (expressing ZIC1, ZIC4) in bioprinted organoids, these differences were not statistically significant (Figure 5D, Extended Data Figure 6). Overall, all stromal clusters were present in all organoid conformations with no statistically significant difference in proportion of each cell type. This was surprising given the apparent unpatterned centre in R0 and manual organoids. However, re-analysis of these organoids using immunofluorescence for stromal markers identifying the majority of the dataset (MEIS1/2/3, SIX1 and SOX9) suggested an area of reduced cellularity in this central region (Extended Data Figure 7). Hence, the central core was likely a minor contributor to any cell cluster.
Higher resolution re-clustering of nephron lineage cells in the scRNAseq dataset revealed the presence of all major nephron cell types in all organoid conformations (Figure 5E–F, Extended Data Figure 6D–E, Supplementary Table 4), with clear expression of MAFB in podocytes, HNF4A in proximal tubule and GATA3 in distal tubule clusters (Extended Data Figure 6D–E). There was a significant increase in the prevalence of early podocytes (‘Pre-Pod’) (mean values of ~5% vs ~10–15%) (Figure 5F) and a trend towards increased podocytes (‘Pod’) in bioprinted versus manual organoids, as well as a trend towards increased prevalence of distal tubule in manual and R0 organoids, the latter being supported by an increase in the proportion of GATA3mCherry expressing distal nephron in R0 organoids (Extended Data Figure 5D). However, all identified cell clusters were present in all organoid conformations (Figure 5F, Extended Data Figure 6D). We conclude that the patterning is very similar between all organoid conformations, but that the total nephrons formed is greater in bioprinted lines.
Line organoids show improved maturation and nephron number
To investigate potential differences in maturation, we identified genes within each cell cluster that were significantly differentially expressed between conformations (Supplementary Data 1). This revealed the greatest difference between manual organoids and R40 bioprinted lines (Figure 5G), notably in the identity of the distal nephron. There were less differences between individual nephron cell types between R0 and R40 bioprinted organoids, with the greatest number of differentially expressed genes occurring within the nephron progenitors (Figure 5G). Importantly, there was evidence of improved maturation of the proximal tubular epithelium in bioprinted R40 lines, but not bioprinted R0 dots, compared to manual organoids. Genes previously associated with mature tubule function and metabolism, including key solute channels (SLC30A1, SLC51B and SULT1E1) and fatty acid metabolismrelated gene FABP3 24–27 were significantly increased in R40 versus manual organoid proximal tubule cells (Figure 5H). Conversely, significantly higher expression of markers such as JAG1 and SPP1 in manual organoid cells suggested less maturity (Figure 5H).
Differential expression analysis within stromal clusters identified the greatest difference between conformations within stromal clusters 0, 1, 2 and 3 (Figure 5I, Supplementary Data 1). Clusters 2 and 3, with identify most similar to early kidney forming mesenchyme, showed a significant upregulation of kidney development genes in bioprinted R40 lines, including HOXA11, FOXC2, EYA1 and SIX1 as well as developmental signalling genes WNT5A and RSPO3 (Figure 5J–L). Thus, while this stromal cell type was present in all conformations, in bioprinted lines these cells appear to have an identity that more closely resembled early nephron progenitors. This may contribute to the increase in nephrons in bioprinted lines.
To more definitively compare the maturation of distinct organoid conformations, we used an independent analysis approach in which the cellular identity of each cell within organoids was predicted based upon a direct comparison to human fetal kidney. Using the scPred method we generated a model to predict cellular identity based on transcriptional similarity to a published human fetal kidney (week 11 to 18 gestation) scRNAseq training dataset (Extended Data Figure 8A). This model was used to reanalyse all organoid data to provide an unbiased prediction of cell type within organoids. This approach again identified significant increases in pre-podocyte cells within R40 organoids (Extended Data Figure 8B). Genes shown to be differentially expressed in the R40 proximal tubule cell cluster were selectively expressed within the most mature proximal tubule cells in human fetal kidney (Extended Data Figure 8D). It can therefore be concluded that, despite experimental variation, bioprinted lines showed improved nephron maturation and increased glomerular number compared to other conformations.
Generating kidney patches to increase nephron number
The capacity to utilise stem-cell derived kidney tissue for renal replacement therapy has not been established. However, several previous studies have reported the vascularisation and functional maturation of kidney organoids after transplantation under the renal capsule of recipient immunocompromised mice 28–30. While pluripotent stem cell-derived kidney organoids show strong transcriptional congruence with human fetal kidney, including the presence of a nephron progenitor population 31,32, ongoing nephron formation in organoids is not maintained long term 33. Unlike the developing kidney, a fixed number of nephrons forms in an organoid with no evidence of ongoing nephron formation with time. Takasato et al. 7 reported the presence of approximately 100 nephrons within a Transwell-cultured micromass kidney organoid initiated with 5 × 10⁵ cells. The human kidney has been estimated to contain approximately 1 × 10⁶ nephrons 34, while a mouse kidney contains 14,000 – 16,000 nephrons 35. Hence, the path to therapy using stem cell-derived kidney tissue requires a capacity to substantially increase the number of nephron structures present in the tissue to be transplanted. By changing kidney organoid conformation using extrusion bioprinting, we can improve final nephron number from the same starting cell number. This suggests that changing conformation may facilitate the generation of larger fields of kidney tissue. As a proof of concept, this was achieved using a script to produce a series of parallel lines (Figure 6A), extruded using the same parameters as for the ratio 30 line. In total, this deposited cell paste contained approximately 4 × 10⁵ cells across a total field of approximately 4.8 × 6mm (Figure 6BC). The resulting kidney tissue patch was examined after 12 and 14 days of culture by brightfield illumination and confocal imaging of the endogenous MAFBmTagBFP reporter signal along with additional kidney markers. These analyses revealed a uniform distribution of epithelial structures and MAFBmTagBFP2–expressing glomeruli throughout the patch, as well as the absence central regions lacking nephrons as observed in ratio 0 dot organoids (Figure 6BC). Patch organoids also demonstrated correctly patterned nephrons, expressing markers of proximal (LTL and HNF4A) and distal tubule/loop of Henle TAL (SLC12A1), surrounded by interstitial endothelial cells expressing SOX17 (Figure 6D).
Figure 6. Generation of a kidney tissue patch using 3D extrusion cellular bioprinting.

A. Illustration of the scripted movement of the needle tip for cell paste extrusion, generating a patch organoid across an area of approximately 4.8mm × 6mm, containing approximately 4×10⁵ cells. Lines indicate continuous movements. B. Brightfield imaging of the bioprinted kidney tissue patch demonstrating uniform formation of nephron structures. C. Live confocal imaging of MAFBmTAGBFP2 reporter signal throughout a patch organoid at D7+12. Scale bar =1mm. Image is representative of n = 3 replicate patches. D. Confocal immunofluorescence of a D7+14 patch organoid demonstrating uniform distribution of nephrons expressing markers for podocytes (mTagBFP2 [left panel; blue]), proximal tubules (LTL [left panel; green] and HNF4A [right panel; red]), nephron epithelium (EPCAM [left panel; red]), distal tubule/loop of Henle TAL (SLC12A1 [right panel; green]) and endothelial cells (SOX17 [right panel; grey]). Scale bars = 100μm. Representative image from n = 3 patches. E. Live confocal imaging of a D7+14 patch organoid derived from the HNF4AYFP reporter iPSC line following incubation in TRITC-albumin substrate. Images depict TRITC-albumin (red) uptake into YFP-positive proximal tubules (yellow). Outlined areas (whole organoid images) are shown at higher magnification below, with and without phase contrast overlays. Scale bars = 100μm. Assay performed on a representative sample from n = 3 patches.
A replacement renal tissue must contain nephrons with similar functional capacity to their in vivo counterparts, including glomerular filtration and tubular reabsorption/secretion of water and selected solutes. Given the importance of the proximal tubule for solute reabsorption, patch organoids were generated from a proximal tubule-specific iPSC reporter line in which yellow fluorescent protein (YFP) is inserted under the control of the HNF4A promotor (HNF4AYFP iPS cells) 14. HNF4AYFP-derived patch organoids were incubated overnight in a fluorescently-tagged protein substrate (TRITC-albumin) that shows affinity for Megalin and Cubilin receptors expressed on podocytes of the glomeruli and proximal tubules. Live confocal imaging revealed specific uptake of TRITC-albumin into YFP-positive proximal tubules, confirming the functionality of these nephron segments (Figure 6E). Taken together, these data highlight the potential application of patch organoids for the generation of wide fields of functional kidney tissues suitable for bioengineering or screening applications.
Discussion
The advent of protocols for the generation of human kidney tissue models from pluripotent stem cells has prophetically promised important biomedical applications including disease modelling, drug screening, toxicity screening and engineering of kidney tissue for renal replacement therapy. In this study we illustrate the power of 3D cell extrusion-based bioprinting to facilitate such possibilities. We demonstrate the use of bioprinting to achieve automated fabrication of self-organizing kidney organoids comparable at the level of morphology, component cell types and gene expression to those previously reported via manual generation. The cellular complexity and tissue morphology was reproduced in bioprinted organoids generated using a variety of starting cell numbers and conformations. Bioprinting of organoids increased the throughput of manufacture 9 fold (approximately 200 organoids in 10 minutes) whilst providing high quality control with respect to cell number, diameter and cell viability. The tissues generated can be processed for complex histological and gene/protein expression analyses, while the use of fluorescence reporter iPSC lines to generate bioprinted organoids enables rapid and quantitative readout of organoid morphogenesis via high resolution imaging of live tissue. Fabrication was achieved in both a 6-well format, with multiple organoids per well, and a 96-well plate format with one organoid per well. The latter format was amenable to compound dosing. Ultimately, this approach may be applicable to assessing the nephrotixicity of new drugs with the reproducibility needed to support preclinical safety assessments. Critically, extrusion bioprinting was also used to alter the conformation of the initial cell micromass. Surprisingly, this change in conformation substantially increased the amount of patterned nephron tissue produced from the same number of input cells as well as improving relative nephron maturation. This remarkable observation illustrates the influence that simple changes in biophysical parameters can have on differentiation.
Changing to a bioprinted line conformation increased nephron number, as measured by an increase in MAFB+ glomerular area. Indeed, while manual organoids are generated from a much larger starting cell number, the final glomerular number was lower than that within an R40 bioprinted line. We presume, therefore, that the altered conformation at bioprinting enables greater cell survival and nephron initiation per unit starting cell. This may result from the more uniform and lower tissue height present facilitating nutrient access in bioprinted lines and sheets. Critically, this is an effective approach for scale up that is accompanied by evidence for persistence of a progenitor population and improved proximal tubular maturation, both significant advantages with respect to tissue manufacture.
This is not the first report of automation to improve throughput for the generation of human pluripotent stem cell-derived kidney structures. Czerniecki et al. previously reported the use of a Tecan liquid handling platform for the initial plating of undifferentiated pluripotent stem cells prior to differentiation and the automated image capture of nephron features across a 96-well format 36. Unlike that approach, we are using a cell paste of partially differentiated iPSC-derived kidney progenitors (mesoderm) and utilising a 3D extrusion-based system for the precise placement and defined conformation of cellular micromasses, as opposed to simple aliquoting of an undifferentiated cellular suspension. Our results demonstrate that the control of conformation provides a surprising degree of influence on ultimate tissue morphology, a powerful illustration of tissue self-organisation and the influence of subtle shifts in biophysical properties. Furthermore, the successful application of extrusion bioprinting to generate large areas, or patches, of uniformly differentiated kidney structures showing functional albumin uptake into proximal tubules provides an approach to the quality-controlled production of transplantable kidney tissues via cellular manufacturing processes. The intersection between developmental biology, biomaterials and bioengineering that is presented in this study provide a basis for addressing some of the remaining challenges of scale and structure facing the kidney engineering field.
Methods
2D iPSC Culture and Manual Organoid Production
iPSC lines used in this study include CRL1502.C32 7, CRL2429-MAFBmTAGBFP, CRL2429-MAFBmTagBFP2/GATA3mCherry, PCS-201–010/HNF4AYFP 14,15,30 and NYSCF iPSC line 050594-MR. All iPSC lines were maintained and expanded at 37˚C, 5% CO2 and 5% O2 in Essential 8 medium (Thermo Fisher Scientific) on Matrigel- or GelTrex-(ThermoFisher Scientific) coated plates with daily media changes and passaged every 3–4 days with EDTA in 1X PBS as described previously 38. Differentiation of iPSC lines and organoid culture was performed as described previously 33, with minor variations in basal media (either APEL medium or TeSR-E6 medium [STEMCELL Technologies]), initial seeding density for differentiation in 6-well plates (8 × 10⁴ cells per well) and CHIR99021 exposure duration (6 – 8 μM for 4 days). Manual organoid generation was performed after 7 days of differentiation according to Takasato et al. 6 and organoids were cultured for a further 14 – 18 days prior to harvest.
Extrusion bioprinting to generate kidney organoids
Differentiated iPSC monolayers were dissociated and counted as per manual organoid production above. Cells were centrifuged (5 minutes at 200 × g) and the supernatant aspirated before cell material was either transferred directly into a 100uL Gastight syringe (Hamilton Catalog# 7656–05) with a 25-gauge (Hamilton Catalog# 7804–12) or 21-gauge (Hamilton Catalog# 7804–12) removable needle for bioprinting, or resuspended to the working cell density with STEMdiff APEL or TESR-E6 media prior to transfer for bioprinting. Syringes were loaded onto the NovoGen MMX bioprinter, primed to ensure cell material was flowing, and user-defined aliquots of bio-ink were deposited on to 0.4 μm polyester membranes of 6-well (Corning Costar catalog# 3450) or 96-well (Corning Costar catalog # 7369) Transwell permeable supports. Organoids were maintained under the same conditions as those described above for manual organoid production.
Varied organoid conformations were generated by changing the deposition ratio within the custom software interface, while scaling the organoid length so that each organoid was formed from a constant 1.1 × 10⁵ cells deposited in a volume of ~0.55 ul. Line organoids had a single point deposition (~10% total) at the start of the pattern to ensure even fluid flow. ‘Dot’ organoids had an equivalent cell volume added to the total so that cell numbers remained matched. During deposition the needle was positioned 300 microns from the Transwell surface. In all cases deposition ratios are based on a 25-gauge needle and 100ul syringe.
Histological staining
Kidney organoids were fixed overnight at 4°C in 2% or 4% paraformaldehyde (Electron Microscopy Sciences, Hatfield, PA), pre-embedded in HistoGel (Thermo Fisher, Carlsbad, CA), then dehydrated and infiltrated with paraffin using a TissueTek VIP tissue processing system (Sakura Finetek USA, Torrance, CA). Planar or transverse 5μm sections were obtained using a Leica RM 2135 microtome (Leica Biosystems, Buffalo Grove, IL). Sections were baked, de-paraffinized and hydrated to water prior to staining following a standard regressive staining protocol using SelecTech staining solutions (Leica Biosystems, Richmond, IL; Haematoxylin #3801570, Define #3803590, Blue Buffer #3802915, and Eosin Y 515 #3801615). Stained slides were serially dehydrated, cleared, and mounted in Permaslip (Alban Scientific Inc, St. Louis, MO #6530B). Images were acquired on a Zeiss Axio Imager A2 with Zeiss Zen software (Zeiss Microscopy, Thornwood, NY).
Section and whole mount immunofluorescence
For paraffin-embedded organoids, deparaffinized sections were antigen retrieved in citrate buffer, pH 6.0 (Diagnostic BioSystems, Pleasonton, CA #KO35) then blocked in 5% chick serum diluted in TBS-T (v/v) prior to immunofluorescence. For whole mount organoids, organoid harvest, fixation and blocking was performed as described previously 15. Immunofluorescence of prepared sections and whole organoids was performed as described previously 15. Primary and secondary antibodies were diluted in blocking buffer or 0.1% TX-100/PBS, at concentrations detailed in Supplementary Table 6. Images were obtained as described in 15 or using an Andor spinning disk confocal microscope with Nikon 25× 1.05NA silicone immersion objective. Imaris 9.6.0 (Oxford Instruments) was used to generate 3D renderings of confocal data.
Diameter Measurements
The cross-sectional diameter of the organoids was assessed over time by image-based analysis using ImageJ (version 1.51). Gross images were collected following print on Day 7 at a fixed distance with a 2x objective from plate surface. Each sample was manually outlined using the elliptical selection tool and used to calculate area in pixels for each image. Circular area values were converted to diameter in mm using equation below (Equation 1).
| (1) |
Bioink Viability and Concentration Assay
Dispensed bioink was sampled before and after the printing of 2 rows (24 organoids) of a 96-well plate. Printed bioink was dispensed directly into 1.5mL Eppendorf tubes filled with APEL medium to dilute and counted using a Nexecelom Cellometer (Nexecelom Biosciences) with trypan blue exclusion. Measurements of cell viability were made after printing well 0 (n = 2, mean = 95.2%), well 24 (n = 4, mean = 96.2%, SD = 0.7), well 48 (n = 4, mean = 95.8%, SD = 0.8), well 72 (n = 4, mean = 96.4%, SD = 1.5) and well 96 (n=4, mean = 97.4%, SD = 1.4) (Figure 2C). Cell counts were made at the same intervals, well 0 (n=2, mean = 1.37×10⁵), well 24 (n=4, mean = 1.18×10⁵, SD = 0.17), well 48 (n = 4, mean = 1.17 ×10⁵, SD = 0.16), well 72 (n = 4, mean = 1.15 ×10⁵, SD = 0.17), well 96 (n = 4, mean = 1.20 ×10⁵, SD = 0.04) (Figured 2C). Data were imported into GraphPad Prism 7.03 (La Jolla, CA) for analysis and plotting.
Drug-Induced Nephrotoxicity Studies
Doxorubicin (Sigma-Aldrich, D1515) stock solution was prepared in DMSO. Amikacin, Tobramycin, Gentamycin, Neomycin, and Streptomycin were all procured through Sigma Aldrich (St. Louis, MO) and prepared as a 25mg/ml solution in APEL media. Dosing for 6-well nephrotoxicity studies was performed by initially diluting doxorubicin DMSO stock in APEL media, and subsequently diluting further with additional media to achieve concentrations ranging from 0.3 to 10μM. Dosing for 96-well nephrotoxicity evaluation was performed by serial dilution. For Doxorubicin, serial dilution of DMSO stocks was added to APEL media to achieve concentrations ranging from 24nM to 25μM. Aminoglycoside stock solutions were diluted serially with APEL media to generate dosing concentrations ranging from 1.5μg/mL to 25 mg/mL. Drug dosing was initiated after day 21 or day 22 of the differentiation protocol. Dosing was performed by applying the full well volume of APEL medium ± test article to the apical basket of a Transwell permeable support (4mL for 6-well plates, 300 μL for 96-well plates). As media containing test articles was added to the Transwell permeable support, the organoids were fully submerged and exposed to any added compounds as the apical and basolateral compartments equilibrated. Drug-supplemented medium was replaced every other day until designated harvest time point. Statistical evaluation of relative gene expression in response to drug administration was based on two-way ANOVA, with Dunnett’s multiple comparison test comparing each treatment to control.
Organoid Viability Assessment
Kidney organoid viability following drug treatment was assessed by measuring ATP content with CellTiter-Glo or CellTiter-Glo 3D viability assays (Promega, Madison, WI, USA). In brief, harvested organoids from bioprinted in 6-well plates were individually loaded into Precellys tubes (Bertin Technologies, Bretonneux, France) with CellTiter-Glo buffer and dissociated using a Precellys 24 tissue homogenizer (Bertin Technologies, Bretonneux, France). Homogenized organoids were incubated at room temperature for 10 minutes, then centrifuged at 1000g for 2 minutes to separate buffer from homogenizing beads. Supernatants were transferred to a white opaque 96-well plate for luminescence measurement on a microplate reader (BMG Labtech, Germany). Presented 6-well viability results are a composite of 3 independent experiments with each normalized to respective control ATP levels within each study. To analyse the ATP content in organoids bioprinted on 96-well plates, all media was aspirated and CellTiter-Glo 3D reagent was added to the apical chamber of Transwell permeable support. The plate was shaken at 400rpm for 5 minutes at room temperature, and then allowed to sit for 25 minutes prior to luminescent measurement in a white opaque 96-well plate on a microplate reader (BMG Labtech, Germany). Viability analysis was reported as percent of control by normalizing the ATP content of treated organoids relative to control organoids. Fitting of viability results was performed with GraphPad Prism 7.03 software (La Jolla, CA) using a four-parameter dose-response curve (Equation 2):
| (2) |
Quantitative RT-PCR gene expression analysis following drug exposure
Total RNA extraction from kidney organoids following drug exposure was performed using an RNeasy Mini kit (Qiagen, Germany) per manufacturer’s instructions. RNA was quantified with spectrophotometry with a NanDrop 2000 (Thermo Fisher, Carlsbad, CA). To analyse gene expression, TaqMan Fast One-Step qPCR Master Mix (Applied Biosystems, Foster City, CA), TaqMan Probes for genes of interest (ThermoFisher, Carlsbad, CA), and house-keeping gene probes (Applied Biosystems, Foster City, CA) were combined in assigned wells with RNA. All qPCR reactions were performed and analysed on a StepOnePlus qRT-PCR system (Applied Biosystems, Foster City, CA). All data was normalized to house-keeping gene GAPDH prior to normalizing to control samples.
Quantitative imaging of reporter cell lines
Bioprinted D7+12 organoids were live imaged via brightfield and for mTagBFP2 intensity with an Apotome.2 fluorescent microscope (Zeiss). For automated imaging, Transwells were transferred into glass bottomed 6-well dishes (CellVis) and imaged using an Andor Dragonfly spinning disk confocal with a 4× 0.2NA Nikon objective. Fiji was used to stitch tiled datasets 39. Python scripts using the scikit-image library 40 were used to segment and measure the regions of mTagBFP2 signal. The total size of each organoid was approximated by calculating a convex hull around each mTagBFP2 area. Organoid length was approximated by the major axis length of each object. A small number of organoids were excluded from the final analysis based on a ratio of mTagBFP2 positive pixels: total pixels > 0.8 that was indicative of segmentation errors that were manually verified.
Bulk-RNAseq transcriptional profiling
RNA was extracted from D7 + 12 organoids using Bioline Isolate II Mini/Micro Kits (Bioline, New South Wales, Australia) as per manufacturer’s instructions. RNA was used to generate libraries for sequencing using an Illumina Novoseq 6000 sequencer. Fastq files were trimmed using Trimmomatic (0.35). Mapping to the human genome (GRCh38) was read counting was performed using STAR aligner (2.5.3a) 41. EdgeR (3.26.5) 42 was used for library normalization and differential gene expression testing using a quasi-likelihood negative binomial generalized log-linear model.
Proximal tubule functionality assay
Functional uptake assays were performed on D7+14 HNF4AYFP–derived patch organoids cultured on 6-well Transwell plates, differentiated and generated as described above. Organoids were incubated (standard 37°C CO2 incubator conditions) overnight in tetramethylrhodamine isothiocynate-bovine albumin (TRITC-albumin; Sigma-Aldrich) substrate dissolved 1:500 in TeSR-E6 (STEMCELL Technologies) which was added to the basolateral compartment beneath the Transwell insert. Following incubation, organoids were washed in 3 changes of Hank’ Balanced Salt Solution (HBSS; Sigma-Aldrich), transferred to a glass-bottom 6-well plate and live-imaged on a ZEISS LSM 780 confocal microscope (Carl Zeiss, Oberkochen, Germany).
Statistics and replication
All details regarding statistical tests, sample sizes and experimental replication have been included in the appropriate Figure Legends and related Methods sections.
Extended Data
Extended Data Figure 1. Histology of bioprinted kidney organoids.
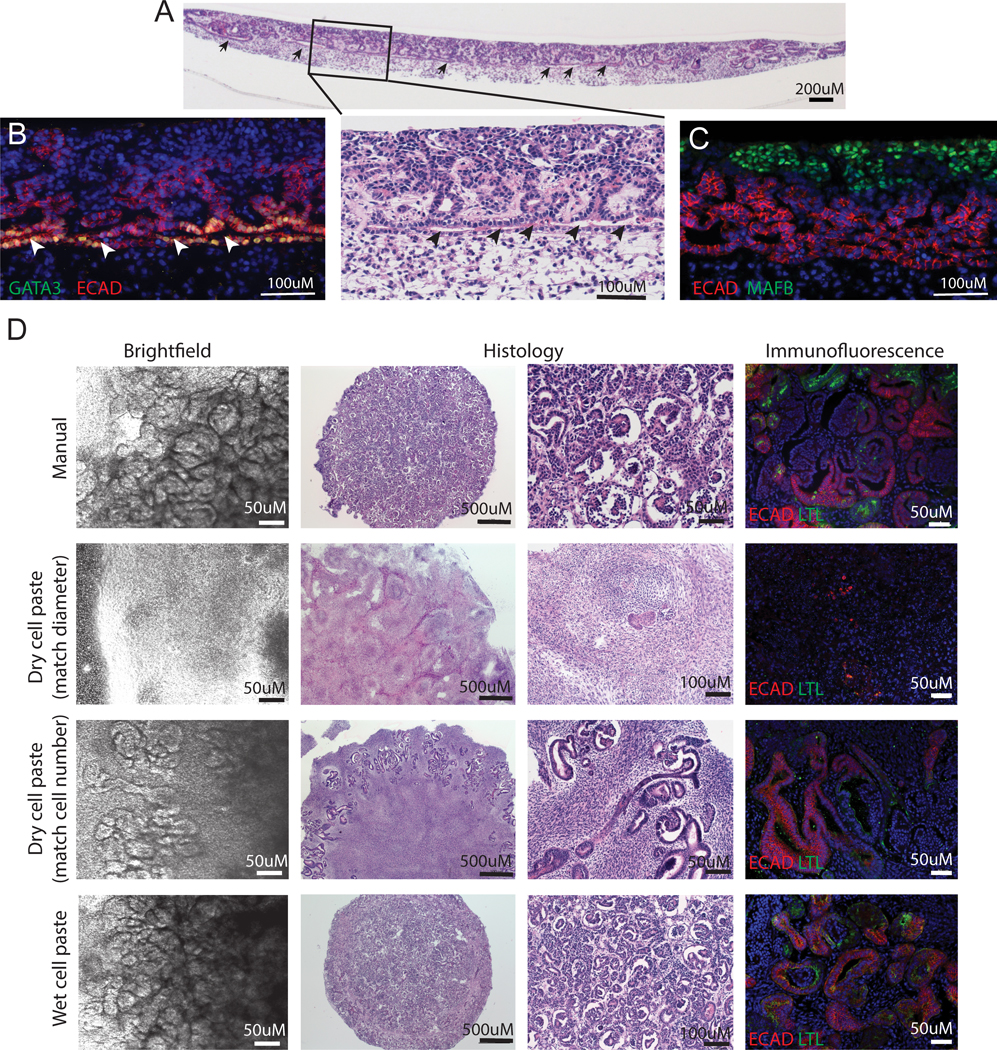
A. Histological cross section of an entire day 7 +18 bioprinted kidney organoid showing clear evidence of an interconnecting epithelium (arrowheads) from which nephrons arise. B. Immunostaining of a bioprinted kidney organoid section showing a GATA3+ECAD+ connecting segment / collecting duct with multiple attached ECAD+GATA3− nephrons. C. Immunostaining of bioprinted kidney organoid section showing ECAD+ nephrons attached to MAFB+ glomeruli. D. Brightfield, histological and immunofluorescence comparisons of kidney organoids generated manually (5 × 10⁵ cells per organoid), using dry cell paste controlled for organoid diameter versus dry cell paste controlled for cell number versus wet cell paste. All image panels are representative of at least n = 3 organoids from multiple experiments.
Extended Data Figure 2. Patterning of kidney structures in bioprinted organoids generated from varying starting cell numbers.

A. Immunofluorescence of organoids from a single starting differentiation used to generate manual organoids (5 × 10⁵ cells) versus bioprinted organoids generated from as few as 4,000 cells. Representative images from n = 3 organoids stained. Scale bars represent 200μm. B. Differentiation timecourse of bioprinted organoids generated using the MAFBmTagBFP2 reporter iPSC line. C. MAFBmTagBFP2 bioprinted organoids on the same Transwell filter with 4K, 50K or 100K of cells per organoid showing fluorescence reporter imaging (blue) and staining for differentiation (ECAD,green; LTL, blue; GATA3, red; NPHS1, purple). Images are representative of at least n = 3 organoids. Scale bars represent 200μm. D. MAFBmTagBFP2 bioprinted organoids on the same Transwell filter all generated using 100K of cells per organoid showing live fluorescence imaging (blue) and staining for differentiation (ECAD,green; LTL, blue; GATA3, red; NPHS1, purple). Scale bars represent 200μm. Representative wells from at least n = 3 are shown, with representative stained organoids alongside.
Extended Data Figure 3. Quantification of bead density and MAFBmTagBFP2 reporter signal in organoids with varied conformations.
A. Representative image of fluorescent bead signal (greyscale) at D7+0 across an entire print pattern showing all 5 conformations, from left to right: ratio 0 (3 replicates), ratio 40, ratio 30, ratio 20, ratio 10. B. Composite image of each conformation at D7+12 showing mTagBFP2 reporter expression (cyan) and bead signal (red). Note images are placed on a black background. Scale bar is 1mm for A and B. C. Quantification of total organoid area (refer to Methods) and mTagBFP2 area in replicate organoids (compare to Figure 3G). D. Table of organoid numbers by replicate plate and ratio used for quantification in C and Figure 3G. E. Example of 9 replicate organoids produced using ratio 20. Organoids are consistent between 3 organoids from separate wells on each plate, and between plates. F. Representative images (from total n = 27 organoids from 2 independent experiments) of sparse labelling with CellTrace Far Red dye to quantify organoid height at D7+0 (Figure 3D). XY and orthogonal view are shown. G. Schematic of the scoring method used for quantification, described fully in Supplementary Methods.
Extended Data Figure 4. MAFBmTagBFP2 reporter expression in organoids correlates to total nephron number.
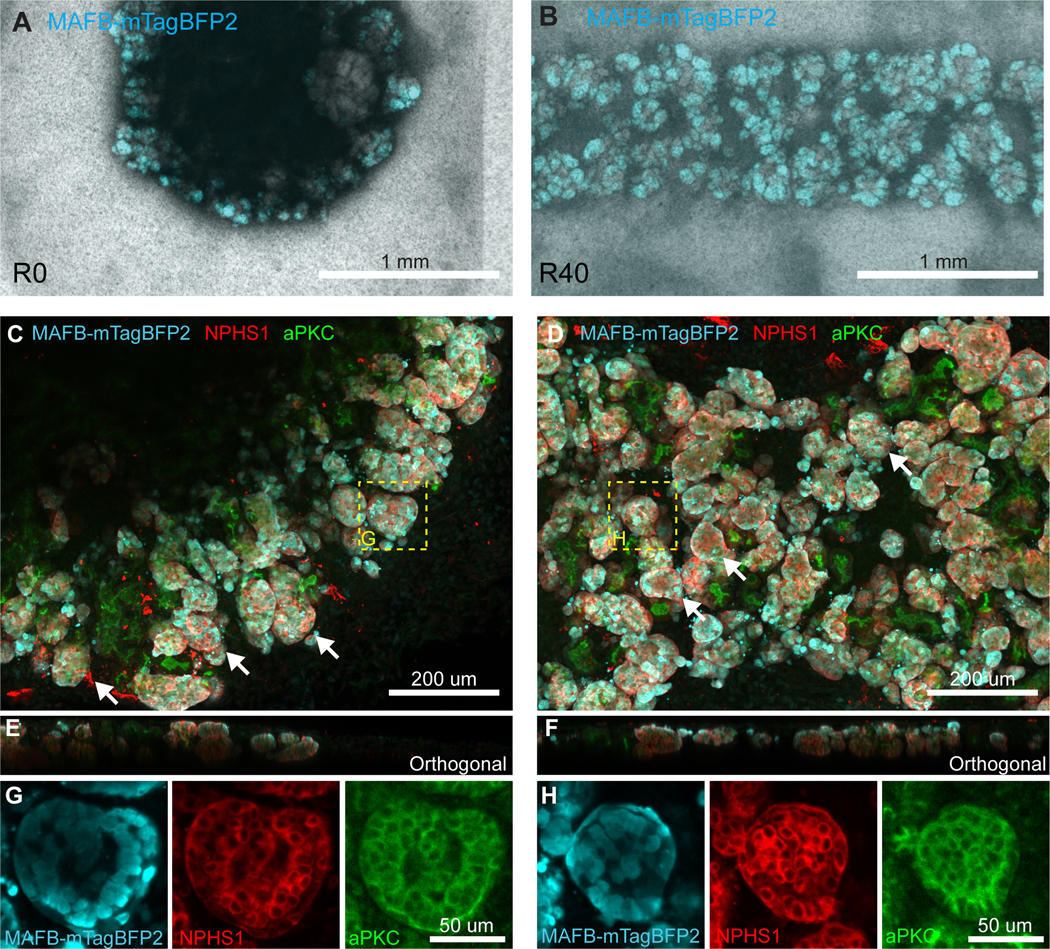
A,B. Examples of low resolution, high throughput imaging used to quantify MAFB+ area as a proxy for nephron volume in organoids. Brightfield and MAFBmTagBFP2 signal was captured for each organoid using a low NA 4x objective with a spinning disk system, enabling fast capture of many samples. With a large axial depth of field, these images capture the majority of signal within each organoid in a single plane. Given the similarity in thickness (E,F, Figure 3) this planar area is approximately proportional to total MAFB+ glomerular volume and hence correlates to nephron number. A portion of an example image used for quantification of R0 (A) and R40 (B) organoids at D7+12 is shown. Note R40 organoids are much longer and were captured by stitching multiple image fields. Only a small portion of the organoid is shown. C, D. Samples were fixed and stained at D7+12 for MAFBmTagBFP2 reporter (Cyan), mature podocyte marker NPHS1 (Red) and atypical protein kinase C (aPKC, Green), a marker of the apical cell membrane. Each nephron consists of a rounded glomerular structure containing podocytes (examples highlighted by white arrows) connected to other tubular segments that are marked by aPKC but lack NPHS1. Nephrons are seen throughout the field and are packed together so that individual nephrons cannot be easily separated visually. MAFBmTagBFP2 reporter is expressed specifically in NPHS1 expressing podocytes, but is absent from other nephron segments (aPKC+, NPHS1− regions) or from other cell types. Images are maximum projections (50 μm span). E,F. Both conditions have a similar axial morphology in nephron-containing regions when viewed as an orthogonal slice (ie along the imaging Z-axis). A single orthogonal slice rendered from a 3D stack is shown. G,H. Cropped high-resolution fields showing a single glomerulus for each condition confirm co-expression of MAFBmtagBFP2 reporter and NPHS1 in podocytes. A single confocal slice is shown. All images are representative of at least n = 3 stained samples.
Extended Data Figure 5. Quantification of large image data sets associated with organoids used for single cell RNA seq.
Line organoids are approximately 12 mm long. A. Representative images from 3 separate wells across replicates and conditions. B. Quantification of MAFB-mTagBFP2 reporter area by set and condition. Data is as in Figure 5B, but here is separated by set. C. Quantification of GATA3-mCherry reporter area. Note that Y-axis scale differs between B and C, as GATA3 area represents a substantially smaller proportion of the organoid in most cases. D. GATA3 area as a proportion of total measured reporter area (MAFB + GATA3), highlighting a shift in R0 toward a more distalised fate. E. The total number of individual organoids used for quantification, by set and condition.
Extended Data Figure 6. Analysis of single cell RNA datasets.

A. Variability within the datasets represented as a UMAP plot, coloured by transcriptional cluster, predicted cell cycle phase, main cell type and organoid conformation (clockwise from top left). B. Marker genes of main cells type, WT1 and PAX2 (nephron), PDGFRA (stroma) and SOX17 (endothelial). C. Proportion of each cell type in replicate conditions. P value (one-way ANOVA) indicated if p < 0.2. D. UMAP representation of nephron cells after re-transformation and clustering at higher resolution. Plots are coloured by transcriptional cluster, predicted cell cycle phase and organoid conformation. Cluster identities are stated. E. Marker genes identifying each cluster: GATA3 (distal), HNF1B (pre-tubule), CUBN (proximal), HNF4A (proximal), FOXC2 (pre-podocyte), MAFB (pre-podocyte / podocyte), PODXL (podocyte), SIX2 (progenitor), EYA1 (progenitor). F. Stromal UMAP coloured by transcriptional cluster, predicted cell cycle phase and organoid conformation (top to bottom). G. Markers of specific stromal clusters; SIX2, LYPD1, FOXC2, HOXA11 (Cluster 3, nephron progenitor-like), WNT5A, LHX9 (Cluster 7) and ZIC1 and ZIC4 (Cluster 10). H. Heatmap of scaled log counts per million of pseudo bulk counts from scRNAseq sets for the top 100 most significantly expressed genes identified in bulk RNAseq analysis (Figure 4). Each column represents a single cluster from a single replicate (e.g. R40, Nephron, Set 1). Hierarchical clustering of the limited gene set indicates that bulk-RNAseq changes are largely driven by changes in the nephrons and endothelial cells.
Extended Data Figure 7. The spatial distribution of stromal markers by wholemount immunoflouresence.

A – C. Immunofluorescence staining for markers of organoid stromal populations based on scRNA profiling. R0 organoids consist of a nephron containing area (Nephrons), a central role (Core) where nephrons are largely absent, and a thin edge (Thin edge) of monolayer cells that are typically not observed in brightfield imaging. R40 line organoids are primarily composed of a dense nephron-containing region and a thin monolayer edge, with no central core. Stromal population markers (A) MEIS1/2/3, (B) SIX1 and (C) SOX9 are present in the areas surrounding nephrons, and within the thin monolayer sheet at the edge of each organoid, but are largely absent from the central core of R0 organoids. Representative images from n = 3 organoids stained per condition are shown. Images are maximum projections spanning the full volume of the organoid. D. UMAP plots representing stromal cells in scRNA datasets, colour coded to show expression of MEIS1, MEIS2, SIX1 and SOX9. These combined markers include most of the cells in the dataset, suggesting that the absence of staining in the central core observed in (E) may indicate low overall cellularity in that region.
Extended Data Figure 8. Direct comparison between kidney organoids and human fetal kidney confirms improved maturation of proximal tubules within R40 bioprinted lines.

A. UMAP plots comparing transcriptional identity based on unbiased clustering in Seurat (left) and prediction using the scPred method where cells are according to their similarity to a human fetal kidney (HFK) dataset (right). Identity assignment is based the most similar human fetal kidney cell type. B. The proportion of cells assigned to each cell type identity across replicates. Points show individual replicate values colour coded by replicate barcode (where HTO-1 is Set 1). Bars show SEM. P-values based on one-way ANOVA indicate a significant difference in the number of cells predicted to be Pre-Pod cells, with greatest abundance in the R40 datasets. Bioprinted conditions (R40 and R0) have more cells predicted to be podocytes, and less distal and pre-tubule cells. However, these changes were not significant. These results support the trends presented in Figure 5. C. The distribution of maximum similarity scores for the classification of each cell across conformations, plotted by cell type predicted. Most cells show a high similarity to the predicted fetal kidney cell type. D. Genes identified as significantly increased in R40 versus Manual organoids (SLC51B, FABP3 and SULT1E1) are expressed in the mature proximal tubule cells of human fetal kidney, confirming their association with a more mature cell type. A gene that was significantly decreased in R40 vs Manual organoids (SPP1) is expressed selectively in less mature cell types, supporting increased maturity in R40 proximal cells. UMAP shows transcriptional identity in human fetal kidney data. Top left plot is colour coded by human fetal kidney cell types specific to developing (renal vesicle and comma shaped body [RV_CSB], blue; proximal early nephron [PEN], red) and mature proximal tubule (PT, green). Lower left plot shows a ‘dot plot’ style representation of selected gene where size indicates the percentage of HFK cells expressing the gene and colour indicates normalised expression level. Normalised expression of each gene per cell is indicated on individual UMAP plots where expression is colour coded.
Supplementary Material
Acknowledgements
We thank Maelle Le Moing and the Murdoch Children’s Research Institute Translational Genomics Unit for 10x single cell and hash-tag oligo library preparation and sequencing, and bulk-RNAseq sequencing; Matthew Burton and the Murdoch Children’s Research Institute Microscopy Core. MHL is a Senior Principal Research Fellow of the National Health and Medical Research Council, Australia (APP1136085). This work was supported by Organovo Inc, California’s Stem Cell Agency grant number EDUC2–08388, NHMRC (GNT1100970, GNT1098654), National Institutes of Health (UH3DK107344), and the Medical Research Future Fund Kidney Disease Team grant.
Footnotes
Competing financial interests
MHL is an inventor on a patent related to kidney organoid generation. Access to the bioprinter was facilitated by the Methuselah Foundation. MHL received contract research funding from Organovo Inc.
Data availability statement
All transcriptional profiling datasets have been submitted to GEO. These including single cell RNAseq from manual and two bioprinted organoid conformations (GEO GSE152014) and bulk-RNAseq data comparing bioprinted organoids of different conformations (GEO GSE138733). Image data used for quantification of morphology in different bioprinted organoid confirmations is available at http://figshare.com using DOI 10.6084/m9.figshare.12957122.
Code availability
Image and single cell RNAseq analysis scripts are available at http://github.com/KidneyRegeneration/BioprintedOrganoids/
References:
- 1.Freedman BS et al. Modelling kidney disease with CRISPR-mutant kidney organoids derived from human pluripotent epiblast spheroids. Nat Commun 6, 8715, doi: 10.1038/ncomms9715 (2015). [DOI] [PMC free article] [PubMed] [Google Scholar]
- 2.Morizane R. et al. Nephron organoids derived from human pluripotent stem cells model kidney development and injury. Nat Biotechnol 33, 1193–1200, doi: 10.1038/nbt.3392 (2015). [DOI] [PMC free article] [PubMed] [Google Scholar]
- 3.Taguchi A. et al. Redefining the in vivo origin of metanephric nephron progenitors enables generation of complex kidney structures from pluripotent stem cells. Cell Stem Cell 14, 53–67, doi: 10.1016/j.stem.2013.11.010 (2014). [DOI] [PubMed] [Google Scholar]
- 4.Taguchi A. & Nishinakamura R. Higher-Order Kidney Organogenesis from Pluripotent Stem Cells. Cell Stem Cell 21, 730–746 e736, doi: 10.1016/j.stem.2017.10.011 (2017). [DOI] [PubMed] [Google Scholar]
- 5.Little MH & Combes AN Kidney organoids: accurate models or fortunate accidents. Genes Dev 33, 1319–1345, doi: 10.1101/gad.329573.119 (2019). [DOI] [PMC free article] [PubMed] [Google Scholar]
- 6.Takasato M, Er PX, Chiu HS & Little MH Generation of kidney organoids from human pluripotent stem cells. Nat Protoc 11, 1681–1692, doi: 10.1038/nprot.2016.098 (2016). [DOI] [PMC free article] [PubMed] [Google Scholar]
- 7.Takasato M. et al. Kidney organoids from human iPS cells contain multiple lineages and model human nephrogenesis. Nature 526, 564–568, doi: 10.1038/nature15695 (2015). [DOI] [PubMed] [Google Scholar]
- 8.Jakab K. et al. Tissue engineering by self-assembly and bio-printing of living cells. Biofabrication 2, 022001, doi: 10.1088/1758-5082/2/2/022001 (2010). [DOI] [PMC free article] [PubMed] [Google Scholar]
- 9.King SM et al. 3D Proximal Tubule Tissues Recapitulate Key Aspects of Renal Physiology to Enable Nephrotoxicity Testing. Front Physiol 8, 123, doi: 10.3389/fphys.2017.00123 (2017). [DOI] [PMC free article] [PubMed] [Google Scholar]
- 10.Nguyen DG et al. Bioprinted 3D Primary Liver Tissues Allow Assessment of Organ-Level Response to Clinical Drug Induced Toxicity In Vitro. PLoS One 11, e0158674, doi: 10.1371/journal.pone.0158674 (2016). [DOI] [PMC free article] [PubMed] [Google Scholar]
- 11.Norona LM, Nguyen DG, Gerber DA, Presnell SC & LeCluyse EL Editor’s Highlight: Modeling Compound-Induced Fibrogenesis In Vitro Using Three-Dimensional Bioprinted Human Liver Tissues. Toxicol Sci 154, 354–367, doi: 10.1093/toxsci/kfw169 (2016). [DOI] [PMC free article] [PubMed] [Google Scholar]
- 12.Howden SE, Thomson JA & Little MH Simultaneous reprogramming and gene editing of human fibroblasts. Nat Protoc 13, 875–898, doi: 10.1038/nprot.2018.007 (2018). [DOI] [PMC free article] [PubMed] [Google Scholar]
- 13.Phipson B. et al. Evaluation of variability in human kidney organoids. Nat Methods 16, 79–87, doi: 10.1038/s41592-018-0253-2 (2019). [DOI] [PMC free article] [PubMed] [Google Scholar]
- 14.Hale LJ et al. 3D organoid-derived human glomeruli for personalised podocyte disease modelling and drug screening. Nat Commun 9, 5167, doi: 10.1038/s41467-018-07594-z (2018). [DOI] [PMC free article] [PubMed] [Google Scholar]
- 15.Vanslambrouck JM et al. A Toolbox to Characterize Human Induced Pluripotent Stem Cell-Derived Kidney Cell Types and Organoids. J Am Soc Nephrol 30, 1811–1823, doi: 10.1681/ASN.2019030303 (2019). [DOI] [PMC free article] [PubMed] [Google Scholar]
- 16.Soo JY, Jansen J, Masereeuw R. & Little MH Advances in predictive in vitro models of drug-induced nephrotoxicity. Nat Rev Nephrol 14, 378–393, doi: 10.1038/s41581-018-0003-9 (2018). [DOI] [PMC free article] [PubMed] [Google Scholar]
- 17.Lin Z. & Will Y. Evaluation of drugs with specific organ toxicities in organ-specific cell lines. Toxicol Sci 126, 114–127, doi: 10.1093/toxsci/kfr339 (2012). [DOI] [PubMed] [Google Scholar]
- 18.Hallman MA, Zhuang S. & Schnellmann RG Regulation of dedifferentiation and redifferentiation in renal proximal tubular cells by the epidermal growth factor receptor. J Pharmacol Exp Ther 325, 520–528, doi: 10.1124/jpet.107.134031 (2008). [DOI] [PubMed] [Google Scholar]
- 19.Vesey DA, Qi W, Chen X, Pollock CA & Johnson DW Isolation and primary culture of human proximal tubule cells. Methods Mol Biol 466, 19–24, doi: 10.1007/978-1-59745-352-3_2 (2009). [DOI] [PubMed] [Google Scholar]
- 20.Wieser M. et al. hTERT alone immortalizes epithelial cells of renal proximal tubules without changing their functional characteristics. Am J Physiol Renal Physiol 295, F1365–1375, doi: 10.1152/ajprenal.90405.2008 (2008). [DOI] [PubMed] [Google Scholar]
- 21.Lee VW & Harris DC Adriamycin nephropathy: a model of focal segmental glomerulosclerosis. Nephrology (Carlton) 16, 30–38, doi: 10.1111/j.1440-1797.2010.01383.x (2011). [DOI] [PubMed] [Google Scholar]
- 22.Su Z, Ye J, Qin Z. & Ding X. Protective effects of madecassoside against Doxorubicin induced nephrotoxicity in vivo and in vitro. Sci Rep 5, 18314, doi: 10.1038/srep18314 (2015). [DOI] [PMC free article] [PubMed] [Google Scholar]
- 23.Wargo KA & Edwards JD Aminoglycoside-induced nephrotoxicity. J Pharm Pract 27, 573–577, doi: 10.1177/0897190014546836 (2014). [DOI] [PubMed] [Google Scholar]
- 24.Ballatori N. et al. OSTalpha-OSTbeta: a major basolateral bile acid and steroid transporter in human intestinal, renal, and biliary epithelia. Hepatology 42, 1270–1279, doi: 10.1002/hep.20961 (2005). [DOI] [PubMed] [Google Scholar]
- 25.Lash LH, Putt DA & Cai H. Drug metabolism enzyme expression and activity in primary cultures of human proximal tubular cells. Toxicology 244, 56–65, doi: 10.1016/j.tox.2007.10.022 (2008). [DOI] [PMC free article] [PubMed] [Google Scholar]
- 26.Maatman RG, Van Kuppevelt TH & Veerkamp JH Two types of fatty acid-binding protein in human kidney. Isolation, characterization and localization. Biochem J 273 (Pt 3), 759–766, doi: 10.1042/bj2730759 (1991). [DOI] [PMC free article] [PubMed] [Google Scholar]
- 27.Palmiter RD & Findley SD Cloning and functional characterization of a mammalian zinc transporter that confers resistance to zinc. EMBO J 14, 639–649 (1995). [DOI] [PMC free article] [PubMed] [Google Scholar]
- 28.Sharmin S. et al. Human Induced Pluripotent Stem Cell-Derived Podocytes Mature into Vascularized Glomeruli upon Experimental Transplantation. J Am Soc Nephrol 27, 1778–1791, doi: 10.1681/ASN.2015010096 (2016). [DOI] [PMC free article] [PubMed] [Google Scholar]
- 29.van den Berg CW, Koudijs A, Ritsma L. & Rabelink TJ In Vivo Assessment of Size-Selective Glomerular Sieving in Transplanted Human Induced Pluripotent Stem Cell-Derived Kidney Organoids. J Am Soc Nephrol 31, 921–929, doi: 10.1681/ASN.2019060573 (2020). [DOI] [PMC free article] [PubMed] [Google Scholar]
- 30.van den Berg CW et al. Renal Subcapsular Transplantation of PSC-Derived Kidney Organoids Induces Neo-vasculogenesis and Significant Glomerular and Tubular Maturation In Vivo. Stem Cell Reports 10, 751–765, doi: 10.1016/j.stemcr.2018.01.041 (2018). [DOI] [PMC free article] [PubMed] [Google Scholar]
- 31.Combes AN, Zappia L, Er PX, Oshlack A. & Little MH Single-cell analysis reveals congruence between kidney organoids and human fetal kidney. Genome Med 11, 3, doi: 10.1186/s13073-019-0615-0 (2019). [DOI] [PMC free article] [PubMed] [Google Scholar]
- 32.Wu H. et al. Comparative Analysis and Refinement of Human PSC-Derived Kidney Organoid Differentiation with Single-Cell Transcriptomics. Cell Stem Cell 23, 869–881 e868, doi: 10.1016/j.stem.2018.10.010 (2018). [DOI] [PMC free article] [PubMed] [Google Scholar]
- 33.Howden SE, Vanslambrouck JM, Wilson SB, Tan KS & Little MH Reporter-based fate mapping in human kidney organoids confirms nephron lineage relationships and reveals synchronous nephron formation. EMBO Rep 20, doi: 10.15252/embr.201847483 (2019). [DOI] [PMC free article] [PubMed] [Google Scholar]
- 34.Hughson M, Farris AB 3rd, Douglas-Denton R, Hoy WE & Bertram JF Glomerular number and size in autopsy kidneys: the relationship to birth weight. Kidney Int 63, 2113–2122, doi: 10.1046/j.1523-1755.2003.00018.x (2003). [DOI] [PubMed] [Google Scholar]
- 35.Merlet-Benichou C. et al. Nephron number: variability is the rule. Causes and consequences. Lab Invest 79, 515–527 (1999). [PubMed] [Google Scholar]
- 36.Czerniecki SM et al. High-Throughput Screening Enhances Kidney Organoid Differentiation from Human Pluripotent Stem Cells and Enables Automated Multidimensional Phenotyping. Cell Stem Cell 22, 929–940 e924, doi: 10.1016/j.stem.2018.04.022 (2018). [DOI] [PMC free article] [PubMed] [Google Scholar]
Methods references
- 37.Takasato M. et al. Directing human embryonic stem cell differentiation towards a renal lineage generates a self-organizing kidney. Nat Cell Biol 16, 118–126, doi: 10.1038/ncb2894 (2014). [DOI] [PubMed] [Google Scholar]
- 38.Chen G. et al. Chemically defined conditions for human iPSC derivation and culture. Nat Methods 8, 424–429, doi: 10.1038/nmeth.1593 (2011). [DOI] [PMC free article] [PubMed] [Google Scholar]
- 39.Schindelin J. et al. Fiji: an open-source platform for biological-image analysis. Nat Methods 9, 676–682, doi: 10.1038/nmeth.2019 (2012). [DOI] [PMC free article] [PubMed] [Google Scholar]
- 40.van der Walt S. et al. scikit-image: image processing in Python. PeerJ 2, e453, doi: 10.7717/peerj.453 (2014). [DOI] [PMC free article] [PubMed] [Google Scholar]
- 41.Dobin A. et al. STAR: ultrafast universal RNA-seq aligner. Bioinformatics 29, 15–21, doi: 10.1093/bioinformatics/bts635 (2013). [DOI] [PMC free article] [PubMed] [Google Scholar]
- 42.Ritchie ME et al. limma powers differential expression analyses for RNA-sequencing and microarray studies. Nucleic Acids Res 43, e47, doi: 10.1093/nar/gkv007 (2015). [DOI] [PMC free article] [PubMed] [Google Scholar]
Associated Data
This section collects any data citations, data availability statements, or supplementary materials included in this article.