

SUMMARY
To identify the molecular mechanisms and novel therapeutic targets of late-onset Alzheimer’s Disease (LOAD), we performed an integrative network analysis of multi-Omic profiling of four cortical areas across 364 donors with varying cognitive and neuropathological phenotypes. Our analyses revealed thousands of molecular changes and uncovered neuronal gene subnetworks as the most dysregulated in LOAD. ATP6V1A was identified as a key regulator of a top-ranked neuronal subnetwork and its role in disease-related processes was evaluated through CRISPR-based manipulation in human induced pluripotent stem cell derived-neurons and RNAi-based knockdown in Drosophila models. Neuronal impairment and neurodegeneration caused by ATP6V1A deficit were improved by a repositioned compound NCH-51. This study provides not only a global landscape but also detailed signaling circuits of complex molecular interactions in key brain regions affected by LOAD and the resulting network models will serve as a blueprint for developing next-generation therapeutics against LOAD.
Keywords: Alzheimer’s disease, omics, network analysis, neuronal dysregulation, ATP6V1A, human induced pluripotent stem cell, NGN2-neurons, Drosophila, NCH-51
eTOC
Employing an integrative network biology approach, Wang et al. identify critical gene subnetworks associated with late-onset Alzheimer’s disease (LOAD) and predict ATP6V1A as a key regulator of a neuron-specific subnetwork most affected by LOAD. ATP6V1A deficit causes neuronal impairment and neurodegeneration, which are normalized by a predicted compound NCH-51.
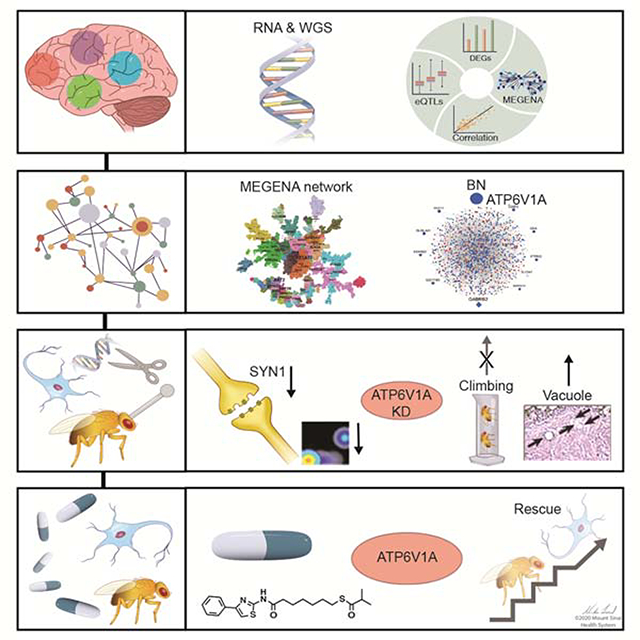
Graphical Abstract
INTRODUCTION
Sporadic Late-Onset Alzheimer’s Disease (LOAD), the most prevalent form of dementia among people over age 65, is a progressive and irreversible brain disorder. Over 5.5 million in the US are affected by LOAD, which is currently the sixth leading cause of death in the US and costs more than $200 billion annually (Association, 2018). There is an urgent need to develop effective methods to prevent, treat, or delay the onset or progression of LOAD. Conventional genome-wide association studies (GWAS) have revealed ~30 loci associated with LOAD (Jansen et al., 2019; Kunkle et al., 2019; Lambert et al., 2013; Marioni et al., 2018), with ~40% of the total phenotypic variance explained by these common variants (Ridge et al., 2013). Yet the genuine causal variants responsible for the functional effect on the disease are still uncharacterized. Translating these genetic associations into biologically mechanisms of disease pathogenesis and therapeutic interventions remains a huge challenge.
We previously pioneered a systems biology approach to integrate genotyping and microarray transcriptomic data from over 500 brains of LOAD and control subjects from the Harvard Brain Tissue Resource Center (HBTRC) (Zhang et al., 2013a), where we analyzed transcriptomic networks in 3 brain regions including the dorsolateral prefrontal cortex (DLPFC), the visual cortex (VC), and the cerebellum (CB), and highlighted an immune-microglia network module and its network key driver TYROBP for relevance to LOAD pathology. Similar systems approaches have recently been performed on a number of large-scale Omics studies of LOAD (Allen et al., 2016; De Jager et al., 2018; Johnson et al., 2020; Mostafavi et al., 2018; Ping et al., 2018), illuminating new biological pathways and targets. While those existing studies nominated various dysfunctional subnetworks and genes in association to LOAD, little progress has been achieved in therapeutics targeting those dysfunctional components.
In this study, we describe a new multi-omics dataset generated from multiple brain regions in a large collection of LOAD brains. Application of a network analysis-based discovery platform on this dataset identified multiple neuron-specific gene subnetworks most dysregulated in LOAD in addition to a number of other pathways such as immune response previously implicated in LOAD. ATP6V1A, a top driver of the neuronal subnetworks, was validated in vitro and in vivo. More importantly, a compound targeting ATP6V1A and its regulated subnetwork was predicted and then experimentally validated to improve neuronal and neurodegenerative phenotypes induced by ATP6V1A deficit.
RESULTS
A transformative network modeling platform for mechanism discovery, target identification and therapeutics development for AD
We recently generated matched whole-genome sequencing (WGS) and RNA sequencing (RNA-seq) data from a cohort of 364 brains spanning the full spectrum of LOAD-related cognitive and neuropathological disease severities represented in the Mount Sinai Brain Bank (MSBB) (Table S1) (Haroutunian et al., 2009; Wang et al., 2018; Wang et al., 2016). Specifically, RNA-seq was performed in 4 brain regions: Brodmann area 10 frontal pole (BM10-FP), Brodmann area 22 superior temporal gyrus (BM22-STG), Brodmann area 36 parahippocampal gyrus (BM36-PHG), and Brodmann area 44 inferior frontal gyrus (BM44-IFG) (Fig. 1). To integrate omics and disease trait data, we employed a transformative network modeling platform (Fig. 1) that includes signature calling, co-expression network (Zhang and Horvath, 2005), causal network (Schadt et al., 2005a; Zhu et al., 2007a), drug repositioning (Zhou et al., 2018a), and in vitro and in vivo functional validations. A unique feature of our platform is using gene regulatory networks as a target-rich environment for integrating multiple levels of data to identify key pathways and driver genes, whose perturbation responses can recapitulate predicted network structures through systems like human induced pluripotent stem cell (hiPSC)-derived neurons and fly models of Aβ toxicity (Fig. 1).
Fig. 1. A transformative network modeling platform for mechanism discovery, target identification, and therapeutics development for Alzheimer’s disease.

(A-C) Functional genomic data from disease modified brains and AD-related clinical and pathological phenotypes are collected. (D) The input data are integrated to identify disease gene signatures and co-expressed gene modules using MEGENA. (E) The top modules are projected onto causal networks to identify key driver genes of the disease. (F-H) Candidate drugs that can reverse the disease gene signatures and driver genes are predicted by an advanced pattern matching algorithm. (I-L) The disease relevance of key drivers (e.g., ATP6V1A) is tested in model systems like hiPSC-derived brain cells and Drosophila through (i) gene perturbations and (ii) drug rescue experiments.
BM36-PHG shows the most expression change in LOAD
After data preprocessing (Fig. S1), differentially expressed genes (DEGs) were called with respect to 4 LOAD related semi-quantitative traits (Table S2& Fig. S2A). BM36-PHG had the largest number of DEGs, followed by BM22-STG, BM10-FP, and BM44-IFG (Fig. S2B), consistent with our previous pan-cortical transcriptomic analysis of LOAD brains (independent of the dataset described herein) in which BM36-PHG was the most impacted region transcriptionally (Wang et al., 2016). As expected, neuronal system, transmission across chemical synapses, and neuroactive ligand receptor interaction, were enriched for down-regulated genes (Fig. S3 and Table S3). Our DEG signatures were preserved (adjusted Fisher’s exact test (FET) P-value up to 1.0E-100) in 10 publicly available AD transcriptomic studies (see Star Methods & Fig. S4). Moreover, our down-regulated genes were primarily preserved in down-regulated genes in astrocytes, neurons, oligodendrocytes, and oligodendrocyte progenitor cells from a recent single-nucleus RNA-seq (snRNA-seq) of LOAD brains (Mathys et al., 2019) (Fig. S5). Meanwhile, our up-regulated genes were primarily preserved in up-regulated genes in astrocytes and oligodendrocytes (adjusted FET P-value up to 6.5E-45).
Networks of LOAD brains highlight multiple neuronal modules
To elucidate the interactions among genome-wide gene expression traits of LOAD, we constructed gene coexpression networks to identify gene modules using the multiscale embedded gene coexpression network analysis (MEGENA) (Song and Zhang, 2015) (Fig. 2A & Tables S4–5). Distinct from our previous transcriptomic analysis of the DLPFC in the HBTRC cohort which prioritized an immune-microglial module (Zhang et al., 2013a), current study highlights the significance of multiple neuronal modules (Fig. 2B & Table S6). 9 of the top 25 modules were enriched for neuron cell markers, negatively correlated with disease traits, and enriched for DEGs down-regulated in LOAD, including M62, M65, M6, M236, M64, M252, M385, M87, and M243 (Fig. 2C). M64 was overrepresented with inhibitory neuron-enriched genes, while 6 others (M6, M87, M65, M236, M62, and M252) were overrepresented with excitatory neuron-enriched genes (Lake et al., 2016) (Table S7). Topological structures of 4 of the top-ranked neuronal modules (i.e., M6, M62, M64, and M65) are shown in Fig. 2D. All 4 modules were enriched in synaptic signaling to different degrees, but M6 and M64 were also enriched in regulation of long-term synaptic potentiation, synaptic vesicle trafficking, and localization (Fig. 2E and S6).
Fig. 2. Gene coexpression network analysis prioritizes neuronal modules associated with LOAD.

A, The MEGENA network in BM36-PHG. Node color denotes module membership. Font size of gene name is proportional to degree of connectivity. B, The 25 top-ranked modules. The heatmap shows the module ranking (number) and functional annotation (color) in track 1, the correlations (r) with the traits including bbscore, CDR, CERAD, and PlaqueMean in tracks 2–5, and adjusted P values of enrichment for down-(tracks 6–14) and up-regulated (tracks 15–24) DEGs. C, Sunburst plots showing the module hierarchy and correlation with CDR, enrichment for CDR demented-vs-nondemented DEGs, and enrichment for cell type markers. Numbers 1–13 denote 13 top-ranked modules as listed to the right. ast stands for astrocytes, end for endothelial, mic for microglia, neu for neurons and oli for oligodendrocytes. D, Networks of the top ranked neuronal modules M62, M65, M6, and M64. Node color denotes expression change in demented brains. Node size is proportional to node connectivity. E, Top-ranked neuronal modules enriched for GO biological process (BP) hierarchy in relation to synaptic function, neuronal development, and transportation. Each node denotes a GO/BP term, with a pie-chart displaying the significance of enrichment for the 4 neuronal modules in D. See also Fig. S6 & Table S5–7.
We validated the biological coherence of our network modules in previous transcriptomic network studies of LOAD. As shown in Table S6, more than 46.2% of the modules were strongly preserved (preservation statistics > 10) in the ROSMAP data (Mostafavi et al., 2018). Specifically, the top 25 modules showed strong preservation except M74, which was moderately preserved. Meanwhile, in the ROSMAP data (Mostafavi et al., 2018), there were 4 neuronal modules, m16, m21, m22, and m23, in which all, but m16, were associated with cognitive decline or amyloid-β burden (P < 0.05). m21 and m23 significantly overlapped all the current 9 top-ranked neuronal modules, while m16 and m22 were enriched in 3 and 7 of the current top-ranked neuronal modules, respectively (Fold enrichment (FE) = 1.4 ~ 14.1, false discovery rate (FDR) up to 2.2E-39) (Table S8).
Bayesian network analysis predicts novel key drivers of top-ranked neuronal modules
To determine potential network regulators (called key drivers herein) in the top-ranked modules, we constructed Bayesian probabilistic causal networks (BNs) (Fig. 3A) using structural priors from expression quantitative traits (eQTLs) and transcription factor-target relationships (Table S9–13 & Fig. S7–12). Fig. S10–11 show a fine mapping of AD GWAS causal genes by integrating eQTLs and GWAS statistics that led to marginally significant gene prioritization at two GWAS loci. We examined whether our BNs could predict publicly available gene perturbation signatures of the inferred key drivers. As illustrated in Fig. 3B, 50~60% of the key driver perturbation signatures were enriched (i.e. significantly predicted) in the network neighborhoods of the corresponding key drivers. In contrast, the proportion of enriched perturbation signatures decreased to 20~30% in the network neighborhood of non-driver genes, suggesting the predictive power of the gene regulatory networks.
Fig. 3. Bayesian probabilistic causal network (BN) analysis predicts novel key drivers of LOAD.

A, BN in the BM36-PHG. B, Validation of the BN structure. The left panel shows the percentage of the global BN key drivers whose network neighborhoods are enriched for the perturbation signature. The right panel shows the same analysis for the non-driver nodes. C, Projection of the modules M62 and M64 onto the BM36-PHG BN. Node labels are shown for the module key drivers. D-G, A novel network key driver ATP6V1A is down-regulated in LOAD. D, ATP6V1A expression in the RNA-seq data of the BM36-PHG region as stratified by CDR. E-G, Validation of ATP6V1A expression change in MSBB BM36-PHG samples using western blot (WB) (E-F) and qRT-PCR (G) analyses. E, Representative WB of ATP6V1A level. (t-test or ANOVA with Dunnett’s test. Error bars represent SE. *p < 0.05. **p < 0.01. ***p < 0.001. ****p < 0.0001. NS, no significance.). NL, normal control. See also Fig. S12–14 & Table S14–15.
Next, we projected each of the 9 top-ranked neuronal modules (Fig. 2B) onto the BM36-PHG BN and identified 48 key drivers (42 unique genes) (Table S14), including 10 that were root nodes (without parental nodes) (Table S15). Key drivers ATP6V1A in M64 and GABRB2 in M62 remained as root nodes in a union BN that combined directed edges from 4 region-wide BNs (Fig. 3C & Fig. S13). Only one prioritized key driver, ATP6V1A, was consistently down-regulated across brain regions and disease stages in LOAD. This gene encodes a component (V1 subunit A) of vacuolar- or vesicular-type ATPase (v-ATPase), a multi-subunit enzyme that mediates lysosomal acidification (Chung et al., 2019; Zoncu et al., 2011) and energizes synaptic membranes in neurons (Abbas et al., 2020; Forgac, 2007). ATP6V1A was significantly down-regulated in the BM36-PHG (−1.43 fold, P-value = 1.5E-6) and BM22-STG (−1.25 fold, P-value = 2.1E-3) regions of persons with dementia (clinical dementia rating CDR ≥ 1), and marginally down-regulated in the BM10-FP region of persons with MCI and frank dementia (CDR = 0.5) (−1.11 fold, P-value < 0.098) (Fig. 3D and Fig. S14). In addition, ATP6V1A expression was negatively correlated with clinical and pathological traits in BM22-STG and BM36-PHG (Spearman correlation coefficients between −0.21 and −0.44, P values between 5.9E-11 and 3.3E-4), suggesting a consistent down-regulation of ATP6V1A at both early and late stages of the disease. We validated the reduced expression of ATP6V1A in LOAD brains (Fig. 3E–G; 42% decrease at mRNA level and 35% decrease at the protein level, P < 1.0E-4). Down-regulation of ATP6V1A was also previously identified in cortical neurons of the superior frontal gyrus (Satoh et al., 2014) and the hippocampus CA1 area (Blalock et al., 2004) of LOAD brains. In addition, it was down-regulated in the excitatory (0.8 fold, adjusted P-value 2.6E-117) and inhibitory (0.83 fold, adjusted P-value 6.7E-22) neurons in brains with early-pathology of LOAD compared to no-pathology brains in the ROSMAP cohort (Mathys et al., 2019). To validate the functional role of ATP6V1A in LOAD, we performed gene perturbation experiments in in vitro (neurons) and in vivo (transgenic flies) models.
Functional validation confirms decreased neuronal activity in ATP6V1A-deficient NGN2-neurons
As ATP6V1A was down-regulated in the LOAD brains and enriched for neuronal expression (Fig. S15), we developed a model of hiPSC-derived NGN2-neurons (iNs) with reduced expression of ATP6V1A. To repress endogenous ATP6V1A, we utilized CRISPR inhibition (CRISPRi) (Ho et al., 2017), in which dCas9 (dead Cas9) is fused to the Krüppel associated box (KRAB) transcriptional repressor (Gilbert et al., 2014). We designed 6 gRNAs to target the promoter region for knockdown (KD) of the gene ATP6V1A (Fig. 4A), and identified 2 gRNAs (ATP6V1A-i1 and i2) that efficiently repressed ATP6V1A in neural progenitor cells (NPCs) from 2 donors stably expressing dCas9-KRAB (Fig. S16A–C). In post-mitotic day 21 (D21) NGN2-induced excitatory neurons well-characterized by electrophysiological properties and neuronal morphology (Fig. S16D) (Ho et al., 2016a), the ATP6V1A RNA (60~70% repression, P < 0.001, Fig. 4B) and protein levels (80~90% repression, P < 0.001, Fig. 4C–D) were significantly reduced.
Fig. 4. Repression of ATP6V1A leads to neuronal malfunction in human NGN2-neurons and Aβ42 transgenic flies.

A, ATP6V1A gene editing by the CRISPR/dCas9-KRAB system. 6 different gRNAs are designed for targeting the ATP6V1A promoter. TSS: transcription start site. ATG translation initiation codon is in exon 2. B, qRT-PCR analysis (n = 4) confirms the decreased ATP6V1A RNA by gRNA candidates 1 & 2 (i1 and i2) in 2 independent cell lines of iNs (i.e., C1 and C2). C-D, Representative WB and quantitative analysis (n = 4) of ATP6V1A protein level in iNs. β-Actin is a loading control. E-F, Representative raster plots of spike events over 10 min and analysis (n = 6~45 wells) of D21 iNs. G, Current-voltage (I-V) plot for inward sodium (INa) and outward potassium (IK) currents. Current density (pA/pF) is shown. Holding potential was −80 mV. H, Representative examples of putative inward voltage-gated sodium current at 0 mV. I, Bar plot shows mean inward sodium current densities at 0 mV for ATP6V1A KD (n=17) and control neurons (n=18), (p = 0.015). J, Box plots show the fraction of neurons that displayed a full action potential (AP), spikelets, or no events with a current injection step (0.1 nA) positive to the threshold for control and KD neurons. Inset shows representative examples of AP & spikelet. K, Representative confocal images of synaptic proteins (SYN1, red; HOMER1, green) and pan-neuronal marker MAP2 (blue). Bar, 20 μm. L, Analysis of SYN1 and HOMER1-immunoreactive puncta numbers (n = 3). M-N, Representative WB and quantitative analysis (n = 4) of SYN1 and HOMER1 levels. O-P, Multi-electrode array after exposure to 5 μM Aβ at 24 hours. O, Plate map of total spike events; P, Analysis of spike events (n = 12 wells). Q, mRNA levels of Vha68–1 and Vha68–2 were decreased in the Aβ42 fly heads (n = 4). R, Vha68–1 KD in neurons exacerbated locomotor deficits caused by Aβ42 as revealed by climbing assay. n = 5 except for 7-day (n = 2). S, Neuronal KD of Vha68–1 significantly worsened neurodegeneration in Aβ42 fly brains. Representative images show the central neuropil of 33-day-old fly brains. Scale bars: 50 μm. Percentages of vacuole areas (indicated by arrows) were analyzed. n = 12–24 hemispheres. T, mRNA levels of genes related to synapse biology were significantly reduced in Aβ42-expressing flies with neuronal KD of ATP6V1A/Vha68–1 (n = 4). See also Fig. S16–21. (See Fig. 3 for statistical test and P value annotations).
Since the v-ATPase activity facilitates transporters to load the vesicles with neurotransmitters (Abbas et al., 2020; Forgac, 2007), we determined whether ATP6V1A KD influenced spontaneous neuronal electric activity. Isogenic pairs of control and ATP6V1A CRISPRi iNs (co-cultured with human fetal astrocytes to enhance neuronal maturation) were evaluated across a panel of assays. We applied an Axion multi-electrode array (MEA) to assess the impact of ATP6V1A repression on population-wide neuronal activity, including frequency and coordination of network firing. Significantly reduced neuronal activity was observed following perturbations with either gRNA (average 4.3-fold down in D21 iNs, P < 0.01; Fig. 4E–F). We further measured the amplitude of voltage-gated potassium (IK) and sodium current (INa) using whole-cell patch-clamp recordings (Fig. 4G–I). ATP6V1A KD neurons exhibited significantly smaller INa current density (P = 0.015), but no significant change in IK current (Fig. 4G–I). Consistent with a decrease of INa, RNA-seq of D21 iNs (detailed below) revealed significantly reduced mRNA expression of different voltage-gated sodium channel subunits, such as SCN3A, SCN2A, and SCN4B (Fig. S17). Lastly, we observed a decrease in the number of full action potentials and an increase in immature spikes (e.g., spikelets) in the ATP6V1A CRISPRi group (Fig. 4J).
To explore the effect of ATP6V1A on synaptic components, iNs were immunostained against the presynaptic SYN1 and the postsynaptic HOMER1 and analyzed by confocal imaging (Fig. 4K). A significant reduction in SYN1+ puncta number following ATP6V1A CRISPRi was observed (1.1-fold down, P < 0.001; Fig. 4K–L), whereas CRISPRi had limited effect on HOMER1 (Fig. 4L). Western blot showed similar results. A 25–45% reduction of SYN1 (P < 0.05) was observed, while HOMER1 was expressed at comparable levels regardless of CRISPRi (Fig. 4M–N). In ATP6V1A-deficient iNs, only presynaptic components (SYN1, vGLUT1) were significantly decreased in RNA (~20% down, P < 0.05 and ~38% down, P < 0.01, respectively Fig. S17A). Postsynaptic components (HOMER1 and PSD95) showed no significant change, but vGLUT1 protein levels decreased by ~22% (P < 0.05, Fig. S18A–C).
AD neuronal pathology is associated with extracellular β-amyloid (Aβ) aggregates (Murphy and LeVine, 2010). Aβ administration (24 hours, 5 μM) significantly decreased spontaneous neuronal activity (P < 0.05, Fig. 4O–P), with a slight but insignificant decrease in ATP6V1A expression (14.4% down in WT neurons and 35.5% down in ATP6V1A CRISPRi neurons respectively, Fig. S19A–C). Moreover, ATP6V1A repression in combination with Aβ42 exposure further impaired neuronal activity (p < 0.05, Fig. 4O–P and Fig. S19B–C).
Neuronal knockdown of Vha68–1, a fly ortholog of ATP6V1A, worsens behavioral deficits and neurodegeneration in Aβ42 flies
We also examined the effects of knocking down fly ortholog of ATP6V1A on neuronal integrity in Drosophila. According to the DRSC Integrative Ortholog Prediction Tool, Drosophila Vacuolar H+ ATPase 68kD subunit 1 (Vha68–1, CG12403) and Vha68–2 (CG3762) are the best orthologs of human ATP6V1A protein. Using GAL4-UAS system, several shRNAi constructs targeting different regions of Vha68–1 or Vha68–2 were expressed in neurons by the pan-neuronal elav-GAL4 driver. Since both Vha68–1 and Vha68–2 are essential genes and their strong KD caused lethality, we selected an RNAi line that modestly reduced Vha68–1 levels (Fig. S20A). The forced climbing assay, a quantitative way to assess neuronal dysfunction (Iijima et al., 2004), revealed that neuronal KD of Vha68–1 by itself caused a modest decline in climbing ability in aged flies (Fig. S20B).
A transgenic Drosophila expressing human Aβ42 showed age-dependent locomotor deficits and neurodegeneration in the brain (Iijima et al., 2004). Interestingly, mRNA expression levels of both Vha68–1 and Vha68–2 were significantly reduced in Aβ42 flies (Fig. 4Q), suggesting that their reduction may play a role in Aβ42-mediated toxicity. We found locomotor deficits to be significantly exacerbated by neuronal KD of Vha68–1 (Fig. 4R). To minimize potential off-target effects, the experiment was repeated with shRNA targeting a different region of Vha68–1 and similar results were obtained (Fig. S20C–E). As further validation, we utilized a mutant allele of Vha68–1 (Vha68–11) with a loss-of-function single-nucleotide mutation (Q519L) caused by mutagenesis (Zhao et al., 2018). Locomotor deficits were significantly worsened in Aβ42 flies with a heterozygous mutation of Vha68–11, while a heterozygous Vha68–11 by itself did not cause climbing defects (Fig. S21A–B).
In Drosophila, brain vacuolation is a morphological hallmark of neurodegeneration that can be quantitatively assessed. Neuronal expression of Aβ42 causes an age-dependent appearance of vacuoles in the fly brains (Iijima et al., 2004). RNAi-mediated KD of Vha68–1 significantly worsened this neurodegeneration (Fig. 4S). Neurodegeneration was slightly worsened in the flies with heterozygous Vha68–11, with no statistically significant difference (Fig. S21C).
To assess whether altered neuronal activity underlies toxic interactions between Vha68–1 deficiency and Aβ42 in flies, we examined mRNA levels of 16 genes related to synaptic biology, focusing on GABAergic/glutamatergic systems and ion channels (Fig. 4T). Compared to control flies, mRNA levels of 9 genes were significantly reduced by neuronal KD of Vha68–1, while 8 genes were significantly reduced by Aβ42 (Fig. 4T). 6 genes (SLC1A2/Eaat1, SLC17A6–8/vGlut, ATP1A1–3/ATPα, GLRA2/CG12344, GABBR2/GABA-B-R2, and GABBR2/GABA-B-R3) were commonly reduced in both conditions (Fig. 4T). By contrast, neuronal KD of Vha68–1 in Aβ42 flies dramatically reduced mRNA levels of 14 out of 16 genes compared to control flies (Fig. 4T). Key driver genes, including GABRA1/Grd in M62, SCN2A/para in M65, and GABBR2/GABA-B-R2,3 in M6 (Fig. 2D) were downregulated in these fly brains, suggesting functional links between these networks and ATP6V1A/Vha68–1 in M64 module.
In summary, these results suggest that ATP6V1A/Vha68–1 deficiency and Aβ42 synergistically downregulate key regulator genes of neuronal activity and exaggerate Aβ42-induced toxicities in flies.
ATP6V1A KD signatures are enriched in ATP6V1A regulated networks in human LOAD brains
To characterize the molecular changes and validate the sub-network regulated by ATP6V1A, we performed RNA-seq on 4 groups of iNs (designated WT-V and WT-Aβ for vehicle-treated and Aβ-treated ATP6V1A wild-type (WT) neurons, respectively, and KD-V and KD-Aβ for vehicle-treated and Aβ-treated ATP6V1A KD neurons, respectively). No gene shows significant changes between Aβ-treated and vehicle-treated cells in either ATP6V1A KD or WT genotype. In contrast, there were 3 DEGs from KD-V vs. WT-V, 55 DEGs from KD-Aβ vs. WT-Aβ, and 326 DEGs from KD-Aβ vs. WT-V ( (Table S16 and Fig. S22). By employing the Gene Set Enrichment Analysis (GSEA) (Subramanian et al., 2005), we found V-ATPase transport and phagosome maturation/acidification down-regulated in KD-V vs. WT-V (Fig. 5A and Table S17). Consistent with the functional assay above, KD-V vs. WT-V led to down-regulation of multiple synapse biology pathways, with greater down-regulation after the exposure to Aβ treatment in KD-Aβ vs. WT-Aβ.
Fig. 5. RNA-seq analysis of ATP6V1A KD neurons validates ATP6V1A regulated neuronal networks in LOAD brains.

A, Top MSigDB gene sets and human AD signatures enriched in the perturbations of iNs. Plus (+) and minus (−) symbols denote the sign of the GSEA enrichment score (ES). Brown color in the x-axis of the left panel highlights the neuronal related terms. Cyan color in the x-axis of the two right panels highlights the down-regulated signatures. B-C, Analysis of synergistic effect between ATP6V1A KD and Aβ treatment in iNs. B, Summary of the functional categories that are likely to be impacted by the synergistic effect. C, Pie-chart shows percentages of genes that exhibit synergistic difference following combinatorial treatment compared to the expected additive model. Bar-chart shows pathways enriched for genes with “more up” regulation. D, Genes within a path length of 3 from ATP6V1A on the BM36-PHG BN were enriched for down-regulated signals of Aβ-KD vs. V-WT (GSEA normalized ES = 2.3, adjusted P-value = 8.3E-6). See also Fig. S22–23 & Table S16–20.
As a combination of ATP6V1A KD and Aβ treatment led to an increase in molecular changes than individual factor perturbation, we explored potential synergistic effects between the two factors (Schrode et al., 2019a). The hierarchical clustering of the log FCs of all genes for each contrast showed differences between the predicted and observed cumulative effects (Fig. S23). There was a strong enrichment of disorder and cellular stress gene sets after individual KD or Aβ treatment, while the KD showed further associations with cell death and negative correlation with neuronal function signatures. The latter was markedly amplified in the combinatorial modulation (Fig. 5B). We grouped genes into synergism categories based on differential expression between the additive model and the combinatorial modulation. Most genes were altered as predicted, but with 6% (1152 genes) more downregulated and 9% (1773 genes) more upregulated than expected (Fig. 5C). Genes more upregulated than expected from an additive model were significantly enriched for cell death and cellular stress gene sets (Fig. 5C).
The genes in response to ATP6V1A KD and Aβ perturbation were significantly enriched in the LOAD signatures identified from the current study as well as 10 published datasets (Fig. 5A and Table S18). By GSEA, we noted that the top-ranked neuronal modules (M64, which contains ATP6V1A, M62, M65, M6, M236, M252, M385, M87, and M243) were down-regulated in KD-Aβ cells compared to WT-V cells (Table S19). Meanwhile, several immune response modules (M14, M153, M366, and M428) were up-regulated in KD-Aβ cells compared to WT-V cells. As summarized in Table S20 and exemplified in Fig. 5D, the genes surrounding ATP6V1A on the BM36-PHG BN were enriched for down-regulation signals of ATP6V1A KD, with the most significant enrichment from KD-Aβ vs. WT-V (FDR = 4.1E-6). In summary, the ATP6V1A deficit signature in iNs mirrors the prediction in the human LOAD gene networks.
A novel drug NCH-51 improves ATP6V1A level and neuronal activity
We further explored potential drugs that can rescue the in vitro and in vivo phenotypes arising from ATP6V1A deficits. With our drug repositioning tool, Ensemble of Multiple Drug Repositioning Approaches (EMUDRA) (Zhou et al., 2018b), we matched the disease signature from the BM36-PHG region and the signatures of 3,629 drugs tested in the NPCs in the Library of Integrated Network-based Cellular Signatures (LINCS) project (Keenan et al., 2018) (Fig. 6A). Candidate drugs were further prioritized by their potential to increase the mRNA expression of ATP6V1A in the NPCs. Interestingly, the top prioritized drugs contain several histone deacetylase (HDAC) inhibitors such as SAHA, NCH-51, and MS-275 (Table S21).
Fig. 6. A novel compound NCH-51 increases ATP6V1A expression and partially restores neuronal function.

A, The procedure for predicting compounds that could increase ATP6V1A expression and reverse transcriptomic signature of LOAD. B, Chemical structure of NCH-51. C, Effects of NCH-51 at 1, 3, 10, 30 μM on ATP6V1A mRNA level post 24-h exposure. D, Effects of NCH-51 at 0.003, 0.03, 0.3, 3 μM on ATP6V1A protein level post 48-h exposure. β-Actin is a loading control. A blue dotted line is curve fitted for the set of data points. E, mRNA expression of ATP6V1A and the presynaptic SYN1 and SCL17A7 in iNs in the absence and presence of 3 μM NCH-51. n = 3–12. F-G, Representative WB and quantitative analysis (n = 3–8) of ATP6V1A, SYN1, and VGLUT1 proteins. TUJ1 is a loading control. H-J, Multi-electrodes array after exposure to 3 μM NCH-51. H, Representative raster plots of the spike events over 10 minutes. I, plate map of total spike events; J, analysis of spike events (n = 24 wells). K, NCH-51 increased mRNA levels of Vha68–2 in Aβ42 flies. n = 4. L-M, NCH-51 suppressed neurodegeneration in both the cell body (L) and central neuropil regions (M) in 21-day-old Aβ42 fly brains. Scale bars: 200 μm. Percentages of vacuole areas (indicated by arrows) were analyzed. n = 22–28 hemispheres. N, NCH-51 increased mRNA levels of synaptic biology related genes in Aβ42 fly brains in a dose-dependent manner (n = 4). See also Fig. S24–26 & Table S21. (See Fig. 3 for statistical test and P value annotations).
To verify the prediction, we measured the transcriptional and translational levels of ATP6V1A in D21 iNs treated with the 3 HDAC inhibitors at a series of concentrations between 1 and 30 μM. Only NCH-51 effectively increased ATP6V1A levels (Fig. 6B–D), whereas SAHA and MS-275 were ineffective (Fig. S24A–F), suggesting that the HDAC inhibitory activity of NCH-51 is not required for modulating ATP6V1A. A time-course experiment indicated that 24-hour treatment sufficiently resulted in the production of ATP6V1A mRNA; 3 μM NCH-51 was adequate to increase the protein yield significantly (Fig. 6D).
NCH-51 (3 μM, 24-hr) dramatically elevated the mRNA levels of ATP6V1A (P < 0.05), presynaptic SYN1 (P < 0.001), and SCL17A7 (P < 0.001), particularly in ATP6V1A KD iNs (Fig. 6E). The protein levels of ATP6V1A (P < 0.05), SYN1 (P < 0.01), and VGLUT (P < 0.05) were similarly increased by NCH-51 (Fig. 6F–G). NCH-51 had no effect on postsynaptic PSD95, while the HOMER1 level increased in either ATP6V1A KD iNs or the isogenic controls following NCH-51 treatment (Fig. S24G–I). The MEA assay indicated that NCH-51 was a potent activator of neuronal activity (Fig. 6H–J), partially restoring neuronal activity in ATP6V1A KD iNs (Fig. 6J).
Feeding NCH-51 induces expression of a fly ortholog of ATP6V1A and suppresses neurodegeneration in Aβ42 flies
NCH-51 feeding significantly increased the mRNA levels of Vha68–2 (Fig. 6K), but not Vha68–1 (Fig. S25A), in Aβ42 fly brains in a dose-dependent manner. Since Vha68–2 was more dramatically decreased compared to Vha68–1 in Aβ42 fly brains (Fig. 4Q), NCH-51 treatment might counteract pathological reductions in Vha68–2 levels. In support, NCH-51 feeding did not increase mRNA levels of either Vha68–1 or Vha68–2 in control flies (Fig. S25B).
Aβ42 flies were treated with 0, 10, or 50 μM of NCH-51 during aging to examine the effects of NCH-51 treatment on neurodegeneration. Compared to control (0 μM), 50 μM treatment of NCH-51 significantly suppressed cell loss (Fig. 6L) and neuropil degeneration (Fig. 6M). NCH-51 did not affect Aβ42 levels in fly brains (Fig. S25C), suggesting that observed effects were not due to reduced Aβ42 levels. NCH-51 also increased the mRNA levels of 9 out of 16 key regulator genes of neuronal activity, including 4 key driver genes GABRA1/Grd in M62, SCN2A/para in M65, and GABBR2/GABA-B-R2,3 in M6 (Fig. 2D) in Aβ42 fly brains (Fig. 6N), suggesting that NCH-51 confers neuroprotective effects by correcting neuronal activity.
DISCUSSION
Our integrative network analysis-based target nomination method complements the conventional linkage and linkage disequilibrium-based gene mapping methods in identifying the most relevant genes for functional studies. We highlighted multiple neuronal modules of particular relevance to LOAD pathology, and predicted key regulators of these modules using BNs; one top driver, ATP6V1A, was tested experimentally for disease relevance. ATP6V1A is known for its role in the acidification of intracellular compartments such as the lysosome; morpholino-knockdown of ATP6V1A impaired acid secretion in zebrafish (Horng et al., 2007), while siRNA-mediated knockdown induced autophagy activity in U87-MG cells (Kim et al., 2017), and KD of ATP6V1A in HeLa cells prevented drug-induced lysosomal acidification and autophagy activation (Chung et al., 2019). Under our experimental conditions, ATP6V1A CRISPRi in iNs did not significantly alter lysosomal pH according to cell acidic organelles labeling by LysoTracker Red DND-99 (data not shown). Instead, ATP6V1A CRISPRi down-regulated neuronal activity-associated functional pathways, particularly in the presence of Aβ42 peptides. Similar results were obtained in Aβ42 flies: mRNA levels of fly orthologs of ATP6V1A, Vha68–1/Vha68–2, were reduced and neuronal KD of Vha68–1 exacerbated age-dependent behavioral deficits and neurodegeneration accompanied by downregulation of synaptic genes, suggesting evolutionarily conserved roles of ATP6V1A in maintaining neuronal activity and synaptic integrity. Although de novo heterozygous mutations (p.Asp349Asn and p.Asp100Tyr) in ATP6V1A in rat hippocampal neurons revealed contradictory effects on lysosomal acidification, both mutations lead to abnormalities in neurite outgrowth, branching, and synaptic connectivity (Fassio et al., 2018). The possible synaptic role of ATP6V1A in LOAD brains requires further investigation.
hiPSC-based models recapitulate disease-relevant features, gene expression signatures, and identify deregulated genes with potential clinical implications (Hoffmann et al., 2018). Induced neurons also possess age-related signatures that share similarities with the transcriptomic aging signatures detected in postmortem human brain samples (Mertens et al., 2018). Likewise, here we show that the ATP6V1A KD signatures in iNs were highly enriched for the LOAD DEGs and the sub-network surrounding ATP6V1A, indicating that the hiPSC system is a promising avenue to model devastating diseases such as LOAD when living tissues are not available.
To date, therapeutics that are promising in mouse models of AD have failed to benefit human patients (Egan et al., 2018; Honig et al., 2018), urging development of novel therapeutic targets and new model systems. Computational drug repositioning (Pushpakom et al., 2019; Zhou et al., 2018a) provides a rapid and cost-effective route for translating transcriptional network findings into promising therapeutics. FK506, a drug known to induce autophagy by binding to ATP6V1A (Kim et al., 2017), was ineffective in recovering the ATP6V1A expression at either mRNA or protein level in our ATP6V1A KD iNs (data not shown). This contrasts to the current predicted novel drug candidate NCH-51, which activates ATP6V1A at both transcriptional and translational levels. We demonstrated that NCH-51 improved AD-related phenotypes, increasing neuronal activity in iNs and suppressing neurodegeneration in Aβ42 flies by recovering the expression of key regulators of neuronal activity. However, the molecular mechanisms by which NCH-51 acts remains unresolved. In the future, we will test NCH-51 on ATP6V1A-engineered mice and other mammalian models of AD.
Although the present study focused on the role of ATP6V1A on neuronal activity and Aβ42-mediated toxicity, tau pathology is closely associated with cognitive deficits and neurodegeneration in AD. Ectopic expression of human tau in fly eyes caused age-dependent and progressive neurodegeneration in the laminae, which contains photoreceptor axons (Ando et al., 2016). RNAi-mediated KD of Vha68–1 or Vha68–2 significantly exacerbated this axon degeneration (Fig. S26A–B) without altering the accumulation or phosphorylation levels of tau (Fig. S26C), suggesting that ATP6V1A may have broad neuroprotective effects and potential therapeutic targets for other neurodegenerative diseases involving tau.
A limitation with the current bulk transcriptomic data is that the expression changes may be confounded by cell-type composition difference. Consistent with existing knowledge, we confirm through deconvolution analysis that LOAD brains showed progressive neuronal cell loss as the severity advanced, accompanied by the gradual increase of glial cells (Fig. S27). With the current single-cell technology, we can study diseased tissues at the single-cell level (Deczkowska et al., 2018). Compared to a recent snRNA-seq analysis of LOAD (Mathys et al., 2019), we found significant preservations of our gene signatures (Fig. S4), suggesting that cell-type proportion change may have a limited impact on the gene signatures identified here. Nonetheless, we anticipate future cell-type-specific network models to offer an in-depth understanding of the cellular complexity and etiology underlying the devastating disease.
In summary, we employed a transformative platform to systematically identify molecular signatures, multiscale gene networks, and key regulators of LOAD in 4 brain regions. We uncovered a number of relatively independent neuronal enriched gene subnetworks that were highly dysregulated in LOAD. We validated one predicted top key driver of the dysregulated neuronal system, ATP6V1A, in silico, in vitro, and in vivo, and demonstrated NCH-51, a compound that can increase the expression level of ATP6V1A, to be a promising therapeutic candidate for treating LOAD.
STAR ★ Methods
RESOURCE AVAILABILITY
Lead Contact
Further information and requests for resources and reagents should be directed to and will be fulfilled by the Lead Contact, Bin Zhang (bin.zhang@mssm.edu).
Materials Availability
Stable human iPSC-derived neuronal progenitor cells (hiPSC-NPCs) expressing dCas9−KRAB utilized in this study can be requested through Dr. Kristen Brennand (kristen.brennand@mssm.edu) upon Material Transfer Agreement.
Drosophila lines developed in this study and the related reagents can be requested through Koichi M. Iijima (iijimakm@ncgg.go.jp) or Michiko Sekiya (mmsk@ncgg.go.jp).
Data and Code Availability
The human postmortem sequencing data are available via the AD Knowledge Portal (https://adknowledgeportal.synapse.org). The AD Knowledge Portal is a platform for accessing data, analyses, and tools generated by the Accelerating Medicines Partnership (AMP-AD) Target Discovery Program and other National Institute on Aging (NIA)-supported programs to enable open-science practices and accelerate translational learning. The data, analyses and tools are shared early in the research cycle without a publication embargo on secondary use. Data is available for general research use according to the following requirements for data access and data attribution (https://adknowledgeportal.synapse.org/DataAccess/Instructions).
For access to content described in this manuscript see: https://doi.org/10.7303/syn23519511
EXPERIMENTAL MODEL AND SUBJECT DETAILS
Human Postmortem Brain Tissue Samples
The MSBB-AD cohort included 364 human brains accessed from the Mount Sinai/JJ Peters VA Medical Center Brain Bank (MSBB) (Haroutunian et al., 2009; Wang et al., 2018; Wang et al., 2016). The postmortem interval (PMI) is ranged from 75 to 1800 minutes (min), with a mean of 436.5 min, a median of 312 min, and a standard deviation of 323 min. Each donor and corresponding brain sample was assessed for multiple cognitive, medical, and neurological features, including mean plaque density, Braak staging for neurofibrillary tangles (NFT)(Braak et al., 2006; Braak and Braak, 1991), clinical dementia rating (CDR) (Morris, 1993), and neuropathology scale as determined by the Consortium to Establish a Registry for Alzheimer’s Disease (CERAD) protocol (Mirra et al., 1991). Mean plaque density was calculated as the average of neuritic plaque density measures in five regions, including middle frontal gyrus, orbital frontal cortex, superior temporal gyrus, inferior parietal lobule and occipital cortex. Because many of the donors were nursing home residents and some experienced dementia that was more severe than that captured by the 0–3 scale of CDR, we used the validated version of the “extended” CDR which adds “profound” (CDR = 4) and “terminal” (CDR = 5) to the original 5 point scale (Dooneief et al., 1996; Heyman et al., 1987). These four cognitive/neuropathological traits were scored as semi-quantitative features ranging from normal to severe disease stages, reflecting the continuum and divergence of pathologic and clinical diagnoses of AD beyond a simple case-control classification. Donor brains with no discernable neuropathology (by CERAD assessment) or only neuropathologic feature characteristic of LOAD were selected from over 2,000 brains in the MSBB. Please refer to Table S1 for a summary of the subject demographic information. Since we focus on the common mechanisms between male and female, sex has been adjusted in the present RNA-seq data preprocessing (detailed below). We plan to assess the gender difference in AD at the molecular level in future studies.
Human Induced Pluripotent Stem Cell Lines
iPSC-derived NPCs (2607–1-4, 553-S1–1; both male) were generated by Dr. Kristen Brennand Lab at the Icahn School of Medicine at Mount Sinai. iPSCs (NSB553, NSB2607) were originally from the National Institute of Mental Health (NIMH) childhood-onset schizophrenia (COS) cohort. Human Astrocytes (Cat #1800) were purchased from ScienCell Research Laboratories, Inc. All hiPSC research was conducted under the oversight of the Institutional Review Board (IRB) and Embryonic Stem Cell Research Overview (ESCRO) committees at the Icahn School of Medicine at Mount Sinai (ISSMS). Informed consent was obtained from all skin cell donors as part of a study directed by Judith Rapoport MD at the National Institute of Mental Health (NIMH).
Drosophila Models
Flies were maintained in standard cornmeal media at 25 °C. Transgenic fly lines carrying UAS-Aβ42 and UAS-Tau were previously described (Iijima et al., 2004; Sekiya et al., 2017). The elav-GAL4 (#458), GMR-GAL4 (#1104), UAS-mcherry RNAi (#35785), UAS-Vha68–1 RNAi (#50726 and #42888), Vha68–11 (#82466), and UAS-Vha68–2 RNAi (#34582) were obtained from the Bloomington Drosophila Stock Center. UAS-Vha68–1 RNAi (#46397) and UAS-Vha68–2 RNAi (#110600) were obtained from the Vienna Drosophila Resource Center. The UAS-Luciferase RNAi Transgenic flies were generated by PhiC31 integrase-mediated transgenesis systems (Best Gene Inc.). Genotypes and ages of all flies used in this study are provided in figure legends. Experiments were performed using age-matched male flies and genetic background of the flies was controlled. For example, for RNAi experiments, we crossed virgin females from elav-GAL4; UAS-Aβ42 (double transgenic flies expressing Aβ42 pan-neuronally) and males from UAS-Vha68–1 RNAi lines (experimental group) or a UAS-mcherry RNAi line with the same genetic background as the RNAi lines (control group). The resultant offspring from each cross has the same hybrid genetic background and these flies were used for the experiments.
METHOD DETAILS
The MSBB-AD cohort data quality control and preprocessing
As described previously (Wang et al., 2018), we generated whole genome sequencing (WGS) as well as RNA-sequencing (RNA-seq) data in four brain regions from majority of the cases, including Brodmann area 10 (frontal pole, BM10-FP), Brodmann area 22 (superior temporal gyrus, BM22-STG), Brodmann area 36 (parahippocampal gyrus, BM36-PHG) and Brodmann area 44 (inferior frontal gyrus, BM44-IFG). Through an iterative QC and adjustment procedure which examined the genetic similarity between every pair of molecular profiles across different data types and multiple brain regions, we identified mislabeled or duplicated molecular profiles(Wang et al., 2018). In this paper, we excluded all mislabeled samples for downstream analyses. For RNA-seq, we further removed RNA-seq libraries with RNA integrity number (RIN) less than 4 or rRNA rate larger than 5%, and then selected one with the best sequencing coverage for the duplicated sequencing libraries (see Table S1 for demographics of the final set of RNA-seq samples). In the QCed dataset, the RIN is ranged from 4 to 10, with a mean of 6.8, a median of 6.6, and a standard deviation of 1.5. To avoid any artificial regional difference, the data from all four brain regions were merged and processed together. Genes with at least 1 count per million (CPM) reads in at least 10% of the libraries were considered expressed and hence retained for further analysis; others were removed. After filtering, 23,201 genes were retained. The gene read counts data were normalized using the trimmed mean of M-values normalization (TMM)(Robinson et al., 2010) method in the R/Bioconductor edgeR package to adjust for sequencing library size differences. It is critical to identify and correct for confounding factors in the RNA-seq data. For this purpose, we used R/Bioconductor variancePartition(Hoffman and Schadt, 2016) package to evaluate the impact of multiple sources of biological and technical variation in gene expression experiments, including sex, race, age, RIN, postmortem interval (PMI), sequencing batch, rate of exonic reads, and rate of rRNA reads, together with the four cognitive/neuropathological features described in the main text. Fig. S1 illustrates the principal component analysis and variance partition analysis of the RNA-seq data. We found sequencing batch, exonic rate and brain donor contributed to the most variance. The contributions from the cognitive/neuropathological variables were similar and ranked in the middle among all the variables. While rRNA rate generally did not explain a large proportion of variation, it contributed more overall variance than did sex and race. Therefore, in addition to the usual confounding factors that are commonly corrected in postmortem brain gene expression data, including batch, sex, race, age, RIN, and PMI, we included exonic rate and rRNA rate as covariates. As there were more than 30 batches, the batch was firstly regressed out with a random effect model using variancePartition(Hoffman and Schadt, 2016), and the other covariates were corrected by linear regression in R.
Differential expression analysis
For each neuropathological/cognitive trait in each brain region, we grouped the samples into multiple disease severity stages and compared the gene expression between every two groups using limma’s moderated t-test analysis(Law et al., 2014). Specifically, for CDR, samples were classified into cognitive normal (nondemented) (CDR = 0), mild cognitive impairment (MCI) (CDR = 0.5), and demented (CDR ≥ 1). For Braak score, samples were classified into normal (NL) when Braak score ≤ 2, and AD when Braak score > 2. For plaque mean density (PlaqueMean), samples were classified into 4 categories, namely normal (PlaqueMean = 0), mild (0 < PlaqueMean ≤ 6), medium (6 < PlaqueMean ≤ 12), and severe (PlaqueMean > 12) groups. With CERAD score, two types of samples classification schemes were used. First, samples were classified into normal (NL) (CERAD = 1), definite AD (CERAD = 2), probable AD (CERAD = 3) and possible AD (CERAD = 4). Second, samples were classified into two groups, normal (NL) when CERAD = 1 and AD when CERAD > 1. To adjust for multiple tests, false discovery rate (FDR) was estimated using the Benjamini-Hochberg (BH) method(Benjamini and Hochberg, 1995). Genes showing at least 1.2-fold change (FC) and FDR adjusted P values less than 0.05 were considered significant. The gene showing the largest fold increase in all comparisons is LTF (lactotransferrin) (3.8-fold, adjusted P value 3.9E-5) as identified in BM36-PHG with respect to the PlaqueMean trait. Lactotransferrin is a major component of mammals’ innate immune system, protecting from direct antimicrobial activities to anti-inflammatory and anticancer activities(Legrand et al., 2008). NEUROD6 (neuronal differentiation factor 6) showed the largest fold decrease across all contrasts (0.34-fold, adjusted P value = 6.3E-9). NEUROD6 encodes a transcription activator that may be involved in neuronal development and differentiation. Down-regulation of NEUROD6 in LOAD has been consistently observed in several previous studies(Fowler et al., 2015; Satoh et al., 2014).
To systematically validate the present DEG signatures of LOAD related traits, we assembled public ALOD signatures from 10 studies, including Zhang et al 2013 (Zhang et al., 2013a), Webster et al 2009 (Webster et al., 2009), Satoh et al 2014 (Satoh et al., 2014), Miller et al 2013 (Miller et al., 2013), Avramopoulos et al 2011 (Avramopoulos et al., 2011), Liang et al 2008 (Liang et al., 2008), Colangelo et al 2002 (Colangelo et al., 2002), Blalock et al 2004 (Blalock et al., 2004), Mostafavi et al 2018 (Mostafavi et al., 2018), and Allen et al 2018 (Allen et al., 2018). Then we evaluated the overlap between the present DEGs and these previously published LOAD signatures using the Fisher’s exact test (FET). We observed a highly significant overlap (adjusted P value up to 1.0E-100) for almost every differential contrast in public LOAD signatures as illustrated in Fig. S3. We note that when up- and down-regulated DEGs were separated, we observed significant enrichments in consistent directions with respect to expression changes in this analysis. The relatively mild enrichment for the signatures in BM10-FP and BM44-IFG was due to the small number of genes identified in the two regions. To further investigate if the present expression signatures from bulk tissue RNA-seq tend to reflect cell-type changes, we collected a set of cell type-specific DEGs identified from a recent single-nuclei RNA-seq (snRNA-seq) analysis of LOAD postmortem brains(Mathys et al., 2019). Here, we used cell type-specific DEGs computed from the cell-level model. Fig. S4 shows the FET of the enrichment between our bulk-tissue DEGs and the cell type-specific DEGs detected in Ex (excitatory neurons), In (inhibitory neurons), Oli (oligodendrocytes), Opc (oligodendrocyte progenitor cells), Ast (astrocytes), or Mic (microglia) in brains with LOAD pathology. We observed a strong preservation of both up- and down-regulated genes in a cell type-specific manner. These results demonstrate a robust set of LOAD related gene signatures across all brain regions profiled.
To understand what biological processes are represented in the DEGs, we tested these signatures for enrichment of gene ontology (GO) and canonical functional pathway gene sets from the Molecular Signatures Database (MSigDB) gene annotation database v6.1(Liberzon et al., 2011; Subramanian et al., 2005). For convenience, the MSigDB gene set collections have been assembled into an R package called “msigdb” which is publicly available from https://github.com/mw201608/msigdb. We overlapped the DEGs with the MSigDB gene sets and computed the fold enrichment (FE) and P value significance using the algorithms described in the next section “Overlap and functional enrichment analysis”. The top enriched terms are summarized in Fig. S5, and the full list of significant enrichments is provided in Table S3.
Overlap and functional enrichment analysis
Functional enrichment analysis (or overlap test) P value was calculated using the hypergeometric test (equivalent to the Fisher’s exact test, FET) assuming the sets of genes, such as DEGs, were identically independently sampled from all the genome-wide genes detected by RNA-seq except otherwise specifically stated. Fold enrichment (FE) was calculated as the ratio between observed overlap size and expected overlap size. To control for multiple testing, we employed the Benjamini-Hochberg (BH) approach(Benjamini and Hochberg, 1995) to constrain the FDR. For GO and pathway enrichment analysis, we utilized the functional gene set collections from the Molecular Signatures Database (MSigDB) v6.1 (Liberzon et al., 2011; Subramanian et al., 2005).
For brain cell type marker gene enrichment analysis, we focused on the 5 major brain cell types, i.e. neurons, microglia, astrocytes, oligodendrocytes and endothelial, and for each type used the top 500 ranked consensus cell type-specific genes derived from a meta-analysis of 5 cell type-specific or single cell RNA-seq datasets (McKenzie et al., 2018).
Cell-type deconvolution analysis
We performed cell-type deconvolution analysis to estimate the major brain cell-type proportions using a Digital Sorting Algorithm (DSA) (Zhong et al., 2013). From the normalized gene expression matrix and cell-type marker genes, DSA estimates the cell type frequencies by solving a restricted linear model. Here we focused on 5 major brain cell types (i.e., neurons, astrocytes, oligodendrocytes, microglia, and endothelial), and for each type, we used 5 markers which were top ranked for cell type specificity according to our recent brain cell type specific transcriptomic analysis (McKenzie et al., 2018). As illustrated in Fig. S27, the diseased brains showed progressive neuronal loss as the severity advanced, which was accompanied by the increase of glia cells. The neuronal cell frequencies were negatively correlated with disease traits in all brain regions. For example, the Spearman correlation between neuronal frequencies and CDR ranged from −0.18 to −0.41 (P value = 3.1E-3 ~ 2.6E-10). The proportion of microglia cells was not estimable, likely due to the low sensitivity in estimating cells with low abundance.
MEGENA gene coexpression network analysis
For MEGENA(Song and Zhang, 2015), Pearson correlation coefficients (PCCs) were computed for all gene pairs in every brain region. Significant PCCs at a permutation-based FDR cutoff of 0.05 were ranked and iteratively tested for planarity to grow a Planar Filtered Network (PFN) by using the PMFG algorithm. Multiscale Clustering Analysis (MCA) was conducted with the resulting PFN to identify coexpression modules at different network scale topology. We identified 475, 527, 441 and 423 coherent gene expression modules in BM10-FP, BM22-STG, BM36-PHG and BM44-IFG, respectively (Table S4). To annotate the potential biological functions associated with the modules, we performed MSigDB gene set enrichment analysis using FET as described above. Most of these modules (53.9% to 67.3%) were enriched for MSigDB GO/pathway gene sets (adjusted P value < 0.05) (Table S5), indicating that MEGENA is capable of capturing data-drive biologically meaningful, context-dependent co-regulation signals beyond what is represented in canonical pathways from ontology databases. For simplicity, modules were annotated by the top enriched functional category. It is noted that MEGENA modules are formed in a hierarchy with parent-child relationships which can be illustrated by a sunburst style plot.
To prioritize the gene modules with respect to their association to LOAD pathology, we applied an ensemble ranking metric(Wang et al., 2016) across multiple feature types (Fig. 2B–C), including 1) correlations between module eigengenes (i.e. the first principal component of module gene expression profile) and cognitive/pathological traits associated with LOAD, and 2) enrichment for the DEG signatures identified above. A more complete description of the information used to rank the modules is included in Table S6. The ranking of the top 25 MEGENA modules are illustrated in Fig. 2B, with all of the top modules coming from the BM36-PHG region.
We annotated the potential cell type specificity of the modules by evaluating enrichment of brain cell type-specific marker as described above, with the enrichment statistics summarized in Table S6. We found many top-ranked modules were enriched for neuronal or microglia-specific cell types (Fig. 2B–C) based on enrichment analysis of cell type-specific markers of five major brain cell types, including neurons, microglia, endothelial, astrocytes and oligodendrocytes (McKenzie et al., 2018). To test whether the top-ranked neuronal system modules reflected distinct neuronal subtypes, we utilized a large-scale single-nucleus RNA-seq data of inhibitory and excitatory neurons isolated from six different regions of the human cerebral cortex(Lake et al., 2016). We downloaded the preprocessed gene expression data (transcripts per million, TPM) from this published study and further selected genes with at least 1 TPM in at least 10% of the cells in one subtype. Then we computed genes which showed differential expression between cell types using limma’s moderated t-test analysis (Law et al., 2014). Source of brain region origination of the cells was incorporated as a covariate. While the original study identified up to 16 different sub-types of neurons, we focused on the genes differentiate between the two major neuron cell types (i.e. inhibitory and excitatory). We called genes inhibitory neuron-enriched if they presented at least 4-fold higher expression in inhibitory neuron cells than in excitatory neuron cells with FDR < 0.05, and excitatory neuron-enriched if they presented at least 4-fold higher expression in excitatory neuron cells than in inhibitory neuron cells with FDR < 0.05. As a result, we identified 1008 excitatory neuron-enriched genes and 413 inhibitory neuron-enriched genes. Lastly, we overlapped the cell type-enriched genes with the top-ranked neuronal modules and found that module M64 was overrepresented with inhibitory neuron-enriched genes while M6, M87, M65, M236, M62, and M252 were overrepresented with excitatory neuron-enriched genes (Table S7).
Interestingly, a number of LOAD GWAS risk genes were present in our top-ranked modules, including MEF2C (M62), CELF1, MADD, PLD3, PTK2B, and ZCWPW1 (M6), and APP and SORL1 (M64), CLU and CR1 (M17), and APOE, CASS4, CD33, HLA-DRB1/HLA-DRB5, INPP5D, MS4A4A/MS4A6A and TREM2 (M153 and M14). The mechanism underlying the clustering of GWAS risk genes in the top modules is unknown. One possible reason is that they express in common cell types.
Network connectivity preservation analysis
We investigated the preservation of global MEGENA co-expression network between our MSBB RNA-seq data and the ROSMAP RNA-seq data (Mostafavi et al., 2018), using the network-based statistics calculated by the modulePreservation function from WGCNA (Langfelder et al., 2011). Since modulePreservation does not allow a single gene to be present in multiple modules as in MEGENA, we considered each gene-module combination as a unique gene and renamed the genes, then created a new expression matrix accordingly. We reported module preservation with the main network-based statistics Zsummary.pres and followed the original software guideline to denote a module as strongly preserved (Zsummary.pres > 10), weakly to moderately preserved (2 < Zsummary.pres < 10), or not preserved (Zsummary.pres < 2).
Discovery of region-wide expression quantitative trait loci (eQTLs)
Given the well-established relationships between gene expression and interactions with genetic and environment factors, we mapped expression quantitative trait loci (eQTLs) by integrating the RNA-seq and WGS-based Single-nucleotide polymorphism (SNP) genotype data. SNPs significantly associated with gene expression traits were identified using the MatrixEQTL package (Shabalin, 2012). Significant SNPs (eSNPs) were classified into cis- and trans-acting elements according to whether they are located within 1-MB from the gene or not. At a conservative Bonferroni corrected P value threshold of 0.05 (equivalent to a nominal P value cutoff of 3.0E-10), 1214, 922, 762, and 1054 genes were identified to be regulated by at least one proximal SNP within 1 million base (Mb) from the gene, termed cis-eSNP, in BM10-FP, BM22-STG, BM36-PHG, and BM44-IFG, respectively (Table S9). For simplicity, we refer to genes with significant eSNPs as eGenes and a significant association between a SNP and a gene as an eSNP-eGene pair. By such a definition, 126,799, 101,705, 92,336, and 112,139 cis-eSNP-eGene pairs were identified in BM10-FP, BM22-STG, BM36-PHG and BM44-IFG, respectively. It is noted that there are redundant eSNPs for the same eGene due to linkage disequilibrium (LD) of the SNPs. Fig. S7 shows the overlap of these cis-eSNP-eGene pairs among the four brain regions. 66.1% to 90.7% of the cis-eSNP-eGene pairs identified in one brain region were also detected in at least one other brain region. In addition, 71,298 cis-eSNP-eGene pairs from 548 unique genes were shared by all 4 brain regions.
We detected 20,657, 14,011, 14,766, and 17,125 trans-eSNP-eGene pairs from BM10-FP, BM22-STG, BM36-PHG and BM44-IFG, respectively. For each brain region, 28.5 to 70.1% of the trans-eSNP-eGene pairs identified were also detected in at least one other brain region (Fig. S7). We grouped Bonferroni corrected significant SNPs within a 5-Mb interval into a single peak because of insufficient resolution to break LD over such narrow windows(Morley et al., 2004; Yang et al., 2014). Each peak was represented by the most significant eSNP in the window, referred to as the lead eSNP, for a given trans-eGene. We identified 2,411, 1,965, 1,392 and 2,460 trans-eQTL peaks from BM10-FP, BM22-STG, BM36-PHG and BM44-IFG, respectively. Early eQTL studies noted the existence of master trans-genetic regulators, which we refer to as eQTL hotspots (Schadt et al., 2003), that regulate many genes throughout the human genome. We defined trans-eQTL hotpots as those peaks associated with 10 or more trans-eGenes. At this definition, we identified 24, 12, 2 and 27 trans-eQTL hotpots from BM10-FP, BM22-STG, BM36-PHG and BM44-IFG, respectively (Fig. S8 and Table S10), with nine trans-eQTL hotspots shared between 2 or 3 brain regions (Fig. S9). Each of these hotspots were associated with 10 to 36 trans-eQTL genes. The hotspot associated with the greatest number of trans-eQTL genes (36 genes) was located at a region near 84.4-Mb on chromosome 17 (lead eSNP rs10264300) in BM44-IFG. SNP rs10264300 is 181 kilobases upstream of AC003984.1 (a long intergenic noncoding RNA, lincRNA) and 82.5 kilobases downstream of AC093716.1 (a pseudogene gene). About half (16) of the gene targets of this hotspot encode enzyme binding proteins (6.4-FE, adjusted FET =7.1E-5) (Table S11). Interestingly, synaptic pathway genes were enriched for the targets of a hotpot near lead SNP rs34072069 on chromosome 10 in BM10-FP (17.1-FE, adjusted FET P=4.9E-6). SNP rs34072069 is 44.5 kilo-bases (KB) upstream of RNU6–535P (a small nuclear RNA gene) and 1.9 KB downstream of RP11–385N23.1 (an antisense gene).
We evaluated whether any modules were enriched for our cis-eGenes. Twelve MEGENA modules were significantly enriched for cis-eQTL genes (Table S12), among which four were associated with GTPase mediated signal transduction (one from each brain region (>17.9-FE, adjusted FET P < 3.5E-11) and three were associated with transferase activity (one from each of 3 brain regions except BM44-IFG; > 10.9-FE, adjusted FET P < 2.3E-4). We noted that the genes in the GTPase mediated signal transduction modules were concentrated in chromosome region 17q21, while the transferase activity modules in chromosome region 8p23, suggesting the genetic regulation of these modules by common eQTLs shared by multiple brain regions.
We attempted to replicate eQTLs in an independent LOAD postmortem brain RNA-seq dataset generated from the ROSMAP cohort(Mostafavi et al., 2018), which is, to our knowledge, the largest sampled RNA-seq based eQTL analysis of LOAD in a single brain region (494 individuals). Cis-eQTLs were identified for 3,388 genes from the ROSMAP cohort as published by Ng et al (Ng et al., 2017). However, since no trans-eQTLs were reported for the ROSMAP cohort(Ng et al., 2017), we focused on the replication of cis-eQTLs in this paper, and particularly the cis-eSNP-eGene pairs that were available in both datasets. To avoid including dependent signals induced by LD among adjacent SNPs, only the associations comprising the top SNP for each eGene were included in the replication rate calculations. To circumvent the statistical power difference caused by different sample sizes (494 individuals in ROSMAP and 215~261 individuals across the present four brain regions), we first followed Ng et al (Ng et al., 2017) to assess the replication rate of LOAD brain cis-eSNP-eGene discovered in the ROSMAP cohort in our data set using the π1 statistic(Storey and Tibshirani, 2003), which estimated the proportion of reported ROSMAP cis-eSNP-eGene pairs that are also significant in the current data set based on their P-value distribution. π1 values of the ROSMAP cis-eSNP-eGene pairs were 0.698, 0.674, 0.637, and 0.670 in the present brain regions BM10-FP, BM22-STG, BM36-PHG, and BM44-IFG, respectively. These values were significantly larger than their empirical null mean of 0.025~0.038 from 10,000 random samples of P values of associations that did not overlap with the eQTLs (one-tailed P value < 0.0001). Analogously, we applied the same π1 statistic to estimate the replication rate of the present region-wide eQTLs in the ROSMAP data but were unsuccessful because the P value distributions of the MSBB cis-eSNP-eGene pairs were truncated (maximum P value = 0.92) with majority of the values approaching 0 (93% to 96% were less than 0.05) in the ROSMAP data. In fact, 81.6%, 84.3%, 89.0% and 82.5% of the cis-eSNP-eGene pairs identified in BM10-FP, BM22-STG, BM36-PHG, and BM44-IFG, respectively, were also called genome-wide significant in the ROSMAP data, indicating most of the present cis-eQTLs were replicated, while the rest 11~18% are likely novel cis-eQTLs or false positives. Nonetheless, these results indicate marked common genetic regulation occurring across different brain regions.
Integrating eQTL, gene expression traits, and LOAD GWAS loci to identify causal LOAD genes
We did not observe significant enrichment for cis-eGenes in the LOAD-related DEGs or brain cell type-specific markers in each brain region (with less than 8% of the cis-eGenes detected as DEGs and less than 6% of the DEGs detected as cis-eGenes, FET P value > 0.1), suggesting a lack of detectable cis- genetic regulation among the genes dysregulated in LOAD brains. However, for the most strongly associated SNPs across all cis-eGenes, we observed a significant enrichment (P < 0.05) for LOAD genetic association signals based on the SNP-level summary statistics from a recent meta-analysis of AD GWAS(Kunkle et al., 2019), compared to random samples of SNPs of the same size (Table S13). In this analysis, we first selected the strongly associated SNPs across all cis-eGenes and then extracted their SNP-level LOAD GWAS chi-square statistics from the AD GWAS study (Kunkle et al., 2019). The mean chi-square statistics among those cis-eSNPs was compared to a null distribution which was obtained by randomly sampling the same number of SNPs for 10,000 times. Enrichment P value was computed as the proportion of randomly sampled SNP sets with mean chi-squared values larger than the observed one.
Moreover, cis-eQTLs overlapped the genome-wide significant LOAD GWAS SNPs at GWAS risk loci HLA-DRB1/HLA-DRB5 and ZCWPW1. To aid in the identification of candidate causal genes in these GWAS loci, we applied the summary-data-based mendelian randomization (SMR) (Zhu et al., 2016b) method to test if the effects of the top GWAS SNPs in the HLA-DRB1/HLA-DRB5 and ZCWPW1 loci were mediated by gene expression associated with eQTL coincident with the GWAS loci. By integrating eQTLs and GWAS signals, we aimed to prioritize the most possible functional relevant genes underlying the effects of causal variants on the disease phenotype at two LOAD GWAS risk loci. We reformatted the eQTL results and AD GWAS SNP-level summary statistics (Kunkle et al., 2019) data files in accordance to the manual of the SMR software (Zhu et al., 2016b). Then we ran region-wide SMR analysis using the default parameter. For each locus, we used the region-wide rather than the experiment-wise significance threshold because we were interested in gene discovery for each specific locus in each brain region than the joint analysis of all regions as a whole. For the genes with significant association by the SMR test, the heterogeneity in dependent instruments (HEIDI) test(Zhu et al., 2016b) was further employed to distinguish whether the association was caused by pleiotropy of the same causal variant underlies the disease risk, or due to linkage of distinct variant to the one causal to the disease.
Fig. S10 shows the GWAS and eQTL P value profiles at the HLA-DRB1/HLA-DRB5 locus as well as the SMR test results in four brain regions. In a 2-Mb region centered on HLA-DRB1, there were 11~12 genes with cis-eQTLs across the four brain regions. For example, 12 genes were found to have cis-eQTLs in BM10-FP; the SMR test was significant for HLA-DRB5 at a Bonferroni corrected P value threshold of 4.5E-3, while the gene HLA-DRB1 was not significant. To distinguish whether the significant association in the SMR test was caused by pleiotropy that gene expression and the trait affected by the same underlying causal variant, or due to linkage that the top associated cis-eQTL being in LD with two distinct causal variants, one affecting the disease trait and the other affecting the gene expression, we further performed the heterogeneity in dependent instruments (HEIDI) test as in Zhu et al (Zhu et al., 2016b). HLA-DRB5 showed no significant heterogeneity by the HEIDI test (P value > 0.05), supporting the null hypothesis that there is a single causal variant affecting both gene expression and disease trait phenotype. In summary, we found that HLA-DRB5 passed both SMR and HEIDI tests in all four brain regions, HLA-DQA1 passed both SMR and HEIDI tests in BM36-PHG and BM22-STG, HLA-DRB1 passed both SMR and HEIDI tests in BM36-PHG, and HLA-DQB2 passed both SMR and HEIDI tests in BM44-IFG (Fig. S10), suggesting that HLA-DQA1, HLA-DQB2, HLA-DRB1, and especially HLA-DRB5 are the most plausible functionally relevant targets underlying the GWAS hits at this locus.
At a 2-Mb region surrounding gene ZCWPW1, there were 3 to 6 genes with cis-eQTLs across the different brain regions (Fig. S11). ZCWPW1 did not pass the SMR test, indicating that our data do not support that the expression of ZCWPW1 mediates the causal effect on the disease phenotype. However, an adjacent gene PVRIG passed the SMR test in BM36-PHG. PVRIG, also known as CD112R, encodes a protein that recruits tyrosine phosphatases for signal transduction and could act as a coinhibitory receptor that suppresses T cell receptor (TCR) signaling(Zhu et al., 2016a). We noted that none of the genes passed the HEIDI test, rejecting the null hypothesis that there is a single causal variant affecting both gene expression and disease trait phenotype.
The present analysis shows that eQTL prioritized genes may not be necessarily the genes nearest to the peak SNP as reported in the association studies. Further independent replications and experimental validations are required to verify the potential causal relationships inferred from the current integrative analysis.
Bayesian probabilistic causal network inference and key driver analysis
To construct Bayesian probabilistic causal Network (BN), we made use of genetic perturbations in biological systems (e.g. WGS SNP variants) and known transcription factor (TF)-target relationships from the ENCODE project as prior for inferring regulatory relationships between genes. In the causal network construction, the TFs are allowed to be parent node of their target genes; but targets are inhibited to be parent nodes of their TFs. To infer gene regulatory relationship from genetic data, we first computed cis- and trans-eQTLs for each expression trait using WGS-based SNP variants as described above and then employed a causal inference to infer the causal probability between gene pairs associated with the same eQTL. Since a gene pair associated with the same eSNP may be causally regulated from one to another or independently regulated by a genetic factor in LD with the eSNP, we derived genetic priors under two scenarios. In the first scenario, genes with cis-acting eSNP could be parent nodes of genes with trans-acting eSNP, but the opposite direction was not permitted following previous practices (Zhu et al., 2007b; Zhu et al., 2008). In the second scenario where the genes are both cis-regulated or both trans-regulated, either gene can be the parent node of the other and hence there are two possible directions. For the latter scenario, we applied a formal causality inference test (CIT) (Millstein et al., 2009; Schadt et al., 2005b) to distinguish the causal/reactive and independent relationships between the gene expression traits by modeling the gene pair and associated eSNP with a “chain” of mathematical conditions. For each trio (a gene pair and one eSNP), CIT will compute the probability of the causal “chain” in which one gene is mediating the causal impact of the eSNP to the other gene when the regulatory direction is allowed (Millstein et al., 2009). In cases that the gene pair is associated with multiple common eSNPs, the individual causality test P values of each trio were aggregated using Fisher’s method to make a collective call for the gene pair. As the conservative Bonferroni corrected P value threshold of 0.05 in the eQTL analysis gave a very limited number of gene pairs associated with common SNPs, we relaxed the cutoff to a BH FDR adjusted P value threshold of 0.05 to increase the pool of potential causal-reactive gene pairs. The causal relationships thus inferred by CIT were combined with TF-target relationships, and together they were used as structure priors for building a brain region-wide BN from all 23,201 expressed genes through a Monte Carlo Markov Chain (MCMC) simulation based procedure (Zhu et al., 2007a). Following previous practices (Zhu et al., 2007b; Zhu et al., 2008), we employed a network averaging strategy in which 1,000 networks were generated by this MCMC process starting with different random structure, and links that appeared in more than 30% of the networks were used to define a final consensus network. If loops were present in the consensus network, the weakly supported link involved in a loop was removed to ensure the final network structure was a directed acyclic graph.
From the region-wide BNs, we identified network key drivers that are predicted to modulate a large number of downstream nodes, and as a result, modulate the state of the network, by using the Key Driver Analysis (KDA) (Huan et al., 2013; Zhang et al., 2013a; Zhang and Zhu, 2013). Here we loaded all the BN nodes as input in the KDA and hence the resulting key drivers were called global network key drivers which were different from the pathway (such as the neuronal modules) context dependent key drivers described later. There were 1,545, 1,418, 1,454, and 1,371 global key drivers in the BNs from BM10-FP, BM22-STG, BM36-PHG and BM44-IFG, respectively. Strikingly, the key drivers were significantly conserved across the region-wide BNs, with any two BNs sharing a significant number of key drivers (7.2 < FE ≤ 8.2, FET P values < 1.0E-320) while 325 key drivers were shared across four BNs (929.4-FE, Super Exact Test P value < 1.0E-320) (Fig. S12), demonstrating a high-degree of conservation of the regulatory architecture in the brain regions we profiled. This is in line with previous study that replication of edge-to-edge is strongly dependent on the sample size while highly connected key driver nodes tend to be more stable than network edges (Cohain et al., 2017).
To perform a comprehensive validation of the BN topological structures and the global key drivers that modulate them, we downloaded a library of 2,460 single gene perturbation signatures curated at the Enrichr server (Kuleshov et al., 2016). After filtering for central nervous system (CNS) or immune system-related studies and requiring the perturbed genes to be present in the current dataset, we obtained 649 signatures from 320 studies for 287 unique perturbed genes. These gene perturbation signatures were collected from the gene expression omnibus (GEO) database, and the original experiments were conducted in a diversity of conditions (different cell lines or tissues from different species). 66 of these perturbed genes were global key drivers in at least one of our four brain region-wide BNs. For each of these perturbed global key drivers, we examined whether the experimental perturbation signature was predicted by our networks by examining whether the genes in these signatures were enriched for genes in the network neighborhood of the key driver in our BNs (examining genes that were within a path length of 6 of the key driver gene). Despite the vast heterogeneity of the gene perturbation studies compared to the present human postmortem brain tissues used to generate our data for the region-wide BNs, 50 to 60% of the key driver perturbation signatures were enriched in the network neighborhoods of the corresponding key drivers across the four region-wide BNs (Fig. 3B). The significance levels of the enrichments are observed to increase as path lengths defining the network neighborhoods are increased, given the BNs were sparse, with a limited number of neighboring nodes closer to the key driver gene, which serves to reduce the power to make such detections, especially in the context of multiple testing. In contrast, the proportion of significantly enriched perturbation signatures decreased to 20~30% in the network neighborhood of non-driver genes.
We further performed KDA on the top-ranked MEGENA neuronal modules to identify their master regulators. In this analysis, we projected the module genes onto the region-wide BN and searched for key driver genes whose network neighborhood were enriched for the module genes. Different from the global key drivers described above, here the key drivers were context dependent, in this case, related to neuronal system subnetworks. This yielded 42 unique key driver genes across 9 modules (Table S14) predicted to be the network key drivers. 10 key drivers were root nodes in the BM36-PHG BN without parental nodes. To further verify the root node status beyond a single region-based network, we sought to integrate information from all 4 region-wide BNs to build a union BN that contained a union of directed links from all 4 individual BNs by following previous practices (Haure-Mirande et al., 2019; Katsyv et al., 2016). Like region-wide BNs, loops in the union BN were broke by removing the weakly supported links. Two key drivers, ATP6V1A (module M64), and GABRB2, (module M62), remained as root nodes in this union BN.
Gamma-aminobutyric acid (GABA) is the major inhibitory neurotransmitter in the mammalian brain and GABA type A (GABA-A) receptors mediate the inhibition effect(Sigel and Steinmann, 2012). GABA-A receptors form pentameric complexes by combinations of more than 10 subunits and marked functional remodeling GABA-A receptors, including change of subunit composition and reduced expression of principal subunits, had been observed in LOAD brains(Limon et al., 2012). In this paper, we observed a significant down-regulation of the subunits α1–6, β2–3 and γ2–3 in diseased brains compared to control (Table S2). It has been reported that GABA-A β2 (GABRB2) subunit, paralleled with some other subunits like α1, α2, α5, β3, and γ2, showed altered brain region- and cell layer-specific expression (Kwakowsky et al., 2018). Its protein level was significantly decreased in the dentate gyrus stratum moleculare, but increased in the stratum oriens and stratum radiatum of the hippocampal CA2 region, and stratum radiatum of the hippocampal CA3 region (Kwakowsky et al., 2018), indicating a region-dependent up- or down- dysregulation of this gene in LOAD.
Drug repositioning of AD signature in neural progenitor cells
To identify existing drugs that can restore the molecular expression change in the LOAD brains, we performed a drug repositioning analysis using EMUDRA (Zhou et al., 2018a), which provides a novel computational algorithm to match disease signatures and drug-induced signatures. For this purpose, we downloaded drug-treated gene expression profiles (level 3 data of quantile-normalized and log2 transformed expression levels from human iPSC-derived neural progenitor cells (NPCs) from the Library of Integrated Network-Based Cellular Signatures (LINCS) program (Keenan et al., 2018; Subramanian et al., 2017). After removing probes sets mapping to multiple genes or without known gene annotation, the remaining data were adjusted for batch effects using linear regression. Mean expression level of multiple probe sets matching to the same gene was used as the expression level of that gene. For each drug, the transcriptome-wide expression difference between drug-treated and DMSO-treated gene expression profiles was considered the drug signature. We then matched each of the drug signatures to the LOAD signature using EMUDRA to find drugs that could reverse the LOAD signature. For LOAD signature, we used the DEGs between CERAD definite AD and normal control brains in the BM36-PHG region (3,000 up- and 2,076 down-regulated genes). In total, 3,629 drug signatures were analyzed and ranked. We further prioritized the top-ranked drugs that can increase ATP6V1A mRNA expression in the NPCs.
Lentivirus generation
Third-generation VSV.G pseudotyped HIV-1 lentiviruses (below) were produced by polyethylenimine (PEI, Polysciences #23966– 2)-transfection of HEK293T cells and packaged with VSVG-coats using established methods (Tiscornia et al., 2006). Lentiviral FUW-M2rtTA (Addgene #20342), pLV-TetO-hNGN2-eGFP-neo (TBD), lentiGuide-Hygro-mTagBFP2, and 6 lentiGuide vectors with insertion were generated. Physical titration of lentivirus was performed by qPCR (qPCR Lentivirus Titration Kit, ABM good #LV900). Lentiviruses were then used to transduce cells according to their physical titer as described below, calculated through the company’s website (https://www.abmgood.com/High-Titer-Lentivirus-Calculation.html).
gRNA design and cloning for in vitro functional validation of ATP6V1A deficit in NGN2-neurons
gRNA design and cloning were performed as previously described (Ho et al, 2017). Specifically, 6 gRNA candidates for ATP6V1A were designed by using CRISPR-ERA web tool (crispr-era.stanford.edu): 6 gRNA sequences targeting promoter region (between +658 bps and transcription start site) of ATP6V1A. For lentiviral cloning, the gRNA sequences were inserted into LentiGuide-Hygro-mTagBFP2 (Addgene #99374). Oligonucleotides encoding gRNA sequences were annealed, diluted and then ligated into BsmBI-digested LentiGuide vectors as previously described (Ho et al, 2017). Sanger sequencing using U6 promoter confirmed all constructions.
| Oligo ID | Location | gRNA (E,S score) | gRNA Sequence (5′-3′) |
|---|---|---|---|
| ATP6V1i_#1-1 | +260 | #1 (20,0) | 5′-CACCGGCGGGAACGACCACACTTGG |
| ATP6V1i_#1-2 | 5′-AAACCCAAGTGTGGTCGTTCCCGCC | ||
| ATP6V1i_#2-1 | +101 | #2 (20,0) | 5′-CACCGGGCGACCGGTAACTGGCGAG |
| ATP6V1i_#2-2 | 5′-AAACCTCGCCAGTTACCGGTCGCCC | ||
| ATP6V1i_#3-1 | +94 | #3 (20,0) | 5′-CACCGGGTGAGCGGCGACCGGTAAC |
| ATP6V1i_#3-2 | 5′-AAACGTTACCGGTCGCCGCTCACCC | ||
| ATP6V1i_#4-1 | +14 | #4 (20,−2) | 5′-CACCGGGGGAAGTCCTCAGCTGCAC |
| ATP6V1i_#4-2 | 5′-AAACGTGCAGCTGAGGACTTCCCCC | ||
| ATP6V1i_#5-1 | +266 | #5 (20,−2) | 5′-CACCGGTGGTCGTTCCCGCTACTT |
| ATP6V1i_#5-2 | 5′-AAACAAGTAGCGGGAACGACCACC | ||
| ATP6V1i_#6-1 | +658 | #6 (15,0) | 5′-CACCGGATGTTCACGTGCTTCGGAT |
| ATP6V1i_#6-2 | 5′-AAACATCCGAAGCACGTGACATCC |
hiPSC-NPC culture and NGN2 neuronal differentiation
Two stable hiPSC-derived neuronal progenitor cells (hiPSC-NPCs) (553KRAB and 2607KRAB) expressing dCas9-KRAB (Addgene 99372) were generated as previously described(Ho et al., 2017) and cultured in hNPC media (DMEM/F12 (Life Technologies #10565), 1x N2 (Life Technologies #17502–048), 1x B27-RA (Life Technologies #12587–010), 20 ng/ml FGF2 (Life Technologies), and 0.3 μg/mL puromycin) on Matrigel (Corning, #354230). NPCs at full confluence (1–1.5×10⁷ cells/well of a 6-well plate) were dissociated with Accutase (Innovative Cell Technologies) for 5 mins, spun down (5 mins X 1000g), resuspended and seeded onto Matrigel-coated plates at 3–5×10⁶ cells/well. Media was replaced every two days for four to seven days until next split.
At day −2, NPCs were seeded as 4–6×10⁵ cells/well in a 24-well plate coated with Matrigel (coverslips are put in a plate and coated with Matrigel for immunostaining). At day −1, cells were transduced with rtTA, pLV-TetO-hNGN2-eGFP-Neo and ATP6V1Ai gRNA or empty lentiguide-Hygro-mTagBFP2 (Addgene 99374) lentiviruses via spinfection. Medium was switched to non-viral medium 3 hours post-spinfection. At Day 0, 1 μg/ml dox was added to induce NGN2-expression. At Day 1, transduced hiPSC-NPCs were treated with corresponding antibiotics to the lentiviruses (300 ng/ml puromycin for dCas9-effectors-Puro, 1 mg/ml G-418 for hNGN2-eGFP-neo and 1 mg/ml HygroB for lentiguide-Hygro-mTagBFP2) in order to increase the purity of transduced NPCs. At day 3, NPC medium was switched to neuronal medium (Brainphys (Stemcell Technologies, #05790), 1x N2 (Life Technologies #17502–048), 1x B27-RA (Life Technologies #12587–010), 1 μg/ml Natural Mouse Laminin (Life Technologies), 20 ng/ml BDNF (Peprotech #450–02), 20 ng/ml GDNF (Peptrotech #450–10), 500 μg/ml Dibutyryl cyclic-AMP (Sigma #D0627), 200 nM L-ascorbic acid (Sigma #A0278)) including 1 μg/ml Dox, along with antibiotic withdrawal. 50% of the medium was replaced with fresh neuronal medium (lacking dox once every second day. At day 11, full medium change withdrew residual dox completely. At day 13, NGN2-neurons were treated with 200 nM Ara-C to reduce the proliferation of non-neuronal cells in the culture, followed by half medium change by day 17. At Day 17, Ara-C was completely withdrawn by full medium change, followed by half medium changes until the neurons were fixed or harvested around day 21–24.
Primary human astrocyte (pHA) co-culture
Commercially available pHAs (Sciencell, #1800; isolated from fetal female brain) were thawed onto a matrigel-coated 100 mm culture dish with commercial astrocyte medium (Sciencell, #1801). While their growing, the astrocytes were fed with fresh astrocyte medium for five days according to the company’s manual. Upon their confluence at 90%, astrocytes were detached by TrypLE™ (Thermo Fisher Scientific, #12605010), spun down (200g x 5 mins), resuspended with freezing medium (astrocyte medium supplemented with 10% DMSO) and banked in liquid nitrogen.
At day −2, pHAs were thawed and seeded onto the matrigel-coated 100 mm culture dish and cultured for five days. At day 3, cells were detached, spun down and resuspended with Brainphys basal medium supplemented with Antibiotic-Antimycotic (Anti/Anti; Thermo Fisher Scientific, #15240062) and 2% fetal bovine serum (FBS; Sigma, F4135). Then, cells were split as 1×10⁵ cells / well on a matrigel-coated coverslip. At day 5, pHAs were fed by full medium change with the Brainphys medium (2% FBS + Anti/Anti). At day 7, neurons were split on the pHAs with neuronal medium supplemented with 2% FBS.
Until day 7, NGN2-neurons, when co-cultured with pHAs, were prepared as described above. At day 7, NGN2-neurons were gently detached with Accutase, spun down (1000g × 5 mins) and resuspended in neuronal medium supplemented with 2% FBS. After counting cells with a hemacytometer, NGN2-neurons were seeded on astrocyte culture at different cell densities according to assays (4.5–6×10⁵ cells/coverslip for presynaptic ICC and 7.5–10×104 cells/well for MEA). Since day 9, the culture was fed by half medium change along with treatment with 2 μM Ara-C until the day of analysis.
We focused on the phenotypic analyses in 21-day-old NGN2-induced neurons because it is the earliest time point that we (Ho et al., 2016b; Schrode et al., 2019b) and others (Frega et al., 2017; Nehme et al., 2018; Zhang et al., 2013b) consistently observe spontaneous synaptic activity across donors. ATP6V1A is robustly expressed across developmental stage in the human brain (Fig. S15A) (Miller et al., 2014). Overexpression of NGN2 induces glutamatergic neurons with robust expression of glutamatergic genes and excitatory post-synaptic currents (EPSCs) by 21 days (Zhang et al., 2013b) across dozen of donors in our laboratory (Fig. 4). In hiPSC-derived NGN2-neurons, ATP6V1A expression is elevated within 14-days of neuronal induction and remains relatively stable thereafter (21, 28, and 35 days) tested (Fig. S15B) (Tian et al., 2019).
RNA sequencing data processing of ATP6V1A KD and Aβ-treated neurons
RNA Sequencing libraries were prepared using the Kapa Total RNA library prep kit. Paired-end sequencing reads (100bp) were generated on a NovaSeq platform. Raw reads were aligned to hg19 using STAR aligner (v2.5.2a) and gene-level expression were quantified by featureCounts (v1.6.3) based on Ensembl GRCh37.70 annotation model. Genes with over 1 count per million (CPM) in at least 1 sample were retained. After filtering, the raw read counts were normalized by the voom function in limma and differential expression was computed by the moderated t-test implemented in limma.
We examined the GO/pathways impacted by ATP6V1A deficit and/or Aβ treatment by employing the Gene Set Enrichment Analysis (GSEA) (Subramanian et al., 2005), a weighted enrichment test using all genes devoid of setting a hard threshold to select significant ones since there was a relatively small number of DEGs in KD-V vs WT-V passing the stringent multiple-test correction and no individual gene met the threshold for statistical significance between the Aβ-treated cells and the vehicle-treated cells. In these analyses, the t-test statistics from the differential expression contrast were used to rank genes in the GSEA. Permutations (up to 100,000 times) were used to assess the GSEA enrichment P value.
ATP6V1A KD and Aβ-treatment synergistic effect analysis from the RNA-seq data
The synergistic effect between ATP6V1A KD and Aβ-treatment was performed by limma’s linear model analysis with formula: Gene expression ~ Sample treatment. The coefficients, standard deviations and correlation matrix were calculated, using contrasts.fit, in terms of the comparisons of interest. Empirical Bayes moderation was applied using the eBayes function to obtain more precise estimates of gene-wise variability. P-values were adjusted for multiple hypotheses testing using false discovery rate (FDR) estimation, and differentially expressed genes were determined as those with an estimated FDR ≤ 5%, unless stated otherwise. Details about the synergistic effect analysis method were described in (Schrode et al., 2019a).
The expected additive effect was modeled through addition of the individual comparisons: (KD-V vs WT-V) + (WT-Aβ vs WT-V). The synergistic effect was modeled by subtraction of the additive effect from the combinatorial perturbation comparison: (KD-Aβ vs WT-V) - (KD-V vs WT-V) - (WT-Aβ vs WT-V). Fitting of this model for differential expression gives genes that show a difference in the differential expression computed for the additive model and that computed for the combinatorial perturbation. However, interpretation of the resulting DEGs depends on several factors, such as the direction of fold change (FC) in all three models. To identify genes of interest, namely those whose magnitude of change is larger in the combinatorial perturbation vs. the additive model, we categorized all genes by the direction of their change in both models and their log2(FC) in the synergistic model. First, log2(FC) standard errors (SE) were calculated for all samples. Genes were then grouped into ‘positive synergy’ if their FC was larger than SE and ‘negative synergy’ if smaller than -SE. If the corresponding additive model log2(FC) showed the same or no direction, the gene was classified as “more” differentially expressed in the combinatorial perturbation than predicted. 2925 genes were computed to be in this category (1152 more down, 1773 more up).
GSEA was performed on a curated subset of the MAGMA collection using the limma package camera function, which tests if genes are ranked highly in comparison to other genes in terms of differential expression, while accounting for inter-gene correlation. Due to the small sample size in this study and moderate fold changes in Aβ treatment, changes in gene expression may be small and distributed across many genes. However, similar to previous studies more powerful enrichment analyses in the limma package were used. These evaluate enrichment based on genes that are not necessarily genome-wide significant, and identify sets of genes for which the distribution of t-statistics differs from expectation. Over-representation analysis (ORA) was performed when subsets of DEGs were of interest, such as the synergistic ‘more up’ and ‘more down’ genes. The genes of interests were ranked by –log10 (p-value) and enrichment was performed against a background of all expressed genes using the WebGestaltR package.
Quantitative reverse transcription PCR (qRT-PCR) of ATP6V1A
Quantitative reverse transcription PCR (qRT-PCR) was performed as previously described (Ho et al, 2017). Specifically, cell cultures were harvested with Trizol and total RNA extraction was carried out following the manufacturer’s instructions. Quantitative transcript analysis was performed using a QuantStudio 7 Flex Real-Time PCR System with the Power SYBR Green RNA-to-Ct Real-Time qPCR Kit (all Thermo Fisher Scientific). Total RNA template (25 ng per reaction) was added to the PCR mix, including primers listed below. qPCR conditions were as follows; 48°C for 30 min, 95°C for 10 min followed by 40 cycles (95°C for 15 s, 60°C for 60 s). All qPCR data is collected from at least 3 independent biological replicates of one experiment.
Data analyses were performed using GraphPad PRISM 6 software.
| Gene_id | Primer_FWD | Primer_REV | Length |
|---|---|---|---|
| ATP6V1A | GAGATCCTGTACTTCGCACTG | GGGATGTAGATGCTTTGGGTC | 130 |
| β-Actin | TGTCCCCCAACTTGAGATGT | TGTGCACTTTTATTCAACTGGTC | 109 |
Preparation of cell lysates and western blotting
Cells were rinsed with ice-cold phosphate-buffered saline (PBS), pelleted, and lyzed in RIPA Lysis and Extraction Buffer (Thermo Fisher Scientific, #89900) containing Halt™ Protease and Phosphatase Inhibitor Cocktail (Thermo Fisher Scientific, #78440). Alternatively, MSBB BM36 brain samples were homogenized with similar methods. Samples were sonicated for 1 minute then centrifuged at 13,000× rpm for 10 min. The supernatant was collected, and total protein concentration was determined using Quick Start™ Bradford Protein Assay (Bio-Rad, 5000201) following the manufacturer’s instructions.
Western blotting was performed as previously described using antibodies listed in the table below. Images were captured and quantified using the Odyssey® Imaging Systems (LI-COR. Inc.).
| Item Name | Catalog | Species | WB | IF |
|---|---|---|---|---|
| ATP6V1A | ab199326 | Rabbit | 1:1000 | - |
| Homer 1 | 160 003 | Rabbit | 1:1000 | 1:200-500 |
| PSD-95 | clone K28/43 | Mouse IgG2 | 1:500 | 1:1000 |
| Synapsin 1 | 106 011 | Mouse | 1:1000 | 1:500 |
| Synaptophysin 1 | 101 002 | Rabbit | 1:2000 | 1:500 |
| VGLUT 1 | 135 303 | Rabbit | 1:2000 | 1:1000 |
| SOX1 | AF3369 | Goat | - | 1:100 |
| TUJ1 | 801202 | Mouse IgG2a | 1:1000 | 1:1000 |
Immunofluorescence and microscopy
NGN2-neurons (on coverslips) were washed with PBS and fixed with 4% paraformaldehyde (PFA) at pH 7.4 for 10 mins, room temperature. Then, fixative solution was replaced with PBS. After 3 times wash, NGN2-neurons were incubated with blocking solution (0.1% Tween-20, 0.5% bovine serum albumin in PBS) for 1 hour, room temperature. The blocking solution was aspirated and replaced with the same solution with primary antibodies listed above and incubated overnight at 4°C. Neurons were then incubated with secondary antibodies in blocking solution, for 1 hour at room temperature, followed by PBS-washing 3 times.
20 μL of AquaPolymount mounting solution (Polysciences Inc., #18606–20) per coverslip was placed onto each microscopic slide and the coverslips were gently mounted onto the slides with the neuron side facing down. Mounted coverslips were air-dried for two days at ambient temperature. For synaptic ICC imaging, images were acquired using a confocal microscope (LSM 780, Zeiss) with a 63× objective lens. These puncta analyses were assessed using NIH ImageJ. Total synapsin1 and homer1 puncta number per image were divided by that image’s respective MAP2-positive area in order to calculate synapsin1 and homer1 puncta counts normalized to MAP2 levels. Data from 3 independent experiments were analyzed using GraphPad PRISM 6 software.
β-Amyloid preparation and treatment
Human β-amyloid (1–42) peptide was purchased from GenScript (#RP10017, 1 mg; MW: 4514.1). 1 mg of lyophilized Aβ was completely dissolved in 221.5 μL of 1,1,1,3,3,3-Hexafluoro-2-propanol (Hexafluoroisopropanol, HFIP, Sigma, 52517–10ML). 10 μL of 1 mM Aβ-HFIP (0.045 mg) in 0.5 mL EP tube was dried overnight in the hood. Dried Aβ were centrifuged for 1 h at 1,000 × g, 4°C, and stored at −80°C. Before use, allow Aβ to come to room temperature. 5 mM Aβ-DMSO stock was prepared using 2 μL fresh dry Dimethyl sulfoxide (DMSO, Sigma, D5879) to 0.045 mg Aβ. Aβ-DMSO solution was sonicated for 10 min in a bath sonicator. 21-day isogenic pairs of ATP6V1A-manipulated NGN2-neurons were exposed to 5 μM Aβ for 24 hours and then used in qPCR, MEA assays, and RNA sequencing.
Multi-electrode array (MEA)
In order to evaluate electrical activity of NGN2-neurons by MEA, density-matched isogenic NGN2-neuronal populations, co-cultured with pHAs, were prepared as described above. Specifically, at day 3, pHAs were split as 17,000 cells/well in a Matrigel-coated 48W MEA plate (Axion Biosystems, M768-tMEA-48W) and maintained as above. At day 7, NGN2-neurons were detached, spun down and seeded on the pHA culture. Outer space of each well in the plate was filled up with autoclaved/deionized water to minimize the evaporation of marginal wells (“edge effect”) during long-term culture. Half volume of neuronal medium (supplemented with 2% FBS) was replaced with fresh medium including 200 nM Ara-C from day 9 until the end of MEA recording. Electrical activity of neurons was daily-recorded during day 14~24. On the recording day, the plate was loaded into the Axion Maestro MEA reader (Axion Biosystems). Recording was performed via AxiS 2.4 for 10 mins. Quantitative analysis of the recording was exported as a Microsoft excel sheet. Data were analyzed using GraphPad PRISM 6 software.
Electrophysiology
For whole-cell patch-clamp recordings, 1.0–1.5 × 10⁴ human astrocytes were first seeded onto Matrigel-coated 12-mm glass coverslips in 24-well plates, and then seeded with 1.0 × 10⁵ neurons after ~5 days. Neurons were recorded at 4–5 weeks following dox-induction, with media exchange every 3–4 days. Cells were visualized on a Nikon inverted microscope equipped with fluorescence and Hoffman optics. Neurons were recorded with an Axopatch 200B amplifier (Molecular Devices), digitized using a Digidata 1320a (Molecular Devices) and filtered between 1–10 kHz, using Clampex 10 software (Molecular Devices). Series resistance compensation was applied (70–100%). Patch pipettes were pulled from borosilicate glass electrodes (Warner Instruments) to a final tip resistance of 3–5M Ω using a vertical gravity puller (Narishige). Neurons were bathed in artificial cerebral spinal fluid (ACSF) containing (in mM): NaCl, 119, CaCl22; KCl, 2.5; MgCl2, 1.3; d-glucose, 11; NaHCO3, 26.2; NaPO4, 1, at a pH of 7.4. The internal patch solution contained (in mM): K-d-gluconate, 140; NaCl, 4; MgCl2, 2; EGTA, 1.1; HEPES, 5; Na2ATP, 2; sodium creatine phosphate, 5; Na3GTP, 0.6, at a pH of 7.4. Osmolarity was 290–295 mOsm. All chemicals were purchased from Sigma-Aldrich Co. (St. Louis, MO). Neurons were chosen at random using DIC or with BFP+ expression. Current-clamp recordings were used for measuring evoked (current injected to hyperpolarize to approx. −80 mV) activity. Spikelets were defined as small, outward spikes with a peak amplitude of less than 25 mV and occurred at voltages positive to threshold (~ −30 mV). In voltage-clamp recordings, voltage steps were applied from −80 mV to +50 mV (10 mV increments) to elicit voltage-gated ionic currents All recordings were made at room temperature (~22 C). Difference between sodium current densities at 0 mV were tested for statistical significance (P < .05) using a student’s t-test between control (n=18) and ATP6V1A KD neurons (n=17), pooling over two experimental replicates. Voltages are corrected for a junction potential of ~ −15 mV. Values are reported as mean ± SEM.
ATP6V1A orthologs in fly
According to the DIOPT (DRSC Integrative Ortholog Prediction Tool), Drosophila Vacuolar H+ ATPase 68kD subunit 1 (Vha68–1, CG12403) and Vha68–2 (CG3762) are the best orthologs of human ATP6V1A proteins (DIOPT score 13 for both genes). Vha68–1 and ATP6V1A exhibit 83% identity and 91% similarity in primary amino acid sequence, and have similar size (614 and 617 amino acids, respectively), while Vha68–2 and ATP6V1A exhibit 83% identity and 92% similarity in primary amino acid sequence with similar size (614 and 617 amino acids, respectively).
RNA extraction and quantitative real time PCR analysis
More than 25 flies for each genotype were collected and frozen. Heads were mechanically isolated, and total RNA was extracted using TRIzol Reagent (Thermo Fisher Scientific) according to the manufacturer’s protocol with an additional centrifugation step (16,000 x g for 10 min) to remove cuticle membranes prior to the addition of chloroform. Total RNA was reverse-transcribed using PrimeScript RT-PCR kit (TaKaRa Bio), and qRT-PCR was performed using Thunderbird SYBR qPCR Mix (Toyobo) on a CFX96 real time PCR detection system (Bio-Rad Laboratories). The average threshold cycle value was calculated from at least three replicates per sample. Expression of genes of interest was standardized relative to GAPDH1. Primer sequences used in this study are provided below.
| Fly | Human | Forward primer sequence (5’ to 3’) | Reverse primer sequence (5’ to 3’) |
|---|---|---|---|
| Gapdh | GAPDH1 | GACGAAATCAAGGCTAAGGTCG | AATGGGTGTCGCTGAAGAAGTC |
| Vha68-1* | ATP6V1A | ACTACGCACCAAGGTCAAGG | CTTTGCCACTTCCAGGGTCA |
| Vha68-1** | ATP6V1A | ACCTCTTTCCGTGGAACTTGG | GCAGTTGTGTTGACACCTTTGG |
| Vha68-2 | ATP6V1A | CAAATATGGACGTGTCTTCGC | CCGGATCTCCGACAGTTACG |
| Eaat1 | SLC1A2 | TGCTCTGTTCATCGCCCAAT | CGACGGCTATGATGAGGGAC |
| VGlut | SLC17A6-8 | TTCATCGCCTCCAAGTTCCC | GCTGGATAGGTAACGCCCTC |
| Atpα | ATP1A1-3 | ACATGGTGCCAGCCATTTCA | AAGCCGTTCTCAGCCATGAT |
| Lcch3 | GABRB1-3 | CCGAGACGTGTTCAACGACA | GGCTATGTCCGGTGCCATAA |
| Grd | GABRA1-6 | TTTGGCTACACAACGTCGGA | GGTCGTGGTGGATCCTTGTT |
| CG8916 | GABRA6 | TTGAGTCCAAGAGCGGTGTC | CGTTTGGGTGGTTCTCTCCA |
| Rdl | GABRP | TGGCTCAATCGCAATGCAAC | GACCGTGGCGTATTCCAGTA |
| CG12344 | GLRA2 | CGAGAGCTTCTCGTCGAACA | GAAGTATACGGTGAGGCGGG |
| GABA-B-R1 | GABBR1 | CTCAGGGCGATCGTATTGCT | GGTGCGTAGAACATGGGTGA |
| GABA-B-R2 | GABBR2 | TGGCGGGTGCATTCGATATT | TCTCGTGATGCAAGGGTTCC |
| GABA-B-R3 | GABBR2 | AATTCGCACAGCAATCTGCC | ACAGCTCAAAGAGTCCGAGC |
| Sh | KCNA1-7,10 | TGTCAGGTTCCTCGCATGTC | CTGACTGGCGCTTTTGGAAG |
| Shab | KCNB1,2 | CGTGCTCGCGTTTAGTGATG | TTCTGGTACTCGGCGCATTT |
| SK | KCNN1-3 | GGTTATCGAAAACGAACTGAGCA | CTTCCAAAGCATGGTAAGCTAC |
| para | KCNB1,2 | ACGAGGATGAAGGTCCACAAC | ACGACGTATCGGATTGAATGG |
| Nmdar2 | GRIN2A-D | GGCATCCCGGTTATCTCGTG | AGAACTGGTGCCACTTGTAGC |
Climbing assay
Approximately 25 male flies were placed in an empty plastic vial. The vial was then gently tapped to knock all of the flies to the bottom. The numbers of flies in the top, middle, or bottom thirds of the vial were pictured and scored after 10 seconds. The percentages of flies that stayed at the bottom were subjected to statistical analyses.
Histological analysis
Heads of male flies were fixed in 4% paraformaldehyde for 24 h at 4 °C and embedded in paraffin. Serial sections (6μm thickness) through the entire heads were prepared, stained with hematoxylin and eosin (Sigma-Aldrich), and examined by bright-field microscopy. Images of the sections were captured with AxioCam 105 color (Carl Zeiss). To score brain vacuolization, we performed microscopy of serial brain sections within the central neuropil regions and selected the images with the most severe vacuolization from each fly to score area of vacuolization. We selected a section with the most severe neurodegeneration in the same brain area from each individual fly and the area of vacuoles was measured using Image J (NIH). We repeated the experiments more than two times and two to three persons are independently involved in these tasks to avoid any bias.
Drug feeding in flies
Flies were fed with the food containing 10 μM or 50 μM NCH51 or vehicle (final concentration 0.02% dimethyl sulfoxide) from the day after eclosion. These food vials were changed every 3–4 days.
Western blotting analysis of fly models
Western blotting was performed as described previously (Ando et al., 2016). To detect human Aβ42, ten fly heads for each genotype were homogenized in Tris-Glycine SDS sample buffer, and the same amount of the lysate was loaded to 18% Tris-Glycine gels and transferred to nitrocellulose membrane. The membranes were boiled in PBS for 3 min, blocked with 5% nonfat dry milk, blotted with the anti-Aβ 6E10 antibody (Signet, Covance), incubated with appropriate secondary antibody and developed using ECL Western Blotting Detection Reagents (GE Healthcare Life Sciences). The membranes were also probed with anti-tubulin (Sigma-Aldrich) as the loading control in each experiment. To detect human tau, ten fly heads for each genotype were homogenized in Tris-Glycine SDS sample buffer, and the same amount of the lysate was loaded to each lane of 10% Tris-Glycine gels and transferred to nitrocellulose membrane. The membranes were blocked with 5% nonfat dry milk, blotted with the antibodies described below, incubated with appropriate secondary antibody and developed using ECL Prime Western Blotting Detection Reagent (GE Healthcare Life Sciences). The membranes were also probed with anti-Nervana and used as the loading control in each experiment. Anti-tau (Merck Millipore), antipSer202/pThr205 tau (Thermo Fisher Scientific), anti-Nervana (Developmental Studies Hybridoma Bank) antibodies were purchased. Imaging was performed with ImageQuant LAS 4000 (GE Healthcare Life Sciences), and the signal intensity was quantified using Image J (NIH).
QUANTIFICATION AND STATISTICAL ANALYSIS
The analytical approaches and software used for quantification were specified for each assay. All available brain tissues from MSBB were sent for sequencing analysis, without randomization process. For sample processing, clustering, differential expression and network analyses, all investigators were blinded to outcomes. The statistical test used and sample size n are indicated in the figure legends and the corresponding methods section. Statistical significance is defined as p < 0.05 (* = p < 0.05; ** = p < 0.01, *** = p < 0.001, **** = p < 0.0001).
Supplementary Material
Table S1 Demographics of the MSBB RNA-seq samples after quality control processing, Related to Figure 1 and STAR Methods.
Table S2 Differentailly expressed genes identified in all 4 brain regions with respect to different traits, Related to STAR Methods.
Table S3 Gene ontology and pathways enriched in differentailly expressed genes (DEGs), Related to STAR Methods.
Table S4 MEGENA coexpression modules identified from the present 4 brain regions, Related to Figure 2.
Table S5 Annotation of the MEGENA modules, Related to Figure 2.
Table S6 Details about the ranking of MEGENA modules in relation to AD pathology, Related to Figure 2.
Table S7 Overrepresentation of distinct neuronal subtype-enriched genes in the top ranked neuronal models, Related to Figure 2.
Table S8 Top ranked neuronal modules were preserved in HBTRC and ROSMAP data by overlap test, Related to STAR Methods.
Table S9 Cis-eGenes identified at a Bonferroni adjusted P value threshold of 0.05, Related to STAR Methods.
Table S10 Trans-eQTL hotspots, Related to STAR Methods.
Table S11 GO/pathways enriched for trans-eQTL hotspot targets, Related to STAR Methods.
Table S12 MEGENA network modules enriched for cis-eGenes, Related to STAR Methods.
Table S13 Enrichment of cis-eQTLs in AD GWAS, Related to STAR Methods.
Table S14 Neuronal module key drivers identified by Bayesian network and key driver analyses, Related to Figure 3 and STAR Methods.
Table S15 Network neighbhorhood characteristics for the 10 neuronal module key drivers which are also root nodes in the BM36-PHG BN, Related to Figure 3 and STAR Methods.
Table S16 RNA-seq analysis of gene expression change in ATP6V1A deficit neurons with or without Aβ challenge, Related to Figure 5.
Table S17 Summary of GSEA results of GO/pathway enrichment in perturbation profiles of hiPSC-derived neurons, Related to Figure 5.
Table S18 ATP6V1A KD and Aβ challenge profiles significantly enriched in the human postmortem brain AD signatures, Related to Figure 5.
Table S19 Summary of MEGENA coexpression network moduels enriched for ATP6V1A KD and Aβ challenge perturbation profiles, Related to Figure 5.
Table S20 Enrichment of ATP6V1A KD and Aβ challenge perturbation profiles in the subnetwork regulated by ATP6V1A on the BM36-PHG BN, Related to Figure 5.
Table S21 Top 25 drug compounds predicted by EMUDRA that can reverse the disease gene signature and increase ATP6V1A mRNA level, Related to Figure 6 and STAR Methods.
KEY RESOURCES TABLE.
| REAGENT or RESOURCE | SOURCE | IDENTIFIER |
|---|---|---|
| Antibodies | ||
| Recombinant Anti-ATP6V1A antibody | Abcam | Cat# ab199326, RRID:AB_2802119 |
| Anti-Homer 1 antibody | Synaptic Systems | Cat# 160 003, RRID:AB_887730 |
| PSD-95 antibody | Millipore | Cat# K28/43, RRID:AB_2315221 |
| Anti-Synapsin 1 antibody | Synaptic Systems | Cat# 106 011C3, RRID:AB_993029 |
| Anti-Synaptophysin 1 | Synaptic Systems | Cat# 101 002, RRID:AB_887905 |
| VGLUT 1 (vesicular glutamate transporter 1, BNPI, SLC17A7) antibody | Synaptic Systems | Cat# 135 303, RRID:AB_887875 |
| Goat Anti-Human Sox1 Polyclonal antibody | R and D Systems | Cat# AF3369, RRID:AB_2239879 |
| Purified anti-Tubulin beta 3 (TUBB3) antibody | BioLegend | Cat# 801202, RRID:AB_10063408 |
| Anti-β-amyloid, 1-16 antibody, clone 6E10 (mouse ascites) | Biolegend (Signet, Covance) | Cat# SIG-39300-1000; RRID: AB_662809 |
| Mouse monoclonal anti-α-tubulin antibody | Sigma-Aldrich | Cat# T9026; RRID: AB_477593 |
| Anti-Tau, clone Tau 12 antibody | Millipore | Cat# MAB2241; RRID: AB_ 1977340 |
| Phospho-Tau (Ser202, Thr205) monoclonal antibody (AT8) | Thermo Fisher Scientific | Cat# MN1020; RRID: AB_223647 |
| Mouse anti-Drosophila nervana protein monoclonal antibody | DSHB | Cat# Nrv5F7; RRID: AB_528395 |
| Sheep anti-mouse IgG, whole Ab ECL antibody, HRP conjugated | GE Healthcare | Cat# NA931; RRID: AB_772210 |
| Biological Samples | ||
| Human postmortem brain samples | Mount Sinai/JJ Peters VA Medical Center Brain Bank (MSBB) | https://icahn.mssm.edu/research/nih-brain-tissue-repository |
| Chemicals, Peptides, and Recombinant Proteins | ||
| PTACH [NCH51] | AdipoGen Life Sciences | Cat# AG-CR1-3667; CAS: 848354-66-5 |
| SAHA | MilliporeSigma | Cat# SML0061; CAS: 149647-78-9 |
| NCH-51 | MilliporeSigma | Cat# 382185; CAS: 848354-66-5 |
| MS-275 | MilliporeSigma | Cat# EPS002; CAS: 209783-80-2 |
| β-Amyloid (1-42) peptide, human | GenScript | Cat# RP10017 |
| Critical Commercial Assays | ||
| ECL Prime Western Blotting Detection Reagents | GE Healthcare | Cat# RPN2236 |
| Hematoxylin Solution, Mayer’s | Sigma-Aldrich | Cat# MHS16 |
| Eosin Y solution | Sigma-Aldrich | Cat# HT110132 |
| TRIzol Reagent | Thermo Fisher Scientific | Cat# 15596018 |
| PrimeScript RT reagent Kit with gDNA Eraser | Takara Bio | Cat# RR047A |
| Thunderbird SYBR qPCR Mix | Toyobo | Cat# QPS-201 |
| Power SYBR® Green RNA-to-CT™ 1-Step Kit | Thermo Fisher Scientific | Cat# 4389986 |
| Multi-electrode array (MEA) | Axion Biosystems | Cat# M768-MEA-48W |
| Deposited Data | ||
| Human brain bulk sequencing data | Wang et al 2018 | The Synapse open source platform (syn3159438) https://www.synapse.org/#!Synapse:syn3159438 |
| ATP6V1A knock-down RNA sequencing data | This paper | Gene expression omnibus (GEO): GSE128367 |
| Experimental Models: Cell Lines | ||
| Two stable human iPSC-derived neuronal progenitor cells (hiPSC-NPCs) expressing dCas9-KRAB (Addgene 99372) | Brennand Lab at Icahn School of Medicine at Mount Sinai | 553-S1-1 KRAB and 2607-1-4 KRAB |
| Human Astrocytes | Sciencell | Cat# 1800 |
| Experimental Models: Organisms/Strains | ||
| D. melanogaster: UAS-Aβ42 | Iijima et al 2004 | N/A |
| D. melanogaster: UAS-Tau | Sekiya et al 2017 | N/A |
| D. melanogaster: UAS-Luciferase RNAi | This paper | N/A |
| D. melanogaster: elav-GAL4 | Bloomington Drosophila Stock Center | BDSC: 458; FlyBase: FBst0000458 |
| D. melanogaster: GMR-GAL4 | Bloomington Drosophila Stock Center | BDSC: 1104; FlyBase: FBst0001104 |
| D. melanogaster: UAS-mcherry RNAi | Bloomington Drosophila Stock Center | BDSC: 35785; FlyBase: FBst0035785 |
| D. melanogaster: UAS-Vha68-1 RNAi | Bloomington Drosophila Stock Center | BDSC: 50726; FlyBase: FBst0050726 |
| D. melanogaster: UAS-Vha68-1 RNAi | Bloomington Drosophila Stock Center | BDSC: 42888; FlyBase: FBst0042888 |
| D. melanogaster: Vha68-11 | Bloomington Drosophila Stock Center | BDSC: 82466; FlyBase: FBst0082466 |
| D. melanogaster: UAS-Vha68-2 RNAi | Bloomington Drosophila Stock Center | BDSC: 34582; FlyBase: FBst0034582 |
| D. melanogaster: UAS-Vha68-1 RNAi | Vienna DrosophilaResource Center | VDRC: v46397; FlyBase: FBst0466673 |
| D. melanogaster: UAS-Vha68-2 RNAi | Vienna Drosophila Resource Center | VDRC: v110600; FlyBase: FBst0482165 |
| Oligonucleotides | ||
| qRT-PCR primers for D. melanogaster, see Table in STAR Methods | This paper | N/A |
| gRNA sequences to repress ATP6V1A expression, see Table in EXPERIMENTAL MODEL AND SUBJECT DETAILS | This paper | N/A |
| qRT-PCR primers for ATP6V1A and β-Actin, see Table in EXPERIMENTAL MODEL AND SUBJECT DETAILS | This paper | N/A |
| Recombinant DNA | ||
| lentiGuide-Hygro-mTagBFP2 | Ho et al., 2017 | Addgene Plasmid #99374 |
| lenti-EF1a-dCas9-KRAB-Puro | Ho et al., 2017 | Addgene Plasmid #99372 |
| pLV-TetO-hNGN2-eGFP-Neo | This paper | N/A |
| Software and Algorithms | ||
| R/limma (v3.38.3) | Bioconductor | https://www.bioconductor.org/packages/release/bioc/html/limma.html |
| STAR aligner (v2.5.2a) | Dobin et al., 2013 | https://github.com/alexdobin/STAR |
| featureCounts (v1.6.3) | Liao et al., 2014 | http://subread.sourceforge.net/ |
| MEGENA (v1.3.6) | Song and Zhang 2015 | https://cran.r-project.org/web/packages/MEGENA/index.html |
| SMR (v0.712) | Zhu et al., 2016 | https://cnsgenomics.com/software/smr/ |
| R/SuperExactTest (v1.0.6), | Wang et al., 2015 | https://cran.r-project.org/web/packages/SuperExactTest/index.html |
| R/NetWeaver (v0.0.5) | CRAN | https://cran.r-project.org/web/packages/NetWeaver/index.html |
| R/msigdb (v0.1.4) | github | https://github.com/mw201608/msigdb |
| R/MatrixEQTL (v2.2) | Shabalin et al., 2012 | https://cran.r-project.org/web/packages/MatrixEQTL/index.html |
| Prism7 | GraphPad | GraphPad.com |
| RIMBANET | https://icahn.mssm.edu/research/genomics/about/resources | |
| CRISPR-ERA web tool | Liu et al, 2015 | crispr-era.stanford.edu |
Highlights.
Development of gene network models of four cortical areas impacted by LOAD
Identification of region-specific molecular changes and gene subnetworks in LOAD
ATP6V1A is a top key regulator of a neuronal subnetwork most disrupted in LOAD
NCH-51 normalizes neuronal impairment & neurodegeneration caused by ATP6V1A deficit
ACKNOWLEDGEMENTS
We thank Ni-ka Ford and Dr. Gale Justin from the Instructional Technology Group at the Icahn School of Medicine at Mount Sinai for producing the illustration of Fig. 1. We thank the Bloomington Drosophila Stock Center and the Vienna Drosophila Resource Center for fly stocks. We thank Mette Peters and Nicole Kauer for setting up the data sharing page on the Synapse platform. This work was supported in part through the computational and data resources and staff expertise provided by Scientific Computing at the Icahn School of Medicine at Mount Sinai.
Funding: This work was supported in parts by grants from the National Institutes of Health (NIH)/National Institute on Aging (U01AG046170, RF1AG054014, RF1AG057440, R01AG057907, U01AG052411, R01AG062355, U01AG058635, R01AG068030), NIH/National Institute of Allergy and Infectious Diseases (U01AI111598), NIH/National Institute on Drug Abuse (R01DA043247), NIH/National Institute of Dental and Craniofacial Research (R03DE026814), NIH/National Institute of Diabetes and Digestive and Kidney Diseases (R01DK118243), Dept. of the Army (W81XWH-15–1-0706), Japan Society for the Promotion of Science KAKENHI (JP16K08637 to KI), and the Research Funding for Longevity Science from the National Center for Geriatrics and Gerontology, Japan (grant numbers 19–49 to MS and 19–7 to KI).
Footnotes
DECLARATION OF INTERESTS
The authors declare no competing interests.
SUPPLEMENTAL INFORMATION
Supplementary Information can be found online.
Publisher's Disclaimer: This is a PDF file of an unedited manuscript that has been accepted for publication. As a service to our customers we are providing this early version of the manuscript. The manuscript will undergo copyediting, typesetting, and review of the resulting proof before it is published in its final form. Please note that during the production process errors may be discovered which could affect the content, and all legal disclaimers that apply to the journal pertain.
REFERENCES
- Abbas YM, Wu D, Bueler SA, Robinson CV, and Rubinstein JL (2020). Structure of V-ATPase from the mammalian brain. Science 367, 1240–1246. [DOI] [PMC free article] [PubMed] [Google Scholar]
- Allen M, Carrasquillo MM, Funk C, Heavner BD, Zou F, Younkin CS, Burgess JD, Chai HS, Crook J, Eddy JA, et al. (2016). Human whole genome genotype and transcriptome data for Alzheimer’s and other neurodegenerative diseases. Scientific Data 3, 160089. [DOI] [PMC free article] [PubMed] [Google Scholar]
- Allen M, Wang X, Burgess JD, Watzlawik J, Serie DJ, Younkin CS, Nguyen T, Malphrus KG, Lincoln S, Carrasquillo MM, et al. (2018). Conserved brain myelination networks are altered in Alzheimer’s and other neurodegenerative diseases. Alzheimer’s & Dementia 14, 352–366. [DOI] [PMC free article] [PubMed] [Google Scholar]
- Ando K, Maruko-Otake A, Ohtake Y, Hayashishita M, Sekiya M, and Iijima KM (2016). Stabilization of Microtubule-Unbound Tau via Tau Phosphorylation at Ser262/356 by Par-1/MARK Contributes to Augmentation of AD-Related Phosphorylation and Aβ42-Induced Tau Toxicity. PLoS Genet 12, e1005917. [DOI] [PMC free article] [PubMed] [Google Scholar]
- Association A.s. (2018). 2018 Alzheimer’s disease facts and figures. Alzheimer’s & Dementia 14, 367–429. [Google Scholar]
- Avramopoulos D, Szymanski M, Wang R, and Bassett S (2011). Gene expression reveals overlap between normal aging and Alzheimer’s disease genes. Neurobiology of Aging 32, 2319.e2327–2319.e2334. [DOI] [PMC free article] [PubMed] [Google Scholar]
- Benjamini Y, and Hochberg Y (1995). Controlling the False Discovery Rate: A Practical and Powerful Approach to Multiple Testing. Journal of the Royal Statistical Society Series B (Methodological) 57, 289–300. [Google Scholar]
- Blalock EM, Geddes JW, Chen KC, Porter NM, Markesbery WR, and Landfield PW (2004). Incipient Alzheimer’s disease: Microarray correlation analyses reveal major transcriptional and tumor suppressor responses. Proceedings of the National Academy of Sciences of the United States of America 101, 2173–2178. [DOI] [PMC free article] [PubMed] [Google Scholar]
- Braak H, Alafuzoff I, Arzberger T, Kretzschmar H, and Del Tredici K (2006). Staging of Alzheimer disease-associated neurofibrillary pathology using paraffin sections and immunocytochemistry. Acta Neuropathol 112, 389–404. [DOI] [PMC free article] [PubMed] [Google Scholar]
- Braak H, and Braak E (1991). Neuropathological stageing of Alzheimer-related changes. Acta Neuropathol 82, 239–259. [DOI] [PubMed] [Google Scholar]
- Chung CY-S, Shin HR, Berdan CA, Ford B, Ward CC, Olzmann JA, Zoncu R, and Nomura DK (2019). Covalent targeting of the vacuolar H+-ATPase activates autophagy via mTORC1 inhibition. Nature Chemical Biology 15, 776–785. [DOI] [PMC free article] [PubMed] [Google Scholar]
- Cohain A, Divaraniya AA, Zhu K, Scarpa JR, Kasarskis A, Zhu J, Chang R, Dudley JT, and Schadt EE (2017). EXPLORING THE REPRODUCIBILITY OF PROBABILISTIC CAUSAL MOLECULAR NETWORK MODELS. Pacific Symposium on Biocomputing Pacific Symposium on Biocomputing 22, 120–131. [DOI] [PMC free article] [PubMed] [Google Scholar]
- Colangelo V, Schurr J, Ball MJ, Pelaez RP, Bazan NG, and Lukiw WJ (2002). Gene expression profiling of 12633 genes in Alzheimer hippocampal CA1: transcription and neurotrophic factor down-regulation and up-regulation of apoptotic and pro-inflammatory signaling. J Neurosci Res 70, 462–473. [DOI] [PubMed] [Google Scholar]
- De Jager PL, Ma Y, McCabe C, Xu J, Vardarajan BN, Felsky D, Klein H-U, White CC, Peters MA, Lodgson B, et al. (2018). A multi-omic atlas of the human frontal cortex for aging and Alzheimer’s disease research. Scientific Data 5, 180142. [DOI] [PMC free article] [PubMed] [Google Scholar]
- Deczkowska A, Keren-Shaul H, Weiner A, Colonna M, Schwartz M, and Amit I (2018). Disease-Associated Microglia: A Universal Immune Sensor of Neurodegeneration. Cell 173, 1073–1081. [DOI] [PubMed] [Google Scholar]
- Dooneief G, Marder K, Tang MX, and Stern Y (1996). The Clinical Dementia Rating scale: community-based validation of “profound’ and “terminal’ stages. Neurology 46, 1746–1749. [DOI] [PubMed] [Google Scholar]
- Egan MF, Kost J, Tariot PN, Aisen PS, Cummings JL, Vellas B, Sur C, Mukai Y, Voss T, Furtek C, et al. (2018). Randomized Trial of Verubecestat for Mild-to-Moderate Alzheimer’s Disease. New England Journal of Medicine 378, 1691–1703. [DOI] [PMC free article] [PubMed] [Google Scholar]
- Fassio A, Esposito A, Kato M, Saitsu H, Mei D, Marini C, Conti V, Nakashima M, Okamoto N, Olmez Turker A, et al. (2018). De novo mutations of the ATP6V1A gene cause developmental encephalopathy with epilepsy. Brain 141, 1703–1718. [DOI] [PMC free article] [PubMed] [Google Scholar]
- Forgac M (2007). Vacuolar ATPases: rotary proton pumps in physiology and pathophysiology. Nat Rev Mol Cell Biol 8, 917–929. [DOI] [PubMed] [Google Scholar]
- Fowler KD, Funt JM, Artyomov MN, Zeskind B, Kolitz SE, and Towfic F (2015). Leveraging existing data sets to generate new insights into Alzheimer’s disease biology in specific patient subsets. Scientific Reports 5, 14324. [DOI] [PMC free article] [PubMed] [Google Scholar]
- Frega M, van Gestel SH, Linda K, van der Raadt J, Keller J, Van Rhijn JR, Schubert D, Albers CA, and Nadif Kasri N (2017). Rapid Neuronal Differentiation of Induced Pluripotent Stem Cells for Measuring Network Activity on Micro-electrode Arrays. J Vis Exp. [DOI] [PMC free article] [PubMed] [Google Scholar]
- Gilbert LA, Horlbeck MA, Adamson B, Villalta JE, Chen Y, Whitehead EH, Guimaraes C, Panning B, Ploegh HL, Bassik MC, et al. (2014). Genome-Scale CRISPR-Mediated Control of Gene Repression and Activation. Cell 159, 647–661. [DOI] [PMC free article] [PubMed] [Google Scholar]
- Haroutunian V, Katsel P, and Schmeidler J (2009). Transcriptional vulnerability of brain regions in Alzheimer’s disease and dementia. Neurobiology of Aging 30, 561–573. [DOI] [PMC free article] [PubMed] [Google Scholar]
- Haure-Mirande J-V, Wang M, Audrain M, Fanutza T, Kim SH, Heja S, Readhead B, Dudley JT, Blitzer RD, Schadt EE, et al. (2019). Integrative approach to sporadic Alzheimer’s disease: deficiency of TYROBP in cerebral Aβ amyloidosis mouse normalizes clinical phenotype and complement subnetwork molecular pathology without reducing Aβ burden. Molecular Psychiatry 24, 431–446. [DOI] [PMC free article] [PubMed] [Google Scholar]
- Heyman A, Wilkinson WE, Hurwitz BJ, Helms MJ, Haynes CS, Utley CM, and Gwyther LP (1987). Early-onset Alzheimer’s disease: clinical predictors of institutionalization and death. Neurology 37, 980–984. [DOI] [PubMed] [Google Scholar]
- Ho S-M, Hartley BJ, Tcw J, Beaumont M, Stafford K, Slesinger PA, and Brennand KJ (2016a). Rapid Ngn2-induction of excitatory neurons from hiPSC-derived neural progenitor cells. Methods (San Diego, Calif) 101, 113–124. [DOI] [PMC free article] [PubMed] [Google Scholar]
- Ho SM, Hartley BJ, Flaherty E, Rajarajan P, Abdelaal R, Obiorah I, Barretto N, Muhammad H, Phatnani HP, Akbarian S, et al. (2017). Evaluating Synthetic Activation and Repression of Neuropsychiatric-Related Genes in hiPSC-Derived NPCs, Neurons, and Astrocytes. Stem Cell Reports 9, 615–628. [DOI] [PMC free article] [PubMed] [Google Scholar]
- Ho SM, Hartley BJ, Tcw J, Beaumont M, Stafford K, Slesinger PA, and Brennand KJ (2016b). Rapid Ngn2-induction of excitatory neurons from hiPSC-derived neural progenitor cells. Methods 101, 113–124. [DOI] [PMC free article] [PubMed] [Google Scholar]
- Hoffman GE, and Schadt EE (2016). variancePartition: interpreting drivers of variation in complex gene expression studies. BMC Bioinformatics 17, 483. [DOI] [PMC free article] [PubMed] [Google Scholar]
- Hoffmann A, Ziller M, and Spengler D (2018). Childhood-Onset Schizophrenia: Insights from Induced Pluripotent Stem Cells. Int J Mol Sci 19. [DOI] [PMC free article] [PubMed] [Google Scholar]
- Honig LS, Vellas B, Woodward M, Boada M, Bullock R, Borrie M, Hager K, Andreasen N, Scarpini E, Liu-Seifert H, et al. (2018). Trial of Solanezumab for Mild Dementia Due to Alzheimer’s Disease. New England Journal of Medicine 378, 321–330. [DOI] [PubMed] [Google Scholar]
- Horng JL, Lin LY, Huang CJ, Katoh F, Kaneko T, and Hwang PP (2007). Knockdown of V-ATPase subunit A (atp6v1a) impairs acid secretion and ion balance in zebrafish (Danio rerio). Am J Physiol Regul Integr Comp Physiol 292, R2068–2076. [DOI] [PubMed] [Google Scholar]
- Huan T, Zhang B, Wang Z, Joehanes R, Zhu J, Johnson AD, Ying S, Munson PJ, Raghavachari N, Wang R, et al. (2013). A systems biology framework identifies molecular underpinnings of coronary heart disease. Arterioscler Thromb Vasc Biol 33, 1427–1434. [DOI] [PMC free article] [PubMed] [Google Scholar]
- Iijima K, Liu HP, Chiang AS, Hearn SA, Konsolaki M, and Zhong Y (2004). Dissecting the pathological effects of human Abeta40 and Abeta42 in Drosophila: a potential model for Alzheimer’s disease. Proc Natl Acad Sci U S A 101, 6623–6628. [DOI] [PMC free article] [PubMed] [Google Scholar]
- Jansen IE, Savage JE, Watanabe K, Bryois J, Williams DM, Steinberg S, Sealock J, Karlsson IK, Hägg S, Athanasiu L, et al. (2019). Genome-wide meta-analysis identifies new loci and functional pathways influencing Alzheimer’s disease risk. Nature Genetics. [DOI] [PMC free article] [PubMed] [Google Scholar]
- Johnson ECB, Dammer EB, Duong DM, Ping L, Zhou M, Yin L, Higginbotham LA, Guajardo A, White B, Troncoso JC, et al. (2020). Large-scale proteomic analysis of Alzheimer’s disease brain and cerebrospinal fluid reveals early changes in energy metabolism associated with microglia and astrocyte activation. Nature Medicine 26, 769–780. [DOI] [PMC free article] [PubMed] [Google Scholar]
- Katsyv I, Wang M, Song WM, Zhou X, Zhao Y, Park S, Zhu J, Zhang B, and Irie HY (2016). EPRS is a critical regulator of cell proliferation and estrogen signaling in ER + breast cancer. Oncotarget 7, 69592–69605. [DOI] [PMC free article] [PubMed] [Google Scholar]
- Keenan AB, Jenkins SL, Jagodnik KM, Koplev S, He E, Torre D, Wang Z, Dohlman AB, Silverstein MC, Lachmann A, et al. (2018). The Library of Integrated Network-Based Cellular Signatures NIH Program: System-Level Cataloging of Human Cells Response to Perturbations. Cell systems 6, 13–24. [DOI] [PMC free article] [PubMed] [Google Scholar]
- Kim D, Hwang HY, Kim JY, Lee JY, Yoo JS, Marko-Varga G, and Kwon HJ (2017). FK506, an Immunosuppressive Drug, Induces Autophagy by Binding to the V-ATPase Catalytic Subunit A in Neuronal Cells. Journal of proteome research 16, 55–64. [DOI] [PubMed] [Google Scholar]
- Kuleshov MV, Jones MR, Rouillard AD, Fernandez NF, Duan Q, Wang Z, Koplev S, Jenkins SL, Jagodnik KM, Lachmann A, et al. (2016). Enrichr: a comprehensive gene set enrichment analysis web server 2016 update. Nucleic Acids Research 44, W90–W97. [DOI] [PMC free article] [PubMed] [Google Scholar]
- Kunkle BW, Grenier-Boley B, Sims R, Bis JC, Damotte V, Naj AC, Boland A, Vronskaya M, van der Lee SJ, Amlie-Wolf A, et al. (2019). Genetic meta-analysis of diagnosed Alzheimer’s disease identifies new risk loci and implicates Aβ, tau, immunity and lipid processing. Nature Genetics 51, 414–430. [DOI] [PMC free article] [PubMed] [Google Scholar]
- Kwakowsky A, Calvo-Flores Guzmán B, Pandya M, Turner C, Waldvogel HJ, and Faull RL (2018). GABAA receptor subunit expression changes in the human Alzheimer’s disease hippocampus, subiculum, entorhinal cortex and superior temporal gyrus. J Neurochem 145, 374–392. [DOI] [PubMed] [Google Scholar]
- Lake BB, Ai R, Kaeser GE, Salathia NS, Yung YC, Liu R, Wildberg A, Gao D, Fung H-L, Chen S, et al. (2016). Neuronal subtypes and diversity revealed by single-nucleus RNA sequencing of the human brain. Science 352, 1586–1590. [DOI] [PMC free article] [PubMed] [Google Scholar]
- Lambert J-C, Ibrahim-Verbaas CA, Harold D, Naj AC, Sims R, Bellenguez C, Jun G, DeStefano AL, Bis JC, Beecham GW, et al. (2013). Meta-analysis of 74,046 individuals identifies 11 new susceptibility loci for Alzheimer’s disease. Nat Genet 45, 1452–1458. [DOI] [PMC free article] [PubMed] [Google Scholar]
- Langfelder P, Luo R, Oldham MC, and Horvath S (2011). Is My Network Module Preserved and Reproducible? PLoS Comput Biol 7, e1001057. [DOI] [PMC free article] [PubMed] [Google Scholar]
- Law C, Chen Y, Shi W, and Smyth G (2014). voom: precision weights unlock linear model analysis tools for RNA-seq read counts. Genome Biology 15, R29. [DOI] [PMC free article] [PubMed] [Google Scholar]
- Legrand D, Pierce A, Elass E, Carpentier M, Mariller C, and Mazurier J (2008). Lactoferrin structure and functions. Advances in experimental medicine and biology 606, 163–194. [DOI] [PubMed] [Google Scholar]
- Liang WS, Dunckley T, Beach TG, Grover A, Mastroeni D, Ramsey K, Caselli RJ, Kukull WA, McKeel D, Morris JC, et al. (2008). Altered neuronal gene expression in brain regions differentially affected by Alzheimer’s disease: a reference data set. Physiol Genomics 33, 240–256. [DOI] [PMC free article] [PubMed] [Google Scholar]
- Liberzon A, Subramanian A, Pinchback R, Thorvaldsdóttir H, Tamayo P, and Mesirov JP (2011). Molecular signatures database (MSigDB) 3.0. Bioinformatics 27, 1739–1740. [DOI] [PMC free article] [PubMed] [Google Scholar]
- Limon A, Reyes-Ruiz JM, and Miledi R (2012). Loss of functional GABA(A) receptors in the Alzheimer diseased brain. Proceedings of the National Academy of Sciences of the United States of America 109, 10071–10076. [DOI] [PMC free article] [PubMed] [Google Scholar]
- Marioni RE, Harris SE, Zhang Q, McRae AF, Hagenaars SP, Hill WD, Davies G, Ritchie CW, Gale CR, Starr JM, et al. (2018). GWAS on family history of Alzheimer’s disease. Translational Psychiatry 8, 99. [DOI] [PMC free article] [PubMed] [Google Scholar]
- Mathys H, Davila-Velderrain J, Peng Z, Gao F, Mohammadi S, Young JZ, Menon M, He L, Abdurrob F, Jiang X, et al. (2019). Single-cell transcriptomic analysis of Alzheimer’s disease. Nature 570, 332–337. [DOI] [PMC free article] [PubMed] [Google Scholar]
- McKenzie AT, Wang M, Hauberg ME, Fullard JF, Kozlenkov A, Keenan A, Hurd YL, Dracheva S, Casaccia P, Roussos P, et al. (2018). Brain Cell Type Specific Gene Expression and Co-expression Network Architectures. Scientific reports 8, 8868. [DOI] [PMC free article] [PubMed] [Google Scholar]
- Mertens J, Reid D, Lau S, Kim Y, and Gage FH (2018). Aging in a Dish: iPSC-Derived and Directly Induced Neurons for Studying Brain Aging and Age-Related Neurodegenerative Diseases. Annu Rev Genet 52, 271–293. [DOI] [PMC free article] [PubMed] [Google Scholar]
- Miller JA, Ding S-L, Sunkin SM, Smith KA, Ng L, Szafer A, Ebbert A, Riley ZL, Royall JJ, Aiona K, et al. (2014). Transcriptional landscape of the prenatal human brain. Nature 508, 199–206. [DOI] [PMC free article] [PubMed] [Google Scholar]
- Miller JA, Woltjer RL, Goodenbour JM, Horvath S, and Geschwind DH (2013). Genes and pathways underlying regional and cell type changes in Alzheimer’s disease. Genome Medicine 5, 1–17. [DOI] [PMC free article] [PubMed] [Google Scholar]
- Millstein J, Zhang B, Zhu J, and Schadt EE (2009). Disentangling molecular relationships with a causal inference test. BMC Genetics 10, 23–23. [DOI] [PMC free article] [PubMed] [Google Scholar]
- Mirra SS, Heyman A, McKeel D, Sumi SM, Crain BJ, Brownlee LM, Vogel FS, Hughes JP, van Belle G, and Berg L (1991). The Consortium to Establish a Registry for Alzheimer’s Disease (CERAD). Part II. Standardization of the neuropathologic assessment of Alzheimer’s disease. Neurology 41, 479–486. [DOI] [PubMed] [Google Scholar]
- Morley M, Molony CM, Weber TM, Devlin JL, Ewens KG, Spielman RS, and Cheung VG (2004). Genetic analysis of genome-wide variation in human gene expression. Nature 430, 743. [DOI] [PMC free article] [PubMed] [Google Scholar]
- Morris JC (1993). The Clinical Dementia Rating (CDR): current version and scoring rules. Neurology 43, 2412–2414. [DOI] [PubMed] [Google Scholar]
- Mostafavi S, Gaiteri C, Sullivan SE, White CC, Tasaki S, Xu J, Taga M, Klein H-U, Patrick E, Komashko V, et al. (2018). A molecular network of the aging human brain provides insights into the pathology and cognitive decline of Alzheimer’s disease. Nature Neuroscience 21, 811–819. [DOI] [PMC free article] [PubMed] [Google Scholar]
- Murphy MP, and LeVine H 3rd (2010). Alzheimer’s disease and the amyloid-beta peptide. Journal of Alzheimer’s disease: JAD 19, 311–323. [DOI] [PMC free article] [PubMed] [Google Scholar]
- Nehme R, Zuccaro E, Ghosh SD, Li C, Sherwood JL, Pietilainen O, Barrett LE, Limone F, Worringer KA, Kommineni S, et al. (2018). Combining NGN2 Programming with Developmental Patterning Generates Human Excitatory Neurons with NMDAR-Mediated Synaptic Transmission. Cell Rep 23, 2509–2523. [DOI] [PMC free article] [PubMed] [Google Scholar]
- Ng B, White CC, Klein H-U, Sieberts SK, McCabe C, Patrick E, Xu J, Yu L, Gaiteri C, Bennett DA, et al. (2017). An xQTL map integrates the genetic architecture of the human brain’s transcriptome and epigenome. Nature Neuroscience 20, 1418. [DOI] [PMC free article] [PubMed] [Google Scholar]
- Ping L, Duong DM, Yin L, Gearing M, Lah JJ, Levey AI, and Seyfried NT (2018). Global quantitative analysis of the human brain proteome in Alzheimer’s and Parkinson’s Disease. Scientific Data 5, 180036. [DOI] [PMC free article] [PubMed] [Google Scholar]
- Pushpakom S, Iorio F, Eyers PA, Escott KJ, Hopper S, Wells A, Doig A, Guilliams T, Latimer J, McNamee C, et al. (2019). Drug repurposing: progress, challenges and recommendations. Nat Rev Drug Discov 18, 41–58. [DOI] [PubMed] [Google Scholar]
- Ridge PG, Mukherjee S, Crane PK, Kauwe JSK, and Alzheimer’s Disease Genetics C (2013). Alzheimer’s Disease: Analyzing the Missing Heritability. PLOS ONE 8, e79771. [DOI] [PMC free article] [PubMed] [Google Scholar]
- Robinson MD, McCarthy DJ, and Smyth GK (2010). edgeR: a Bioconductor package for differential expression analysis of digital gene expression data. Bioinformatics 26, 139–140. [DOI] [PMC free article] [PubMed] [Google Scholar]
- Satoh J. i., Yamamoto Y, Asahina N, Kitano S, and Kino Y (2014). RNA-Seq Data Mining: Downregulation of NeuroD6 Serves as a Possible Biomarker for Alzheimer’s Disease Brains. Disease Markers 2014, 10. [DOI] [PMC free article] [PubMed] [Google Scholar]
- Schadt EE, Lamb J, Yang X, Zhu J, Edwards S, Guhathakurta D, Sieberts SK, Monks S, Reitman M, Zhang C, et al. (2005a). An integrative genomics approach to infer causal associations between gene expression and disease. Nat Genet 37, 710–717. [DOI] [PMC free article] [PubMed] [Google Scholar]
- Schadt EE, Lamb J, Yang X, Zhu J, Edwards S, GuhaThakurta D, Sieberts SK, Monks S, Reitman M, Zhang C, et al. (2005b). An integrative genomics approach to infer causal associations between gene expression and disease. Nat Genet 37, 710–717. [DOI] [PMC free article] [PubMed] [Google Scholar]
- Schadt EE, Monks SA, Drake TA, Lusis AJ, Che N, Colinayo V, Ruff TG, Milligan SB, Lamb JR, Cavet G, et al. (2003). Genetics of gene expression surveyed in maize, mouse and man. Nature 422, 297. [DOI] [PubMed] [Google Scholar]
- Schrode N, Ho S-M, Yamamuro K, Dobbyn A, Huckins L, Matos MR, Cheng E, Deans PJM, Flaherty E, Barretto N, et al. (2019a). Synergistic effects of common schizophrenia risk variants. Nature Genetics. [DOI] [PMC free article] [PubMed] [Google Scholar]
- Schrode N, Ho SM, Yamamuro K, Dobbyn A, Huckins L, Matos MR, Cheng E, Deans PJM, Flaherty E, Barretto N, et al. (2019b). Synergistic effects of common schizophrenia risk variants. Nat Genet 51, 1475–1485. [DOI] [PMC free article] [PubMed] [Google Scholar]
- Sekiya M, Maruko-Otake A, Hearn S, Sakakibara Y, Fujisaki N, Suzuki E, Ando K, and Iijima KM (2017). EDEM Function in ERAD Protects against Chronic ER Proteinopathy and Age-Related Physiological Decline in Drosophila. Dev Cell 41, 652–664.e655. [DOI] [PMC free article] [PubMed] [Google Scholar]
- Shabalin AA (2012). Matrix eQTL: ultra fast eQTL analysis via large matrix operations. Bioinformatics 28, 1353–1358. [DOI] [PMC free article] [PubMed] [Google Scholar]
- Sigel E, and Steinmann ME (2012). Structure, Function, and Modulation of GABAA Receptors. Journal of Biological Chemistry 287, 40224–40231. [DOI] [PMC free article] [PubMed] [Google Scholar]
- Song W-M, and Zhang B (2015). Multiscale Embedded Gene Co-expression Network Analysis. PLoS Comput Biol 11, e1004574. [DOI] [PMC free article] [PubMed] [Google Scholar]
- Storey JD, and Tibshirani R (2003). Statistical significance for genomewide studies. Proceedings of the National Academy of Sciences 100, 9440–9445. [DOI] [PMC free article] [PubMed] [Google Scholar]
- Subramanian A, Narayan R, Corsello SM, Peck DD, Natoli TE, Lu X, Gould J, Davis JF, Tubelli AA, Asiedu JK, et al. (2017). A Next Generation Connectivity Map: L1000 Platform and the First 1,000,000 Profiles. Cell 171, 1437–1452.e1417. [DOI] [PMC free article] [PubMed] [Google Scholar]
- Subramanian A, Tamayo P, Mootha VK, Mukherjee S, Ebert BL, Gillette MA, Paulovich A, Pomeroy SL, Golub TR, Lander ES, et al. (2005). Gene set enrichment analysis: A knowledge-based approach for interpreting genome-wide expression profiles. Proceedings of the National Academy of Sciences of the United States of America 102, 15545–15550. [DOI] [PMC free article] [PubMed] [Google Scholar]
- Tian R, Gachechiladze MA, Ludwig CH, Laurie MT, Hong JY, Nathaniel D, Prabhu AV, Fernandopulle MS, Patel R, Abshari M, et al. (2019). CRISPR Interference-Based Platform for Multimodal Genetic Screens in Human iPSC-Derived Neurons. Neuron 104, 239–255.e212. [DOI] [PMC free article] [PubMed] [Google Scholar]
- Wang M, Beckmann ND, Roussos P, Wang E, Zhou X, Wang Q, Ming C, Neff R, Ma W, Fullard JF, et al. (2018). The Mount Sinai cohort of large-scale genomic, transcriptomic and proteomic data in Alzheimer’s disease. Scientific Data 5, 180185. [DOI] [PMC free article] [PubMed] [Google Scholar]
- Wang M, Roussos P, McKenzie A, Zhou X, Kajiwara Y, Brennand K, DeLuca GC, Crary JF, Casaccia P, Buxbaum J, et al. (2016). Integrative Network Analysis of Nineteen Brain Regions Identifies Molecular Signatures and Networks Underlying Selective Regional Vulnerability to Alzheimer’s Disease. Genome Medicine 8, 104. [DOI] [PMC free article] [PubMed] [Google Scholar]
- Webster JA, Gibbs JR, Clarke J, Ray M, Zhang W, Holmans P, Rohrer K, Zhao A, Marlowe L, Kaleem M, et al. (2009). Genetic Control of Human Brain Transcript Expression in Alzheimer Disease. The American Journal of Human Genetics 84, 445–458. [DOI] [PMC free article] [PubMed] [Google Scholar]
- Yang S, Liu Y, Jiang N, Chen J, Leach L, Luo Z, and Wang M (2014). Genome-wide eQTLs and heritability for gene expression traits in unrelated individuals. BMC genomics 15, 13. [DOI] [PMC free article] [PubMed] [Google Scholar]
- Zhang B, Gaiteri C, Bodea L-G, Wang Z, McElwee J, Podtelezhnikov Alexei A., Zhang C, Xie T, Tran L, Dobrin R, et al. (2013a). Integrated Systems Approach Identifies Genetic Nodes and Networks in Late-Onset Alzheimer’s Disease. Cell 153, 707–720. [DOI] [PMC free article] [PubMed] [Google Scholar]
- Zhang B, and Horvath S (2005). A general framework for weighted gene co-expression network analysis. Statistical applications in genetics and molecular biology 4, Article17. [DOI] [PubMed] [Google Scholar]
- Zhang B, and Zhu J (2013). Identification of key causal regulators in gene networks. Proceedings of the World Congress on Engineering II. [Google Scholar]
- Zhang Y, Pak C, Han Y, Ahlenius H, Zhang Z, Chanda S, Marro S, Patzke C, Acuna C, Covy J, et al. (2013b). Rapid single-step induction of functional neurons from human pluripotent stem cells. Neuron 78, 785–798. [DOI] [PMC free article] [PubMed] [Google Scholar]
- Zhao H, Wang J, and Wang T (2018). The V-ATPase V1 subunit A1 is required for rhodopsin anterograde trafficking in Drosophila. Mol Biol Cell 29, 1640–1651. [DOI] [PMC free article] [PubMed] [Google Scholar]
- Zhong Y, Wan Y-W, Pang K, Chow LML, and Liu Z (2013). Digital sorting of complex tissues for cell type-specific gene expression profiles. BMC Bioinformatics 14, 89–89. [DOI] [PMC free article] [PubMed] [Google Scholar]
- Zhou X, Wang M, Katsyv I, Irie H, and Zhang B (2018a). EMUDRA: Ensemble of Multiple Drug Repositioning Approaches to Improve Prediction Accuracy. Bioinformatics 34, 3151–3159. [DOI] [PMC free article] [PubMed] [Google Scholar]
- Zhou X, Wang M, Katsyv I, Irie H, and Zhang B (2018b). EMUDRA: Ensemble of Multiple Drug Repositioning Approaches to Improve Prediction Accuracy. Bioinformatics. [DOI] [PMC free article] [PubMed] [Google Scholar]
- Zhu J, Wiener MC, Zhang C, Fridman A, Minch E, Lum PY, Sachs JR, and Schadt EE (2007a). Increasing the Power to Detect Causal Associations by Combining Genotypic and Expression Data in Segregating Populations. PLOS Computational Biology 3, e69. [DOI] [PMC free article] [PubMed] [Google Scholar]
- Zhu J, Wiener MC, Zhang C, Fridman A, Minch E, Lum PY, Sachs JR, and Schadt EE (2007b). Increasing the Power to Detect Causal Associations by Combining Genotypic and Expression Data in Segregating Populations. PLoS Comput Biol 3, e69. [DOI] [PMC free article] [PubMed] [Google Scholar]
- Zhu J, Zhang B, Smith EN, Drees B, Brem RB, Kruglyak L, Bumgarner RE, and Schadt EE (2008). Integrating large-scale functional genomic data to dissect the complexity of yeast regulatory networks. Nat Genet 40, 854–861. [DOI] [PMC free article] [PubMed] [Google Scholar]
- Zhu Y, Paniccia A, Schulick AC, Chen W, Koenig MR, Byers JT, Yao S, Bevers S, and Edil BH (2016a). Identification of CD112R as a novel checkpoint for human T cells. The Journal of Experimental Medicine 213, 167–176. [DOI] [PMC free article] [PubMed] [Google Scholar]
- Zhu Z, Zhang F, Hu H, Bakshi A, Robinson MR, Powell JE, Montgomery GW, Goddard ME, Wray NR, Visscher PM, et al. (2016b). Integration of summary data from GWAS and eQTL studies predicts complex trait gene targets. Nature Genetics 48, 481. [DOI] [PubMed] [Google Scholar]
- Zoncu R, Bar-Peled L, Efeyan A, Wang S, Sancak Y, and Sabatini DM (2011). mTORC1 Senses Lysosomal Amino Acids Through an Inside-Out Mechanism That Requires the Vacuolar H+-ATPase. Science 334, 678–683. [DOI] [PMC free article] [PubMed] [Google Scholar]
Associated Data
This section collects any data citations, data availability statements, or supplementary materials included in this article.
Supplementary Materials
Table S1 Demographics of the MSBB RNA-seq samples after quality control processing, Related to Figure 1 and STAR Methods.
Table S2 Differentailly expressed genes identified in all 4 brain regions with respect to different traits, Related to STAR Methods.
Table S3 Gene ontology and pathways enriched in differentailly expressed genes (DEGs), Related to STAR Methods.
Table S4 MEGENA coexpression modules identified from the present 4 brain regions, Related to Figure 2.
Table S5 Annotation of the MEGENA modules, Related to Figure 2.
Table S6 Details about the ranking of MEGENA modules in relation to AD pathology, Related to Figure 2.
Table S7 Overrepresentation of distinct neuronal subtype-enriched genes in the top ranked neuronal models, Related to Figure 2.
Table S8 Top ranked neuronal modules were preserved in HBTRC and ROSMAP data by overlap test, Related to STAR Methods.
Table S9 Cis-eGenes identified at a Bonferroni adjusted P value threshold of 0.05, Related to STAR Methods.
Table S10 Trans-eQTL hotspots, Related to STAR Methods.
Table S11 GO/pathways enriched for trans-eQTL hotspot targets, Related to STAR Methods.
Table S12 MEGENA network modules enriched for cis-eGenes, Related to STAR Methods.
Table S13 Enrichment of cis-eQTLs in AD GWAS, Related to STAR Methods.
Table S14 Neuronal module key drivers identified by Bayesian network and key driver analyses, Related to Figure 3 and STAR Methods.
Table S15 Network neighbhorhood characteristics for the 10 neuronal module key drivers which are also root nodes in the BM36-PHG BN, Related to Figure 3 and STAR Methods.
Table S16 RNA-seq analysis of gene expression change in ATP6V1A deficit neurons with or without Aβ challenge, Related to Figure 5.
Table S17 Summary of GSEA results of GO/pathway enrichment in perturbation profiles of hiPSC-derived neurons, Related to Figure 5.
Table S18 ATP6V1A KD and Aβ challenge profiles significantly enriched in the human postmortem brain AD signatures, Related to Figure 5.
Table S19 Summary of MEGENA coexpression network moduels enriched for ATP6V1A KD and Aβ challenge perturbation profiles, Related to Figure 5.
Table S20 Enrichment of ATP6V1A KD and Aβ challenge perturbation profiles in the subnetwork regulated by ATP6V1A on the BM36-PHG BN, Related to Figure 5.
Table S21 Top 25 drug compounds predicted by EMUDRA that can reverse the disease gene signature and increase ATP6V1A mRNA level, Related to Figure 6 and STAR Methods.
Data Availability Statement
The human postmortem sequencing data are available via the AD Knowledge Portal (https://adknowledgeportal.synapse.org). The AD Knowledge Portal is a platform for accessing data, analyses, and tools generated by the Accelerating Medicines Partnership (AMP-AD) Target Discovery Program and other National Institute on Aging (NIA)-supported programs to enable open-science practices and accelerate translational learning. The data, analyses and tools are shared early in the research cycle without a publication embargo on secondary use. Data is available for general research use according to the following requirements for data access and data attribution (https://adknowledgeportal.synapse.org/DataAccess/Instructions).
For access to content described in this manuscript see: https://doi.org/10.7303/syn23519511