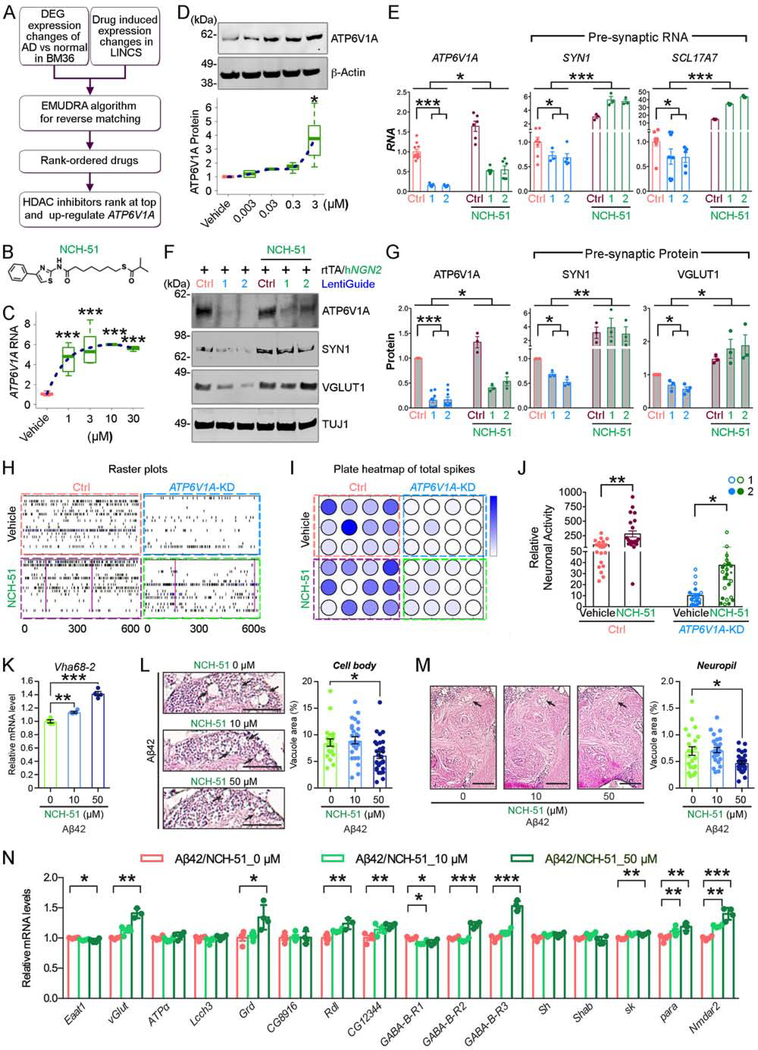
Fig. 6. A novel compound NCH-51 increases ATP6V1A expression and partially restores neuronal function.
A, The procedure for predicting compounds that could increase ATP6V1A expression and reverse transcriptomic signature of LOAD. B, Chemical structure of NCH-51. C, Effects of NCH-51 at 1, 3, 10, 30 μM on ATP6V1A mRNA level post 24-h exposure. D, Effects of NCH-51 at 0.003, 0.03, 0.3, 3 μM on ATP6V1A protein level post 48-h exposure. β-Actin is a loading control. A blue dotted line is curve fitted for the set of data points. E, mRNA expression of ATP6V1A and the presynaptic SYN1 and SCL17A7 in iNs in the absence and presence of 3 μM NCH-51. n = 3–12. F-G, Representative WB and quantitative analysis (n = 3–8) of ATP6V1A, SYN1, and VGLUT1 proteins. TUJ1 is a loading control. H-J, Multi-electrodes array after exposure to 3 μM NCH-51. H, Representative raster plots of the spike events over 10 minutes. I, plate map of total spike events; J, analysis of spike events (n = 24 wells). K, NCH-51 increased mRNA levels of Vha68–2 in Aβ42 flies. n = 4. L-M, NCH-51 suppressed neurodegeneration in both the cell body (L) and central neuropil regions (M) in 21-day-old Aβ42 fly brains. Scale bars: 200 μm. Percentages of vacuole areas (indicated by arrows) were analyzed. n = 22–28 hemispheres. N, NCH-51 increased mRNA levels of synaptic biology related genes in Aβ42 fly brains in a dose-dependent manner (n = 4). See also Fig. S24–26 & Table S21. (See Fig. 3 for statistical test and P value annotations).

