

Abstract
Background:
Multiple clinician-reported outcome measures exists for atopic dermatitis (AD) severity. However, there is no gold-standard for use in clinical practice.
Objectives:
Determine the measurement properties of the product of validated Investigator’s Global Assessment for AD (vIGA) and Body Surface Area (BSA) overall or divided into 6-categories (cBSA: 0%/0.1-<10%/10-<30%/30-<50%/50-<70%/70-<90%/90–100%) and compare with other clinician-reported and patient-reported outcomes in adults and children with AD.
Methods:
We performed a prospective dermatology practice-based study using questionnaires and evaluation by a dermatologist (n=653).
Results:
vIGA*BSA and vIGA*cBSA had good convergent validity with BSA (Spearman rho=0.97 and 0.93), eczema area and severity index (rho=0.94 and 0.92) and objective-SCORAD (rho=0.88 and 0.89); weak to good convergent validity with Numeric Rating Scale average-itch (rho=0.22 and 0.22) and worst-itch (rho=0.27 and 0.28), Patient-Oriented Eczema Measure (rho=0.44 and 0.43), Dermatology Life Quality Index (rho=0.48 and 0.49), ItchyQOL (rho=0.45 and 0.46), PROMIS Sleep Disturbance (rho=0.46 and 0.37) and Sleep related-impairment (rho=0.31 and 0.31) in adults and/or children; very good discriminant validity for physician-reported global AD severity; good responsiveness to change of severity of AD and itch; good reliability (intraclass correlation coefficient [95% confidence interval]: 0.72 [0.60–0.81] and 0.74 [0.62–0.82]); with no floor or ceiling effects. Thresholds for interpretability bands and clinically important difference were established.
Conclusions:
vIGA*BSA and vIGA*cBSA scores showed good convergent and discriminant validity, reliability, responsiveness and interpretability in adults and children with AD, and were feasible for use in clinical practice. vIGA*BSA and vIGA*cBSA had slightly lower convergent validity than EASI or objective-SCORAD, but might be more efficient to collect and score.
Keywords: atopic dermatitis, eczema, severity, clinician-reported outcome, quality of life, burden, itch, pruritus
Introduction
Atopic dermatitis (AD) is a complex disease with variable morphology and intensity of lesions, including erythema, edema/papulation, excoriation, lichenification, and xerosis, as well variable body surface area and distribution of lesions1. There are numerous clinician-reported outcome measures for AD severity, each encompassing different aspects of lesional morphology and/or extent.
Eczema Area and Severity Index (EASI) is a complex measure that assesses a weighted average of the severity of four different signs (erythema, edema/papulation, excoriation, lichenification) and extent of lesions separately for four different body regions (head/neck, upper extremities, trunk, lower extremities)2. EASI was previously found to be valid and was recommended by the Harmonizing Outcome Measures in Eczema (HOME) international consensus group to assess AD signs in clinical trials3. Scoring AD (SCORAD) is another well-established clinician-reported outcome measure of AD severity4, 5. SCORAD is also complex and assesses six different signs (erythema, edema/papulation, excoriation, oozing/crusting, lichenification xerosis), Body Surface Area (BSA) of lesions, and visual analog scales for itch or sleep loss in the past 3 days. SCORAD was also found to be valid for assessing AD severity2, 5, 6 and is used to classify AD severity in the European consensus guidelines for AD7.
Despite the widespread use of EASI and SCORAD in clinical trials of AD, their use in clinical practice may be limited by long completion times (28 to 69 minutes for EASI and 310 to 10 minutes for SCORAD), complicated scoring algorithms, variable interrater and/or intrarater reliability there is inter-observer variability6, 11, 12. As such, there is an unmet need for simple, feasible, and reliable clinician-reported outcomes of AD severity for use in clinical practice.
Investigator Global Assessments (IGA) are routinely used in clinical trials of AD based on regulatory requirements by the United States Food and Drug Administration. Many different IGA assessments have been used in AD trials, each examining different combinations of lesional morphology and descriptors for investigators13. A major strength of IGA assessments is that they are simple and quite feasible for use in clinical practice. However, IGA assessments principally assess lesional severity, but importantly do not assess lesional extent as measured in EASI and SCORAD. BSA is an important aspect of AD severity. However, BSA by itself does not differentiate between lesional severity. The product of a 5-point IGA and BSA (IGA*BSA) has been found to be a feasible and valid measure of disease activity in psoriasis14. However, little is known about the validity of IGA*BSA in AD.
In this study, we sought to evaluate the concurrent, convergent, and discriminant validity, floor and ceiling effects, interpretability, responsiveness, test-retest reliability and meaningful change threshold for IGA*BSA in adults and children with AD. In addition, we sought to compare the measurement properties of IGA*BSA with BSA, EASI, and the objective component of SCORAD.
Methods
Study design
A real-world, dermatology practice-based study of children and adults was performed with AD as defined by the Hanifin-Rajka diagnostic criteria15. Patients were serially recruited from the eczema clinic at an urban academic medical center between June, 2018 and September, 2019. Exclusion criteria included those without a definite diagnosis of AD or being unwilling or unable to complete assessments. Patients received standard of care follow-up and treatment, including emollients, prescription topical, systemic and/or phototherapy, where appropriate. No patients dropped out of the study. Since this was a real-world study, patients were seen at different follow-up intervals and not all patients had a follow-up encounter.
Self-administered questionnaires were completed by patients of the eczema clinic at an academic medical center prior to their encounter. Questionnaires included patient-reported severity of AD (“Would you describe your atopic dermatitis or eczema as clear, almost clear, mild, moderate, or severe?”)16, Numerical Rating Scale (NRS) for worst-itch and average-itch in the past 7 days (1 question each, range 0–10), Patient Oriented Eczema Measure (POEM) (7 questions, range: 0–28)17–20, Dermatology Life Quality Index (DLQI) (10 questions, range: 0–30, for age ≥17 years)21, 22, ItchyQOL (22 questions, mean score range: 0.0–5.0)22, 23, PROMIS sleep disturbance (SD) and sleep related-impairment (SRI) 8-item SF16, 24–27.
Patients were assessed with full body skin examination by a dermatologist (JS). Validated Investigator Global Assessment scale for Atopic Dermatitis (vIGA-AD™; range: 0=clear, 1=almost clear, 2=mild, 3=moderate, 4=severe)28, Body surface area (BSA; range: 0–100%), Eczema Area and Severity Index (EASI; 4 signs [erythema, excoriation, swelling, lichenification] on 4 body sites, range: 0–72)29 and objective component of the Scoring AD (objective-SCORAD; 6 signs [erythema, excoriation, swelling, oozing/crusting, lichenification, dryness] on 8 body sites, no symptoms; range: 0–83)4 were the clinically reported outcomes (ClinROs) examined. vIGA*BSA (range: 0–400) was calculated as the product of vIGA-AD and BSA. vIGA*cBSA was calculated as the procuct of vIGA0AD and BSA divided into categories (0=0%, 1=0.1-<10%, 2=10-<30%, 3=30-<50%, 4=50-<70%, 5=70-<90%, 6=90–100%) (range: 0–24).
The study was approved by the institutional review boards of Northwestern University. Informed consent was obtained electronically.
Statistical analysis
Summary statistics were estimated for baseline population characteristics. Concurrent validity of scores for vIGA*BSA, vIGA*cBSA was established using Spearman correlations with each other. Convergent validity was established using Spearman correlations of vIGA*BSA and vIGA*cBSA with BSA, EASI, objective-SCORAD, NRS worst-itch and average-itch, POEM, DLQI, ItchyQOL, PROMIS SD and SRI. Correlation coefficients scores of ≥0.70 or ≤-0.70 were considered strong, 0.40–0.69 or -0.69–-0.40 moderate, 0.10–0.39 or -0.39–-0.10 weak30..
Criterion validity was determined using Kruskal-Wallis test. There is no gold-standard assessment for AD severity. Thus, we compared vIGA*BSA, vIGA*cBSA, EASI, SCORAD, objective-SCORAD or BSA with self- and physician-reported global AD severity to examine criterion validity. We hypothesized that there would be significant and stepwise differences of itch assessments with each level of AD severity. Discriminant construct validity of vIGA*BSA, vIGA*cBSA, BSA, EASI and objective-SCORAD were established using logistic regression models with either self-reported and physician-reported global AD severity as the ordinal dependent variables31. The independent variables were vIGA*BSA, vIGA*cBSA, BSA, EASI, and objective-SCORAD. Discriminant validity was determined using area under the curve (AUC). AUC scores ≥0.90 were considered excellent, 0.80–0.89 good, 0.70–0.79 fair, <0.70 poor and <0.60 fail32. Ordinal logistic regression was used because the data met the proportional odds assumption (Score test, P<0.01).
Responsiveness of scores was determined using Spearman correlations between change from baseline and follow-up visit for vIGA*BSA, vIGA*cBSA, BSA, EASI, SCORAD, objective-SCORAD or BSA with change of each other and other PROs (NRS average-itch, NRS worst-itch, POEM, DLQI, ItchyQOL, PROMIS SD and SRI). We hypothesized that the changes of vIGA*BSA, vIGA*cBSA, BSA, EASI, or objective-SCORAD would have moderate correlations with each other, weaker correlations with changes in other PROs of AD severity.
Floor or ceiling effects arises when an assessment has a lower or upper limit to the values it can reliably measure. Floor or ceiling effects of total scores were considered present if 15% of responses fell in the lowest or highest scores33, 34.
Logistic regression models were constructed with physician-reported global AD severity as the binary dependent variable (almost clear vs. mild, mild vs. almost clear, moderate vs. mild, severe vs. moderate). Models were also constructed with EASI as the dependent variable using previously established severity strata (0=clear, 0.1–1.0=almost clear, 1.1–7.0=mild, 7.1–21.0=moderate, 21.1–72.0=severe)35. The independent variables were vIGA*BSA or vIGA*cBSA. Receiver operating characteristic (ROC) curves were employed to determine optimal thresholds between severity groups. Separate ROC curves were developed for each severity cut point. Optimal thresholds for each ROC curve were determined using the maximum conditional probability function c, which is equal to the product of sensitivity and specificity. Sensitivity and specificity are the probabilities of correctly being assigned and not being assigned to a particular severity group, respectively. A previous simulation study showed that the concordance probability method outperformed other commonly used methods36.
Test-retest reliability was assessed by intraclass correlation coefficient (ICC) and 95% CI, using a mixed-effects model for absolute agreement among patients with no change of patient-reported global AD severity between the baseline and follow-up visits. ICC <0.50 were considered poor, 0.50–0.74 moderate, 0.75–0.89 good, ≥0.90 excellent37.
The above statistical analyses were performed in SAS version 9.4.3 (SAS Institute, Cary, IN). Complete case analysis was performed, i.e. missing values were excluded. A two-sided P-value of 0.05 was considered statistically significant. No formal power calculation was performed. However, a sample size of >100 participants per analysis has been recommended as sufficient for validation studies38.
Results
Patient characteristics
Overall, 653 patients (ages 8.8–96.8 years) with AD were assessed, including 367 females (56.2%), 86 (13.2%) children and 567 (86.8%) adults, 362 self-reported Caucasians/whites (55.4%), with a mean±std. dev. age at enrollment was 42.6±19.3 years. Six hundred and fifty-one patients were assessed at follow-up (mean±std. dev. time to follow-up: 4.3±5.9 months). Baseline characteristics of AD severity are presented in Supplemental Table 1.
Concurrent and convergent validity
At baseline, vIGA*BSA and vIGA*cBSA showed strong correlations with each other, as well as vIGA-AD (rho=0.76 and 0.83), BSA (rho=0.97 and 0.93), EASI (rho=0.94 and 0.92), and objective-SCORAD (rho=0.88 and 0.89) (Fig 1). Similar results were found in separate analyses of adults and children.
Fig 1.
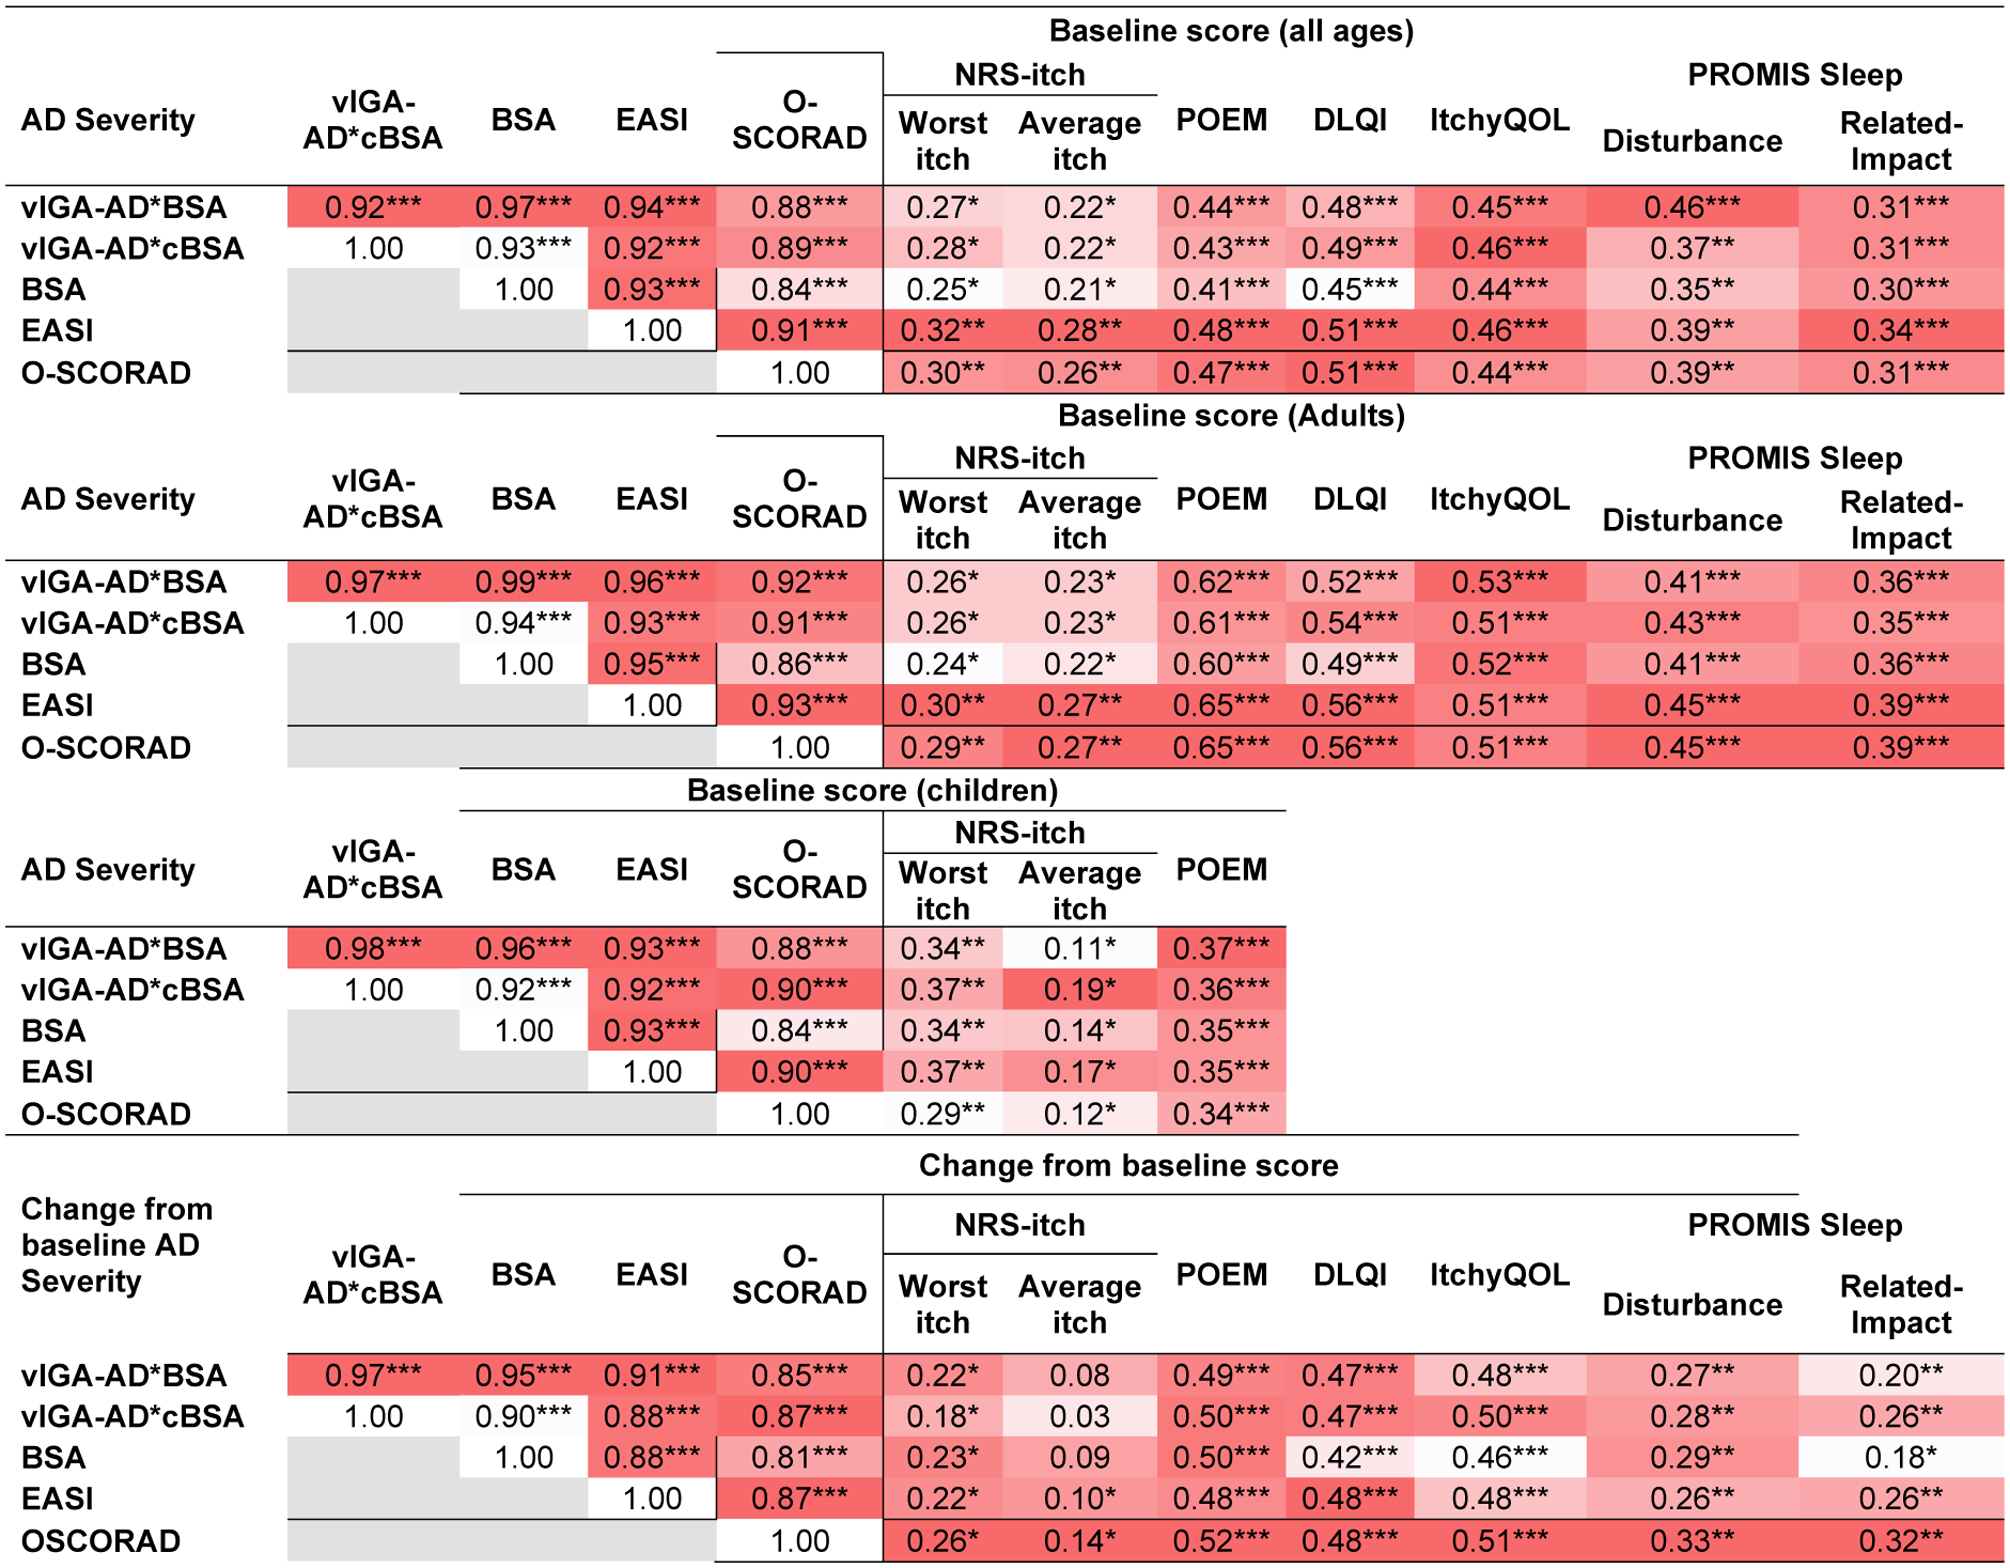
Spearman correlations were performed that compared baseline scores of vIGA*BSA, vIGA*cBSA, BSA, EASI, and objective-SCORAD with each other, and patient-reported severity assessments for atopic dermatitis, itch and quality of life. Results are presented overall, and separately in children and adults. Spearman correlations were also performed that compared changes of scores from baseline at follow-up for vIGA*BSA, vIGA*cBSA, BSA, EASI, and objective-SCORAD with each other, and changes of patient-reported severity assessments for atopic dermatitis, itch and quality of life. Values are presented using a color-gradient from dark red (highest) to white (lowest).
* P<0.05, ** P<0.01, *** P<0.0001
vIGA*BSA and vIGA*cBSA showed weak to moderate correlations with NRS worst-itch (rho=0.27 and 0.28) and average-itch (rho=0.22 and 0.22), POEM (rho=0.44 and 0.43), DLQI (rho=0.48 and 0.49), ItchyQOL (rho=0.45 and 0.46), and PROMIS SD (rho=0.46 and 0.37) and PROMIS SRI (rho=0.31 and 0.31). BSA, EASI, and objective-SCORAD were similarly correlated with these PROs. Similar results were found in separate analyses of adults and children.
Compared to EASI, vIGA*BSA and vIGA*cBSA had no significant differences of correlations with NRS worst-itch, NRS average-itch, POEM, DLQI, ItchyQOL, PROMIS SD and SRI (P≥0.34 for all).
Discriminative validity
There were significant and stepwise increases of vIGA*BSA and vIGA*cBSA, as well as vIGA-AD, BSA, EASI and objective-SCORAD scores at each level of patient-reported and physician-reported global severity (Wilcoxon rank sum test; P<0.0001).
The area under the curve for vIGA*BSA and vIGA*cBSA, BSA, EASI and objective-SCORAD were similar, and good to excellent for distinguishing between levels of physician-reported global AD severity (Table 1). vIGA-AD alone was only fair at distinguishing between levels of physician-reported global AD severity.
Table 1.
Area under the ROC curve for vIGA-AD, BSA, vIGA*BSA, vIGA*cBSA, EASI, objective-SCORAD as predictors of patient-reported and physician-reported global AD severity in adults and children.
| Severity assessment | vIGA-AD | BSA | vIGA*BSA | vIGA*cBSA | EASI | objective-SCORAD |
|---|---|---|---|---|---|---|
| Patient-reported global AD Severity | n=563 | n=563 | n=563 | n=563 | n=557 | n=563 |
| Multi-level AUC | 0.62 | 0.66 | 0.67 | 0.66 | 0.68 | 0.67 |
| Clear/almost clear vs. mild | 0.50 | 0.50 | 0.50 | 0.50 | 0.50 | 0.50 |
| Clear/almost clear vs. moderate | 0.53 | 0.66 | 0.65 | 0.62 | 0.68 | 0.62 |
| Clear/almost clear vs. severe | 0.69 | 0.73 | 0.74 | 0.72 | 0.72 | 0.73 |
| Mild vs. moderate | 0.65 | 0.64 | 0.64 | 0.64 | 0.68 | 0.69 |
| Mild vs. severe | 0.79 | 0.79 | 0.81 | 0.81 | 0.82 | 0.84 |
| Moderate vs. severe | 0.55 | 0.65 | 0.66 | 0.66 | 0.66 | 0.66 |
| Physician-reported global AD severity | n=609 | n=609 | n=609 | n=609 | n=606 | n=609 |
| Multi-level AUC | 0.78 | 0.89 | 0.90 | 0.89 | 0.92 | 0.89 |
| Clear/almost clear vs. mild | 0.62 | 0.75 | 0.75 | 0.70 | 0.80 | 0.76 |
| Clear/almost clear vs. moderate | 0.89 | 0.95 | 0.96 | 0.97 | 0.99 | 0.98 |
| Clear/almost clear vs. severe | 0.95 | 1.00 | 1.00 | 0.99 | 1.00 | 0.99 |
| Mild vs moderate | 0.71 | 0.86 | 0.88 | 0.88 | 0.91 | 0.81 |
| Mild vs severe | 0.86 | 0.97 | 0.98 | 0.98 | 0.97 | 0.96 |
| Moderate vs severe | 0.64 | 0.79 | 0.83 | 0.83 | 0.88 | 0.84 |
Likewise, the area under the curve for vIGA*BSA and vIGA*cBSA, vIGA-AD, BSA, EASI and objective-SCORAD were similar, but poor for distinguishing between levels of patient-reported global AD severity (Table 1).
None of the scores were good at discriminating between one-grade differences of patient-reported or physician-reported global AD severity. Similar results were found in separate analyses of adults and children (Supplemental Table 2).
Floor or ceiling effects
The proportions of patients with lowest/highest scores for vIGA*BSA and vIGA*cBSA, vIGA-AD, BSA, EASI and objective-SCORAD (8.1%/1.1%, 8.1%/3.5%, 8.1%/13.3%, 6.6%/1.5%, 6.6%/0.0%, and 4.9%/0.2%, respectively) were all below 15%, indicating there were no floor- or ceiling-effects.
Interpretability
Severity thresholds were selected based on maximizing the concordance probability in ROC analysis. Using physician-reported global AD severity as the anchor, the optimal thresholds for vIGA*BSA were 0.03 for almost clear, 2.5 for mild AD, 31.5 for moderate AD, 118.5 for severe AD (Table 2). These thresholds had substantially higher concordance with PGA (weighted kappa=0.682, P<0.0001) compared to previously reported thresholds (weighted kappa=0.335, P<0.0001).
Table 2.
Optimal cut-points and their sensitivity and specificity for vIGA*BSA and vIGA*cBSA as predictors of patient-reported global severity of AD.
| Physician-reported global severity (n=609) | vIGA*BSA | vIGA*cBSA | ||||
|---|---|---|---|---|---|---|
| Threshold | Sensitivity | Specificity | Threshold | Sensitivity | Specificity | |
| Almost clear vs. clear | 0.03 | 100% | 38% | 1.0 | 100% | 63% |
| Mild vs. almost clear | 2.5 | 77% | 82% | 3.0 | 53% | 53% |
| Moderate vs. mild | 31.5 | 87% | 85% | 6.0 | 79% | 88% |
| Severe vs. moderate | 118.5 | 79% | 82% | 10.0 | 74% | 88% |
| Eczema Area and Severity Index (n=636) | ||||||
| Threshold | Sensitivity | Specificity | Threshold | Sensitivity | Specificity | |
| Almost clear vs. clear | 0.1 | 88% | 98% | 1.0 | 88% | 98% |
| Mild vs. almost clear | 3.2 | 82% | 85% | 3.0 | 66% | 82% |
| Moderate vs. mild | 39.0 | 91% | 86% | 6.0 | 92% | 85% |
| Severe vs. moderate | 142.7 | 95% | 83% | 10.0 | 94% | 82% |
Whereas, using EASI divided into severity groups based on previously established severity strata35, the optimal thresholds for vIGA*BSA were somewhat higher for all severity groups (Table 2). These thresholds had substantially higher concordance with EASI (weighted kappa=0.807, P<0.0001) compared to previously reported thresholds (weighted kappa=0.779, P<0.0001).
Using physician-reported global AD severity or EASI as the anchor, the optimal thresholds for vIGA*cBSA were 1.0 for almost clear, 3.0 for mild AD, 6.0 for moderate AD, 10.0 for severe AD. These thresholds had good concordance with PGA (weighted kappa=0.628, P<0.0001) and EASI (weighted kappa=0.791, P<0.0001).
Responsiveness
Changes at follow-up from baseline in vIGA*BSA and vIGA*cBSA were moderately to strongly correlated with changes of vIGA-AD, BSA, EASI and objective-SCORAD, but only weakly correlated with changes in NRS average-itch and worst-itch, POEM, DLQI, ItchyQOL, PROMIS SD and SRI. Similarly, changes in BSA, vIGA-AD, BSA, EASI and objective-SCORAD were weakly to moderately correlated with changes in the aforementioned PROs.
Meaningful change
Across all ages, the threshold for MCID for vIGA*BSA (-58.3 to -86.5) and vIGA*cBSA (-3.8 to -5.7) varied by the anchor used (Table 3). The thresholds for MCID were lower in mild-moderate vs. severe baseline scores for all outcomes.
Table 3.
Thresholds for meaningful change for vIGA*BSA and vIGA*cBSA scores at follow-up from baseline.
| Anchor | Threshold | |
|---|---|---|
| 1-point improvement of PtGA (n=47) |
1-point improvement of PGA (n=59) |
|
| Severity assessment | ||
| All severities | ||
| vIGA*BSA | −58.3 | −86.5 |
| vIGA*cBSA | −3.8 | −5.7 |
| Mild-moderate baseline | ||
| vIGA*BSA | −19.4 | −50.3 |
| vIGA*cBSA | −1.8 | −3.9 |
| Severe baseline | ||
| vIGA*BSA | −107.7 | −143.1 |
| vIGA*cBSA | −6.4 | −8.6 |
Reliability
The ICC [95% CI] for vIGA*BSA was 0.72 [0.60–0.81], vIGA*cBSA was 0.74 [0.62–0.82], BSA was (0.80 [0.72–0.86], EASI was 0.56 [0.37–0.70], and objective-SCORAD was 0.82 [0.73–0.88] (Table 4).
Table 4.
Reliability for vIGA*BSA and vIGA*cBSA scores at follow-up from baseline.
| Severity assessment | |
|---|---|
| ICC [95% CI] | |
| vIGA*BSA (n=214) | 0.72 [0.60–0.81] |
| vIGA*cBSA (n=214) | 0.74 [0.62–0.82] |
| BSA (n=214) | 0.80 [0.72–0.86] |
| EASI (n=211) | 0.56 [0.37–0.70] |
| Objective-SCORAD (n=213) | 0.82 [0.73–0.88] |
Discussion
This study demonstrated that vIGA*BSA and vIGA*cBSA had overall good concurrent validity, convergent validity, discriminant validity, reliability, responsiveness, with no floor/ceiling effects. vIGA*BSA and vIGA*cBSA demonstrated numerically (but not significantly) lower correlations than EASI and objective-SCORAD with other PROs of AD and itch, i.e. convergent validity. On the other hand, vIGA*BSA and vIGA*cBSA showed similar discriminant validity as EASI and objective-SCORAD with PtGA and PGA. vIGA*BSA and vIGA*cBSA showed better reliability than EASI, but lower reliability than BSA or objective-SCORAD. These results are consistent with a previous study showing good convergent validity (n=195) of vIGA*BSA with EASI, objective-SCORAD and multiple PROs in children ages 5–17 years39. We observed similar concurrent and convergent validity for vIGA*BSA than observed in that study39. Together, the results of these studies indicate that vIGA*BSA and vIGA*cBSA are valid and reliable to assess AD severity in clinical practice. However, additional studies are warranted to confirm the validity and reliability of vIGA*BSA and vIGA*cBSA, particularly in children.
We did not formally assess the time needed to estimate vIGA*BSA vs. EASI and SCORAD in this study. However, assessing vIGA and BSA is simpler and might be more time-efficient for use in clinical practice and trials than EASI and objective-SCORAD. Given the concerns for potential intra- and/or inter-observer variability in evaluating BSA11, we also examined BSA divided into 6 broad intervals. vIGA*cBSA had was simpler to calculate, easier to interpret, and had slightly better reliability than, with similar other measurement properties as vIGA*BSA. While confirmatory studies are needed, we believe that vIGA*cBSA is more feasible for clinical practice. Of note, data collection for all ClinROs, including vIGA*BSA, EASI and objective-SCORAD, can be made more efficient using digital collection on tablet and mobile computers.
We found different interpretability bands were optimal for vIGA*BSA compared to those previously reported39. First, the interpretability bands identified in this study provide thresholds to distinguish between almost clear and mild AD. Second, we found different bands depending on the anchor used. That is, the thresholds were lower when using PGA as the anchor compared to EASI. The previously reported bands39 were developed using EASI grouped by other previously developed interpretability bands35. However, a global assessment is generally preferred as the anchor for developing interpretability bands. Third, both sets of interpretability bands correlated better with their respective anchors than the previously identified strata. Future studies are needed to determine which interpretability bands perform best in different settings. Of note, regardless of whether PGA or EASI was used the anchor, the interpretability bands for vIGA*cBSA were the same.
Overall, the thresholds for meaningful reduction of vIGA*BSA and vIGA*cBSA ranged from 15–25% reduction from the total baseline score, with differences of thresholds for patients with mild-moderate vs. severe disease at baseline.
This study presents two new ClinROs for the assessment of AD in clinical practice and potentially clinical trials. There is already a crowded landscape of outcome measures in AD. The international community has spent a considerable effort trying to harmonize the outcome measures used in clinical trials. EASI has emerged as the preferred ClinRO in clinical trials3. However, ClinROs such as EASI and objective-SCORAD are not ideal for routine clinical practice owing to long completion times8–10, complicated scoring algorithms, variable interrater and/or intrarater reliability6, 11, 12. vIGA*BSA is potentially a better option for clinical practice, as it is easier, shorter and more feasible to assess and score, and showed better reliability.
This study has several strengths, including large sample size, good representation across gender, age, race/ethnicity and AD severity, testing of multiple multiple PROs and ClinROs for AD, itch and QOL impact. There are some limitations. We did not assess content validity. Patients were recruited from a single academic center, which may limit generalizability. Further, all assessments were completed by a single rater, thereby precluding assessment of interrater reliability. Additional studies are needed to confirm these findings in a population-based and/or multicenter cohort.
In conclusion, vIGA*BSA and vIGA*cBSA has good concurrent, convergent, and discriminant validity, reliability, interpretability and feasibility to assess AD severity in clinical practice. vIGA*BSA and vIGA*cBSA may provide important information about AD severity that can guide therapeutic decision-making. Finally, vIGA*BSA and vIGA*cBSA had slightly less convergent validity than EASI or objective-SCORAD, but might be more efficient to collect and score.
Supplementary Material
Acknowledgments
Northwestern Medicine Enterprise Data Warehouse (NMEDW) was supported, in part, by the Northwestern University Clinical and Translational Science Institute, funded, in part, by Grant Number UL1TR000150 from the National Center for Advancing Translational Sciences, Clinical and Translational Sciences Award. The content is solely the responsibility of the authors and does not necessarily represent the official views of the NIH. The Clinical and Translational Science Award (CTSA) is a registered trademark of DHHS.
Funding Support: This publication was made possible with support from the Agency for Healthcare Research and Quality (AHRQ), grant number K12 HS023011, the Dermatology Foundation, and a research grant from Galderma.
Footnotes
Conflicts of interest:
J Silverberg has been a consultant and/or advisory board member for Galderma; R Chavda and S Gabriel are employees of Galderma; No other authors declare any conflicts of interest.
Financial disclosures: None
References
- 1.Yew YW, Thyssen JP, Silverberg JI. A systematic review and meta-analysis of the regional and age-related differences in atopic dermatitis clinical characteristics. Journal of the American Academy of Dermatology. 2019;80(2):390–401. [DOI] [PubMed] [Google Scholar]
- 2.Rehal B, Armstrong AW. Health outcome measures in atopic dermatitis: a systematic review of trends in disease severity and quality-of-life instruments 1985–2010. PloS one. 2011;6(4):e17520. [DOI] [PMC free article] [PubMed] [Google Scholar]
- 3.Chalmers JR, Schmitt J, Apfelbacher C, et al. Report from the third international consensus meeting to harmonise core outcome measures for atopic eczema/dermatitis clinical trials (HOME). The British journal of dermatology. 2014;171(6):1318–25. [DOI] [PMC free article] [PubMed] [Google Scholar]
- 4.Severity scoring of atopic dermatitis: the SCORAD index. Consensus Report of the European Task Force on Atopic Dermatitis. Dermatology. 1993;186(1):23–31. [DOI] [PubMed] [Google Scholar]
- 5.Hill MK, Kheirandish Pishkenari A, Braunberger TL, Armstrong AW, Dunnick CA. Recent trends in disease severity and quality of life instruments for patients with atopic dermatitis: A systematic review. Journal of the American Academy of Dermatology. 2016;75(5):906–17. [DOI] [PubMed] [Google Scholar]
- 6.Schmitt J, Langan S, Deckert S, et al. Assessment of clinical signs of atopic dermatitis: a systematic review and recommendation. The Journal of allergy and clinical immunology. 2013;132(6):1337–47. [DOI] [PubMed] [Google Scholar]
- 7.Wollenberg A, Barbarot S, Bieber T, et al. Consensus-based European guidelines for treatment of atopic eczema (atopic dermatitis) in adults and children: part I. Journal of the European Academy of Dermatology and Venereology : JEADV. 2018;32(5):657–82. [DOI] [PubMed] [Google Scholar]
- 8.Zhao CY, Tran AQ, Lazo-Dizon JP, et al. A pilot comparison study of four clinician-rated atopic dermatitis severity scales. The British journal of dermatology. 2015;173(2):488–97. [DOI] [PubMed] [Google Scholar]
- 9.Leshem YA, Hajar T, Hanifin JM, Simpson EL. What the Eczema Area and Severity Index score tells us about the severity of atopic dermatitis: an interpretability study. (1365–2133 (Electronic)). [DOI] [PubMed]
- 10.Ganemo A, Svensson A, Svedman C, et al. Usefulness of Rajka & Langeland Eczema Severity Score in Clinical Practice. Acta dermato-venereologica. 2016;96(4):521–4. [DOI] [PubMed] [Google Scholar]
- 11.Kunz B, Oranje AP, Labreze L, et al. Clinical validation and guidelines for the SCORAD index: consensus report of the European Task Force on Atopic Dermatitis. Dermatology. 1997;195(1):10–9. [DOI] [PubMed] [Google Scholar]
- 12.Schmitt J, Spuls PI, Thomas KS, et al. The Harmonising Outcome Measures for Eczema (HOME) statement to assess clinical signs of atopic eczema in trials. The Journal of allergy and clinical immunology. 2014;134(4):800–7. [DOI] [PubMed] [Google Scholar]
- 13.Futamura M, Leshem YA, Thomas KS, et al. A systematic review of Investigator Global Assessment (IGA) in atopic dermatitis (AD) trials: Many options, no standards. Journal of the American Academy of Dermatology. 2016;74(2):288–94. [DOI] [PubMed] [Google Scholar]
- 14.Gottlieb AB, Germino R, Herrera V, Meng X, Merola JF. Exploration of the Product of the 5-Point Investigator’s Global Assessment and Body Surface Area (IGA × BSA) as a Practical Minimal Disease Activity Goal in Patients with Moderate-to-Severe Psoriasis. Dermatology. 2019;235(4):348–54. [DOI] [PMC free article] [PubMed] [Google Scholar]
- 15.Hanifin J, Rajka G. Diagnostic features of atopic eczema. Acta dermato-venereologica. 1980;92:44–7. [Google Scholar]
- 16.Vakharia PP, Chopra R, Sacotte R, et al. Validation of patient-reported global severity of atopic dermatitis in adults. Allergy. 2018;73(2):451–8. [DOI] [PubMed] [Google Scholar]
- 17.Gerbens LA, Prinsen CA, Chalmers JR, et al. Evaluation of the measurement properties of symptom measurement instruments for atopic eczema: a systematic review. Allergy. 2017;72(1):146–63. [DOI] [PubMed] [Google Scholar]
- 18.Spuls PI, Gerbens LAA, Simpson E, et al. Patient-Oriented Eczema Measure (POEM), a core instrument to measure symptoms in clinical trials: a Harmonising Outcome Measures for Eczema (HOME) statement. The British journal of dermatology. 2017;176(4):979–84. [DOI] [PubMed] [Google Scholar]
- 19.Vakharia PP, Cella D, Silverberg JI. Patient-reported outcomes and quality of life measures in atopic dermatitis. Clin Dermatol. 2018;36(5):616–30. [DOI] [PubMed] [Google Scholar]
- 20.Vakharia PP, Chopra R, Sacotte R, et al. Severity strata for five patient-reported outcomes in adults with atopic dermatitis. The British journal of dermatology. 2018;178(4):925–30. [DOI] [PMC free article] [PubMed] [Google Scholar]
- 21.Basra MK, Fenech R, Gatt RM, Salek MS, Finlay AY. The Dermatology Life Quality Index 1994–2007: a comprehensive review of validation data and clinical results. The British journal of dermatology. 2008;159(5):997–1035. [DOI] [PubMed] [Google Scholar]
- 22.Patel KR, Singam V, Vakharia PP, et al. Measurement properties of three assessments of burden used in atopic dermatitis in adults. The British journal of dermatology. 2019;180(5):1083–9. [DOI] [PMC free article] [PubMed] [Google Scholar]
- 23.Desai NS, Poindexter GB, Monthrope YM, et al. A pilot quality-of-life instrument for pruritus. Journal of the American Academy of Dermatology. 2008;59(2):234–44. [DOI] [PubMed] [Google Scholar]
- 24.Charman CR, Venn AJ, Williams HC. The patient-oriented eczema measure: development and initial validation of a new tool for measuring atopic eczema severity from the patients’ perspective. Archives of dermatology. 2004;140(12):1513–9. [DOI] [PubMed] [Google Scholar]
- 25.Johns MW. A new method for measuring daytime sleepiness: the Epworth sleepiness scale. Sleep. 1991;14(6):540–5. [DOI] [PubMed] [Google Scholar]
- 26.Yu L, Buysse DJ, Germain A, et al. Development of short forms from the PROMIS sleep disturbance and Sleep-Related Impairment item banks. Behav Sleep Med. 2011;10(1):6–24. [DOI] [PMC free article] [PubMed] [Google Scholar]
- 27.Lei D, Yousaf M, Janmohamed SR, et al. Validation of Patient-Reported Outcomes Information System Sleep Disturbance and Sleep-Related Impairment in Adults With Atopic Dermatitis. The British journal of dermatology. 2020. [DOI] [PubMed] [Google Scholar]
- 28.Simpson E, Bissonnette R, Eichenfield L, et al. The validated Investigator Global Assessment for atopic dermatitis (vIGA-AD™): A novel clinical outcome measurement instrument for the severity of atopic dermatitis. Oral Presentation at: The European Academy of Dermatology and Venereology Congress; Paris, France 2018. [Google Scholar]
- 29.Hanifin JM, Thurston M, Omoto M, et al. The eczema area and severity index (EASI): assessment of reliability in atopic dermatitis. EASI Evaluator Group. Experimental dermatology. 2001;10(1):11–8. [DOI] [PubMed] [Google Scholar]
- 30.Dancey CP, Reidy J. Statistics without maths for psychology. Seventh Edition ed. New York: Pearson; 2017. pages cm p. [Google Scholar]
- 31.Hand DJ, Till RJ. A Simple Generalisation of the Area Under the ROC Curve for Multiple Class Classification Problems. Machine Learning. 2001;45(2):171–86. [Google Scholar]
- 32.Metz CE. Basic principles of ROC analysis. Semin Nucl Med. 1978;8(4):283–98. [DOI] [PubMed] [Google Scholar]
- 33.Terwee CB, Bot SD, de Boer MR, et al. Quality criteria were proposed for measurement properties of health status questionnaires. Journal of clinical epidemiology. 2007;60(1):34–42. [DOI] [PubMed] [Google Scholar]
- 34.Lim CR, Harris K, Dawson J, et al. Floor and ceiling effects in the OHS: an analysis of the NHS PROMs data set. BMJ open. 2015;5(7):e007765. [DOI] [PMC free article] [PubMed] [Google Scholar]
- 35.Leshem YA, Hajar T, Hanifin JM, Simpson EL. What the Eczema Area and Severity Index score tells us about the severity of atopic dermatitis: an interpretability study. The British journal of dermatology. 2015;172(5):1353–7. [DOI] [PubMed] [Google Scholar]
- 36.Rota M, Antolini L. Finding the optimal cut-point for Gaussian and Gamma distributed biomarkers. Computational Statistics & Data Analysis. 2014;69:1–14. [Google Scholar]
- 37.Koo TK, Li MY. A Guideline of Selecting and Reporting Intraclass Correlation Coefficients for Reliability Research. J Chiropr Med. 2016;15(2):155–63. [DOI] [PMC free article] [PubMed] [Google Scholar]
- 38.Terwee CB, Mokkink LB, Knol DL, et al. Rating the methodological quality in systematic reviews of studies on measurement properties: a scoring system for the COSMIN checklist. Quality of life research : an international journal of quality of life aspects of treatment, care and rehabilitation. 2012;21(4):651–7. [DOI] [PMC free article] [PubMed] [Google Scholar]
- 39.Suh TP, Ramachandran D, Patel V, et al. Product of Investigator Global Assessment and body surface area (IGAxBSA): a practice-friendly alternative to the Eczema Area and Severity Index (EASI) to assess atopic dermatitis severity in children. Journal of the American Academy of Dermatology. 2020. [DOI] [PMC free article] [PubMed] [Google Scholar]
Associated Data
This section collects any data citations, data availability statements, or supplementary materials included in this article.