

Summary
ANXA2 (Annexin A2 or Annexin II) is a calcium dependent phospholipid binding protein with diverse cellular functions. While ANXA2 is either absent or expressed focally in the prostate epithelium of well and moderately differentiated tumours, it is highly expressed in a subset of poorly differentiated tumours. Here we examined the association between ANXA2 expression and tumour progression, with consideration of ERG expression status and patient race (Caucasian American and African American).
We evaluated ANXA2 and ERG expression in index tumours by immunohistochemistry of whole mounted prostate sections and tissue microarrays derived from radical prostatectomies of 176 patients, matched for long term post-radical prostatectomy follow-up of up to 22 years (median 12.6 years), race and pathological stage. Expression of ERG and ANXA2 was analysed for correlation with grade group (GG), and pathological T (pT) stage. Kaplan–Meier estimation curves were used to examine associations between ANXA2 or ERG expression and biochemical recurrence (BCR) free survival, and distant metastasis free survival.
Significant associations were found between ANXA2(+) index tumours and poorest grade groups (GG 4–5, p=0.0037), and worse pathological stage (pT 3–4, p=0.0142). Patients with ANXA2(+) prostate tumours showed trends towards earlier BCR and metastatic progression. ANXA2(+)/ERG(–) tumours were found to be associated with GG 4–5; ANXA2(−)/ERG(+) tumours, with GG 1–2 ( p=0.0036). ANXA2 expression was not associated with patient race. The association between high ANXA2 expression and prostate tumours of higher grade (GG 4–5) and stage (pT 3–4) suggests a potential use for ANXA2 as a prognostic biomarker of aggressive prostate cancer.
Keywords: Prostate cancer, Annexin A2, prognostic biomarker, tumour differentiation, cancer health disparity
INTRODUCTION
In the United States, prostate cancer is the most commonly diagnosed cancer and the second leading cause of cancer associated death. African Americans, however, suffer the highest incidence and mortality rates.1 Increasing evidence suggests that biological differences in ancestry contribute to this disparity.2–4 Race or ethnicity dependent dysregulated expression of prostate cancer associated genes, such as ERG, AMACR, FOXP1, GSTP1, and NKX3-1, are known to predict risk of aggressive disease.5,6 Specifically, PTEN deletion,2,3,7 and TMPRSS2-ERG gene fusion8–11 are more prevalent in prostate cancer of Caucasians than of Africans or Asians. Our understanding of how ERG promotes oncogenesis has prompted efforts to treat prostate cancer by targeting ERG.12,13
ANXA2 (Annexin A2 or Annexin II) is a calcium dependent phospholipid binding protein that not only forms a hetero tetrameric complex with S100–A10 (A2t) on the plasma membrane, but also can be found localised to the nucleus, secreted extracellularly, or intercellularly, within exosomes.14,15 Besides establishing the apical basal polarity of epithelial cells,16 ANXA2 is involved in cytoskeletal reorganisation, cell adhesion and migration.17 It stimulates metastasis by activating metalloproteinases,18 enhancing the secretion of IL-6,19 and the migration and adhesion of prostate cancer cells to osteoblasts.20 In some cancers ANXA2 downregulation is associated with poorly differentiated tumours, aggressive disease and poor prognosis;21,22 in others, these features are associated with ANXA2 overexpression.18,23,24 In normal prostate or benign prostatic hyperplasia ANXA2 is localised to the luminal and basal epithelium, in prostatic intraepithelial neoplasia (PIN) and moderately differentiated adenocarcinomas it is either absent or expressed focally, but it becomes highly expressed in some poorly differentiated high grade adenocarcinomas.25–27
Earlier studies on ANXA2 expression in prostate cancer evaluated smaller study cohorts of less than 100 cases, and few have analysed its association with disease progression, particularly in the context of patient race.25–28 Studies that have examined the association between ANXA2 expression and disease progression have been controversial.29–31 We reported previously that ANXA2 and ERG gene expression is inversely correlated in prostate tumours.27 Herein, we evaluated the correlation between ANXA2 and ERG expression in prostate tumour tissues with pathological grade and stage, and time to biochemical recurrence (BCR) or metastasis in a cohort of both Caucasian American (CA) and African American (AA) men with long term follow-up.
METHODS
Study population
Prostate specimens were collected from radical prostatectomy patients who had provided written consent for the use of their biospecimens for research under a protocol (No. 20405–28) approved by the Walter Reed National Military Medical Center (WRNMMC) Institutional Review Board. Cases were selected based on sufficient follow-up (mean of 12.6 years), matched for age within 5 year blocks (40–75 years), self identified race and pathological tumour stage. Whole mounted prostate sections of 40 CA and 40 AA cases were selected from over 500 patients and tissue microarrays (TMA) of 59 CA and 40AA cases selected from 402 patients.32 Altogether, specimens were derived from 176 patients (80 whole mount cases and 96 TMA cases), which are shown as stratified and as a combined cohort in Table 1.
Table 1.
Distribution of demographic, clinical, and pathological variables of patients (n=176)
| Demographic variable | TMA | Whole mounted prostates | Total |
|---|---|---|---|
| Number of patients (%) | 96 (54.5) | 80 (45.5) | 176 (100) |
| Age at diagnosis, years | |||
| Mean (SD) | 61.2 (0.6) | 61.8 (0.7) | 61.5 (0.5) |
| Follow-up after RP, years | |||
| Median (range) | 16.6 (3.4, 22.1) | 8.6 (2.5, 16.9) | 12.6 (2.5, 22.1) |
| ANXA2 | |||
| ANXA2(−) | 45 (46.9) | 53 (66.3) | 98 (55.7) |
| ANXA2(+) | 51 (53.1) | 27 (33.7) | 78 (44.3) |
| ERG | |||
| ERG(−) | 55 (57.3) | 44 (55) | 99 (56.2) |
| ERG(+) | 41 (42.7) | 36 (45) | 77 (43.8) |
| ANXA2/ERG | |||
| ANXA2(−)/ERG(−) | 18 (18.8) | 22 (27.5) | 40 (22.7) |
| ANXA2(+)/ERG(−) | 37 (38.5) | 22 (27.5) | 59 (33.5) |
| ANXA2(−)/ERG(+) | 27 (28.1) | 31 (38.8) | 58 (33.0) |
| ANXA2(+)/ERG(+) | 14 (14.6) | 5 (6.2) | 19 (10.8) |
| Race | |||
| CA | 57 (59.4) | 40 (50) | 97 (55.1) |
| AA | 39 (40.6) | 40 (50) | 79 (44.9) |
| Pathological stage | |||
| pT2 | 44 (49.4) | 42 (53.2) | 86 (51.2) |
| pT3–4 | 45 (50.6) | 37 (46.8) | 82 (48.8) |
| Grade group (GG) | |||
| GG 1 | 9 (10.1) | 5 (6.3) | 14 (8.3) |
| GG 2 | 25 (28.1) | 23 (29.1) | 48 (28.6) |
| GG 3 | 0 | 0 | 0 |
| GG 4 | 36 (40.5) | 27 (34.2) | 63 (37.5) |
| GG 5 | 19 (21.3) | 24 (30.4) | 43 (25.6) |
| Surgical margin | |||
| Negative | 52 (58.4) | 61 (77.2) | 113 (67.3) |
| Positive | 37 (41.6) | 18 (22.8) | 55 (32.7) |
| BCR | 55 (57.3) | 30 (38) | 85 (48.6) |
| Metastasis | 15 (15.6) | 13 (16.2) | 28 (15.9) |
AA, African American; BCR, biochemical recurrence; CA, Caucasian American; RP, radical prostatectomy; SD, standard deviation; TMA, tissue microarrays.
Immunohistochemistry
Immunohistochemistry (IHC) assays were performed on representative 4 µ m whole mounted, formalin fixed and paraffin embedded sections as previously described.8,27 Monoclonal antibodies against ANXA2 (Cat no. 610069) and ERG (ERG MAb 9FY) were obtained from BD Biosciences (USA) and Biocare Medical Inc (USA), respectively. Adjacent sections were stained with haematoxylin and eosin, or with antibodies against ANXA2 or ERG. For combined staining of ANXA2 and ERG on TMAs, sections were first stained with ERG, immediately washed in PBS, blocked in 1% normal horse serum, and incubated with anti-ANXA2 antibody for one hour at room temperature. Sections were then incubated with biotinylated horse anti-mouse antibody for 30 min, treated with the ABC Kit for 30 min, followed by 10 min incubation with Vina Green (both from Biocare Medical) for colour development, before they were dehydrated, cleared, and mounted. Tumour focus of index tumours (defined as the highest grade or largest volume, or both) of whole mounts and index tumour derived cores were scored as ANXA2(+) if >10% of cells stained positive for ANXA2, or ANXA2(−) because we were certain that the fraction of ANXA2(+) cells above this cut-off value were unlikely to be artefactual or non-specific. Tumour foci were scored as ERG(+) if any tumour cell stained positive, or as ERG(−) if all tumour cells were negative.
Pathology assessment
Whole mounts and TMA specimens were centrally reviewed by one genitourinary pathologist (IAS), blinded to clinical outcomes, based on the 2014 International Society of Urological Pathology (ISUP) Consensus Conference adopted grade groups (GG): Gleason scores ≤6 (usually 3+3) are grouped in GG 1; Gleason 3+4=7 in GG 2; Gleason score 4+3=7 in GG 3; Gleason score 8 (4+4, 3+5, 5+3) in GG 4; and Gleason score 9–10 (4+5, 5+4, 5+5) in GG 5.33
Statistical analysis
To analyse the association between ANXA2 and ERG expression status with GG, patients were divided into a low grade group consisting of patients with GG 1 (Gleason score ≤6) and GG 2 (Gleason score 3+4=7), and a high grade group consisting of patients with GG 4 (Gleason score 8) and GG 5 (Gleason score 9–10). Patients with GG 3 (Gleason 4+3=7) were not detected in the study cohort. To analyse the association between ANXA2 and ERG expression with pathological T stage (pT), patients were divided into the pT2 group (organ confined tumours), or the pT3–4 group [tumours that are beginning to spread outside the prostate (pT3), and tumours that have spread to nearby organs (pT4)]. Chi-square testing was used to detect the association between ANXA2, ERG or ANXA2/ERG status with GG and pT stage for the overall study cohort, and stratified by race. Power calculations were performed using the R package pwr (v1.2–2)34 to confirm that the sample size was sufficient to detect an effect size (ES) of at least 0.3 but ≤0.4, at the significance level (α) of 0.05 (two sided tests) and power (1– β) set to >0.8 between subcategories for the variables analysed using Chi-square test. Fisher’s exact test was used instead when more than 20% of the expected cell counts had observations of less than five. Unadjusted univariable Kaplan–Meier survival curves and log rank tests were used to examine the association of ERG or ANXA2 status with BCR free or metastasis free survival. BCR was defined as a post-radical prostatectomy prostate specific antigen (PSA) ≥0.2 ng/mL followed by a confirmed, successive PSA ≥0.2 ng/mL, or salvage radiation or hormonal therapy was initiated with a prior PSA ≥0.1 ng/mL. Metastasis was ascertained by physician’s review of patients’ scan images [bone, computed tomography (CT), or magnetic resonance imaging (MRI)] or bone biopsy results. Data were analysed using SAS version 9.4 (SAS Institute, USA). Statistical significance was set at 0.05 (two sided tests).
RESULTS
Clinicopathological features, and ANXA2 and ERG expression status of patient cohorts
We evaluated ANXA2 and ERG expression by IHC in tumours of adjacent whole mounted sections (Fig. 1A–F), and in TMA cores double stained with ANXA2 and ERG (Fig. 1G–U) from a combined study cohort of 176 patients (Table 1), to determine whether their expression in prostate tumours correlated with race (AA and CA). ANXA2 expression was detected on the membrane, and in the cytoplasm of luminal and basal cells of benign prostate epithelium (Fig. 1B,E,H,I). Strong and homogeneous nuclear staining of ERG(+) cells was detected in PIN and in infiltrating carcinomas (Fig. 1C,F,Q,R). In contrast, ANXA2 expression was variable and positive cells were found usually in isolated or small clusters. Consistent with our earlier observations, significant inverse correlation was detected between ANXA2 and ERG (Table 2, p<0.0001): ERG(+) tumours were more likely to be ANXA2(−). Likewise, most index tumours of CA men were ERG(+), while those of AA men were ERG(−) ( p<0.0001).
Fig. 1.

(A–F) Immunohistochemical staining for ANXA2 and ERG in prostate cancer and benign prostate tissue. Consecutive sections of a representative whole mounted prostate, stained by IHC with H&E (A), and antibodies against ANXA2 (B), and ERG (C), with region indicated by rectangles magnified in (D), (E) and (F). (E) Blue arrowheads, cells without ANXA2 staining [ANXA2(−)]; green arrowheads, cells with positive ANXA2 staining [ANXA2(+)]. (F) Black arrowheads, well differentiated tumour cells with ERG staining. (G–U) Representative TMA cores, stained with H&E on the left, and with antibodies against either ERG or ANXA2, or both, in the middle, which are magnified on the right. Tissue cores representing benign prostate tissues (G–I), and prostate adenocarcinomas with ANXA2(−)/ERG(−) (J–L), ANXA2(+)/ERG(−) (M– O), ANXA2(−)/ERG(+) (P–R), and ANXA2(+)/ERG(+) (S–U) tumours. In panel Q, the ANXA2(+) cells in the periphery belong to benign glands.
Table 2.
Association of Annexin A2 and ERG with patient race
| All | p value | CA | AA | p value | |
|---|---|---|---|---|---|
| ANXA2 | 0.7629 | ||||
| ANXA2(−) | 98 (55.7) | 55 (56.7) | 43 (54.4) | ||
| ANXA2(+) | 78 (44.3) | 42 (43.3) | 36 (45.6) | ||
| ERG | <0.0001 | ||||
| ERG(−) | 99 (56.2) | 41 (42.3) | 58 (73.4) | ||
| ERG(+) | 77 (43.8) | 56 (57.7) | 21 (26.5) | ||
| ANXA2/ERG | <0.0001 | 0.0003 | |||
| ANXA2(−)/ERG(−) | 40 (22.7) | 14 (14.1) | 26 (32.9) | ||
| ANXA2(+)/ERG(−) | 59 (33.5) | 27 (27.8) | 32 (40.5) | ||
| ANXA2(−)/ERG(+) | 58 (32.9) | 41 (42.3) | 17 (21.5) | ||
| ANXA2(+)/ERG(+) | 19 (10.8) | 15 (15.5) | 4 (5.1) |
AA, African American; CA, Caucasian American.
Bold p values are significant.
Association of ANXA2 and ERG expression with tumour grade, pathological stage, and cancer progression
Index tumours of whole mounts and TMAs from 168 evaluable cases (91 AA and 77 CA) were analysed for association between the expression of either ANXA2 or ERG, or both (ANXA2/ERG), with tumour grade or pathological stage. Based on sensitivity assessment, patients were categorised into a low grade group (GG 1 and GG 2), and a high grade group (GG 3 to GG 5). The 5 year BCR free survival probabilities for the low grade group and high grade group, were >88% and <63%, respectively.35 Since this study cohort lacked cases with GG 3 (Gleason 4+3=7), patients were separated into GG 1–2 and GG 4–5 (Table 1, Table 3). Patients were grouped into pT2 and pT3–4 groups (Table 1, Table 4) to determine the correlation with pathological stage.
Table 3.
Association of Annexin A2 and ERG with grade group
| All |
p value | CA |
p value | AA |
p value | ||||
|---|---|---|---|---|---|---|---|---|---|
| GG 1–2a | GG 4–5b | GG 1–2a | GG 4–5b | GG 1–2a | GG 4–5b | ||||
| ANXA2 | 0.0037 | 0.0272 | 0.0562 | ||||||
| ANXA2(−) | 43 (69.4) | 49 (46.2) | 22 (71.0) | 28 (46.7) | 21 (67.7) | 21 (45.6) | |||
| ANXA2(+) | 19 (30.6) | 57 (53.8) | 9 (29.0) | 32 (53.3) | 10 (32.3) | 25 (54.4) | |||
| ERG | 0.0018 | 0.0004 | 0.1841 | ||||||
| ERG(−) | 25 (40.3) | 69 (65.1) | 5 (16.1) | 33 (55.0) | 20 (64.5) | 36 (78.3) | |||
| ERG(+) | 37 (59.7) | 37 (34.9) | 26 (83.9) | 27 (45.0) | 11 (35.5) | 10 (21.7) | |||
| ANXA2/ERG | 0.0036 | 0.0028c | 0.2037c | ||||||
| ANXA2(−)/ERG(−) | 13 (21.0) | 24 (22.6) | 2 (6.4) | 10 (16.7) | 11 (35.5) | 14 (30.4) | |||
| ANXA2(+)/ERG(−) | 12 (19.4) | 45 (42.4) | 3 (9.7) | 23 (38.3) | 9 (19.0) | 22 (47.8) | |||
| ANXA2(−)/ERG(+) | 30 (48.4) | 25 (23.6) | 20 (64.5) | 18 (30.0) | 10 (32.3) | 7 (15.2) | |||
| ANXA2(+)/ERG(+) | 7 (11.3) | 12 (11.3) | 6 (19.4) | 9 (15.0) | 1 (3.2) | 3 (6.5) | |||
AA, African American; CA, Caucasian American; GG, grade group.
Bold p values are significant.
(Gleason score ≤6 and 3+4).
(Gleason score 8 and 9–10).
Fisher’s exact test.
Table 4.
Association of Annexin A2 and ERG with pathological stage
| All |
p value | CA |
p value | AA |
p value | ||||
|---|---|---|---|---|---|---|---|---|---|
| pT2 | pT3–4 | pT2 | pT3–4 | pT2 | pT3–4 | ||||
| ANXA2 | 0.0142 | 0.0082 | 0.4529 | ||||||
| ANXA2(−) | 55 (64.0) | 37 (45.1) | 31 (68.9) | 19 (41.3) | 24 (58.5) | 18 (50.0) | |||
| ANXA2(+) | 31 (36.0) | 45 (54.9) | 14 (31.1) | 27 (58.7) | 17 (41.5) | 18 (50.0) | |||
| ERG | 0.9705 | 0.107 | 0.1027 | ||||||
| ERG(−) | 48 (55.8) | 46 (56.1) | 15 (33.3) | 23 (50.0) | 33 (80.5) | 23 (63.9) | |||
| ERG(+) | 38 (44.2) | 36 (43.9) | 30 (66.7) | 23 (50.0) | 8 (19.5) | 13 (36.1) | |||
| ANXA2/ERG | 0.0782 | 0.0602 | 0.2318a | ||||||
| ANXA2(−)/ERG(−) | 24 (27.9) | 13 (15.8) | 7 (15.6) | 5 (10.9) | 17 (41.5) | 8 (22.2) | |||
| ANXA2(+)/ERG(−) | 24 (27.9) | 33 (40.2) | 8 (17.8) | 18 (39.1) | 16 (39.0) | 15 (41.7) | |||
| ANXA2(−)/ERG(+) | 31 (36.0) | 24 (29.3) | 24 (53.3) | 14 (30.4) | 7 (17.1) | 10 (27.8) | |||
| ANXA2(+)/ERG(+) | 7 (8.1) | 12 (14.6) | 6 (13.3) | 9 (19.6) | 1 (2.4) | 3 (8.3) | |||
Bold p values are significant.
Fisher’s exact test.
Sensitivity analysis confirmed that the pooled AA and CA patients had >90% power to detect an ES of 0.3 with α error set to 0.05 (two sided test) the association between expression status of either ANXA2 or ERG, or both, with tumour grade or pathological stage. We found a significant association between ANXA2(+) tumours and higher grade groups (GG 4–5; Table 3, p=0.0037). In contrast, ERG(+) tumours were associated with lower grade groups (GG 1–2, p=0.0018). When ANXA2 and ERG were analysed together, ANXA2(−)/ERG(+) index tumours were associated with lower grade groups and, ANXA2(+)/ERG(−) tumours with higher grade groups (p=0.0036). We further detected a significant association between ANXA2(+) tumours and higher pT stages that was independent of ERG in the overall study cohort (Table 4, p=0.0142).
In race stratified analysis, the sample size of CA patients (n=91) was large enough to detect the association between either ANXA2 or ERG, and tumour grade or pathological stage with >80% power for an ES of 0.3, with α error set to 0.5. Among CA patients, ANXA2(+) was associated with tumours of higher grade groups (GG 4–5) ( p=0.0272) while ERG(−) was associated with tumours of lower grade groups (GG 1–2) ( p=0.004) (Table 3). Although the sample size of AA patients (n=77) was under-powered to detect this difference with the same ES, ANXA2(+) cases among AA men were more likely to be GG 4–5 than GG 1–2. The ratio of GG 4–5 to GG 1–2 tumours of AA patients is consistent with those of CA patients and of the combined patient cohort (Table 3). We also observed a significant association between ANXA2(+) and higher pathological stage, pT 3–4 ( p=0.0082) among CA patients (Table 4). In contrast, among AA patients, neither ANXA2 nor ERG expression was associated with pathological stage.
When expressions of both ANXA2 and ERG were examined jointly for association with tumour grade or pathological stage within each racial group, the samples became distributed into smaller subcategories. In these instances, the Fisher’s exact test was used to determine whether statistically significant associations existed (denoted by obeli in Table 3 and Table 4). We noted that among CA patients, ANXA2(+)/ERG(−) tumours were associated with higher grade, and ANXA2(−)/ERG(+) tumours with lower grade ( p=0.0028). Among AA patients, although ANXA2(+)/ERG(−) tumours remained associated with GG 4–5 tumours, it was below significance (Table 3), and the combined expression status of ANXA2 and ERG was not associated with pathological stage (Table 4).
To further examine whether we could predict disease progression based on the expression of ANXA2 or ERG, unadjusted Kaplan–Meier analysis for BCR and metastasis in relation to ANXA2 or ERG expression were performed. Patients with ANXA2(+) tumours showed trends towards earlier BCR and metastatic progression than patients with ANXA(−) tumours (Fig. 2A–D). Although the separation between groups did not reach significance, the trends were consistent with significant associations between ANXA2(+) and higher pathological grade and stage.
Fig. 2.
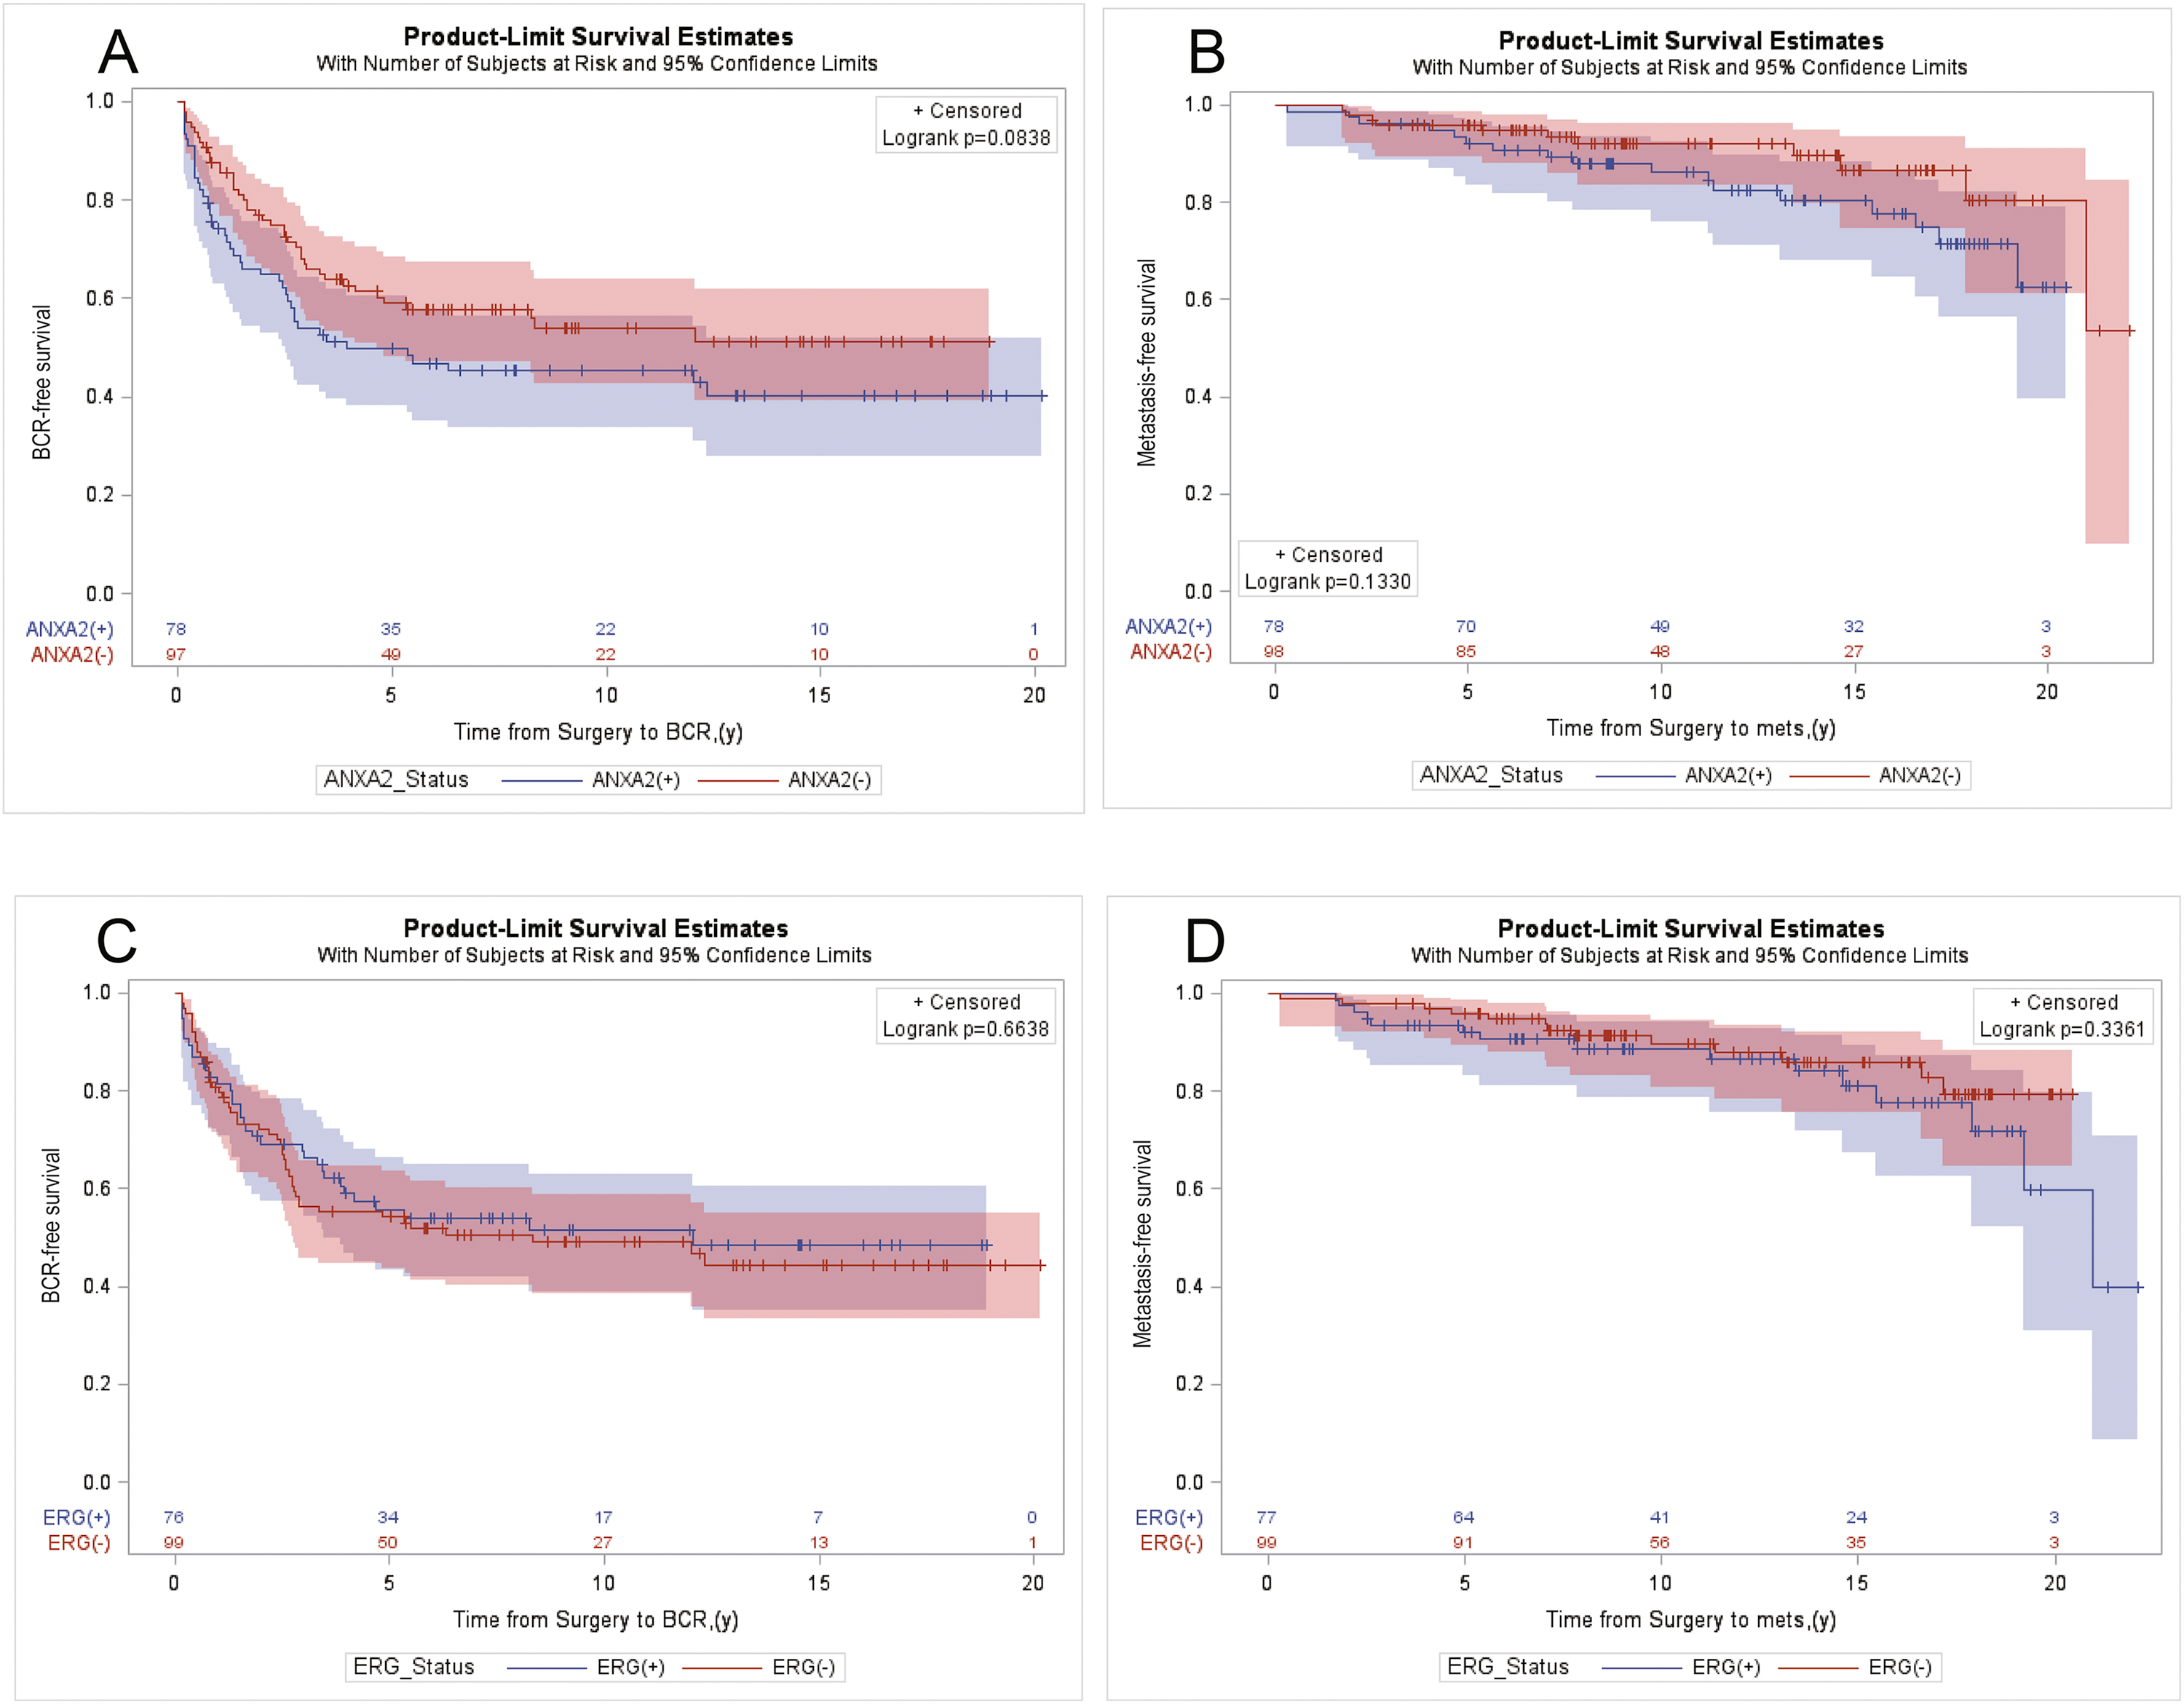
Product limit estimates for ANXA2 and ERG with BCR free survival and metastasis free survival as endpoint events. Unadjusted Kaplan–Meier estimation curves showing models of time from surgery to endpoint events for BCR free survival (A,C) and metastasis free survival (B,D), as a function of the expression of ANXA2 (A,B), ERG (C,D) in index tumours as key independent study predictors, for all patients (n=176).
DISCUSSION
Although earlier studies on the association between TMPRSS2-ERG fusion or ERG expression with disease progression have arrived at differing outcomes,36–39 our finding that ERG(+) tumours are associated with lower tumour grade is consistent with several recent reports.4,6,40 Specifically, in an evaluation of whole mounts from a cohort of 930 patients, Cullen et al. confirmed the higher frequency of ERG(+) tumours in CA men and that ERG(−) tumours were predictive of progression for CA patients.4 Further, Yan et al. found a strong association of ERG expression with absence of progression to BCR among patients with lower grade and stage at surgery.6 Since the association between ERG and disease progression has been addressed in studies with larger patient cohorts, here we focus on whether a similar correlation exists for ANXA2.
Evidence suggests that ANXA2 expression in normal prostate epithelial cells16 is repressed during oncogenic transformation.25–27 Its re-activation in advanced prostate cancer, however, is likely to promote metastasis through activation of metalloproteinases,15 IL-6 secretion,19 and adhesion to osteoblasts.20 This modulation of ANXA2 expression is supported by reports that ANXA2 is downregulated in high grade PIN, and in well or moderately differentiated prostate tumours,26,28 and is upregulated in poorly differentiated or higher grade tumours.19,25–27,41 Our finding that ANXA2(+) tumours are associated with higher grade groups, and with worse pathological stages, supports these observations. Interestingly, prostate cancer cell lines representing different stages of transformation mimic this expression profile of ANXA2: absent or repressed in androgen responsive cells, such as LNCaP; strongly expressed in androgen independent prostate cancer cells, such as PC3 and DU145.19,25,27,42 The loss of ANXA2 expression observed in other malignancies, such as osteosarcoma,22 and oral squamous cell carcinoma,21 is consistent with this model.
Our finding that ANXA2 expression in prostate tumours is associated with pathological grade corroborates earlier reports. Stewart et al. detected loss of ANXA2 expression in 75% of malignant cores with Gleason 6 (3+3) and Gleason 7 (3+4) in prostate adenocarcinomas from 210 cases.41 Likewise, Yee et al. reported that while ANXA2 was absent or focally expressed in moderately differentiated adenocarcinomas of 74 patients, about half (11/23 foci) of Gleason 8– 10 or poorly differentiated adenocarcinomas had more than 50% ANXA2 expression.26 Meanwhile, Banerjee et al. found intense focal membrane staining of ANXA2 in up to 25 % of cells of poorly differentiated tumours with Gleason >8 in a cohort of 42 patients.25 Inokuchi et al. also detected positive ANXA2 staining in high grade prostate cancer specimens of 24 patients.19
We found a significant association between ANXA2(+) status with higher grade groups and advanced pathological stages among CA patients and in the combined study cohort. While ANXA2 expression status was not associated with race, the inverse association between ANXA2 and ERG expression, and the higher prevalence of ERG(+) tumours among CA men corroborated published reports.3,4,8,10,11,27 The higher prevalence of ANXA2(−)/ERG(+) tumours among CA men, and of ANXA2(+)/ERG(−) tumours among AA men further reflects the interaction between ANXA2 and ERG. Significant associations between ANXA2(+)/ERG(−) tumours and higher grade groups, however, were found only in the combined cohort and among CA men. Contrary to the findings from our group and others, Ding et al. reported lower expression of ANXA2 in prostate cancer specimens (n=85) than in those from benign prostatic hyperplasia (n=40).31 This discrepancy could result from the uneven expression pattern of ANXA2 in prostate tumours. Unlike the uniform plasma membrane expression in benign prostate epithelium, its heterogeneous expression in prostate cancer cells extends to the nuclei and the cytoplasm.19,26,43 This expression pattern, which ranges from focal clusters of about 5% of tumour cells to a more uniform expression in over 50% of tumour cells with varying levels of staining intensities, prevents consistent and uniform scoring for ANXA2 expression across multiple studies.26,27,31,44 Moreover, the variability in size and sampling methods of prostate tumour specimens evaluated, that include tissue sections prepared from transurethral resection of the prostate,25,44 TMA,41 ex vivo biopsies obtained during radical prostatectomy, or whole mounts,19,26,27,31 further amplifies this difference.
In contrast to our findings, several studies found that ANXA2 expression was neither correlated with29,31 nor predictive of30 BCR. The use of specimens from patients who had been treated, either by radiation or androgen deprivation therapy prior to surgery,30 instead of from untreated patients as used in this study, could have affected the expression of ANXA2 that led to the discrepancy. The shorter patient follow-up periods of 5 years,31 6.5 years30 and 15 years29 after radical prostatectomy, compared to the longer follow-up of patients in this study, could also have affected the results. Unlike most studies on ANXA2 expression in prostate cancer that had used patients of the same race,29,31 this study had examined a patient cohort comprising AA and CA patients with equal access to health care, which would have minimised social economic status as a confounding factor. Furthermore, with a sample size that is 2–4-fold larger than earlier studies19,25,26,28–31,45 we were statistically powered to detect differences in variables of interest in all patients and among CA patients, except for some variable combinations among AA patients. Specifically, when the patient cohort was divided into subcategories of race and ANXA2/ERG expression, the joint variable combinations produced smaller subgroups that limited our ability to evaluate their impact on prostate cancer progression, as the results were no longer statistically meaningful. Nevertheless, the 2.5:1 ratio of ANXA2(+) cases between GG 4– 5 and GG 1–2 groups observed among AA patients displayed a trend of ANXA2 expression that was consistent with the ratios of 3.5:1 and 3:1 observed among CA patients and in all patients, respectively. Furthermore, unadjusted Kaplan–Meier analyses of BCR and metastasis as a function of ANXA2 expression among the overall study cohort showed a clear trend toward poorer BCR free and metastasis free survival. Although the separations between groups did not reach statistical significance, the trends were consistent with the association of ANXA2(+) expression with higher pathological grade and pT stage in the overall study cohort. The diverging and non-overlapping survival curves of the ANXA2(+) and ANXA2(−) groups in the BCR free survival analysis further support this finding. In addition, the narrow 95% confidence interval bands throughout the time to event analysis in the plots associated with ANXA2 expression indicate a greater signal over noise in the data, which suggests that if the study were to be repeated with a larger sample, we could achieve similar results with only incremental gains to the level of significance (i.e., a smaller p value) without changing the overall trend of the associations. By using the revised 2014 ISUP grading system we had expected to detect more tumours with GG 1–2 grades than GG 3 grade in index tumours;35,46,47 nevertheless, the absence of GG 3 cases was surprising. We speculate that the reassignment of all cribriform, glomeruloid, and fused, or poorly formed glands as Gleason pattern 4 tumours in the updated grading system may have resulted in an upward shift of scores from GG 3 to GG 4.48,49 The higher proportion of GG 4–5 of tumours may also be predisposed by the segregation of patients by pathological stage during sample selection, which could be avoided in future studies by stratifying patients using fewer features. While whole mounts afforded a complete overview of a section of the prostate, there is concern that because of the small punch size, TMA tissue cores may provide less tumour area for evaluation that is inadequate to demonstrate tumour heterogeneity. To assure adequate representation of tumours during TMA construction, duplicate cores were sampled from each tumour focus (2–4 tumour foci in total), benign glands, and PIN.32 If tumour heterogeneity were under represented in the TMA, we would expect to detect fewer cases with ANXA2 expression than in whole mounts, but this was not the case. Our results concur with those of a study that compared the expression of Ki-67 in prostate cancer of TMA cores with those in standard pathology slides. The study concluded that the optimal predictive value in a prostate cancer array can be obtained from three to four cores and that using more than four cores will not add significant information.50
CONCLUSION
ANXA2 and ERG protein expression can be scored accurately using limited quantities of prostate tissue specimen, such as biopsy or archival samples. ANXA2(+) prostate tumours represent a subset of tumours that are associated with adverse pathology, which are likely to have worse progression, and portend worse outcome. These findings support the use of ANXA2 as a potential prognostic marker and the stratification of patients by ANXA2 expression may present a promising step towards personalising prostate cancer treatment by prognosticating probability of disease progression.
Acknowledgements:
We thank Dr Indu Kohaar and Dr Cara Schafer for critical reading of the manuscript.
Conflicts of interest and sources of funding: This study was funded in part by the Uniformed Services University of the Health Sciences, (Center for Prostate Disease Research grant no. HU0001-10-2-0002) to ILR and the National Cancer Institute (RO1CA162383) to SS. The funds provided were used to purchase experimental reagents. The funding bodies played no role in the design of the study and collection, analysis, and interpretation of data and in writing the manuscript.
Shiv Srivastava, Albert Dobi, and Shyh-Han Tan are inventors of the ERG monoclonal antibody (9FY) that is licensed to Biocare Medical by The Henry M. Jackson Foundation for the Advancement of Military Medicine. The other authors declare no competing interests.
The contents of this publication are the sole responsibility of the author(s) and do not necessarily reflect the views, opinions or policies of the Henry M. Jackson Foundation for the Advancement of Military Medicine, Inc., the Uniformed Services University of the Health Sciences (USUHS), the Department of Defense (DoD) or the Departments of the Army, Navy, or Air Force, or any other agency of the US Government. The mention of trade names, specific commercial products, scientific instrumentation, or organisations is considered an integral part of the scientific endeavor and does not constitute endorsement or implied endorsement on the part of the author, DoD, or the US Government.
Footnotes
Publisher's Disclaimer: This is a PDF file of an unedited manuscript that has been accepted for publication. As a service to our customers we are providing this early version of the manuscript. The manuscript will undergo copyediting, typesetting, and review of the resulting proof before it is published in its final form. Please note that during the production process errors may be discovered which could affect the content, and all legal disclaimers that apply to the journal pertain.
Availability of data and materials: The datasets generated and analysed in this study are not publicly available due to restrictions imposed by the current IRB protocol but can be made available upon approval of a separate IRB protocol allowing for their subsequent use.
References
- 1.Siegel RL, Miller KD, Jemal A. Cancer statistics, 2019. CA Cancer J Clin 2019; 69: 7–34. [DOI] [PubMed] [Google Scholar]
- 2.Petrovics G, Li H, Stumpel T, et al. A novel genomic alteration of LSAMP associates with aggressive prostate cancer in African American men. EBioMedicine 2015; 2: 1957–64. [DOI] [PMC free article] [PubMed] [Google Scholar]
- 3.Khani F, Mosquera JM, Park K, et al. Evidence for molecular differences in prostate cancer between African American and Caucasian men. Clin Cancer Res 2014; 20: 4925–34. [DOI] [PMC free article] [PubMed] [Google Scholar]
- 4.Cullen J, Young D, Chen Y, et al. Predicting prostate cancer progression as a function of ETS-related gene status, race, and obesity in a longitudinal patient cohort. Eur Urol Focus 2018; 4: 818–24. [DOI] [PMC free article] [PubMed] [Google Scholar]
- 5.Yamoah K, Johnson MH, Choeurng V, et al. Novel biomarker signature that may predict aggressive disease in African American men with prostate cancer. J Clin Oncol 2015; 33: 2789–96. [DOI] [PMC free article] [PubMed] [Google Scholar]
- 6.Yan W, Jamal M, Tan SH, et al. Molecular profiling of radical prostatectomy tissue from patients with no sign of progression identifies ERG as the strongest independent predictor of recurrence. Oncotarget 2019; 10: 6466–83. [DOI] [PMC free article] [PubMed] [Google Scholar]
- 7.Blattner M, Lee DJ, O’Reilly C, et al. SPOP mutations in prostate cancer across demographically diverse patient cohorts. Neoplasia 2014; 16: 14–20. [DOI] [PMC free article] [PubMed] [Google Scholar]
- 8.Furusato B, Tan SH, Young D, et al. ERG oncoprotein expression in prostate cancer: clonal progression of ERG-positive tumor cells and potential for ERG-based stratification. Prostate Cancer Prostatic Dis 2010; 13: 228–37. [DOI] [PMC free article] [PubMed] [Google Scholar]
- 9.Perner S, Mosquera JM, Demichelis F, et al. TMPRSS2-ERG fusion prostate cancer: an early molecular event associated with invasion. Am J Surg Pathol 2007; 31: 882–8. [DOI] [PubMed] [Google Scholar]
- 10.Rosen P, Pfister D, Young D, et al. Differences in frequency of ERG oncoprotein expression between index tumors of Caucasian and African American patients with prostate cancer. Urology 2012; 80: 749–53. [DOI] [PMC free article] [PubMed] [Google Scholar]
- 11.Magi-Galluzzi C, Tsusuki T, Elson P, et al. TMPRSS2-ERG gene fusion prevalence and class are significantly different in prostate cancer of Caucasian, African-American and Japanese patients. Prostate 2011; 71: 489–97. [DOI] [PubMed] [Google Scholar]
- 12.Winters B, Brown L, Coleman I, et al. Inhibition of ERG activity in patient-derived prostate cancer xenografts by YK-4–279. Anticancer Res 2017; 37: 3385–96. [DOI] [PubMed] [Google Scholar]
- 13.Mohamed AA, Xavier CP, Sukumar G, et al. Identification of a small molecule that selectively inhibits ERG-positive cancer cell growth. Cancer Res 2018; 78: 3659–71. [DOI] [PubMed] [Google Scholar]
- 14.Maji S, Chaudhary P, Akopova I, et al. Exosomal Annexin II promotes angiogenesis and breast cancer metastasis. Mol Cancer Res 2017; 15: 93–105. [DOI] [PMC free article] [PubMed] [Google Scholar]
- 15.Lokman NA, Ween MP, Oehler MK, et al. The role of annexin A2 in tumorigenesis and cancer progression. Cancer Microenviron 2011; 4: 199–208. [DOI] [PMC free article] [PubMed] [Google Scholar]
- 16.Martin-Belmonte F, Gassama A, Datta A, et al. PTEN-mediated apical segregation of phosphoinositides controls epithelial morphogenesis through Cdc42. Cell 2007; 128: 383–97. [DOI] [PMC free article] [PubMed] [Google Scholar]
- 17.Staquicini DI, Rangel R, Guzman-Rojas L, et al. Intracellular targeting of annexin A2 inhibits tumor cell adhesion, migration, and in vivo grafting. Sci Rep 2017; 7: 4243. [DOI] [PMC free article] [PubMed] [Google Scholar]
- 18.Sharma M, Ownbey RT, Sharma MC. Breast cancer cell surface annexin II induces cell migration and neoangiogenesis via tPA dependent plasmin generation. Exp Mol Pathol 2010; 88: 278–86. [DOI] [PubMed] [Google Scholar]
- 19.Inokuchi J, Narula N, Yee DS, et al. Annexin A2 positively contributes to the malignant phenotype and secretion of IL-6 in DU145 prostate cancer cells. Int J Cancer 2009; 124: 68–74. [DOI] [PubMed] [Google Scholar]
- 20.Shiozawa Y, Havens AM, Jung Y, et al. Annexin II/annexin II receptor axis regulates adhesion, migration, homing, and growth of prostate cancer. J Cell Biochem 2008; 105: 370–80. [DOI] [PMC free article] [PubMed] [Google Scholar]
- 21.Rodrigo JP, Lequerica-Fernandez P, Rosado P, et al. Clinical significance of annexin A2 downregulation in oral squamous cell carcinoma. Head Neck 2011; 33: 1708–14. [DOI] [PubMed] [Google Scholar]
- 22.Gillette JM, Chan DC, Nielsen-Preiss SM. Annexin 2 expression is reduced in human osteosarcoma metastases. J Cell Biochem 2004; 92: 820–32. [DOI] [PubMed] [Google Scholar]
- 23.Emoto K, Yamada Y, Sawada H, et al. Annexin II overexpression correlates with stromal tenascin-C overexpression: a prognostic marker in colorectal carcinoma. Cancer 2001; 92: 1419–26. [DOI] [PubMed] [Google Scholar]
- 24.Vishwanatha JK, Chiang Y, Kumble KD, et al. Enhanced expression of annexin II in human pancreatic carcinoma cells and primary pancreatic cancers. Carcinogenesis 1993; 14: 2575–9. [DOI] [PubMed] [Google Scholar]
- 25.Banerjee AG, Liu J, Yuan Y, et al. Expression of biomarkers modulating prostate cancer angiogenesis: differential expression of annexin II in prostate carcinomas from India and USA. Mol Cancer 2003; 2: 34. [DOI] [PMC free article] [PubMed] [Google Scholar]
- 26.Yee DS, Narula N, Ramzy I, et al. Reduced annexin II protein expression in high-grade prostatic intraepithelial neoplasia and prostate cancer. Arch Pathol Lab Med 2007; 131: 902–8. [DOI] [PubMed] [Google Scholar]
- 27.Griner NB, Young D, Chaudhary P, et al. ERG oncoprotein inhibits ANXA2 expression and function in prostate cancer. Mol Cancer Res 2015; 13: 368–79. [DOI] [PMC free article] [PubMed] [Google Scholar]
- 28.Chetcuti A, Margan SH, Russell P, et al. Loss of annexin II heavy and light chains in prostate cancer and its precursors. Cancer Res 2001; 61: 6331–4. [PubMed] [Google Scholar]
- 29.Beyene DA, Naab TJ, Kanarek NF, et al. Differential expression of Annexin 2, SPINK1, and Hsp60 predict progression of prostate cancer through bifurcated WHO Gleason score categories in African American men. Prostate 2018; 78: 801–11. [DOI] [PMC free article] [PubMed] [Google Scholar]
- 30.Lamb DS, Sondhauss S, Dunne JC, et al. Proteins Annexin A2 and PSA in prostate cancer biopsies do not predict biochemical failure. Anticancer Res 2017; 37: 6943–6. [DOI] [PubMed] [Google Scholar]
- 31.Ding T, Yang L, Wang Y, et al. Down-regulation of annexin II in prostate cancer is associated with Gleason score, recurrence, metastasis and poor prognosis. Mol Med Rep 2010; 3: 781–7. [DOI] [PubMed] [Google Scholar]
- 32.Merseburger AS, Kuczyk MA, Serth J, et al. Limitations of tissue microarrays in the evaluation of focal alterations of bcl-2 and p53 in whole mount derived prostate tissues. Oncol Rep 2003; 10: 223–8. [PubMed] [Google Scholar]
- 33.Amin MB, Epstein JI, Ulbright TM, et al. Best practices recommendations in the application of immunohistochemistry in urologic pathology: report from the International Society of Urological Pathology consensus conference. Am J Surg Pathol 2014; 38: 1017–22. [DOI] [PubMed] [Google Scholar]
- 34.Champely S, Ekstrom C, Dalgaard P, et al. Basic Functions for Power Analysis. Power analysis functions along the lines of Cohen (1988). Version 1.2–2, 2018.
- 35.Epstein JI, Zelefsky MJ, Sjoberg DD, et al. A contemporary prostate cancer grading system: a validated alternative to the Gleason score. Eur Urol 2016; 69: 428–35. [DOI] [PMC free article] [PubMed] [Google Scholar]
- 36.Demichelis F, Fall K, Perner S, et al. TMPRSS2:ERG gene fusion associated with lethal prostate cancer in a watchful waiting cohort. Oncogene 2007; 26: 4596–9. [DOI] [PubMed] [Google Scholar]
- 37.Attard G, Clark J, Ambroisine L, et al. Duplication of the fusion of TMPRSS2 to ERG sequences identifies fatal human prostate cancer. Oncogene 2008; 27: 253–63. [DOI] [PMC free article] [PubMed] [Google Scholar]
- 38.Dal Pra A, Lalonde E, Sykes J, et al. TMPRSS2-ERG status is not prognostic following prostate cancer radiotherapy: implications for fusion status and DSB repair. Clin Cancer Res 2013; 19: 5202–9. [DOI] [PubMed] [Google Scholar]
- 39.Hoogland AM, Jenster G, van Weerden WM, et al. ERG immunohistochemistry is not predictive for PSA recurrence, local recurrence or overall survival after radical prostatectomy for prostate cancer. Mod Pathol 2012; 25: 471–9. [DOI] [PubMed] [Google Scholar]
- 40.Kim SH, Kim SH, Joung JY, et al. Overexpression of ERG and wild-type PTEN are associated with favorable clinical prognosis and low biochemical recurrence in prostate cancer. PLoS One 2015; 10: e0122498. [DOI] [PMC free article] [PubMed] [Google Scholar]
- 41.Stewart J, Fleshner N, Cole H, et al. Comparison of annexin II, p63 and alpha-methylacyl-CoA racemase immunoreactivity in prostatic tissue: a tissue microarray study. J Clin Pathol 2007; 60: 773–80. [DOI] [PMC free article] [PubMed] [Google Scholar]
- 42.Liu JW, Shen JJ, Tanzillo-Swarts A, et al. Annexin II expression is reduced or lost in prostate cancer cells and its re-expression inhibits prostate cancer cell migration. Oncogene 2003; 22: 1475–85. [DOI] [PubMed] [Google Scholar]
- 43.Liu J, Vishwanatha JK. Regulation of nucleo-cytoplasmic shuttling of human annexin A2: a proposed mechanism. Mol Cell Biochem 2007; 303: 211–20. [DOI] [PubMed] [Google Scholar]
- 44.Smitherman AB, Mohler JL, Maygarden SJ, et al. Expression of annexin I, II and VII proteins in androgen stimulated and recurrent prostate cancer. J Urol 2004; 171: 916–20. [DOI] [PubMed] [Google Scholar]
- 45.Miller KD, Siegel RL, Lin CC, et al. Cancer treatment and survivorship statistics, 2016. CA Cancer J Clin 2016; 66: 271–89. [DOI] [PubMed] [Google Scholar]
- 46.Erickson A, Sandeman K, Lahdensuo K, et al. New prostate cancer grade grouping system predicts survival after radical prostatectomy. Hum Pathol 2018; 75: 159–66. [DOI] [PubMed] [Google Scholar]
- 47.Offermann A, Hohensteiner S, Kuempers C, et al. Prognostic value of the new prostate cancer International Society of Urological Pathology grade groups. Front Med 2017; 4: 157. [DOI] [PMC free article] [PubMed] [Google Scholar]
- 48.Delahunt B, Lamb DS, Srigley JR, et al. Gleason scoring: a comparison of classical and modified (international society of urological pathology) criteria using nadir PSA as a clinical end point. Pathology 2010; 42: 339–43. [DOI] [PubMed] [Google Scholar]
- 49.Danneman D, Drevin L, Robinson D, et al. Gleason inflation 1998–2011: a registry study of 97,168 men. BJU Int 2015; 115: 248–55. [DOI] [PubMed] [Google Scholar]
- 50.Rubin MA, Dunn R, Strawderman M, et al. Tissue microarray sampling strategy for prostate cancer biomarker analysis. Am J Surg Pathol 2002; 26: 312–9. [DOI] [PubMed] [Google Scholar]