

Abstract
Background:
Oxylipins are formed from oxidation of omega-6 (n6) and omega-3 (n3) fatty-acids (FA). Evidence for inflammatory effects comes mostly from adults.
Methods:
Oxylipins from n6-FA (27 n6-oxylipins) and n3-FA (12 n3-oxylipins) were measured through ultra-high-performance liquid chromatography-mass spectrometry (LC-MS/MS) in plasma from 111 children at risk of type 1 diabetes (age 1–17 years) studied longitudinally. Oxylipin precursor FA (arachidonic acid, linoleic acid, alpha-linolenic acid, docosahexaenoic acid, and eicosapentaenoic acid) were measured in red blood cell (RBC) membrane and plasma. Precursor FA dietary intake was measured through food frequency questionnaire and environmental tobacco smoke (ETS) through questionnaires. Linear mixed models were used to test oxylipins with predictors.
Results:
Age associated with 15 n6- and 6 n3-oxylipins; race/ethnicity associated with 3 n6- and 1 n3-oxylipins; sex associated with 2 n6-oxylipins. ETS associated with lipoxin-A4. Oxylipins associated with precursor FA in plasma more often than RBC. RBC levels and dietary intake of precursor FA more consistently associated with n3- than n6-oxylipins.
Conclusions:
In healthy children, oxylipin levels change with age. Oxylipins are associated with precursor FA more often in plasma than RBC or diet, suggesting that inflammatory regulation leading to FA release into plasma may also be a determinant of oxylipin generation.
Introduction
Polyunsaturated fatty acids (PUFA) include omega-6 (n6) and omega-3 (n3) fatty acids (FA) that play essential roles in inflammation in the body1,2. An imbalance between intake of n6 and n3 FA can lead to increased inflammation1,2. The pro- and anti-inflammatory effects of n6 and n3 FA are in part due to actions propagated by oxylipins, which are oxygenated lipid mediators produced from these FA.
Generation of oxylipins begins with cleavage of the FA from glycerophospholipids of cell membranes via phospholipase A23. Then the enzymes cyclooxygenase (COX), lipooxygenase (LOX), and cytochrome P450 (CYP) produce oxylipins. The COX enzyme catalyzes PUFAs into prostanoids that bind to G-protein-coupled receptors, PPAR-g, and other receptors4. There are 6 different LOX enzymes in humans (5-LOX, 12-LOX, 12/15-LOX, 15-LOX type 2, 12(R)-LOX, and epidermal LOX5 (Figure 1). LOX converts PUFAs to hydroxyl FAs, including leukotrienes, lipoxins, resolvins, protectins, maresins, hepoxilins, and eoxins, which bind to G-protein-coupled receptors and other cellular receptors4. The 5-LOX enzyme catalyzes the formation of pro-inflammatory leukotrienes from arachidonic acid (ARA)5. CYP450 enzymes aid in the formation of oxylipins, including EpOMEs and DiHOMEs6. N3 oxylipins derived from CYP450 reactions reduce inflammation by decreasing monocytes6 and additionally have potent vasodilation actions4. Notably, n6 FA compete with n3 FA for the same biosynthetic enzymes4,7.
Figure 1:
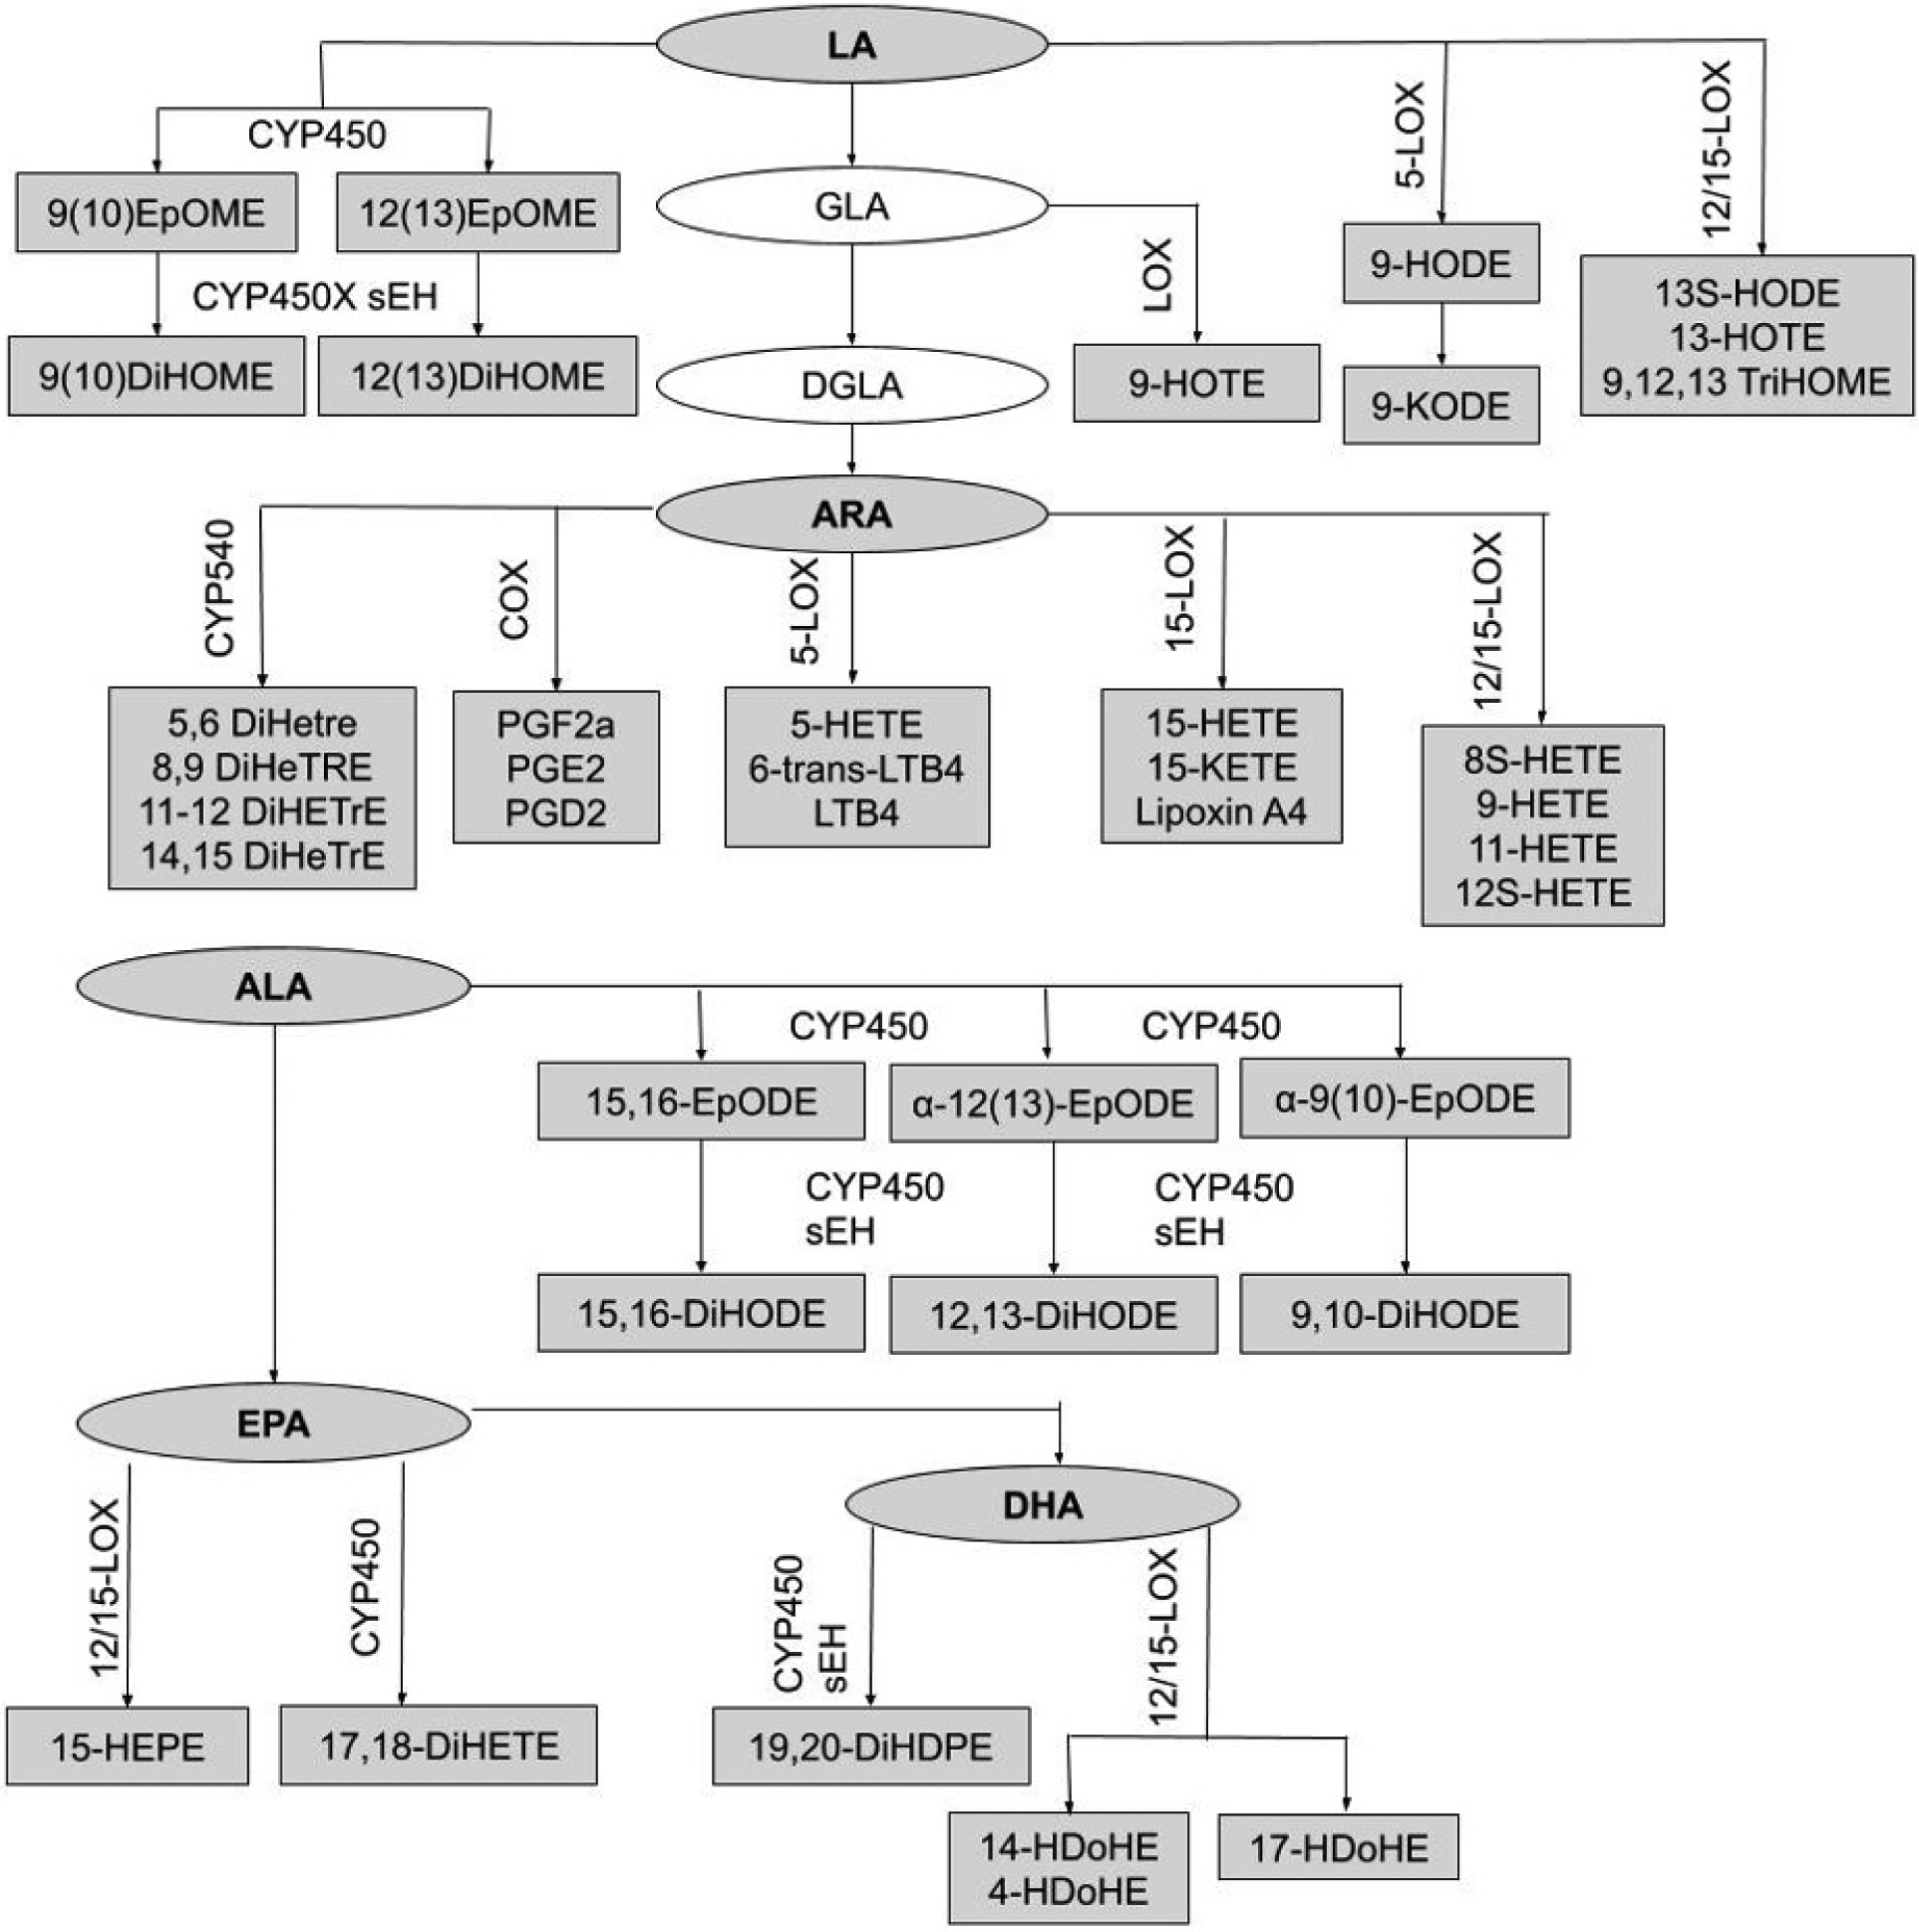
Relationships between precursor fatty acids and oxylipins. Boxes represent oxylipins and ovals represent precursor FA. Shaded boxes represent metabolites that were measured by this study, and unshaded boxes represent unmeasured metabolites. Biosynthetic enzymes for the formation of oxylipins (CYP450 sEH, 12/15-LOX, 5-LOX, 15-LOX, COX) are indicated above the oxylipin formed by the enzyme. Full names of oxylipins are presented in supplementary table 1.
N6 and n3 oxylipins are important biomarkers in the study of inflammation. In general, n3 oxylipins have anti-inflammatory, anti-proliferative, and pro-resolving actions4. Although the anti-inflammatory effects of alpha-linolenic acid (ALA) are generally attributed to its conversion to docosahexaenoic acid (DHA) and eicosapentaenoic acid (EPA), ALA-related oxylipins have distinct anti-inflammatory properties8. N6 oxylipins are more pro-inflammatory, vasoconstrictive, and proliferative compared to n3 oxylipins, although some linoleic acid (LA) oxylipins exhibit some anti-inflammatory effects4. Because of their pivotal role in promoting and resolving inflammation, oxylipins have been studied in the context of many pro-inflammatory states, including obesity9, asthma10, and lung inflammation11,12. For example, patients with chronic obstructive pulmonary disease have increased levels of leukotrienes11 and 12-HETE and 15-HETE12 in their bronchoalveolar lavage fluid (BAL).
Studies in adults have demonstrated that oxylipin status is associated with dietary intake, although most studies focus on the effect of dietary supplements rather than usual dietary intake. Shearer et al. found that increased intake of n3 FA from prescription n3 supplements increased n3-related oxylipins by 2–5 times13, EPA supplementation increased EPA oxylipins, and docosapentaenoic acid (DPA) supplementation increased DPA oxylipins in a double-blind crossover study14. Nording et al. found that gender, age, weight, and BMI were not associated with the oxylipin profile in adults supplemented with EPA and DHA for 6 weeks15. Others have found conflicting trends in the effect of age on the oxylipin profile of adults16,17.
Little is known about the correlates of oxylipins in children. This study was designed to test predictors of plasma oxylipins in a healthy pediatric population. We tested the precursor FA to oxylipins (i.e. ARA, LA, ALA, DHA, EPA) in the diet, red blood cell membrane (RBC), and in the plasma. This represents metabolism of FA in the body beginning with the PUFA content in the diet. RBC levels of the precursor FA are a proxy for PUFA storage, and plasma levels of the precursor FA capture the cleavage of PUFA from stored glycerophospholipids that may be taken up by tissues for conversion to oxylipins to promote or reduce inflammatory signals. We also examined environmental tobacco smoke (ETS) exposure, which is known to induce lung inflamation18. In this study, we aimed to explore the relationship between plasma oxylipin levels (concentrations) and 1) age, sex, race/ethnicity, 2) ETS and dietary intake of the precursor FA, and 3) measures of the precursor FA in the RBC membrane and plasma.
Methods
Study Design
The study population was drawn from the Diabetes Autoimmunity Study in the Young (DAISY), a longitudinal cohort study in Denver, CO that follows 2,547 children at risk of type 1 diabetes (T1D). Children were recruited into the DAISY cohort if they had a first degree relative (FDR) with T1D or had an increased-risk HLA genotype (HLA-DR3/4, 4/4, 4/X, 3/3, 3/X), as described previously19.
Subjects have study visits at 9, 15, and 24 months, and then study visits are conducted annually. Radio-binding immunoassays were used to test subjects for serum autoantibodies to GAD65, IAA, IA-2, and ZnT8 as described previously20. In DAISY, islet autoimmunity (IA) was defined as testing positive for at least one islet autoantibody on two or more consecutive visits, or testing positive for islet autoantibodies followed by diagnosis with T1D at the next visit (within a year) using ADA criteria21. A nested case-control study of IA cases and controls was conducted within DAISY. Controls, who were autoantibody- and T1D-free, were frequency matched to the cases on age at IA seroconversion of the case, race/ethnicity, and sample availability. A maximum of four study visits per child were selected to be included in the nested case-control study. After blood draw, plasma was separated immediately and snap-frozen in liquid nitrogen, then stored at −70°C. Blood draws were non-fasting.
Subject Selection
To examine predictors of oxylipin levels in a healthy pediatric population, we selected the controls from the DAISY nested case-control study since they were autoantibody and T1D-free. We selected controls in whom we had complete data for oxylipins as well as plasma levels, RBC levels, and dietary intake of the precursor FA. Of the 172 controls with oxylipin measurements, 51 were missing RBC FA measures, and an additional 10 children were missing diet intake data. Therefore, the population for this analysis is 111 autoantibody-free and T1D-free children from DAISY.
Measurement of Oxylipins
Oxylipins were quantified as described by Pedersen et al.22. Briefly, samples were allowed to thaw on wet ice; once thawed samples were inverted five times to homogenize plasma. Added to a 96-well plate was 50μL of sample plasma followed sequentially by 25μL anti-oxidant solution, 25μL of surrogate standards in methanol, 25μL of CUDA and PHAU standards in methanol, and 125μL acetonitrile/methanol 1:1. Plates were then vortexed for 30 seconds, centrifuged at 6°C for 5 min at 15,000 rcf and filtered through PVDC 0.2 micron filter-plate. Plates were then sealed and kept at -20°C until analysis.
Extracted oxylipins were separated and quantified using a Waters i-Class Acquity UHPLC system coupled to a Sciex 6500+ QTRAP mass spectrometer operated in negative ionization mode. Oxylipins were quantified by targeted, retention time specific, Multiple Reaction Monitoring (MRM) ion transitions. A total of 78 oxylipins were targeted, and targets that appeared in any sample above the signal-to-noise ratio of 3:1 were quantified. This resulted in quantified values for 27 n6-related oxylipins, including 17 ARA-related and 10 LA-related oxylipins. There were 12 n3-related oxylipins measured, which included 6 ALA-related, 4 DHA-related, and 2 EPA-related oxylipins. Two oxylipins (10-Nitrooleate and 9–10-e-DiHO) were quantified but not included in analyses because the precursor FA is oleic acid. Oxylipins measured in a sample below the limit of quantitation (LOQ), defined as signal-to-noise ratio below 3:1, were converted to 10% of the LOQ. Full names of all targeted oxylipins are listed in supplementary table 1. Oxylipins measured for this study along with precursor FA are displayed in Figure 1.
Environmental tobacco smoke
Data were collected to evaluate the children’s exposure to environmental tobacco smoke (ETS) via a questionnaire that inquired about whether either of the child’s parents smoked inside or outside the home. The questionnaire also asked if the child had regular contact with any other person, such as a babysitter or grandparent, who smoked or if the child smoked. No child in this study smoked. A child was considered exposed to ETS if either a parent or another caretaker of the child smoked. Seifert et al.23 showed that the responses to this ETS questionnaire were significantly associated with urine cotinine concentrations (a marker of tobacco smoke inhalation). Of the 111 subjects included in the study, 104 had a measure of ETS.
Precursor FA
Precursor FA measured in this study included linoleic acid (18:2n-6), arachidonic acid (20:4n-6), alpha-linolenic acid (18:3n-3), eicosapentaenoic acid (20:5n-3), and docosahexaenoic acid (22:6n-3). The association of oxylipins and the precursor FA was tested through 3 different measures of precursor FA: dietary intake, RBC membrane, and plasma levels. In addition, for RBC membrane and dietary measures, the ratio of n6:n3 was tested, in order to reflect enzyme competition between n6 and n3 FA4,7.
Dietary Intake Measures
A 111-item semi-quantitative food frequency questionnaire (FFQ) that has been validated for use in children was administered annually to parents starting at the age of 2 years, about the previous year’s dietary intake of their child24. After the age of 10 years, children recalled their own diets by completing the youth/adolescent questionnaire25. As previously reported, both questionnaires produce similar estimates of nutrients and may be combined during analyses25. The dietary intake variables do not include fatty acid intake via supplements (only 3 subjects in our study sample ever reported taking a n3 fatty acid supplement). The youngest age in our study sample was 1.2 years and only 3 subjects were still being breast-fed at that time; therefore, we were not able to evaluate the role of breastfeeding in this study.
Plasma FA Levels
Plasma free (non-esterified) fatty acids were first extracted by a modified liquid-liquid extraction29. An Agilent 1290A Infinity Ultra High-Performance Liquid Chromatography system coupled to an Agilent Accurate Mass-6530-QTOF (UHPLC-QTOF) mass spectrometer were used for separation and quantification of precursor FA. Reference pooled plasma samples were used to monitor data quality and instrument performance. An in-house accurate mass and retention time library developed from analysis of authentic standards as well as matching tandem mass spectra to LipidBlast virtual MS/MS database was used to identify free fatty acids26. Free fatty acid data were normalized to the class-specific internal standard and reported as concentration.
Next, free fatty acid levels of the precursor FA were measured through reverse phase chromatography using an Acquity Charged Surface Hybrid (CSH) C18 UPLC column (100 × 2.1 mm, 1.7 micron particle size, Waters Corp., Milford, MA, USA). Mobile phase A consisted of 60% acetonitrile in water and mobile phase B consisted of 10% acetonitrile in isopropanol, both mobile phases contained 10mM ammonium acetate. Column was maintained at 65°C with a 0.6 mL/min flow rate. The precursor FA were then quantified through an external calibration curve with pure standards and normalizing signal to d3-labeled palmitic acid that was present in both the sample and calibration curve.
RBC membrane total fatty acid analysis
To quantify total fatty acids in the red blood cell (RBC) membrane, RBCs were separated within 30 minutes of the blood draw and then flash frozen with liquid nitrogen. Samples were stored at -80°C. The Bligh and Dyer method was used to extract lipids from RBCs, then lipid isolates were flushed with nitrogen gas, sealed in cryotubes, and stored at -20°C. The Maxwell and Marmer base catalyzed method was used to methylate the fatty acids in the lipid isolates (Hewlett-Packard 6890; Agilent, Santa Clara, CA, USA). Using gas chromatography with mass spectral detection, samples were separated across a CP-WAX column (25 m × 0.25 mm i.d., 0.2 μm film; Varian, Palo Alto, CA, USA). FA were identified by comparing m/z and retention times of selected ions from analytes to authentic standards (NuCheckPrep; Elysian, MN, USA; Supelco; St. Louis, MO, USA). Five-point standard curves were used for quantitation. RBC levels of precursor FA are reported as gram fatty acid/100 g red blood cell lipid.
Statistical Methods
Linear mixed models using PROC MIXED in SAS version 9.4 (SAS institute, Cary, NC, USA) were used to evaluate the association between oxylipin levels and age, sex, race/ethnicity, ETS, and measures of the precursor FA (dietary intake, RBC membrane levels, and plasma levels). Data on oxylipin levels and plasma levels of the precursor FA were transformed using box-cox transformation, and then standardized to have a mean of 0 and standard deviation of 1 so that effect sizes could be compared. No transformation was successful in normalizing the distribution of lipoxin A4; therefore, we dichotomized this variable as present or absent (subjects with levels below LOQ were categorized as absent). In all analyses, oxylipin level was evaluated as the outcome.
We would expect potentially different covariates for each oxylipin; therefore, to identify these potential covariates we first tested the association between oxylipin levels and age, sex, and race/ethnicity. Age was tested for linear, quadratic, and cubic trends, and these models were compared. Models were tested using compound symmetry, a random intercept, or a random intercept and slope. AIC was used to assess goodness of fit. The model with the lowest AIC when comparing covariance structures and polynomial trends was selected. If age, age2, age3, sex, race/ethnicity, or ETS were significantly associated with oxylipin levels, models were adjusted for those variables going forward. Because DAISY recruited participants based on HLA genotype, we also tested the association between HLA genotype and oxylipin levels. One oxylipin (8S-HETE) was significantly associated with HLA genotype (p-value 0.0272), so all subsequent analyses for 8S-HETE were adjusted for HLA genotype.
Once the base model was established for each oxylipin, measures of exposure to the precursor FA (plasma levels, RBC levels, and dietary intake of the precursor FA and the n6:n3 ratio) were tested in the model individually. The same model selection procedure was used when testing associations for the precursor FA. For all analyses, an alpha level of 0.05 was considered statistically significant.
Results
Study Population
The population was 47% female and 79% non-Hispanic white (NHW) (Table 1), with ages ranging 1–17 years. Almost 78% of the population had the HLA-DR3/4 high-risk genotype, and 61% had a first degree relative with T1D. Twenty-four percent of the children were exposed to environmental tobacco smoke. Oxylipin levels (untransformed) and intakes of the precursor FA are presented by age quartile in supplementary tables 2 and 3, respectively.
Table 1:
Descriptive Characteristics of the Study Subjects
| Variable | n(%), n=111 |
|---|---|
| Number of Visits | |
| One visit | 44(39.6) |
| Two visits | 51(46.0) |
| Three visits | 15(13.5) |
| Four visits | 1(0.9) |
| High-risk HLA-DR3/4 genotype* | |
| Yes | 86(77.5) |
| No | 25(22.5) |
| Has first degree relative with T1D | |
| Yes | 68(61.3) |
| No | 43(38.7) |
| Sex | |
| Female | 52(46.8) |
| Male | 59(53.2) |
| Ethnicity† | |
| NHW | 88(79.3) |
| Other | 23(20.7) |
| Environmental Tobacco Smoke | n(%), n=104 |
| Exposed | 25(24.0) |
| Never Exposed | 79(76.0) |
High-risk genotype was defined as HLA-DRB1*04, DQB1*0302/DRB1*0301, DQB1*0201 (DR3/4 DQ8)
Other ethnicity included Hispanic-American and African-American study subjects
Age, Sex, Race/Ethnicity
We first examined whether age, sex, and race/ethnicity were associated with each oxylipin (Table 2). Among n6-oxylipins, 5-HETE, 8,9-DiHETrE, 8S-HETE, 11,12-DiHETrE, 12-HETE, 14,15-DiHETrE, PGE2, 9(10)-EpOME, 9,10-DiHOME, 9,12,13-TriHOME, and 9-HOTE decreased with age whereas 9-HETE, 15-HETE, and 15-KETE increased with age. Of the n3-oxylipins, 19,20-DiHDPE decreased with age, and α-9(10)-EpODE, α-12(13)-EpODE, 15,16-DiHODE, 14-HDoHE, and 17-HDoHE increased with age. The oxylipins 15-KETE, 12,13-EpOME, and α-12(13)-EpODE exhibited significant quadratic age trends (Figure 2). PGE2, an ARA oxylipin, was significantly associated with sex, where females had higher PGE2 than males. The ARA oxylipin PGF2-α was significantly higher in males compared to females. The n6-oxylipins, 15-KETE, PGE2, 9,12,13-TriHOME, and the n3-oxylipin 17,18-DiHETE were significantly higher in NHW compared to other race/ethnicities. Trajectory of oxylipin levels with age is presented for selected oxylipins: A: 12(13) EpOME, B: 19,20-DiHDPE, and C: 14-HDoHE in Figure 2. These demonstrate an oxylipin that has a quadratic relationship with age (A), and oxylipins that decrease (B), and increase (C) significantly with age. Oxylipin levels by race/ethnicity for 9,12,13-TriHOME are illustrated in Figure 3.
Table 2:
Association of Oxylipin with Age, Sex, and Ethnicity
| Oxylipin | Precursor FA | β estimate for age p-value |
β estimate for sex (Female) p-value |
β estimate for ethnicity (NHW) p-value |
|---|---|---|---|---|
| β estimate for age2 p-value | ||||
| n6-related oxylipins | ||||
| 9(10)-EpOME* | LA |
−0.078 <0.0001 |
−0.016 0.9070 |
−0.142 0.4317 |
| 9,10-DiHOME* | LA |
−0.043 0.0144 |
0.062 0.6952 |
−0.274 0.1729 |
| 9,12,13-TriHOME* | LA |
−0.058 0.0007 |
0.207 0.1554 |
−0.430 0.0221 |
| 9-HODE* | LA | 0.010 0.5713 |
0.010 0.9475 |
−0.311 0.1259 |
| 9-HOTE* | LA |
−0.050 0.0043 |
0.033 0.8257 |
−0.266 0.1709 |
| 9-KODE* | LA | −0.029 0.0958 |
0.040 0.7943 |
−0.383 0.0541 |
| 12(13)-EpOME* | LA |
0.218 0.0002 |
0.077 0.6160 |
−0.194 0.3177 |
|
−0.013 0.0002 | ||||
| 12,13-DiHOME* | LA | −0.013 0.4521 |
0.093 0.5607 |
−0.208 0.3057 |
| 13-HOTE* | LA | −0.021 0.2189 |
0.095 0.5433 |
−0.261 0.1902 |
| 13S-HODE* | LA | −0.021 0.2262 |
0.125 0.4068 |
−0.380 0.0500 |
| 5-HETE* | ARA |
−0.051 0.0032 |
−0.017 0.9708 |
0.206 0.2671 |
| 5,6-DiHETrE* | ARA | −0.026 0.1431 |
−0.247 0.1227 |
0.069 0.7332 |
| 6-trans-LTB4‡ | ARA | −0.031 0.0584 |
−0.135 0.3184 |
0.035 0.8436 |
| 8,9-DiHETrE* | ARA |
−0.066 0.0002 |
0.178 0.2501 |
0.034 0.8617 |
| 8S-HETE*§ | ARA |
−0.055 0.0019 |
0.042 0.7913 |
0.001 0.9952 |
| 9-HETE* | ARA |
0.050 0.0036 |
0.206 0.1656 |
−0.062 0.7412 |
| 11,12-DiHETrE* | ARA |
−0.112 <0.0001 |
−0.176 0.1939 |
−0.216 0.2097 |
| 11-HETE‡ | ARA | −0.022 0.1834 |
0.012 0.9324 |
0.126 0.4822 |
| 12S-HETE* | ARA |
−0.048 0.0048 |
−0.177 0.2115 |
0.104 0.5669 |
| 14,15-DiHETrE* | ARA |
−0.095 <0.0001 |
−0.127 0.3824 |
−0.230 0.2126 |
| 15-HETE‡ | ARA |
0.047 0.0019 |
−0.035 0.7692 |
0.177 0.2696 |
| 15-KETE* | ARA |
0.301 <.0001 |
−0.006 0.9662 |
−0.367 0.0417 |
|
−0.015 <.0001 | ||||
| Lipoxin A4‡ | ARA | 0.008 0.2933 |
−0.066 0.3271 |
−0.009 0.9180 |
| LTB4* | ARA | −0.021 0.2239 |
−0.010 0.9486 |
0.042 0.8248 |
| PGD2* | ARA | 0.023 0.1942 |
−0.053 0.7248 |
−0.290 0.1365 |
| PGE2* | ARA |
−0.047 0.0039 |
0.369 0.0070 |
−0.405 0.0210 |
| PGF2-alpha* | ARA | 0.028 0.1060 |
−0.340 0.0245 |
0.148 0.4356 |
| n3-related oxylipins | ||||
| Alpha-9(10)-EpODE* | ALA |
0.052 0.0047 |
−0.131 0.4214 |
0.030 0.8849 |
| 9,10-DiHODE* | ALA | −0.006 0.7339 |
0.022 0.8943 |
−0.103 0.6151 |
| Alpha-12(13)-EpODE† | ALA |
0.482 0.0009 |
−0.096 0.5558 |
−0.156 0.4487 |
|
−0.012 0.0026 | ||||
| 12,13-DiHODE* | ALA | 0.032 0.0715 |
−0.072 0.6474 |
−0.020 0.9202 |
| 15,16-EpODE* | ALA | 0.031 0.0791 |
−0.143 0.3647 |
0.057 0.7732 |
| 15,16-DiHODE† | ALA |
0.046 0.0110 |
0.065 0.6866 |
−0.016 0.9372 |
| 4-HDoHE* | DHA | −0.020 0.2492 |
−0.163 0.2803 |
−0.119 0.5373 |
| 14-HDoHE* | DHA |
0.040 0.0180 |
−0.138 0.3323 |
0.213 0.2504 |
| 17-HDoHE‡ | DHA |
0.060 0.0004 |
−0.040 0.7737 |
−0.009 0.9608 |
| 19,20-DiHDPE† | DHA |
−0.076 <0.0001 |
−0.181 0.2287 |
−0.374 0.0574 |
| 15-HEPE‡ | EPA | 0.008 0.2933 |
−0.068 0.3271 |
−0.008 0.9180 |
| 17,18-DiHETE* | EPA | 0.005 0.7542 |
−0.135 0.4225 |
−0.627 0.0038 |
β estimate and p-values are from models with age, age2 (if significant), sex, and NHW
Bolding signifies p-value<0.05
Modeled using a mixed model with a random intercept
Modeled using a mixed model with a random intercept and slope
Modeled using a mixed model with compound symmetry
Also adjusted for HLA genotype
Figure 2:
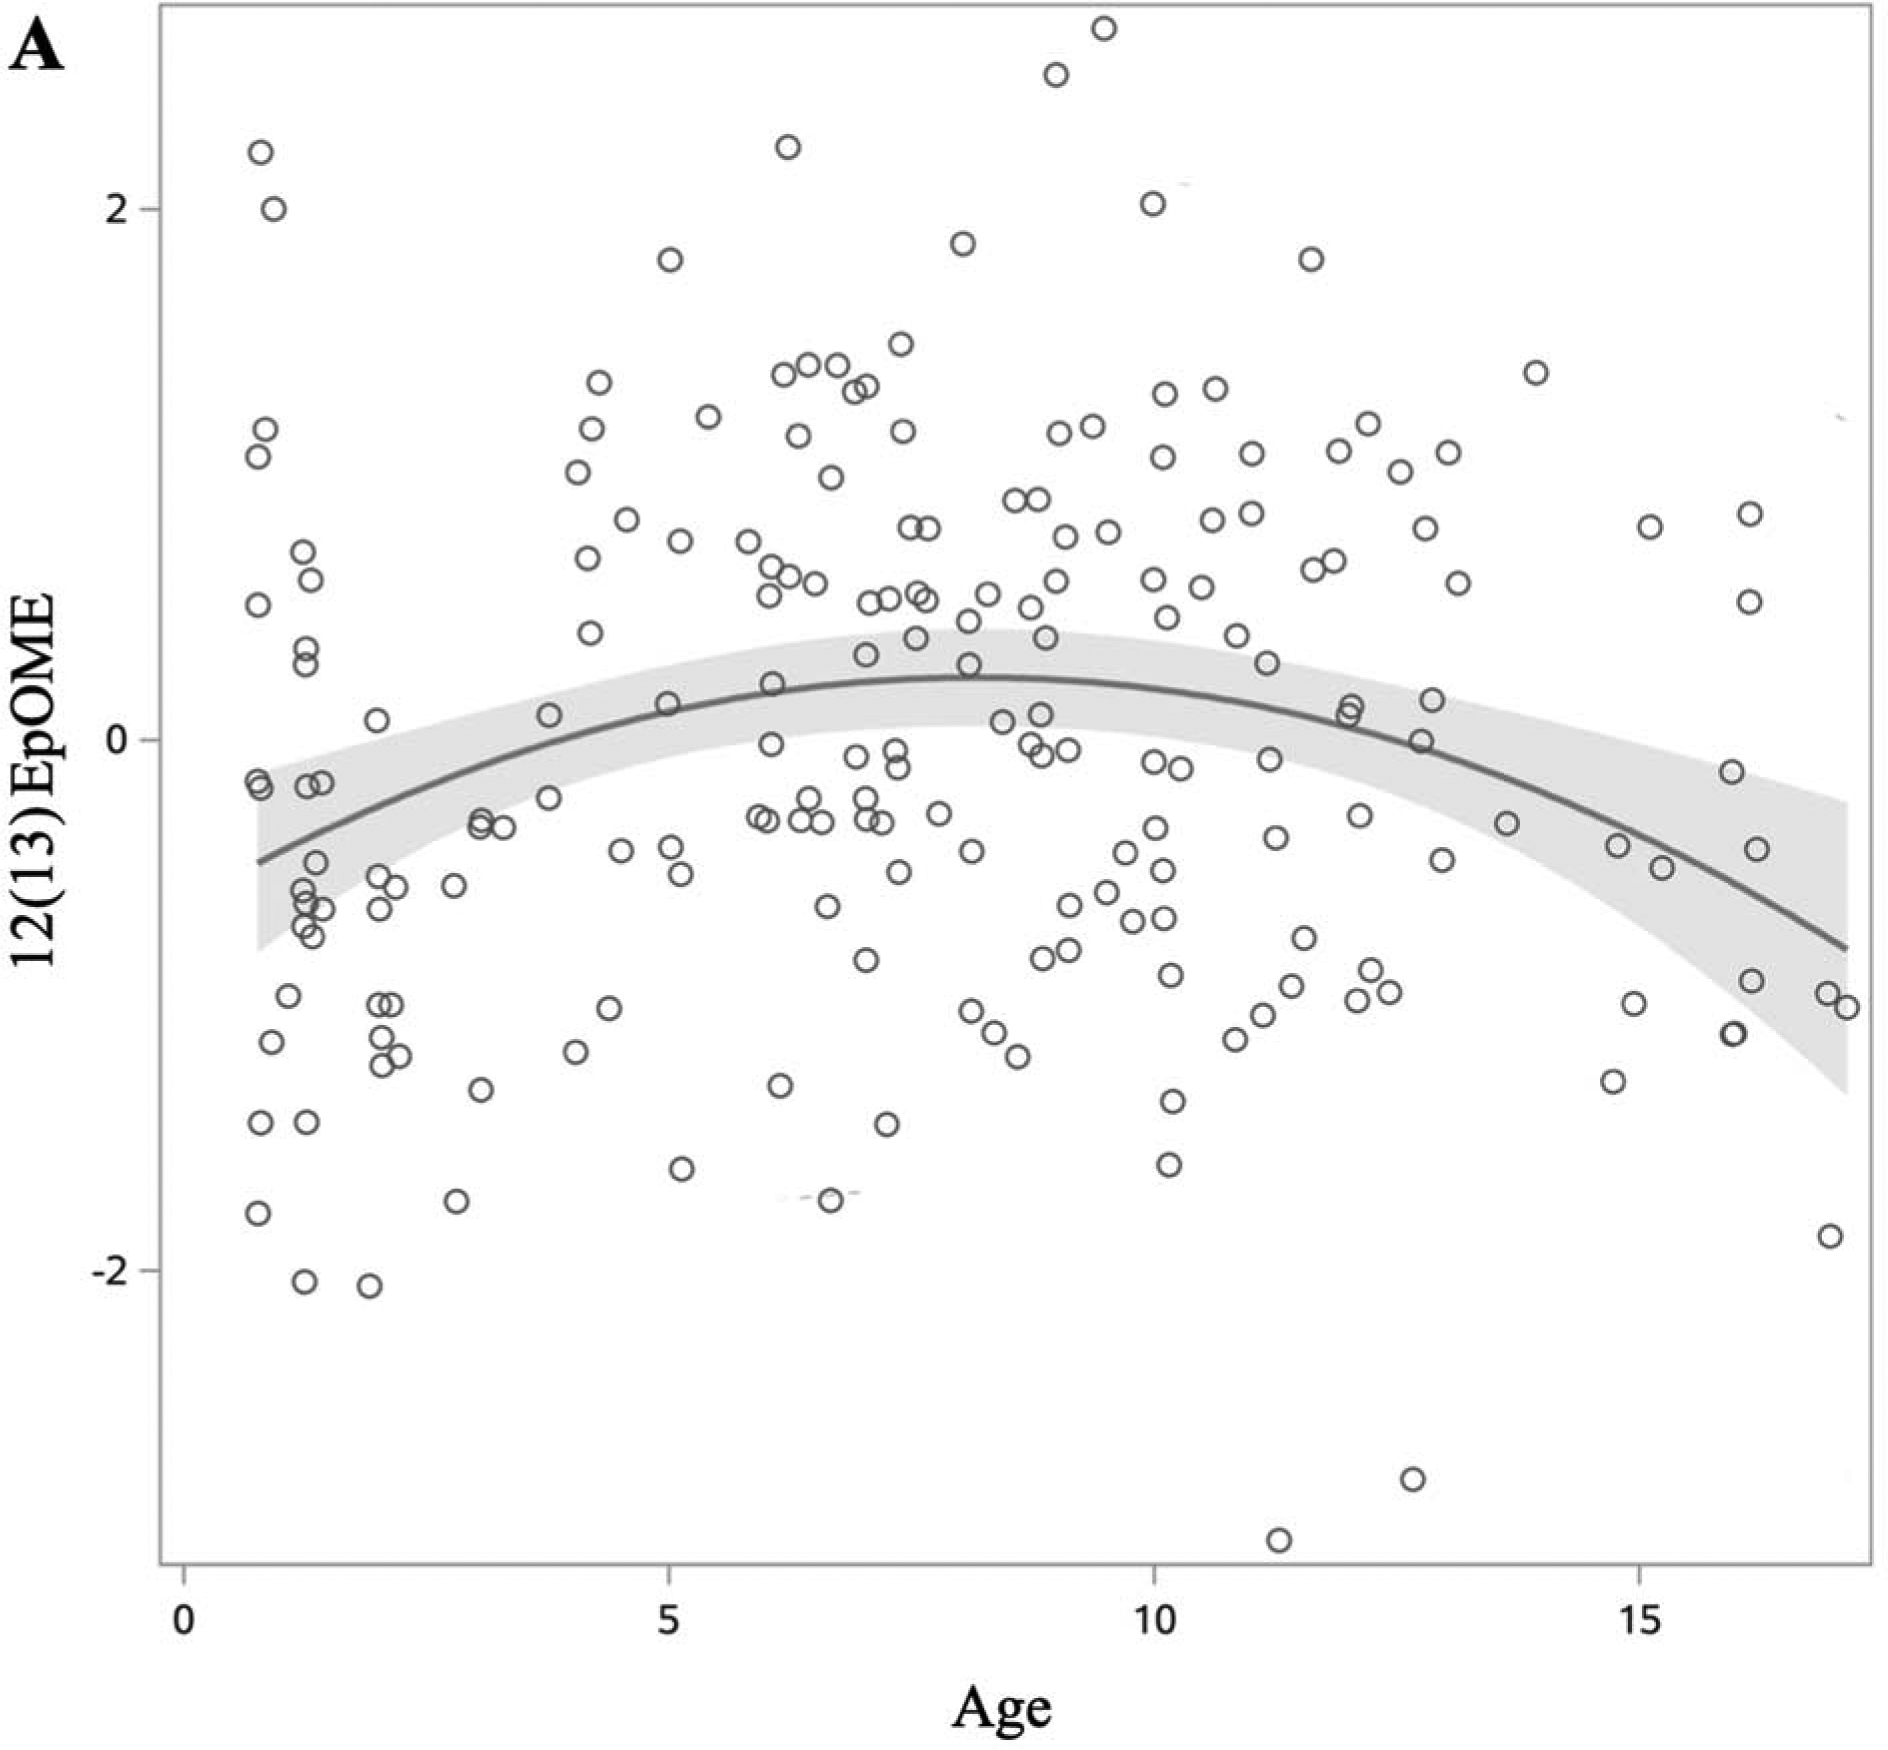
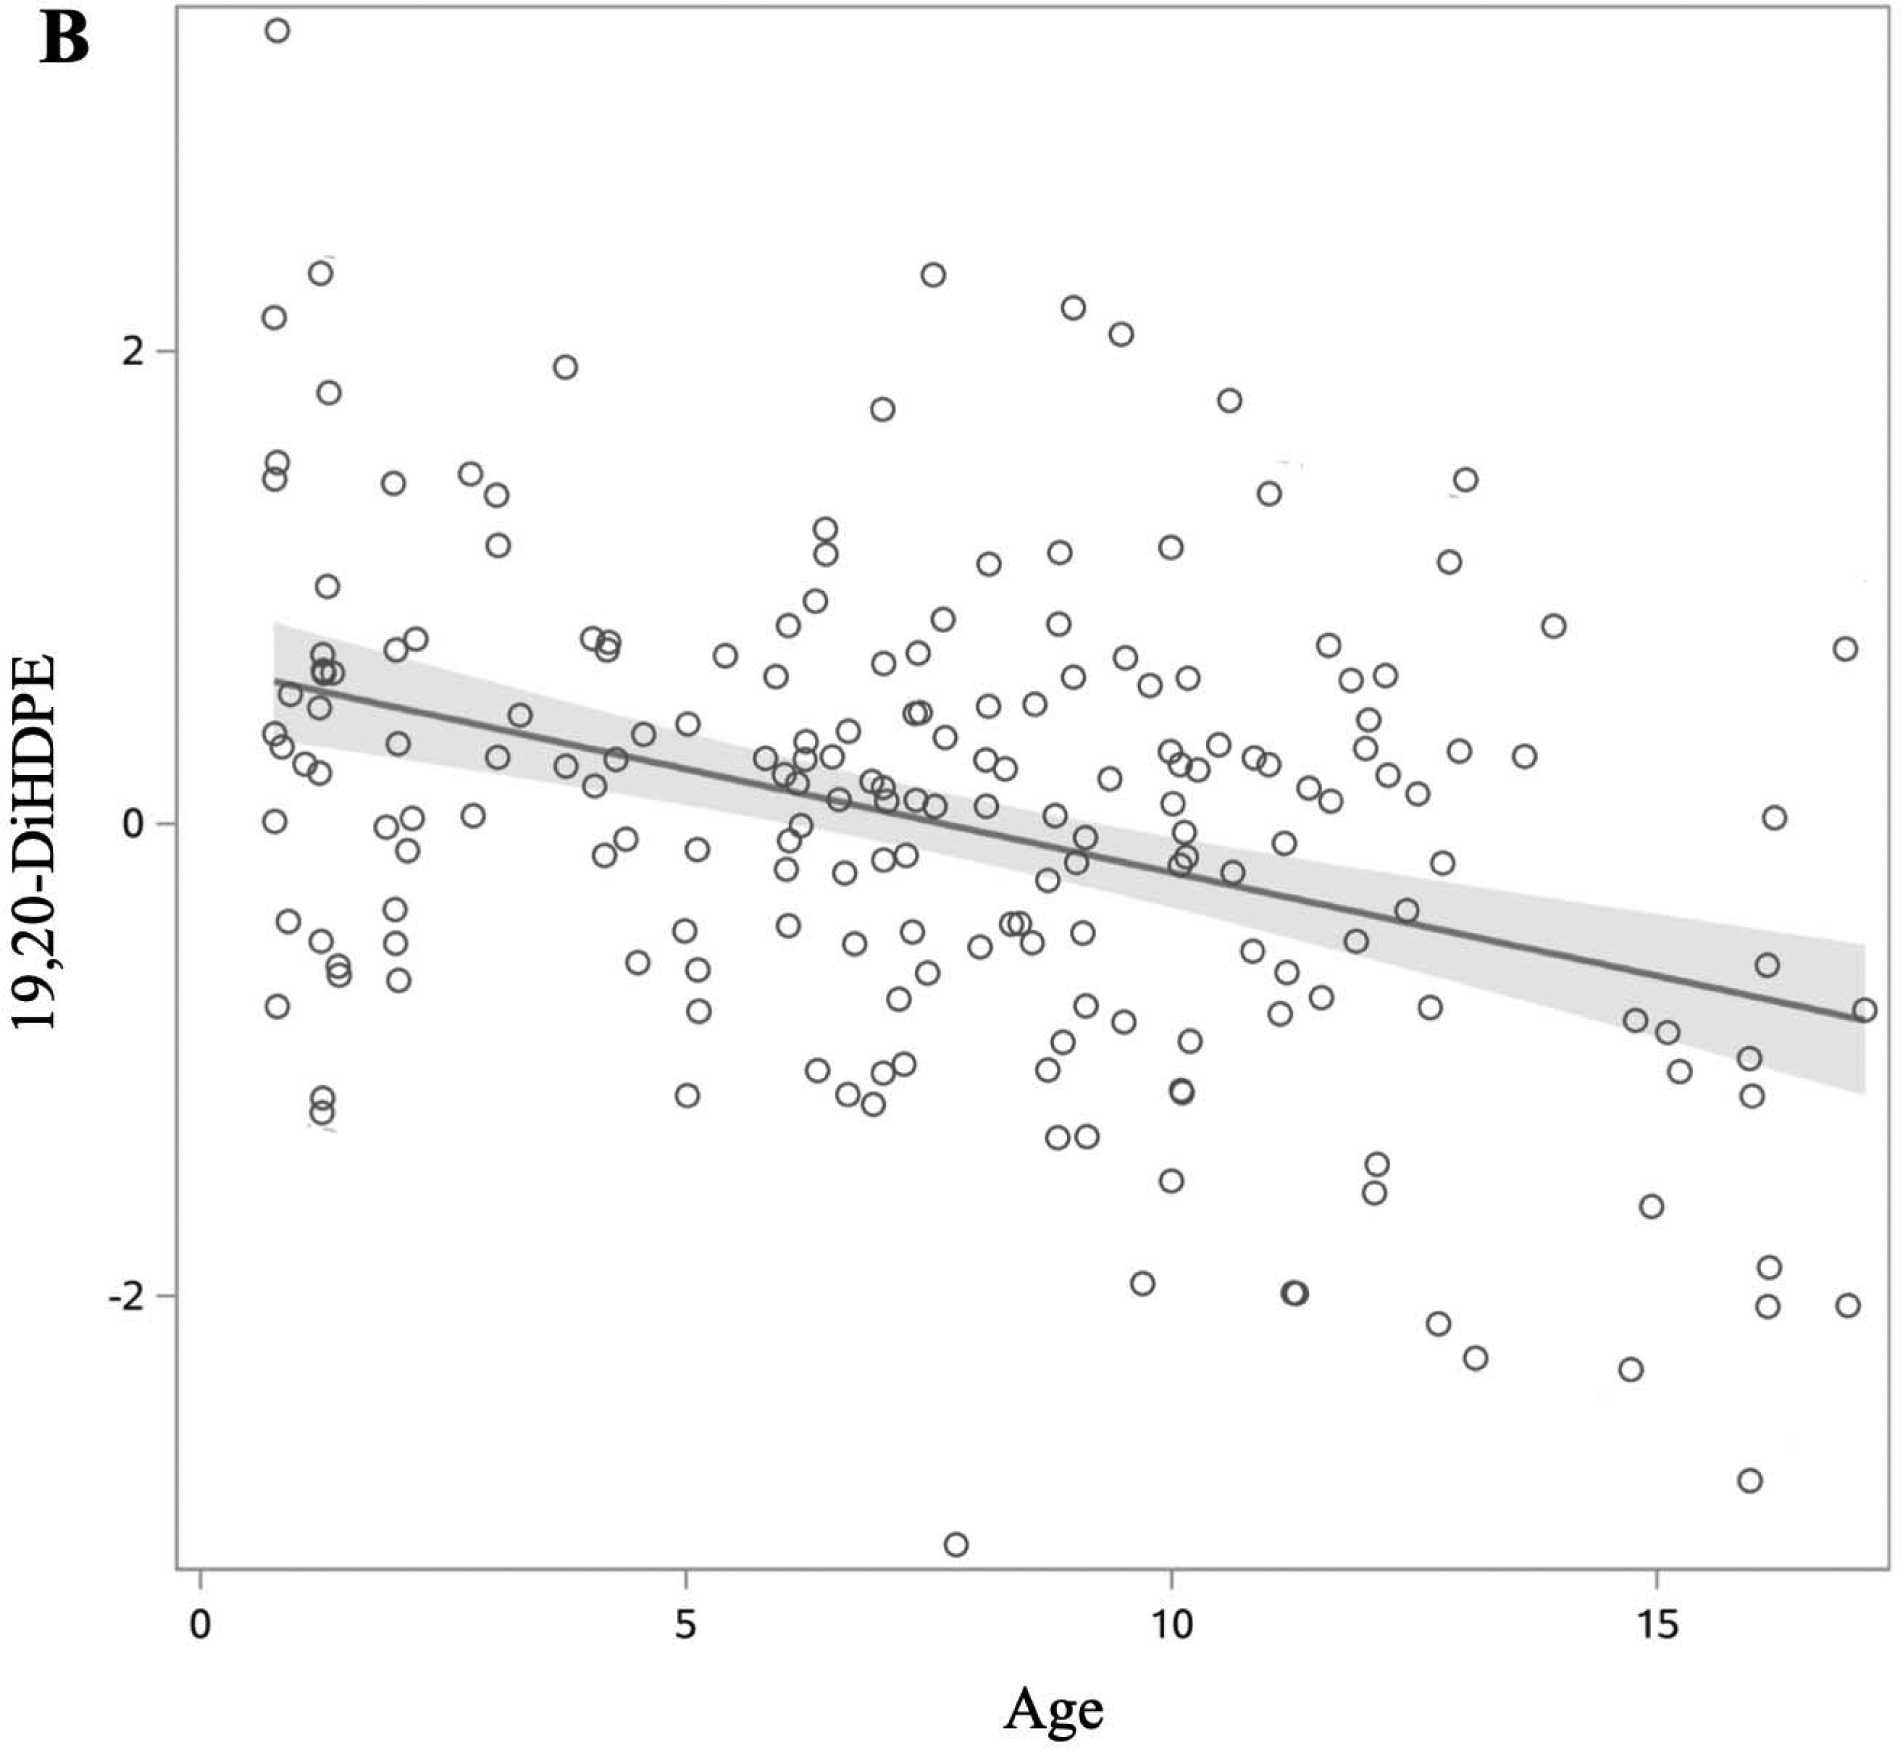
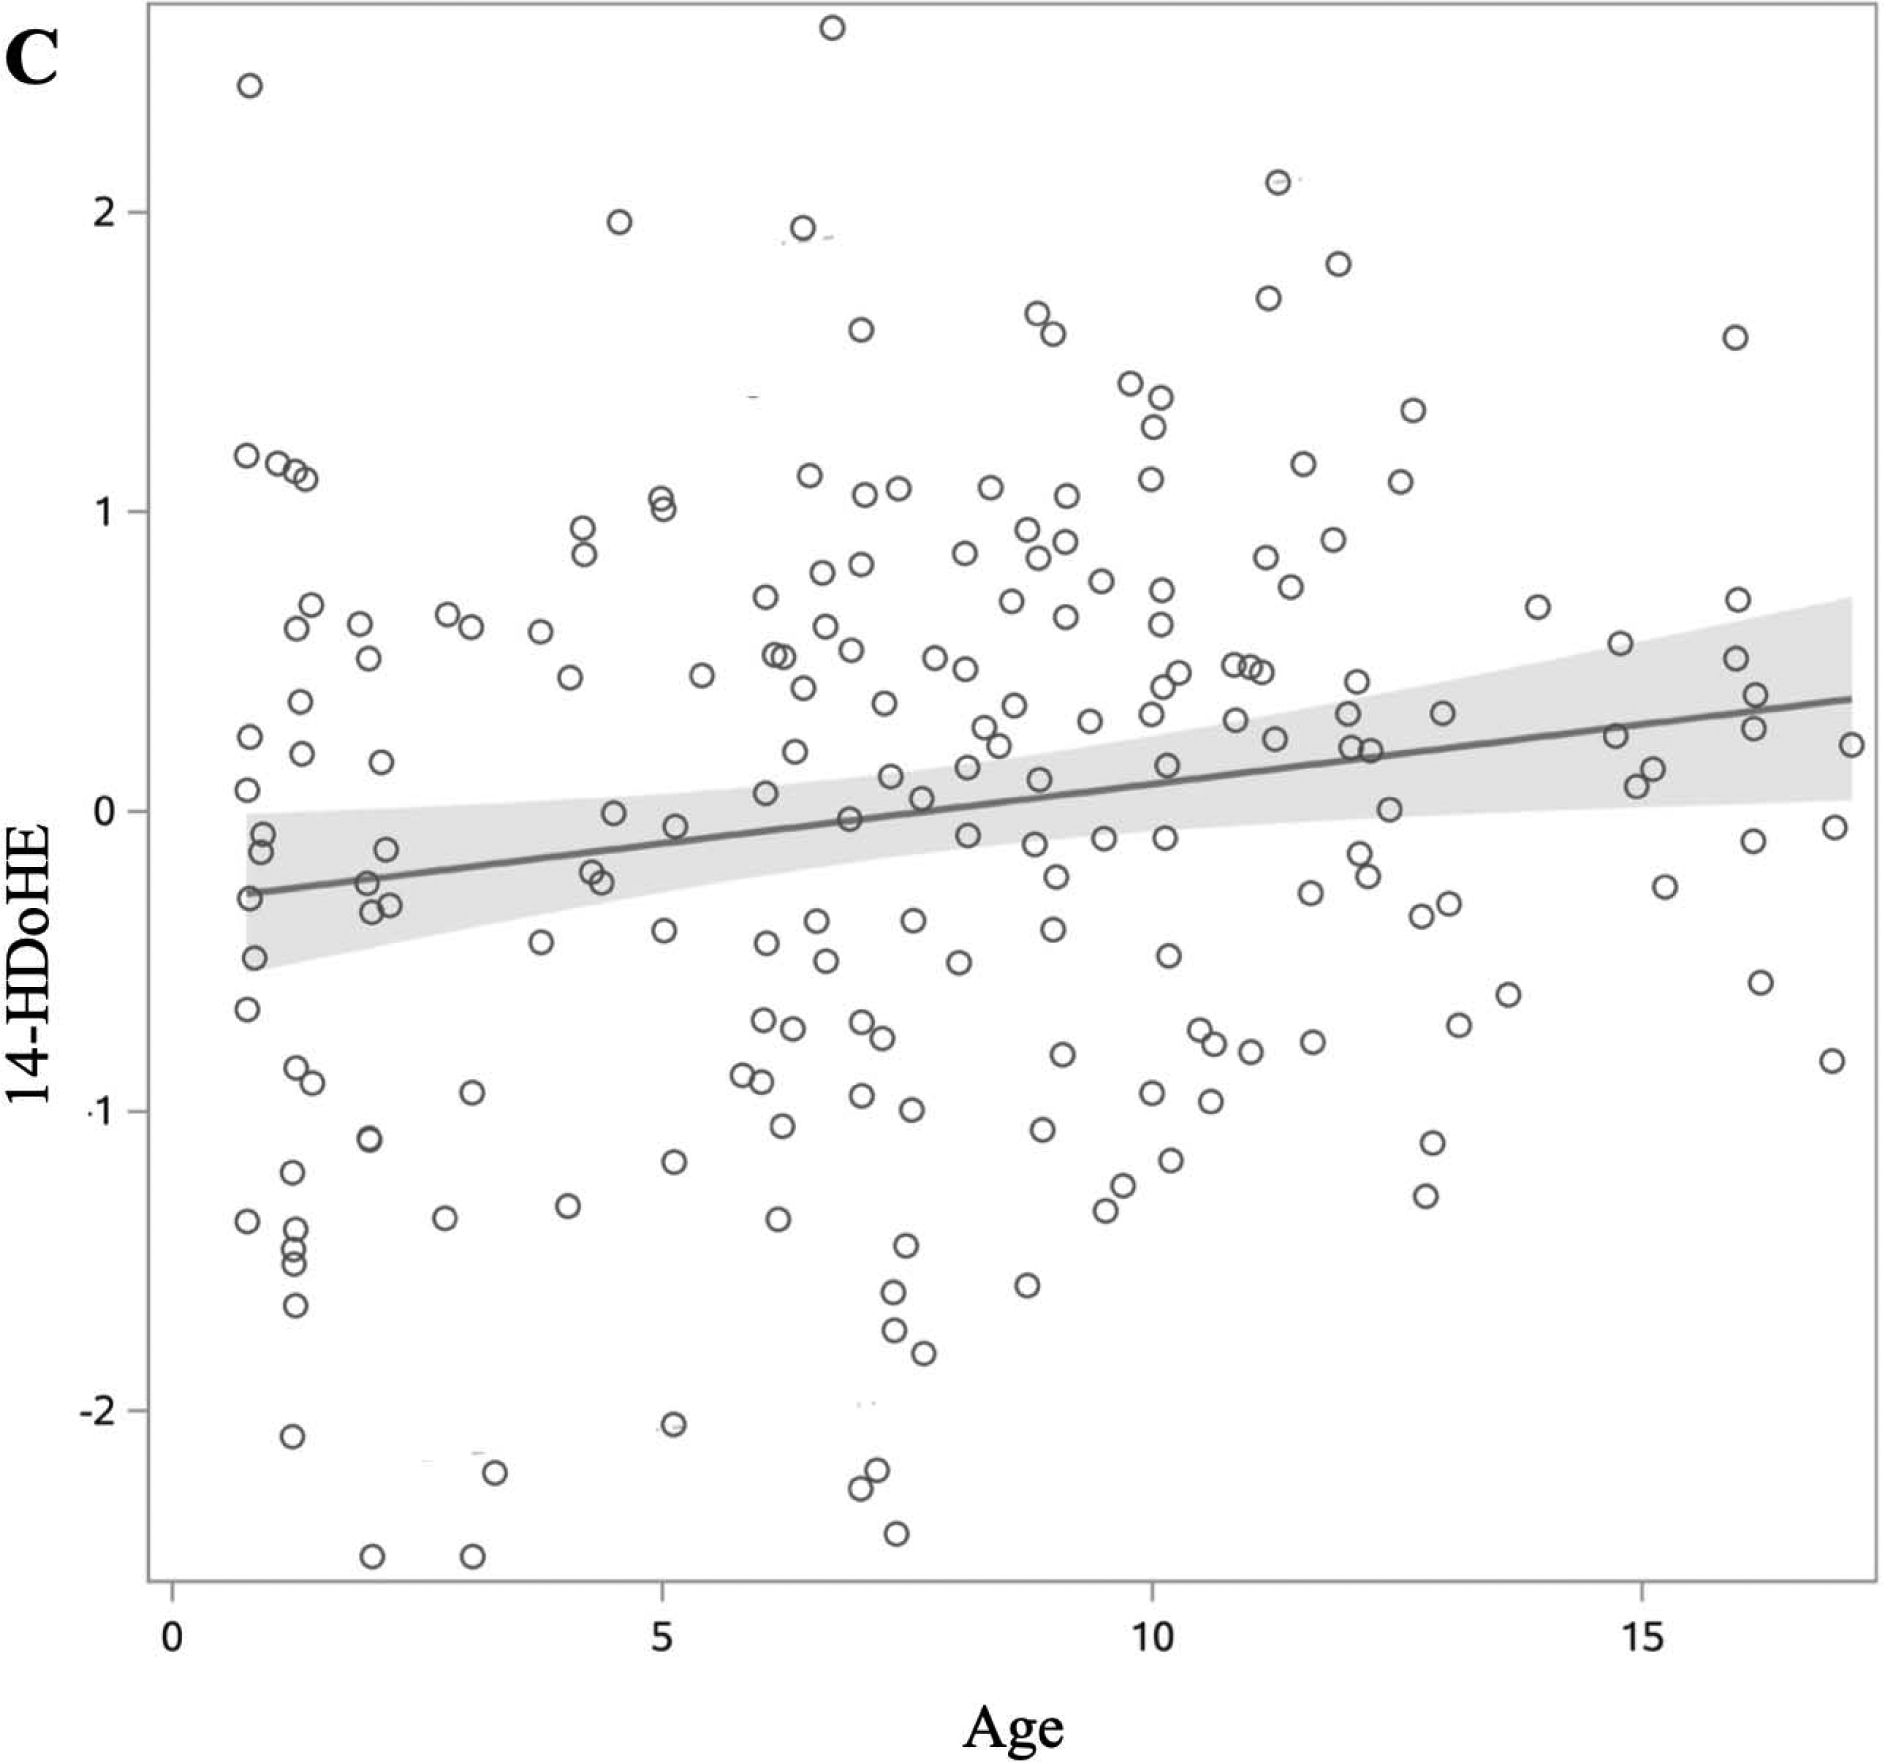
Changes in oxylipin values by age in DAISY children without islet autoimmunity or T1D (age range 1–17 years). Oxylipin values were box-cox transformed and standardized. Each open circle represents a visit rather than an individual. Solid lines represent slope of oxylipin change over age, with estimates derived from the model presented in table 2. 95% confidence limit of the estimated slope is shown by the shaded area. Of the 22 oxylipins significantly associated with age, we present three examples to demonstrate a quadratic relationship (A), and oxylipins that decrease (B) and increase (C) with age. A: 12(13)-EpOME (Precursor FA: LA). B: 19,20-DiHDPE (Precursor FA: DHA). C: 14-HDoHE (Precursor FA: DHA).
Figure 3:
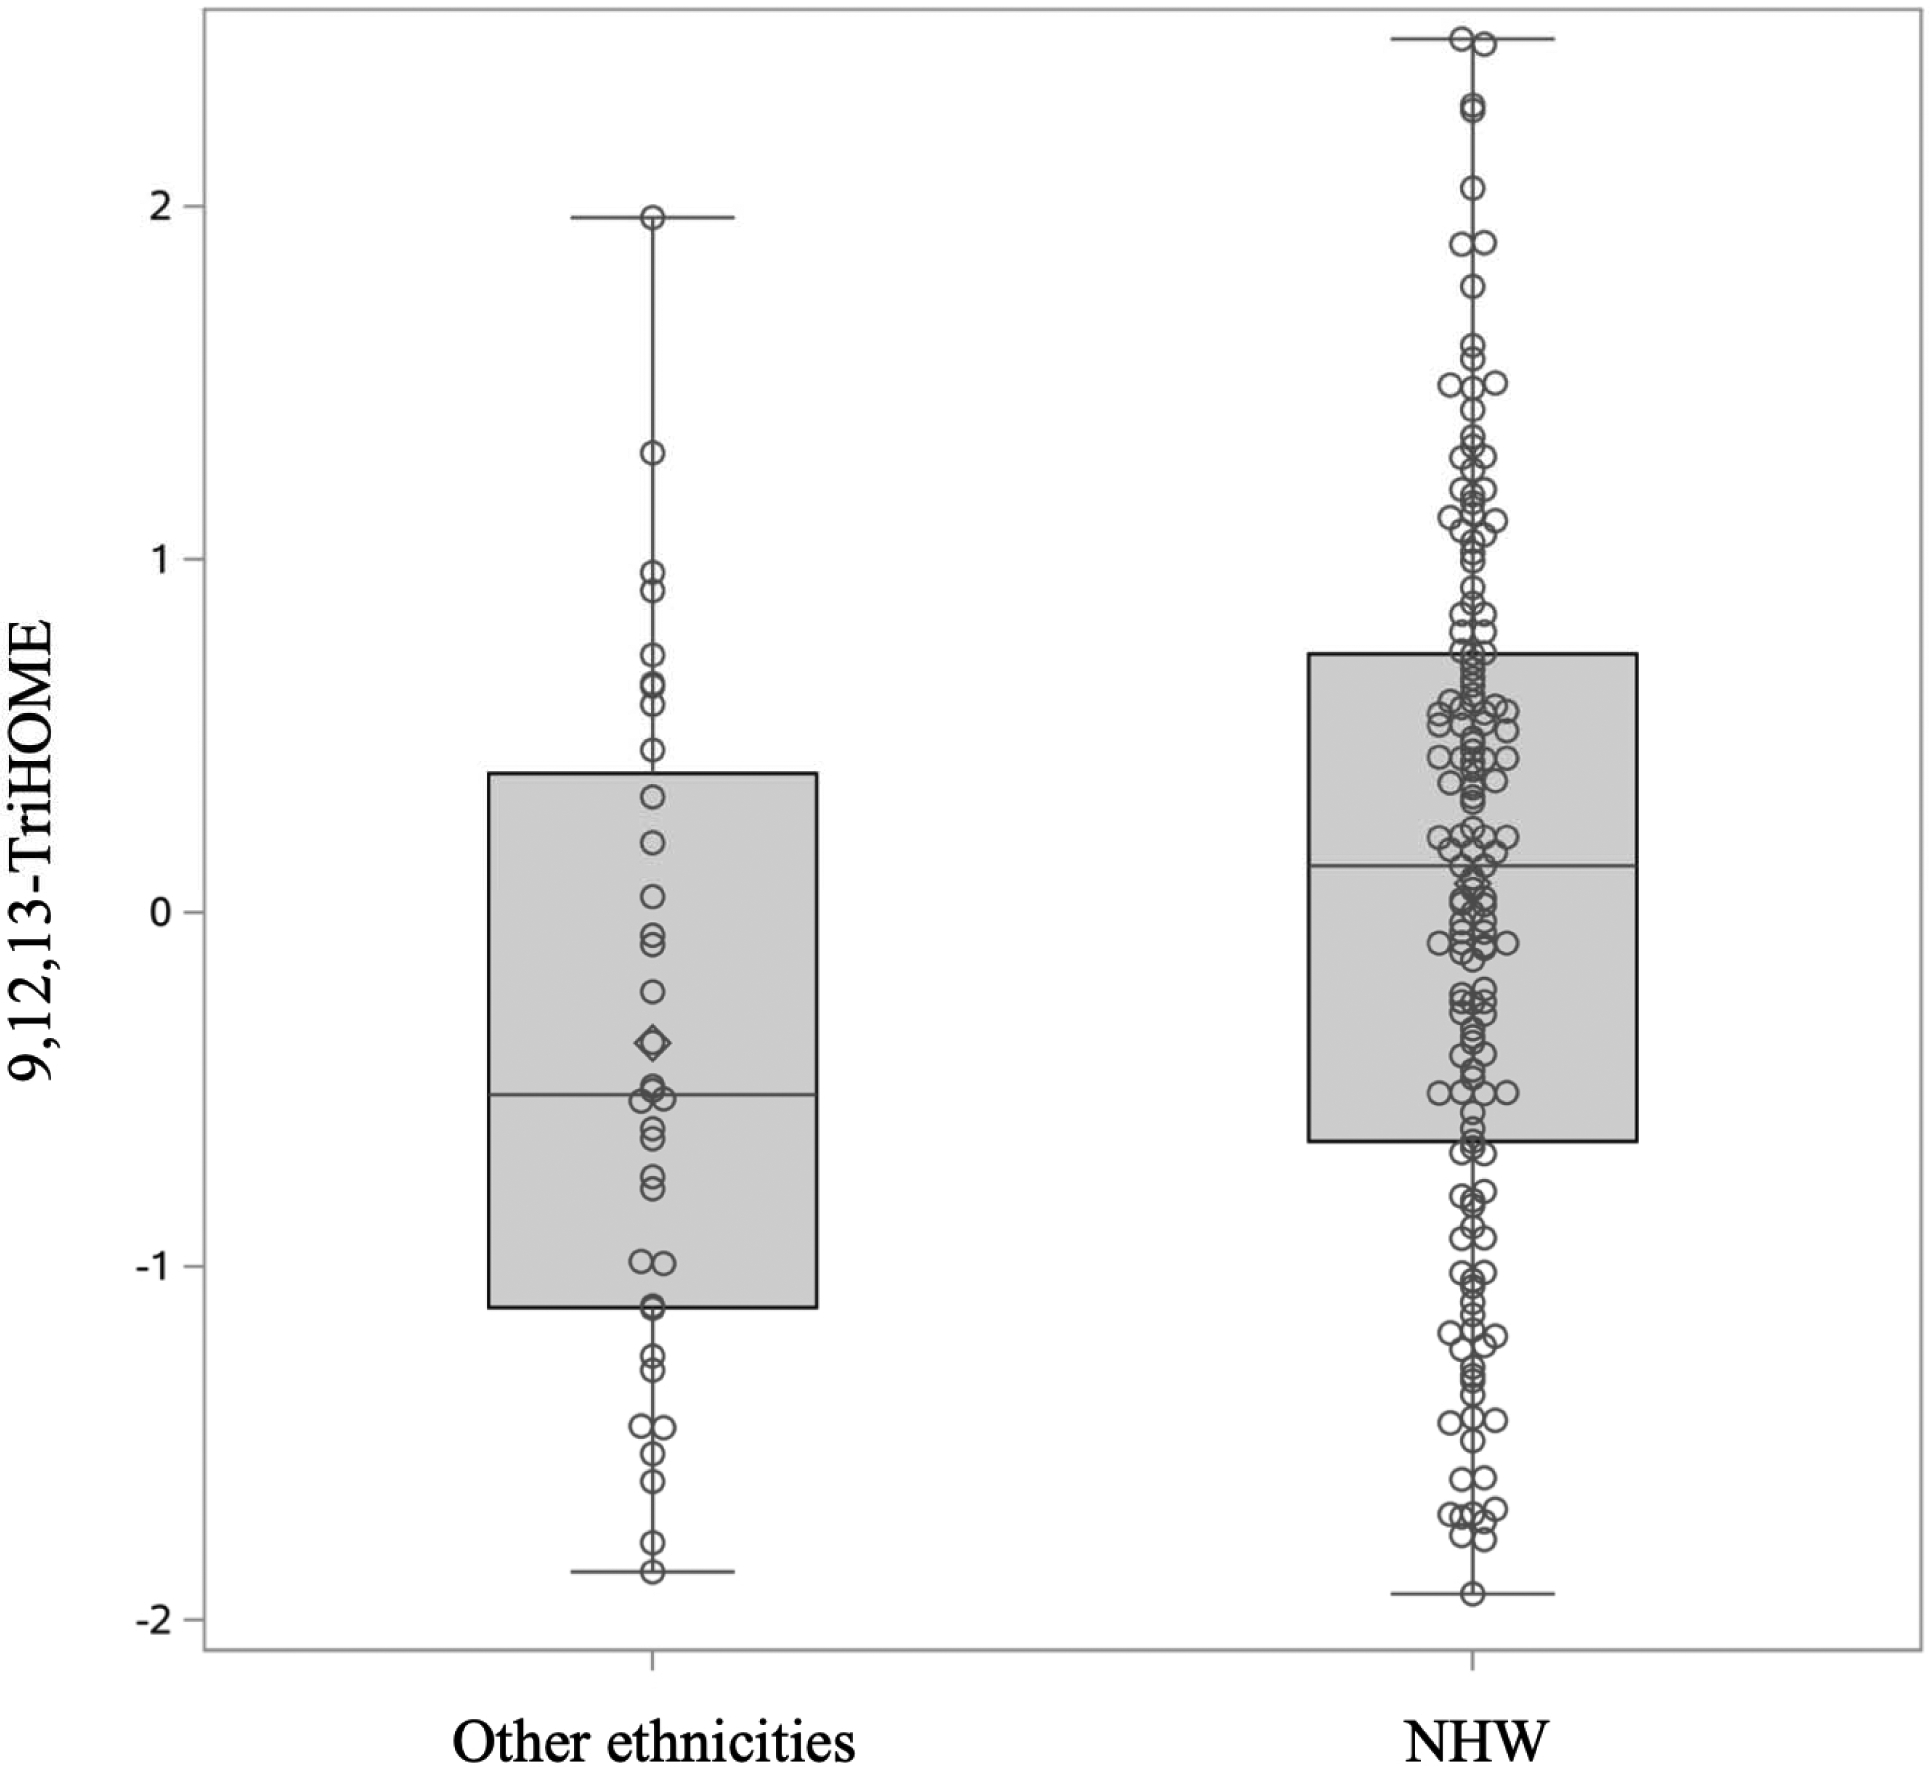
Differences in 9,12,13-TriHOME (precursor FA: LA) between NHW and other ethnicities. 9,12,13-TriHOME was higher in NHW children compared to those with other race/ethnicity (p-value 0.0221). Oxylipin values were box-cox transformed and standardized.
Environmental Tobacco Smoke (ETS)
After adjusting for age, 8,9-DiHETrE, an ARA-related oxylipin, was significantly lower in children exposed to ETS than those not exposed (p-value 0.0006) (Figure 4). Presence of the ARA oxylipin lipoxin A4 was significantly associated with smoking exposure (p-value 0.0086). Results from all oxylipins are presented in supplementary table 2.
Figure 4:
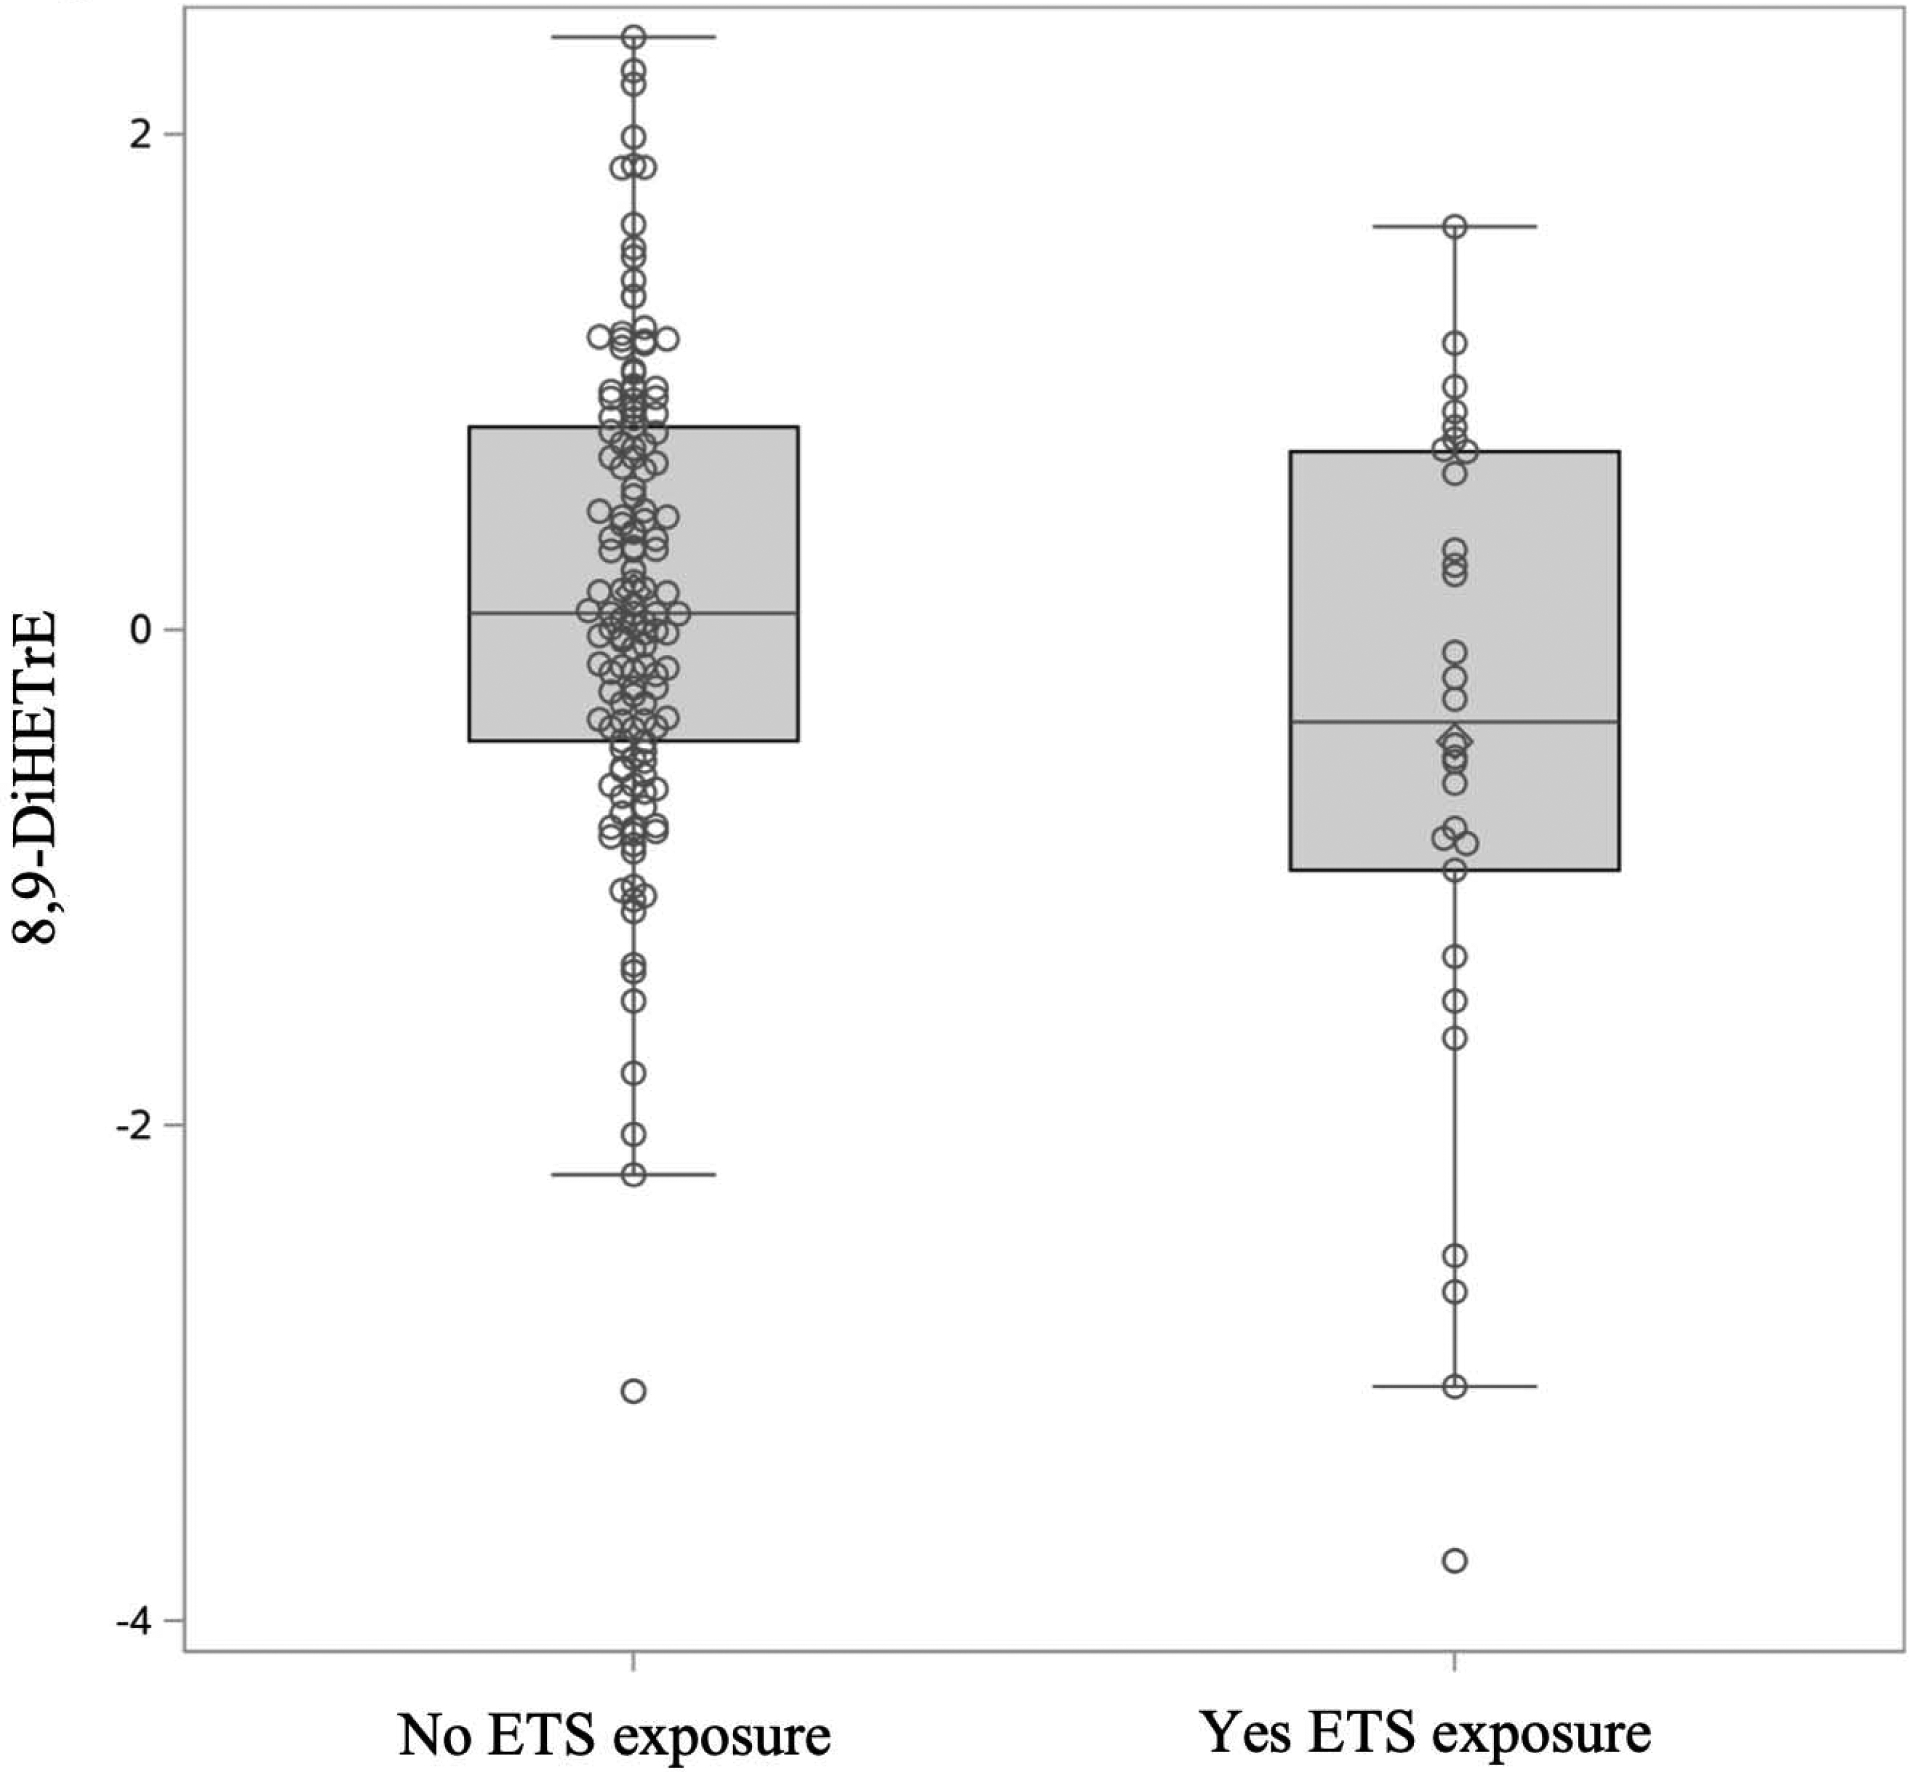
Differences in 8,9-DiHETrE values (precursor FA: ARA) between those exposed and not exposed to ETS. 8,9-DiHETrE was higher in those not exposed to ETS (p-value 0.0006). Oxylipin values were box-cox transformed and standardized.
Dietary intake
Adjusting for age, sex, and race/ethnicity (where appropriate), we examined the association between dietary intake and oxylipins. Higher intake of EPA was associated with higher 15-HEPE (Table 3). Higher intake of the n6:n3 FA ratio was associated with lower levels of n3-related oxylipins (12,13-DiHODE, 17,18-DiHETE, 14-HDoHE). None of the n6-related oxylipins were associated with dietary intake of their precursor FA, nor dietary intake of the n6:n3 FA ratio (Table 3).
Table 3:
Association of oxylipin levels with dietary, plasma, and RBC precursor FA
| Oxylipin | Precursor | Enzyme | Dietary Intake | Plasma | RBC | ||
|---|---|---|---|---|---|---|---|
| β estimate for precursor p-value |
β estimate for n6:n3 p-value |
β estimate for precursor p-value |
β estimate for precursor p-value |
β estimate for n6:n3 p-value |
|||
| n6 | |||||||
| 9(10)-EpOME*1 | LA | CYP450 | 0.004 0.7316 |
0.033 0.2586 |
0.343 <.0001 |
0.022 0.4659 |
0.027 0.5375 |
| 9,10-DiHOME*1 | LA | CYP450 sEH | 0.004 0.7569 |
0.004 0.8999 |
0.317 <.0001 |
0.044 0.1522 |
0.011 0.8070 |
| 9,12,13-TriHOME*5 | LA | 12/15-LOX | 0.008 0.5572 |
−0.008 0.7856 |
−0.092 0.2034 |
0.040 0.1989 |
0.088 0.0473 |
| 9-HODE* | LA | 5-LOX | 0.016 0.2123 |
−0.026 0.3924 |
0.302 <.0001 |
0.018 0.5591 |
−0.020 0.6581 |
| 9-HOTE*1 | LA | LOX | 0.007 0.5730 |
−0.003 0.9339 |
0.258 0.0004 |
0.016 0.5957 |
−0.055 0.2203 |
| 9-KODE* | LA | 5-LOX | 0.020 0.0943 |
−0.025 0.3724 |
0.355 <.0001 |
0.03892 0.2128 |
0.028 0.5161 |
| 12(13)-EpOME*2 | LA | CYP450 | −0.0002 0.9855 |
−0.017 0.5516 |
0.191 0.0074 |
−0.004 0.8894 |
−0.016 0.7210 |
| 12,13-DiHOME* | LA | CYP450 sEH | 0.0004 0.9729 |
−0.011 0.7178 |
0.274 0.0001 |
−0.009 0.7692 |
−0.002 0.9687 |
| 13-HOTE* | LA | alox15 | −0.003 0.8288 |
−0.024 0.4146 |
0.184 0.0110 |
0.051 0.1094 |
−0.022 0.6103 |
| 13S-HODE*6 | LA | 12/15-LOX | 0.014 0.2571 |
0.016 0.5807 |
0.333 <.0001 |
0.038 0.2311 |
0.016 0.7101 |
| 5-HETE*1 | ARA | 5-LOX | −1.025 0.3259 |
0.025 0.3909 |
0.428 <.0001 |
0.032 0.4164 |
0.093 0.0365 |
| 5,6-DiHETrE* | ARA | CYP450 sEH | −0.655 0.5402 |
−0.027 0.3722 |
0.421 <.0001 |
0.023 0.5479 |
−0.009 0.8370 |
| 6-trans-LTB4‡ | ARA | 5-LOX | −0.212 0.8349 |
0.014 0.6371 |
−0.035 0.6210 |
−0.057 0.1293 |
−0.063 0.1418 |
| 8,9-DiHETrE*1,7 | ARA | CYP450 | −1.115 0.3087 |
−0.012 0.6739 |
2.946 0.0051 |
−0.002 0.9558 |
−0.007 0.8790 |
| 8S-HETE*1§ | ARA | 12/15-LOX | 0.262 0.8160 |
0.021 0.5003 |
−1.223 0.2310 |
−0.060 0.1246 |
0.077 0.0854 |
| 9-HETE*1 | ARA | 12/15-LOX | 0.854 0.4369 |
0.023 0.4605 |
0.231 0.0013 |
0.060 0.1312 |
−0.070 0.1202 |
| 11,12-DiHETrE*1 | ARA | CYP450 sEH | −1.196 0.2133 |
−0.016 0.5488 |
0.374 <.0001 |
0.026 0.4635 |
0.040 0.5830 |
| 11-HETE‡ | ARA | 12/15-LOX | −1.9752 0.0523 |
−0.007 0.8050 |
0.403 <.0001 |
−0.005 0.8935 |
−0.003 0.9445 |
| 12S-HETE*1 | ARA | 12/15-LOX | −1.857 0.0824 |
0.021 0.4745 |
0.305 <.0001 |
0.037 0.3482 |
0.068 0.1259 |
| 14,15-DiHETrE*1 | ARA | CYP450 sEH | −1.093 0.2818 |
−0.027 0.3424 |
0.385 <.0001 |
0.022 0.5528 |
0.049 0.2407 |
| 15-HETE‡1 | ARA | 12/15-LOX | −0.951 0.3384 |
−0.012 0.6766 |
0.258 0.0002 |
0.024 0.5128 |
0.059 0.1555 |
| 15-KETE*4 | ARA | 12/15-LOX | 0.070 0.9437 |
−0.031 0.2471 |
−0.051 0.4517 |
0.107 0.0043 |
0.019 0.6460 |
| Lipoxin A4‡7 | ARA | 12/15-LOX | 0.321 0.4991 |
0.032 0.2804 |
−0.034 0.2927 |
0.003 0.8716 |
0.022 0.2557 |
| LTB4* | ARA | 5-LOX | 0.321 0.7631 |
0.024 0.4274 |
−0.074 0.3089 |
0.01992 0.6045 |
0.050 0.2482 |
| PGD2* | ARA | COX | −0.552 0.6237 |
−0.033 0.2936 |
0.047 0.5190 |
−0.019 0.6229 |
−0.025 0.5771 |
| PGE2*3 | ARA | COX | 0.400 0.7131 |
0.029 0.3389 |
−0.0002 0.9974 |
−0.047 0.2100 |
0.091 0.0336 |
| PGF2-alpha*3 | ARA | COX | −0.154 0.8860 |
−0.025 0.4115 |
−0.042 0.5582 |
0.021 0.5859 |
−0.057 0.1923 |
| n3 | |||||||
| Alpha-9(10)-EpODE*1 | ALA | CYP450 | 0.006 0.6335 |
−0.034 0.2874 |
0.283 0.0008 |
0.009 0.7747 |
−0.059 0.2078 |
| 9,10-DiHODE* | ALA | CYP450 | 0.022 0.8642 |
−0.028 0.3607 |
0.437 <.0001 |
1.906 0.0036 |
−0.029 0.5047 |
| Alpha-12(13)-EpODE†2 | ALA | CYP450 | −0.014 0.9133 |
−0.028 0.381 |
0.144 0.0545 |
1.298 0.0622 |
−0.030 0.5173 |
| 12,13-DiHODE* | ALA | CYP450 | −0.039 0.7638 |
−0.069 0.0267 |
0.375 <.0001 |
1.418 0.0331 |
−0.074 0.0931 |
| 15,16-EpODE* | ALA | CYP450 | 0.003 0.9790 |
−0.039 0.2034 |
0.391 <.0001 |
2.415 0.0003 |
−0.007 0.8667 |
| 15,16-DiHODE†1 | ALA | CYP450 sEH | −0.030 0.8232 |
−0.053 0.1129 |
0.261 0.0015 |
2.150 0.0039 |
−0.042 0.3688 |
| 4-HDoHE* | DHA | 12/15-LOX | −0.364 0.7300 |
0.023 0.4634 |
−0.027 0.7094 |
−0.237 0.0166 |
0.067 0.1245 |
| 14-HDoHE*1 | DHA | 12/15-LOX | 0.062 0.9516 |
−0.071 0.0154 |
0.063 0.3804 |
0.191 0.0586 |
−0.136 0.0023 |
| 17-HDoHE‡1 | DHA | 12/15-LOX | 0.103 0.9200 |
−0.042 0.1592 |
0.172 0.0139 |
0.179 0.0638 |
−0.039 0.3752 |
| 19,20-DiHDPE†1 | DHA | CYP450 sEH | 1.267 0.2057 |
−0.056 0.0668 |
8.864 <0.0001 |
0.538 <0.0001 |
−0.128 0.0058 |
| 15-HEPE‡ | EPA | 12/15-LOX |
1.316 0.0060 |
0.017 0.5732 |
0.041 0.1147 |
0.379 0.0119 |
−0.014 0.3516 |
| 17,18-DiHETE*6 | EPA | CYP450 sEH | 2.073 0.0954 |
−0.078 0.0090 |
0.185 0.0041 |
1.265 0.0014 |
−0.109 0.0081 |
β estimate and p-values are from models adjusted for age, age2, sex, and ethnicity when appropriate, and precursor FA variable being tested (each column is a separate model)
Bolding signifies p-value<0.05
Modeled using a mixed model with a random intercept
Modeled using a mixed model with a random intercept and slope
Modeled using a mixed model with compound Symmetry
Adjusted for HLA genotype
Adjusted for age
Adjusted for age, age2
Adjusted for sex
Adjusted for age, age2, ethnicity
Adjusted for age, ethnicity
Adjusted for ethnicity
Adjusted for ETS
RBC Membrane, Plasma, and Precursor FA relationships
We next tested precursor FA in both RBC and plasma. Precursor FA are stored as part of phospholipids in cell membranes, and then cleaved from phospholipid membranes and secreted to plasma for signal transduction3,4. By testing precursor FA in both RBC membranes and plasma, we are examining different stages of FA metabolism.
RBC Membrane
We examined whether the precursor FA in the RBC membrane was associated with oxylipin level. One ARA-related oxylipin (15-KETE) was positively associated with ARA levels in the RBC membrane (Table 3). Three n6-related oxylipins were positively associated with RBC n6:n3 levels (PGE2, 9,12,13-TriHOME, and 5-HETE). Of the n3-related oxylipins, 4 ALA-related oxylipins (9,10-DiHODE, 12,13-DiHODE, 15,16-EpODE, 15,16-DiHODE) and 2 EPA-related oxylipins (17,18-DiHETE, 15-HEPE) and the DHA-related oxylipin 19,20-DiHDPE were positively associated with levels of the precursor FA in RBC. Surprisingly, 4-HDoHE was negatively associated with DHA, its precursor FA. There were 3 n3-oxylipins that were negatively associated with n6:n3 in RBC (19,20-DiHDPE, 17,18-DiHETE, 14-HDoHE).
Plasma
Plasma n6 and n3 FA have been associated with the pro- and anti-inflammatory state of the body27–29. We examined the relationship between plasma levels of the precursor FA and oxylipins (Table 3). Of the n6-related oxylipins, 9 ARA (8,9-DiHETrE, 5,6-DiHETrE, 11,12-DiHETrE, 14,15-DiHETrE, 5-HETE, 9-HETE, 11-HETE, 12S-HETE, 15-HETE) and 9 LA-related oxylipins (9(10)-EpOME, 12(13)-EpOME, 9,10-DiHOME, 12,13-DiHOME, 9-HODE, 9-HOTE, 9-KODE, 13-HOTE, 13-HODE) were positively associated with plasma levels of their precursor FA. All CYP450 and CYP450 sEH n6-related oxylipins were positively associated with plasma levels of the precursor FA.
Among n3-related oxylipins, 5 ALA-related oxylipins (α-9(10)-EpODE, 12,13-DiHODE, 15,16-EpODE, 9,10-DiHODE, 15,16-DiHODE), 1 EPA-related oxylipin (17,18-DiHETE), and 2 DHA-related oxylipins (17-HDoHE, 19,20-DiHDPE) were positively associated with plasma levels of the precursor FA. All but one CYP450 or CYP450 sEH n3-related oxylipin was positively associated with the precursor FA in the plasma.
Precursor FA Relationships
To further delineate the relationships between the measures of precursor FA and oxylipins, we tested the relationships between the precursor FA themselves. We tested whether dietary intake was associated with n6 and n3 storage (RBC membrane) and plasma levels. Higher dietary intake for DHA and EPA was associated with higher RBC levels of these FA (Table 4). RBC levels of DHA, and EPA were inversely and significantly associated with the ratio of n6:n3 FA in the diet (as expected, since n6:n3 FA in the diet decreases as n3 FA increases) (Table 4). RBC levels of LA, ALA, DHA, and EPA were significantly and positively associated with plasma levels of each respective FA (Table 4). When testing the association between dietary intake of precursor FA and plasma levels, only levels of DHA in the plasma were significantly and inversely associated with the ratio of n6:n3 FA in the diet (Table 5).
Table 4:
Association between RBC membrane levels of the FA and dietary intake
| RBC Membrane FA | β estimate for Dietary intake of FA p-value |
β estimate for Dietary intake of n6:n3 Ratio p-value |
β estimate for Plasma FA p-value |
|---|---|---|---|
| LA | 0.007 0.8109 |
0.010 0.8769 |
0.607 0.0393 |
| ARA | 0.338 0.8687 |
−0.066 0.2071 |
0.397 0.8326 |
| ALA | −0.003 0.8079 |
0.0008 0.8110 |
0.027 0.0013 |
| DHA |
2.498 0.0008 |
−0.063 0.0020 |
4.676 <.0001 |
| EPA |
0.452 0.0181 |
−0.012 0.0059 |
0.047 0.0131 |
Bolding signifies p-value<0.05
Table 5:
Associations between plasma levels of the FA with dietary intake
| Plasma FA | β estimate for Dietary intake of FA p-value |
β estimate for Dietary intake of n6:n3 Ratio p-value |
|---|---|---|
| LA | 1.01E-02 0.1443 |
−0.012 0.4767 |
| ARA | −0.024 0.7194 |
−0.003 0.1289 |
| ALA | 1.36E-01 0.3345 |
−0.067 0.0413 |
| DHA | 0.044 0.341 |
−0.004 0.0073 |
| EPA | 0.276 0.6849 |
−0.013 0.426 |
Bolding signifies p-value<0.05
Discussion
In children aged 1–17 years, the majority of oxylipins were significantly associated with age, with n6 oxylipins generally decreasing with age and n3 oxylipins generally increasing with age. Proportionally more oxylipins were associated with plasma levels of their precursor FA compared to precursor FA in the diet or RBC membrane. Additionally, a higher proportion of n3 oxylipins compared to n6 oxylipins were associated with dietary and RBC levels of the precursor FA. ETS was associated with presence of lipoxin A4, a pro-resolving ARA-related oxylipin.
Generally, data regarding the association between age and oxylipins have come from supplementation studies in adults. In a study on flaxseed supplementation, the older group (age 45–64 years) of adults had higher levels of 13 pro-inflammatory oxylipins compared to the younger group (age 19–28 years) at baseline16. However, Zulyniak et al found that at baseline, younger men (average age 22 years) had higher levels of 3 n6 oxylipins compared to older men (average age 68 years)17. In our study, the differences with age could reflect a change in response to inflammation throughout childhood. Oxylipins may be key mediators in inflammatory diseases in children (e.g. asthma), and proper adjustment for age will be necessary for an unbiased assessment of oxylipin status.
Our findings in a healthy pediatric population are consistent with Nording et al that found that gender was not associated with the oxylipin profile in healthy adults supplemented with EPA and DHA for 6 weeks15. We also found that NHW race/ethnicity was associated with higher levels of four oxylipins. However, a limitation of our study is that our race/ethnicity categories were limited to NHW and other races and ethnicities, so further studies are needed to delineate possible differences between race/ethnicities.
To describe the relationship with an environmental exposure, we examined a lung irritant in the form of ETS. We found that exposure to ETS was associated with presence of lipoxin A4. Exposure to air pollution has been associated with increased oxylipins, such as 9-HODE, 5-HETE, and 13-HODE in both plasma and lung fluid in adults30. Exposure to subway air increased levels of pro-inflammatory n6 oxylipins in healthy subjects and subjects with asthma, but the response differed by disease state30. Martens et al found that particulate matter exposure prenatally was associated with increased cord blood levels of ARA LOX oxylipins 5-HETE, 9-HODE, and 15-HETE31. Additionally, resolvin D1 plays a key role in resolving inflammation in human macrophages exposed to cigarette smoke12. Lipoxin A4 is a pro-resolving oxylipin produced from ARA that we found to be increased with exposure to ETS. In a study by Tahan et al., lipoxin A4 was increased in breath condensate in children with asthma compared to those without asthma32. Further, the 12/15LOX pathway, which produces HETEs and lipoxin A4 from ARA, may play a pivotal role in the response to airway inflammation33. Others have found that n3 supplementation reduces inflammation in adult smokers34, and reduced respiratory infection and asthma in 3 year old children with mothers taking n3 supplements35. Combined with our study, these show that oxylipins play an important role in the inflammatory response to environmental exposures in the lungs.
Dietary intakes of n6 and n3 FA were tested as additional environmental predictors of oxylipin levels. Interestingly, of the n6 oxylipins, none were associated with dietary intake, and of the n3 oxylipins one was associated with dietary intake of the precursor FA and 3 were associated with n6:n3 intake. Other studies indicate that n6:n3 in the diet may be more important than absolute inake4,7. When studying the effect of LA and ALA supplementation on renal oxylipins in diet-induced obese rats, Caligiuri et al found that the ratio of LA:ALA was more important than actual quantities of the FA in determining shifts in oxylipin content36. Prescription omega-3 supplementation not only increased circulating levels of plasma n3 oxylipins, but also decreased plasma n6 oxylipins13.
Although many dosing studies find associations with n3 supplements and n3 oxylipins, these studies also show high levels of variability of oxylipin profiles in response to supplementation. In healthy adults supplemented with EPA and DHA for 6 weeks, LOX-related oxylipins from LA, ALA, and ARA were not significantly altered in response to the supplementation, and there was a high level of inter-individual variation15. In a follow-up study using gene expression in peripheral blood mononuclear cells, these authors tested whether differences in gene expression in response to n3 supplementation accounted for some of this variability37. Decreased levels of ARA in response to n3 supplementation was associated decreased expression of PTGS1 and ALOX12, but this association was not seen with changes in levels of EPA and DHA37. These changes in gene expression was correlated with changes in the corresponding oxylipins (PTGS1 corresponds to the COX enzyme, and ALOX12 to the LOX 12/15 enzyme)37.
Another explanation for the high level of variation in responsiveness to dietary intake could be related to baseline levels of PUFA intake. While both baseline levels of n3 FA and an n3 FA supplement altered n3 oxylipin levels in healthy adults, changes in oxylipin concentration were inversely proportional to baseline levels of n3 FA, suggesting that there may be a dose-dependent response in the effect of n3 FA intake and n3 oxylipin production38. This inter-person variability in response to PUFA intake could account for the lack of association between dietary intake and oxylipin levels in our study. In addition, the FFQs administered in this study reflect the average intake over the previous year, but the oxylipins may more accurately reflect recent dietary intake. In healthy adults, a single dose treatment of fish oil (1008 mg EPA and 672 mg DHA) induced immediate changes in plasma EPA-related oxylipins whereas plasma DHA-related oxylipins were not significantly altered39. The effect of recent dietary intake on the oxylipin profile may have added noise to the measurement and analysis of oxylipins, as the samples in this study were non-fasting. Our study tested usual dietary intake in healthy children, and it is possible that a supplement of n3 FA would be needed to upset the n6:n3 ratio enough to induce a change in oxylipin production.
We also tested the association between the precursor FA and each oxylipin through plasma and RBC levels, as well as n6:n3 in RBC. Plasma precursor FA levels were the most consistent predictor of oxylipin levels for both n6 and n3 oxylipins, and all associations were in a positive direction as expected. Notably, all oxylipins along the CYP450 enzyme pathway were significantly associated with plasma levels of the precursor FA, potentially indicating that CYP450 may be an important FA enzyme in healthy children (Figure 1, Table 3). Similarly, Sun et al. found that in adults, oxylipins and plasma precursor FA are highly correlated40.
Additionally, because plasma levels of n6 and n3 are associated with inflammation in the body27,28, we hypothesized that oxylipin production may be more a reflection of inflammatory signals rather than dietary intake or storage (as reflected in RBC). The association between plasma precursor FA and oxylipin levels may be due to a release of precursor FA from body stores to resolve or promote inflammation that corresponds with an increased synthesis of oxylipins in tissues. Plasma precursor FA may be available for uptake into tissues where they could be substrates for the oxylipin synthetic enzymes. Precursor FA and oxylipins may also be secreted from tissues simultaneously. In mice, treatment with niacin led to increased n3 FA synthesis and secretion to plasma, as well as increased n3-related oxylipins29. We hypothesize that pro- or anti-inflammatory signals may lead to secretion of n3 or n6 FA to plasma27–29, as well as secretion of oxylipins. The consistent association between plasma precursor FA and oxylipins may be related to the fact that these were both measured in the same compartment (i.e., plasma).
Oxylipins have been studied in many contexts as pro- and anti-inflammatory agents. In women with obesity and type 2 diabetes, higher levels of 5-LOX ARA oxylipins were associated with higher levels of inflammation in subcutaneous adipose41. In a study by Lundström et al conducted on an n3 supplement in females with mild asthma, the greatest alterations in oxylipins were in LOX-related oxylipins, indicating that the inflammatory state of the body could play a role in the effect of supplementation on the oxylipin profile, since LOX-related oxylipins are known to be altered in asthma10. These studies demonstrate that oxylipins are produced to resolve or promote inflammation, and we hypothesized that plasma FA were secreted in response to the inflammatory state of the body and these inflammatory signals may also lead to tissues converting these FA to oxylipins, leading to the association between plasma FA and oxylipins. Proportionally more n3 oxylipins were associated with RBC levels of the precursor as well as the ratio of n6:n3 in RBC, and only n3 oxylipins were significantly associated with dietary intake. These differences could be due to enzyme competition and preference for n3 FA4,7.
Our results indicate that proportionally more dietary, RBC, and plasma levels of n3 FA are associated with each other than for n6 FA. When testing dietary intake and plasma levels, the only significant association was dietary intake of n6:n3 ratio and DHA plasma levels. There are many intermediate steps between dietary intake and release into the plasma, and regulation of these steps could explain the lack of association between dietary intake and plasma levels of the precursor FA and of oxylipins. There is also preferential selection of n3 FA by enzymes, which may explain why a higher proportion of n3-related oxylipins were associated with dietary and RBC measures of their respective FA compared to n6-related oxylipins.
Strengths of this study include the longitudinal design and multiple measures of oxylipins and precursor FA over time in a pediatric population. A limitation of the study is the small sample size, and that the FFQ did not capture recent dietary intake, only a yearly average. While the children in our study were free of autoantibodies and clinical T1D at the time of the blood draws, they are at increased genetic risk of T1D due to HLA genotype, which may limit the generalizability of our results. Only 17% of our samples were collected post-puberty, which may explain why we did not find stronger associations between oxylipins and sex. And finally, we note that the blood samples were non-fasting, which may have introduced some noise to the plasma FA levels.
Conclusions
Our study demonstrated that the oxylipin profile may shift with age throughout childhood, while sex and race/ethnicity were not major predictors of oxylipin levels. Presence of the n6 oxylipin lipoxin A4 was associated with ETS exposure, potentially as a response to increased airway inflammation. Dietary intake and RBC levels of the precursor FA were more strongly associated with n3 oxylipins compared to n6 oxylipins, which may be due to enzyme preference for n3 FA42. Plasma levels of the precursor FA were most consistently associated with oxylipin levels and may indicate that the regulation of inflammatory signals leading to release of n3 and n6 FA may also be key determinants of oxylipin generation. Studies on regulatory steps between intake of n3 and n6 FA and secretion of n3 and n6 FA to plasma, as well as regulation of oxylipin generation may provide insight on how to best alter diet to impact resolution of inflammation.
Supplementary Material
Impact Statement:
This is the first study to examine predictors of oxylipins in healthy children at risk of type 1 diabetes
In healthy children at risk of type 1 diabetes, many oxylipins change with age, and most oxylipins do not differ by sex or race/ethnicity
Environmental tobacco smoke exposure was associated with presence of lipoxin A4
Omega-6 and omega-3 related oxylipin levels were consistently associated with their respective precursor fatty acid levels measured in the plasma.
Proportionally more omega-3 compared to omega-6 oxylipins were associated with dietary intake and red blood cell membrane levels of the respective precursor fatty acid.
Statement of financial support:
This work was supported by the National Institutes of Health R01-DK104351 and R01-DK32493.
Footnotes
There are no conflicts of interest to disclose
Works Cited
- 1.Patterson E, Wall R, Fitzgerald GF, Ross RP, Stanton C. Health implications of high dietary omega-6 polyunsaturated Fatty acids. Journal of nutrition and metabolism. 2012;2012:539426. [DOI] [PMC free article] [PubMed] [Google Scholar]
- 2.Totsch SK, Quinn TL, Strath LJ, et al. The impact of the Standard American Diet in rats: Effects on behavior, physiology and recovery from inflammatory injury. Scandinavian journal of pain. 2017;17:316–324. [DOI] [PubMed] [Google Scholar]
- 3.Berkecz R, Lisa M, Holcapek M. Analysis of oxylipins in human plasma: Comparison of ultrahigh-performance liquid chromatography and ultrahigh-performance supercritical fluid chromatography coupled to mass spectrometry. Journal of chromatography A. 2017;1511:107–121. [DOI] [PubMed] [Google Scholar]
- 4.Gabbs M, Leng S, Devassy JG, Monirujjaman M, Aukema HM. Advances in Our Understanding of Oxylipins Derived from Dietary PUFAs. Advances in nutrition (Bethesda, Md). 2015;6(5):513–540. [DOI] [PMC free article] [PubMed] [Google Scholar]
- 5.Radmark O, Werz O, Steinhilber D, Samuelsson B. 5-Lipoxygenase, a key enzyme for leukotriene biosynthesis in health and disease. Biochimica et biophysica acta. 2015;1851(4):331–339. [DOI] [PubMed] [Google Scholar]
- 6.Gilroy DW, Edin ML, De Maeyer RP, et al. CYP450-derived oxylipins mediate inflammatory resolution. Proc Natl Acad Sci U S A. 2016;113(23):E3240–3249. [DOI] [PMC free article] [PubMed] [Google Scholar]
- 7.Liou YA, King DJ, Zibrik D, Innis SM. Decreasing linoleic acid with constant alpha-linolenic acid in dietary fats increases (n-3) eicosapentaenoic acid in plasma phospholipids in healthy men. The Journal of nutrition. 2007;137(4):945–952. [DOI] [PubMed] [Google Scholar]
- 8.Pauls SD, Rodway LA, Winter T, Taylor CG, Zahradka P, Aukema HM. Anti-inflammatory effects of alpha-linolenic acid in M1-like macrophages are associated with enhanced production of oxylipins from alpha-linolenic and linoleic acid. The Journal of nutritional biochemistry. 2018;57:121–129. [DOI] [PubMed] [Google Scholar]
- 9.Picklo MJ Sr., Newman JW Antioxidant supplementation and obesity have independent effects on hepatic oxylipin profiles in insulin-resistant, obesity-prone rats. Free radical biology & medicine. 2015;89:182–191. [DOI] [PubMed] [Google Scholar]
- 10.Lundstrom SL, Yang J, Brannan JD, et al. Lipid mediator serum profiles in asthmatics significantly shift following dietary supplementation with omega-3 fatty acids. Molecular nutrition & food research. 2013;57(8):1378–1389. [DOI] [PMC free article] [PubMed] [Google Scholar]
- 11.Duvall MG, Bruggemann TR, Levy BD. Bronchoprotective mechanisms for specialized pro-resolving mediators in the resolution of lung inflammation. Molecular aspects of medicine. 2017;58:44–56. [DOI] [PMC free article] [PubMed] [Google Scholar]
- 12.Croasdell A, Thatcher TH, Kottmann RM, et al. Resolvins attenuate inflammation and promote resolution in cigarette smoke-exposed human macrophages. American journal of physiology Lung cellular and molecular physiology. 2015;309(8):L888–901. [DOI] [PMC free article] [PubMed] [Google Scholar]
- 13.Shearer GC, Harris WS, Pedersen TL, Newman JW. Detection of omega-3 oxylipins in human plasma and response to treatment with omega-3 acid ethyl esters. Journal of lipid research. 2010;51(8):2074–2081. [DOI] [PMC free article] [PubMed] [Google Scholar]
- 14.Markworth JF, Kaur G, Miller EG, et al. Divergent shifts in lipid mediator profile following supplementation with n-3 docosapentaenoic acid and eicosapentaenoic acid. FASEB journal : official publication of the Federation of American Societies for Experimental Biology. 2016;30(11):3714–3725. [DOI] [PMC free article] [PubMed] [Google Scholar]
- 15.Nording ML, Yang J, Georgi K, et al. Individual variation in lipidomic profiles of healthy subjects in response to omega-3 Fatty acids. PLoS One. 2013;8(10):e76575. [DOI] [PMC free article] [PubMed] [Google Scholar]
- 16.Caligiuri SP, Aukema HM, Ravandi A, Pierce GN. Elevated levels of pro-inflammatory oxylipins in older subjects are normalized by flaxseed consumption. Experimental gerontology. 2014;59:51–57. [DOI] [PubMed] [Google Scholar]
- 17.Zulyniak MA, Roke K, Gerling C, Logan SL, Spriet LL, Mutch DM. Fish oil regulates blood fatty acid composition and oxylipin levels in healthy humans: A comparison of young and older men. Molecular nutrition & food research. 2016;60(3):631–641. [DOI] [PubMed] [Google Scholar]
- 18.Strzelak A, Ratajczak A, Adamiec A, Feleszko W. Tobacco Smoke Induces and Alters Immune Responses in the Lung Triggering Inflammation, Allergy, Asthma and Other Lung Diseases: A Mechanistic Review. Int J Environ Res Public Health. 2018;15(5). [DOI] [PMC free article] [PubMed] [Google Scholar]
- 19.Rewers M, Bugawan TL, Norris JM, et al. Newborn screening for HLA markers associated with IDDM: diabetes autoimmunity study in the young (DAISY). Diabetologia. 1996;39(7):807–812. [DOI] [PubMed] [Google Scholar]
- 20.Norris JM, Yin X, Lamb MM, et al. Omega-3 polyunsaturated fatty acid intake and islet autoimmunity in children at increased risk for type 1 diabetes. Jama. 2007;298(12):1420–1428. [DOI] [PubMed] [Google Scholar]
- 21.2. Classification and Diagnosis of Diabetes. Diabetes care. 2016;39 Suppl 1:S13–22. [DOI] [PubMed] [Google Scholar]
- 22.Pedersen TL, Newman JW. Establishing and Performing Targeted Multi-residue Analysis for Lipid Mediators and Fatty Acids in Small Clinical Plasma Samples. In: Giera M, ed. Clinical Metabolomics: Methods and Protocols. New York, NY: Springer New York; 2018:175–212. [DOI] [PubMed] [Google Scholar]
- 23.Seifert JA, Ross CA, Norris JM. Validation of a five-question survey to assess a child’s exposure to environmental tobacco smoke. Annals of epidemiology. 2002;12(4):273–277. [DOI] [PubMed] [Google Scholar]
- 24.Brady H, Lamb MM, Sokol RJ, et al. Plasma micronutrients are associated with dietary intake and environmental tobacco smoke exposure in a paediatric population. Public health nutrition. 2007;10(7):712–718. [DOI] [PubMed] [Google Scholar]
- 25.Lamb MM, Ross CA, Brady HL, Norris JM. Comparison of children’s diets as reported by the child via the Youth/Adolescent Questionnaire and the parent via the Willett food-frequency questionnaire. Public health nutrition. 2007;10(7):663–670. [DOI] [PubMed] [Google Scholar]
- 26.Kind T, Liu KH, Lee DY, DeFelice B, Meissen JK, Fiehn O. LipidBlast in silico tandem mass spectrometry database for lipid identification. Nature methods. 2013;10(8):755–758. [DOI] [PMC free article] [PubMed] [Google Scholar]
- 27.Dangour AD, Allen E, Elbourne D, Fletcher A, Richards M, Uauy R. Fish consumption and cognitive function among older people in the UK: baseline data from the OPAL study. The journal of nutrition, health & aging. 2009;13(3):198–202. [DOI] [PubMed] [Google Scholar]
- 28.Lauretani F, Semba RD, Bandinelli S, et al. Plasma polyunsaturated fatty acids and the decline of renal function. Clinical chemistry. 2008;54(3):475–481. [DOI] [PMC free article] [PubMed] [Google Scholar]
- 29.Heemskerk MM, Dharuri HK, van den Berg SA, et al. Prolonged niacin treatment leads to increased adipose tissue PUFA synthesis and anti-inflammatory lipid and oxylipin plasma profile. Journal of lipid research. 2014;55(12):2532–2540. [DOI] [PMC free article] [PubMed] [Google Scholar]
- 30.Lundstrom SL, Levanen B, Nording M, et al. Asthmatics exhibit altered oxylipin profiles compared to healthy individuals after subway air exposure. PloS one. 2011;6(8):e23864. [DOI] [PMC free article] [PubMed] [Google Scholar]
- 31.Martens DS, Gouveia S, Madhloum N, et al. Neonatal Cord Blood Oxylipins and Exposure to Particulate Matter in the Early-Life Environment: An ENVIRONAGE Birth Cohort Study. Environmental health perspectives. 2017;125(4):691–698. [DOI] [PMC free article] [PubMed] [Google Scholar]
- 32.Tahan F, Eke GH, Bicici E, Saraymen B, Akar HH. Increased Postexercise Lipoxin A4 Levels in Exhaled Breath Condensate in Asthmatic Children With Exercise-Induced Bronchoconstriction. Journal of investigational allergology & clinical immunology. 2016;26(1):19–24. [DOI] [PubMed] [Google Scholar]
- 33.Sacharzewska E, Bielecki P, Bernatowicz P, Niklinski J, Kowal-Bielecka O, Kowal K. The role of 12/15-lipoxygenase in production of selected eicosanoids in allergic airway inflammation. Advances in medical sciences. 2016;61(1):141–146. [DOI] [PubMed] [Google Scholar]
- 34.Whyand T, Hurst JR, Beckles M, Caplin ME. Pollution and respiratory disease: can diet or supplements help? A review. Respiratory research. 2018;19(1):79. [DOI] [PMC free article] [PubMed] [Google Scholar]
- 35.Miyake Y, Sasaki S, Tanaka K, et al. Fish and fat intake and prevalence of allergic rhinitis in Japanese females: the Osaka Maternal and Child Health Study. Journal of the American College of Nutrition. 2007;26(3):279–287. [DOI] [PubMed] [Google Scholar]
- 36.Caligiuri SP, Love K, Winter T, et al. Dietary linoleic acid and alpha-linolenic acid differentially affect renal oxylipins and phospholipid fatty acids in diet-induced obese rats. The Journal of nutrition. 2013;143(9):1421–1431. [DOI] [PubMed] [Google Scholar]
- 37.Berthelot CC, Kamita SG, Sacchi R, et al. Changes in PTGS1 and ALOX12 Gene Expression in Peripheral Blood Mononuclear Cells Are Associated with Changes in Arachidonic Acid, Oxylipins, and Oxylipin/Fatty Acid Ratios in Response to Omega-3 Fatty Acid Supplementation. PloS one. 2015;10(12):e0144996. [DOI] [PMC free article] [PubMed] [Google Scholar]
- 38.Keenan AH, Pedersen TL, Fillaus K, Larson MK, Shearer GC, Newman JW. Basal omega-3 fatty acid status affects fatty acid and oxylipin responses to high-dose n3-HUFA in healthy volunteers. Journal of lipid research. 2012;53(8):1662–1669. [DOI] [PMC free article] [PubMed] [Google Scholar]
- 39.Schuchardt JP, Schneider I, Willenberg I, et al. Increase of EPA-derived hydroxy, epoxy and dihydroxy fatty acid levels in human plasma after a single dose of long-chain omega-3 PUFA. Prostaglandins & other lipid mediators. 2014;109–111:23–31. [DOI] [PMC free article] [PubMed] [Google Scholar]
- 40.Sun Y, Koh HW, Choi H, et al. Plasma fatty acids, oxylipins, and risk of myocardial infarction: the Singapore Chinese Health Study. Journal of lipid research. 2016;57(7):1300–1307. [DOI] [PMC free article] [PubMed] [Google Scholar]
- 41.Heemskerk MM, Giera M, Bouazzaoui FE, et al. Increased PUFA Content and 5-Lipoxygenase Pathway Expression Are Associated with Subcutaneous Adipose Tissue Inflammation in Obese Women with Type 2 Diabetes. Nutrients. 2015;7(9):7676–7690. [DOI] [PMC free article] [PubMed] [Google Scholar]
- 42.Lands B, Bibus D, Stark KD. Dynamic interactions of n-3 and n-6 fatty acid nutrients. Prostaglandins Leukot Essent Fatty Acids. 2018;136:15–21. [DOI] [PubMed] [Google Scholar]
Associated Data
This section collects any data citations, data availability statements, or supplementary materials included in this article.