

Abstract
Objective
There is no standardized and objective method for determining the optimal treatment endpoint (sub-stasis) during transarterial embolization. The objective of this study was to demonstrate the feasibility of using a quantitative digital subtraction angiography (qDSA) technique to characterize intra-procedural changes in hepatic arterial blood flow velocity in response to transarterial embolization in an in vivo porcine model.
Materials and Methods
Eight domestic swine underwent bland transarterial embolizations to partial and sub-stasis angiographic endpoints with intraprocedural DSA acquisitions. Embolized lobes were assessed on histopathology for ischemic damage and tissue embolic particle density. Analysis of target vessels used qDSA and a commercially available color-coded DSA (ccDSA) tool to calculate blood flow velocities and time-to-peaks respectively.
Results
Blood flow velocities calculated using qDSA showed a statistically significant difference (p<0.01) between partial- and sub-stasis endpoints whereas time-to-peaks calculated using ccDSA did not show a significant difference. During the course of embolizations, the average correlation with volume of particles delivered was larger for qDSA (-0.86) than ccDSA (0.36). There was a statistically smaller mean-squared error (p<0.01) and larger coefficient of determination (p<0.01) for qDSA compared to ccDSA. On pathology, the degree of embolization as calculated by qDSA had a moderate, positive correlation (p<0.01) with the tissue embolic particle density of ischemic regions within the embolized lobe.
Conclusions
qDSA was able to quantitatively discriminate angiographic embolization endpoints and, compared to a commercially available ccDSA method, improve intra-procedural characterization of blood flow changes. Additionally, the qDSA endpoints correlated with tissue-level changes.
Keywords: hepatocellular carcinoma (HCC), transarterial embolization (TAE), transarterial chemoembolization (TACE), 2D digital subtraction angiography (DSA), quantitative digital subtraction angiography (qDSA), color-coded digital subtraction angiography (ccDSA), time attenuation curve (TAC), time-to-peak (TTP)
Introduction
The efficacy of both transarterial embolization (TAE) and chemoembolization (TACE) depends on a number of factors, one of which is achieving the appropriate degree of stasis in the target vasculature and tumor. Too little stasis can lead to insufficient tumor necrosis, whereas complete stasis can lead to upregulation of angiogenesis factors, increased liver toxicity, and increased mortality [1–5]. Treatments ending at sub-stasis, a more optimal endpoint, result in increased overall survival when compared to complete stasis [6]. Endpoints during TAE and TACE are currently determined by subjective angiographic assessments which have high inter-observer variability and are inconsistent [7]. An objective method for determining embolization endpoints would standardize the procedures, increase treatment efficacy, and improve patient safety. Recently, color-coded DSA (ccDSA) analysis has demonstrated validity as a tool for quantifying embolization endpoints [8–10]. The technique, however, is susceptible to variability from factors such as vessel size, vessel/tissue overlap, turbulent flow, contrast injection rate, catheter position, and motion artifact [11–13].
Quantitative digital subtraction angiography (qDSA) is a newly developed technique which calculates near real-time blood flow velocity (BFV) in a vessel of interest using time attenuation curves (TAC) present in time-resolved 2D-DSA sequences. This technique can be used to characterize BFV changes in response to vascular intervention. We hypothesize that (H1) qDSA is able to discriminate angiographic embolization endpoints more effectively than a commercially available quantitative flow characterization technique, (H2) qDSA is able to characterize real-time changes in blood flow during embolization more effectively than a commercially available quantitative flow characterization technique, and (H3) the changes in blood flow characterized by qDSA correlate with tissue-level perfusion changes. The objective of this study was to demonstrate the feasibility of using qDSA to characterize intra-procedural changes in hepatic arterial blood flow in response to transarterial embolization (TAE) in an in vivo porcine model.
Materials and Methods
All procedures were approved by the institutional research animal care and use committee and were compliant with regulatory guidelines. Transarterial embolization was performed in the livers of eight swine (mean weight, 49.4 ± 2.0 kg). Subjects were sedated with an intramuscular administration of 7 mg/kg of tiletamine hydrochloride-zolazepam hydrochloride (Xyla-Ject; Phoenix Pharmaceutical, St. Joseph, Missouri), endotracheally intubated, and then underwent anesthesia induction and maintenance with 2% inhaled isoflurane (Halocarbon Laboratories, River Edge, New Jersey).
Transarterial Embolization
All procedures were performed in an angiography suite (Artis zee; Siemens Healthineers, Forcheim, Germany). Femoral arterial access was obtained and the common hepatic artery selected with a 5 Fr angled glide catheter. A 3D-DSA was acquired to delineate hepatic arterial anatomy and determine an optimal projection angle. Prior to embolization, a 30 frames per second (fps) 2D-DSA of the common hepatic artery was acquired using an injection of iohexol 300 mg/mL (Omnipaque 300; GE Healthcare, Waukesha, Wisconsin) (see Table 1 for imaging parameters). All DSA images were acquired with breath holds.
Table 1:
Embolization and imaging parameters for all in vivo studies
| Animal | Artery Embolized | Angiographic Endpoint | Projection Angle | Contrast Injection Rate | Contrast Volume |
|---|---|---|---|---|---|
| 1 | LMHA* | Sub-Stasis | 0 degrees | 2.5 mL/s | 15 mL |
| 2 | LMHA* | Sub-Stasis | 0 degrees | 2.5 mL/s | 15 mL |
| 3 | LMHA* | Partial-Stasis | 30 degrees LAO | 2.5 mL/s | 15 mL |
| 3 | RLHA | Sub-Stasis | 30 degrees LAO | 2.5 mL/s | 15 mL |
| 4 | LMHA* | Partial-Stasis | 50 degrees LAO | 3.0 mL/s | 18 mL |
| 5 | LMHA* | Sub-Stasis | 0 degrees | 2.5 mL/s | 15 mL |
| 5 | RMHA | Partial-Stasis | 0 degrees | 2.5 mL/s | 15 mL |
| 6 | LMHA* | Sub-Stasis | 0 degrees | 2.0 mL/s | 16 mL |
| 7 | LMHA* | Partial-Stasis | 0 degrees | 2.0 mL/s | 16 mL |
| 8 | LMHA | Sub-Stasis | 0 degrees | 2.5 mL/s | 15 mL |
LHMA: left medial hepatic artery, RLHA: right lateral hepatic artery, RMHA: right medial hepatic artery, LAO: left anterior oblique, DSA: digital subtraction angiography
additional DSA images acquired throughout embolization to generate BFV reduction-embolization curves
In each animal, up to two (of four) hepatic lobes were selected for embolization (see Table 1 for embolization and DSA acquisition parameters). Bland embolizations (n=10) were performed given that the primary objective of the study was to characterize reductions in blood flow velocity. A 0.014” guidewire was used to select a second-order hepatic artery branch supplying the target lobe, after which a 2.8 Fr microcatheter was advanced into the vessel. Once the microcatheter was correctly positioned, an embolization was performed using 100–300 um microspheres (Embosphere Microsphere; Merit Medical Systems, South Jordan, Utah) diluted in 10 mL of ioxhexol 300 mg/mL. Embolizations were performed to partial-or sub-stasis based on a version of the SACE scale modified for normal liver tissue (Table 2) [7]. In a subset of embolizations (n=7), additional intraprocedural DSA images were acquired after delivery of embolic particle aliquots (0.5–3 mL) in order to generate BFV reduction-embolization curves to better characterize changes in velocity throughout a liver embolization. After each aliquot, the microcatheter was withdrawn, a 2D-DSA (with same imaging parameters as the baseline) was acquired via the stationary base catheter positioned in the common hepatic artery, the target vessel was reselected with the microcatheter and the embolization resumed. In these embolizations, there was a minimum of two minutes between microcatheter withdrawal and subsequent imaging in order to minimize any effects of transient arterial spasm.
Table 2:
Modified subjective angiographic embolization endpoint scale
| Grade | Stasis Endpoint | Antegrade Flow | Parenchymal Enhancement |
|---|---|---|---|
| 1 | No stasis | Normal | Normal |
| 2 | Partial-stasis | Reduced | Reduced |
| 3 | Sub-stasis | Minimal | Minimal |
| 4 | Complete stasis | None | None |
qDSA Method
The qDSA method uses inherent oscillations in the image contrast caused by arterial flow pulsatility as a trackable marker of BFV in the artery. The oscillatory image signal is measured in the time-attenuation curves (TAC) of pixels along the centerline of a vessel. When two TACs from two pixels along the centerline of the vessel (separated by a distance) are superimposed, the temporal shift between the two functions represents the time of contrast transit along the vessel. An in vivo example of the TAC shift in a porcine model is illustrated in Figure 1. Distances and temporal shifts (using a shifted-least squares approach [14]) can be found for all pairs of points along the centerline of a vessel in order to calculate a spatially-averaged BFV in the vessel of interest. An algorithm employing the qDSA method was implemented in MATLAB (MATLAB R2018b version 9.5, MathWorks, Natick, Massachusetts) using a custom-built program.
Figure 1.
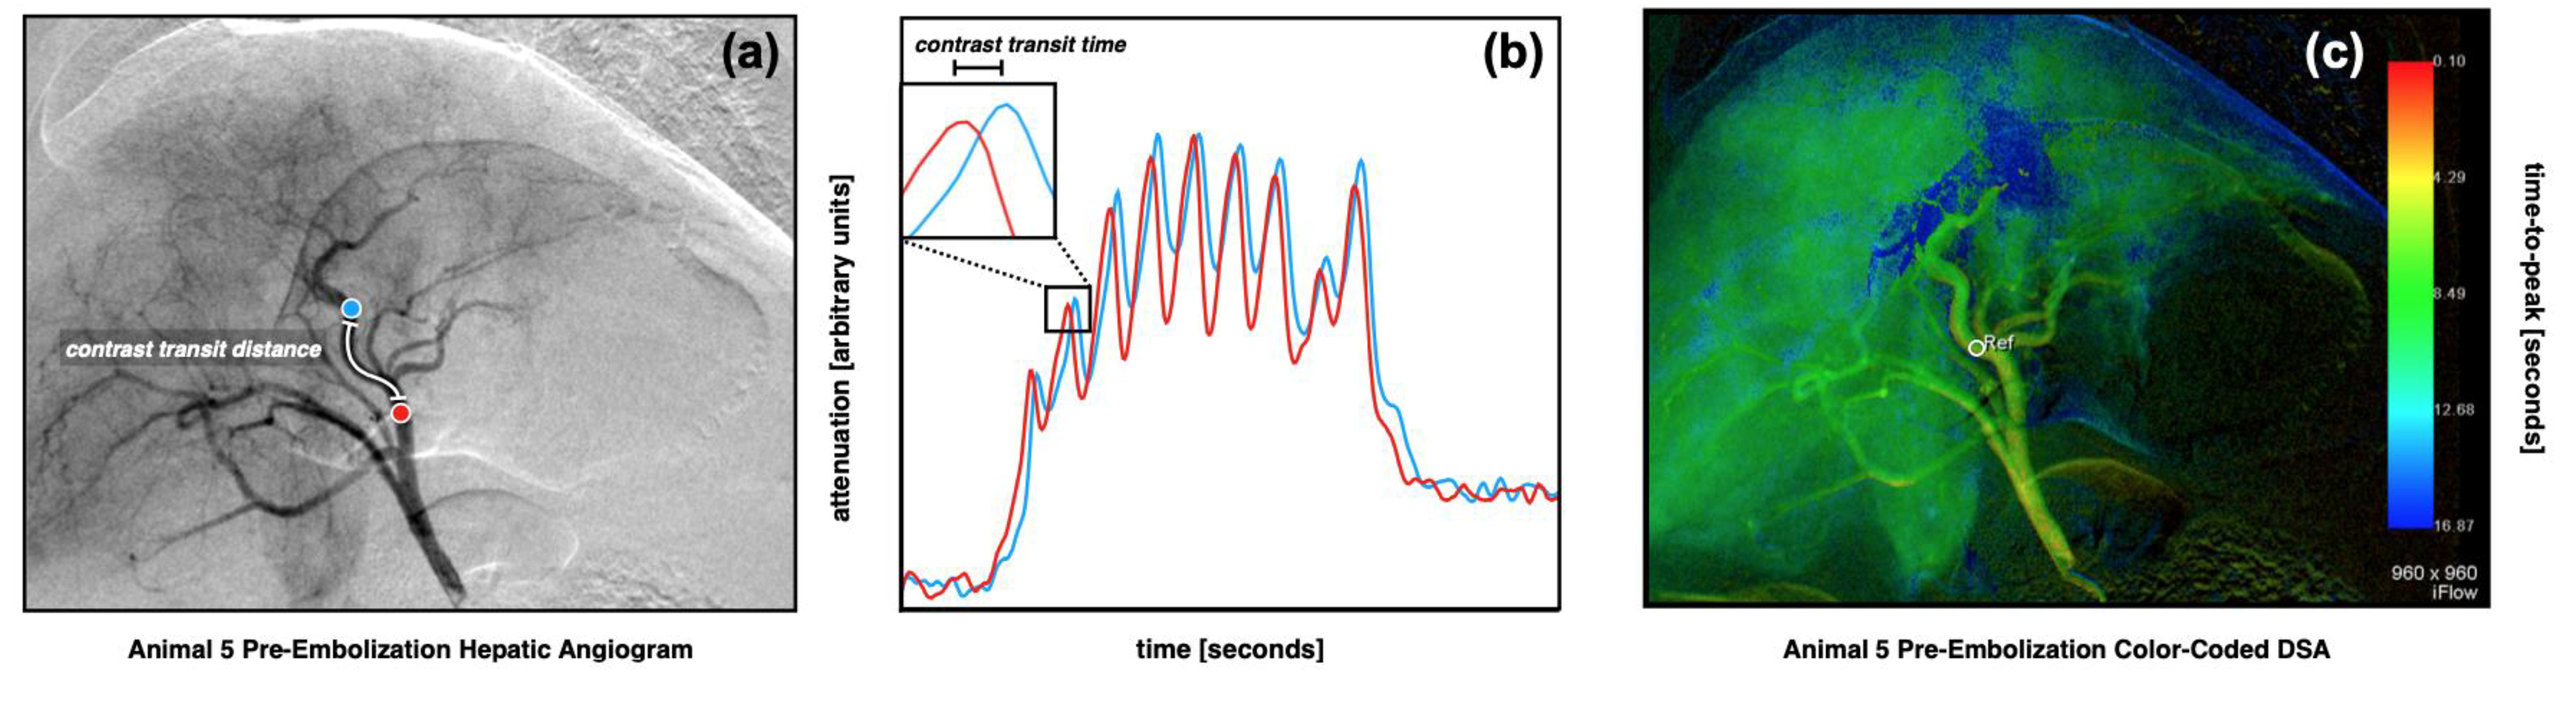
Quantitative digital subtraction angiography (qDSA) in an in vivo porcine model (a,b). A pre-embolization common hepatic arteriogram (a) was acquired. Proximal (red) and distal (blue) points along the left medial hepatic artery were analyzed. The time-attenuation curves (TAC) from the two points are superimposed (b), illustrating a visible temporal shift. The temporal shift represents the transit time of transient contrast boluses developed from contrast pulsatility. A manual spatial and temporal segmentation was completed to ensure adequate centerlines and strong contrast signal pulsatility. A shifted-least squares approach was used to iteratively calculate temporal shifts in the TACs between all pairs of points along the centerline in order to calculate the spatially-averaged blood velocity for the segmented vessel. A color-coded DSA (ccDSA) from the same sequence (c) shows the baseline time-to-peaks (TTP) in the hepatic vasculature. A region-of-interest in the at the site of embolization (white circle) with diameter equal to the vessel diameter is selected for assessment.
ccDSA Method
A commercially available ccDSA method (syngo iFlow, Siemens Healthineers) was used to calculate time-to-peak (TTP) in the embolized vessel. A region-of-interest (ROI) was placed in the proximal segment of the vessel with diameter equal to the width of the vessel in order to estimate a TTP (Figure 1c). The segment of vessel analyzed was the same as that used for the qDSA analysis.
Image Analysis
A post-hoc analysis of all DSA images was performed using both the qDSA and ccDSA methods. A decrease in qDSA calculated BFV and an increase in ccDSA calculated TTP was the expected result in response to a blood flow reduction due to embolization. qDSA calculations were performed on a laptop computer with 16 GB of RAM. ccDSA calculations were performed on the angiography suite workstation (Artis zee; Siemens Healthineers, Forcheim, Germany).
Pathology Analysis
Three swine were euthanized after a 3-hour standby period to allow for acute ischemic changes to occur. Following euthanasia, the liver was immediately procured and sampled liver lobes were placed in 10% neutral buffered formalin and submitted for histopathology. Tissues were serially sectioned at approximately 1–1.5 cm intervals prior to complete fixation and examined grossly for changes such as congestion and hemorrhage. One to two affected regions (if present) were sampled from each submitted tissue. Samples were placed in standard histology cassettes in 10% neutral buffered formalin until fully fixed, then underwent routine tissue processing and paraffin embedding. Histologic sections were made at a thickness of 5 um and subsequently stained with hematoxylin and eosin. Slides were examined for changes such as congestion, hemorrhage, and necrosis as well as the presence of intravascular embolic beads. Embolic bead density was also calculated.
Statistical Analysis
To compare the reduction in hepatic arterial BFV between hepatic lobes that were embolized to sub-stasis versus those that were embolized to partial-stasis, a linear mixed model was fit to the data using the ‘lme4’ package, where the individual animal was modeled as a random intercept [15]. To assess the correlation between embolization and reduction in BFV (relative to baseline [%]), a similar linear mixed model was estimated. All mixed model p-values were calculated using Satterthwaite’s approximation.
To assess the correlation between qDSA and embolization, seven linear models were fit to the data for each individual animal, where qDSA was modeled as the response variable. From each model, the Pearson’s correlation coefficient (r) the mean-squared error (MSE), and coefficient of determination (R2) were calculated. Similar models and metrics were calculated to assess the association between ccDSA and embolization. To test if the MSE for the qDSA models was less than the MSE for the ccDSA models, a one-sided, paired, Wilcoxon-rank sum test was used. The same test was used to test if the R2 for the qDSA models was greater than the ccDSA models. To determine if the absolute correlation between qDSA and embolization was stronger than that of ccDSA and embolization, the paired, overlapping, correlation coefficients were tested at the animal level [16].
For this analysis, a p-value less than 0.05 was considered statistically significant. Given the exploratory nature of this study, no corrections for multiple testing were applied to resulting p-values. All statistical analyses were done using R (V 3.6.1) [17].
Results
Embolization Endpoints
Hepatic lobes that were embolized to sub-stasis angiographic endpoints had statistically significant greater reductions (p < 0.01) in hepatic arterial blood flow velocity when compared with those embolized to partial-stasis endpoints as calculated using qDSA (Figure 2). There was no statistically significant difference between sub-stasis and partial-stasis angiographic endpoints with regards to time-to-peaks calculated using ccDSA (p = 0.56). Lobes embolized to partial-stasis angiographic endpoints had a mean calculated BFV of 45.2%±5.1% and a mean TTP of 120.3%±9.5% (n=4) expressed as a percentage of the baseline value. Lobes that were embolized to sub-stasis angiographic endpoints had a mean calculated BFV of 22.4%%±12.2% and a mean TTP of 113.2%±19.4% (n = 6) as a percentage of the baseline.
Figure 2.

Post-embolization qDSA calculated blood flow velocities (BFV) and ccDSA calculated time-to-peaks (TTP), relative to baseline, from embolizations performed to partial-stasis and sub-stasis endpoints. There was a statistically significant greater reduction in mean blood velocity relative to baseline for sub-stasis embolizations compared to partial stasis embolizations. There was no significant difference between stasis endpoints when using ccDSA.
Blood Flow Velocity Reduction During Embolization
In embolizations during which images were acquired throughout the procedure, there was a negative linear relationship between qDSA calculated BFVs and the volume of embolic particles delivered in all 7 hepatic lobes. There was a positive linear relationship between ccDSA calculated TTP and the volume of embolic particles delivered in 5 out of 7 lobes. qDSA calculated BFVs were compared to ccDSA calculated TTPs with correlation, MSE, and R2. The values are reported for qDSA and ccDSA in each animal in Table 3. The average correlation was −0.86 for qDSA and 0.36 for ccDSA. The average MSE for qDSA was 0.22, which was significantly smaller (p < 0.01) than the MSE for ccDSA, 0.62. The average R2 for qDSA (0.75) was significantly larger (p < 0.01) than the R2 for ccDSA (0.30). A representative embolization from Animal 1 is presented in Figure 3. qDSA calculated blood velocities and ccDSA calculated TTPs for all animals are presented in Supplemental Figure 1.
Table 3:
Linear model analysis of degree of embolization and qDSA or ccDSA
| Animal | Correlation | Mean Squared Error | R2 | |||
|---|---|---|---|---|---|---|
| qDSA | ccDSA | qDSA | ccDSA | qDSA | ccDSA | |
| 1 | −0.96 | 0.70 | 0.08 | 0.46 | 0.92 | 0.49 |
| 2 | −0.60 | 0.42 | 0.61 | 0.78 | 0.36 | 0.18 |
| 3 | −0.87 | −0.14 | 0.20 | 0.82 | 0.76 | 0.02 |
| 4 | −0.85 | 0.59 | 0.23 | 0.55 | 0.72 | 0.34 |
| 5 | −0.80 | 0.50 | 0.33 | 0.62 | 0.64 | 0.25 |
| 6 | −0.98 | −0.38 | 0.03 | 0.76 | 0.97 | 0.14 |
| 7 | −0.94 | 0.82 | 0.10 | 0.28 | 0.89 | 0.68 |
qDSA: quantitative digital subtraction angiography, ccDSA: color-coded digital subtraction angiography, R2: coefficient of determination
Figure 3.

A representative velocity reduction-embolization curve from an incremental embolization performed in the left medial hepatic artery (white arrow) in a porcine model. There is a strong negative correlation between the qDSA calculated blood velocities and the volume of embolic particles delivered. There is a weak positive correlation between ccDSA calculated TTP and the volume of embolic particles delivered. The reduction in qDSA calculated blood velocities from baseline (1, yellow highlight) to partial stasis (2, green highlight) to sub-stasis (3, blue highlight) agrees with a qualitative angiographic assessment of increasing perfusion defect in the embolized region (red arrow). The relative change from baseline is larger in qDSA (9.0% reduction in blood velocity per mL of embolic particles delivered) than in ccDSA (1.5% increase in TTP per mL of embolic particles delivered).
Pathology
Embolized lobes submitted for pathologic assessment (n = 4) were grossly mottled with purple-black discolorations in a multifocal coalescing pattern. Discolored patches were more frequently peripheral to major vessels of individual hepatic lobules. Lobes that were embolized to sub-stasis endpoints had greater extent of patchy discolorations than those lobes embolized to partial stasis.
On histopathologic evaluation, sections taken from embolized lobes contained multifocal intra-arteriolar globular material consistent with embolic particles (Figures 4a & 4b). The particles occluded anywhere from 10% to 90% of the vascular lumen. There was a moderate, positive correlation (p < 0.01) between the number of embolic particles in a section of tissue and the degree of embolization as quantified by the reduction in calculated BFV using the qDSA method (Figure 5). Sections taken from lobes that were not embolized (n=3) did not contain visible particles.
Figure 4.

Representative histology slides from embolizations performed in the livers of a porcine model. Globular material consistent with embolic particles (black arrows) can be seen occluding the lumen of blood vessels to varying degrees at low (a) and high (b) magnifications. Typical acute ischemic changes observed in the embolized lobes included moderate-to-severe hepatocyte dissociation with moderate-to-severe multifocal intralobular, interlobular, septal, periportal, central, and capsular hemorrhage (c). Sampled tissue from embolized lobes also included moderate-to-severe septal and periportal neutrophilic inflammation (d).
Figure 5.

An embolic density-blood velocity plot illustrating the number of embolic particles observed in sampled tissue relative to the qDSA calculated reduction in blood velocity. The data provided evidence of a moderate, positive correlation between the density of embolic particles in embolized tissue and the degree of blood velocity reduction achieved via embolization (p<0.01).
All embolized lobes showed evidence of acute ischemic changes (Figures 4c & 4d). These changes included moderate-to-severe hepatocyte dissociation with moderate-to-severe multifocal intralobular, interlobular, septal, periportal, central, and capsular hemorrhage. Additionally, there was moderate-to-severe septal and periportal neutrophilic inflammation. Hepatocyte degeneration and necrosis were low-to-moderate, but more significant in central regions of the liver compared to those at the periphery. Sections taken from lobes that were not embolized showed minimal hepatocyte loss and low numbers of neutrophilic and lymphocytic infiltration. There was minimal evidence to suggest ischemic changes in non-embolized lobes.
Discussion
The results indicate that qDSA is a more effective quantitative technique for determining treatment endpoints than the commercially available ccDSA technique (H1). Embolizations performed to greater degrees of stasis on angiography had correspondingly greater reductions in BFV as calculated by the qDSA method. Although the ccDSA method did calculate increased TTP after embolization, it was not able to significantly discriminate between stasis endpoints. Such a predictable relationship between velocity reduction on qDSA and degree of embolization is critical for determining in real-time, not only if additional embolic particles are needed to achieve sub-stasis, but approximately how many. qDSA may facilitate achieving standardized, reproducible, and objective endpoints during liver embolization given these results.
In a controlled setting, qDSA demonstrated a stronger correlation with the degree of embolization than a commercially available color-coded technique (ccDSA) that calculates TTP (H2). Techniques such as ccDSA use information in a limited spatial region of a vessel segment and may be more susceptible to variations in imaging parameters [11–13]. Additionally, image artifacts, such as those caused by respiratory motion, can introduce error in TTP calculations. Although ccDSA is capable of detecting a large change in flow, it is less suitable for intra-procedural guidance of an embolization. In contrast, the qDSA technique measures a physiologic variable, blood velocity, which is spatially-averaged, making it less susceptible to changes in imaging parameters. Additionally, temporal segmentation used in the qDSA calculation (removing frames corrupted by motion) makes the technique more robust and immune to motion artifacts present in a DSA sequence. The granularity achieved in measurements using qDSA may permit titration of an embolization in a way that is otherwise not achievable with currently available quantitative methods. Although DSA images were acquired in regular intervals for the purpose of this study, this technique may not be necessary clinically; instead the measurements may be used intermittently to quantitatively confirm progress of an embolization where a subjective angiographic assessment may otherwise be used.
On pathologic analysis, qDSA demonstrated a correlation with tissue level perfusion changes (H3). In gross assessment, the extent of ischemic damage inflicted on the liver parenchyma corresponded with embolizations performed to greater degrees of stasis as characterized by qDSA. Additionally, the reduction in velocity on qDSA had a moderate to strong correlation with embolic particle density of ischemic regions within the embolized lobe. This relationship between qDSA and pathology is important in confirming that the flow-based changes detected by the technique are an appropriate surrogate for tissue-level perfusion changes, the primary endpoint of interest for an embolization procedure.
Other attempts have been made to develop an objective embolization endpoint using volumetric imaging. One, quantitative 4D transcatheter intra-arterial perfusion MRI, showed promise, however, lacks feasibility as it requires a complex and costly hybrid angiography/MR suite only available at select institutions [18,19]. A recent study demonstrated the feasibility of using quantitative 4D-DSA to depict changes in hepatic arterial blood velocity during transarterial embolization in a swine model, but the method requires lengthy data acquisition times and greater amounts of iodinated contrast [20,21]. The 2D qDSA technique described here could be easily translated to intra-procedural clinical workflows given that it would only require modification to image acquisition parameters. Our qDSA calculations were performed in 1–2 minutes using a laptop computer; integration into an imaging system with high computing power would permit near-real time calculations (on the order of seconds).
It should be noted that, in its current form, qDSA does require additional radiation dose from additional DSA scans. Previous studies have shown the utility of quantitative fluoroscopy, although those techniques suffer from many of the same limitations as ccDSA [22]. qDSA may feasibly be performed using fluoroscopy, as long as there is sufficient signal in the image to identify peaks in the TAC and there is sufficient temporal resolution to sample the signal. This would significantly decrease radiation exposure compared to subtracted images.
This feasibility study had several limitations. TAE was performed in the livers of non-tumor bearing swine, a model which does not entirely represent the hemodynamics of a human liver with HCC. The qDSA method also has certain technical limitations including the calculation of blood flow velocity rather than flow, as it lacks the cross-sectional area measurement necessary to calculate volumetric flow. The results from this study, however, indicate that changes in relative velocity can be used as an appropriate surrogate for changes in flow. The shifted-least squares approach used in qDSA relies on adequate sampling of a time-varying pulsatile signal, which limits the ability to resolve vessels with very high blood velocities or the very low velocities observed at complete stasis (due to turbulent, retrograde flow disrupting the pulsatility). The qDSA method, however, does resolve most velocities within the normal range and those encountered routinely during interventions (including sub-stasis).
In conclusion, qDSA was able to quantify embolization endpoints using calculated blood velocity reductions. The velocity reductions were linear with respect to the baseline value and correlated pathologically with markers of perfusion changes, including tissue embolic particle density and extent of ischemic damage.
Supplementary Material
Acknowledgements
Sarvesh Periyasamy is supported by an MD-PhD Graduate Fellowship through the University of Wisconsin School of Medicine and Public Health, Department of Radiology, an NCI Ruth L. Kirschstein NRSA Fellowship 1F30CA250408-01, and an MSTP NIH Grant T32GM008692.
Carson Hoffman is supported by the Radiological Sciences Training Grant (NIH Grant T32CA009206 through the National Cancer Institute).
Portions of the image processing were performed on a GPU donated by the NVIDIA Corporation.
1. Funding
This study was not supported by any funding.
Disclosure: Grant received by Siemens Healthineers
Footnotes
Disclosure: Consultant, NeuWave Medical/Ethicon
Consultant and Shareholder, Elucent Medical
Shareholder, Histosonics and McGinley Orthopeadic Innovations
Conflict of Interest
Author Michael A. Speidel received a grant from Siemens Healthineers.
Author Paul F. Laeseke is a consultant for Neuwave Medical/Ethicon, a consultant and shareholder for Elucent Medical, a shareholder for Histosonics, and a shareholder for McGinley Orthopeadic Innovations.
For the remaining authors, no other conflicts were declared.
Ethical Approval
All applicable international, national, and/or institutional guidelines for the care and use of animals were followed.
All procedures performed in studies involving animals were in accordance with the ethical standards of the institution or practice at which the studies were conducted.
Informed Consent
For this type of study informed consent is not required.
Consent for Publication
For this type of study consent for publication is not required.
Contributor Information
Sarvesh Periyasamy, Department of Biomedical Engineering University of Wisconsin – Madison, Madison, WI.
Carson A. Hoffman, Department of Medical Physics University of Wisconsin – Madison, Madison, WI.
Colin Longhurst, Department of Biostatistics and Medical Informatics University of Wisconsin – Madison, Madison, WI.
Georgia C. Schefelker, Department of Radiology University of Wisconsin – Madison, Madison, WI.
Orhan S. Ozkan, Department of Radiology University of Wisconsin – Madison, Madison, WI.
Michael A. Speidel, Department of Medical Physics University of Wisconsin – Madison, Madison, WI.
Paul F. Laeseke, Section of Interventional Radiology, Department of Radiology University of Wisconsin – Madison, Madison, WI.
References
- 1.Geschwind J-FH, Ramsey DE, Cleffken B, et al. Transcatheter Arterial Chemoembolization of Liver Tumors: Effects of Embolization Protocol on Injectable Volume of Chemotherapy and Subsequent Arterial Patency. Cardiovasc Inter Rad. 2003;26(2):111–7. [DOI] [PubMed] [Google Scholar]
- 2.Rhee TK, Young JY, Larson AC, et al. Effect of Transcatheter Arterial Embolization on Levels of Hypoxia-inducible Factor-1α in Rabbit VX2 Liver Tumors. J Vasc Interv Radiol. 2007;18(5):639–45. [DOI] [PubMed] [Google Scholar]
- 3.Shim J, Park J, Kim J, et al. Association between increment of serum VEGF level and prognosis after transcatheter arterial chemoembolization in hepatocellular carcinoma patients. Cancer Sci. 2008;99(10):2037–44. [DOI] [PMC free article] [PubMed] [Google Scholar]
- 4.Kobayashi N, Ishii M, Ueno Y, et al. Co-expression of Bcl-2 protein and vascular endothelial growth factor in hepatocellular carcinomas treated by chemoembolization. Liver. 1999;19(1):25–31. [DOI] [PubMed] [Google Scholar]
- 5.Sergio A, Cristofori C, Cardin R, et al. Transcatheter Arterial Chemoembolization (TACE) in Hepatocellular Carcinoma (HCC): The Role of Angiogenesis and Invasiveness. Am J Gastroenterology. 2008;103(4):ajg200850181. [DOI] [PubMed] [Google Scholar]
- 6.Jin B, Wang D, Lewandowski RJ, et al. Chemoembolization endpoints: effect on survival among patients with hepatocellular carcinoma. Ajr Am J Roentgenol. 2011;196(4):919–28. [DOI] [PMC free article] [PubMed] [Google Scholar]
- 7.Lewandowski RJ, Wang D, Gehl J, et al. A Comparison of Chemoembolization Endpoints Using Angiographic versus Transcatheter Intraarterial Perfusion/MR Imaging Monitoring. J Vasc Interv Radiol. 2007;18(10):1249–57. [DOI] [PubMed] [Google Scholar]
- 8.Gaba RC, Wang D, Lewandowski RJ, et al. Four-dimensional Transcatheter Intraarterial Perfusion MR Imaging for Monitoring Chemoembolization of Hepatocellular Carcinoma: Preliminary Results. J Vasc Interv Radiol. 2008;19(11):1589–95. [DOI] [PMC free article] [PubMed] [Google Scholar]
- 9.Larson AC, Wang D, Atassi B, et al. Transcatheter Intraarterial Perfusion: MR Monitoring of Chemoembolization for Hepatocellular Carcinoma—Feasibility of Initial Clinical Translation. Radiology. 2008;246(3):964–71. [DOI] [PubMed] [Google Scholar]
- 10.Lin EY, Lee R-C, Guo W-Y, et al. Three-Dimensional Quantitative Color-Coding Analysis of Hepatic Arterial Flow Change during Chemoembolization of Hepatocellular Carcinoma. Journal of Vascular and Interventional Radiology. 2018;29:1362–1368. [DOI] [PubMed] [Google Scholar]
- 11.Ionita CN, Garcia VL, Bednarek DR, et al. Effect of injection technique on temporal parametric imaging derived from digital subtraction angiography in patient specific phantoms. Proc SPIE Int Soc Opt Eng. 2014;13(9038). 90380L. [DOI] [PMC free article] [PubMed] [Google Scholar]
- 12.Shpilfoygel SD, Close RA, Valentino DJ, et al. X-ray videodensitometric methods for blood flow and velocity measurement: A critical review of literature. Medical Physics. 2000;27:2008–2023. [DOI] [PubMed] [Google Scholar]
- 13.Kennedy AS, Kleinstreuer C, Basciano CA, et al. Computer Modeling of Yttrium-90–Microsphere Transport in the Hepatic Arterial Tree to Improve Clinical Outcomes. International Journal of Radiation Oncology*Biology*Physics. 2010;76:631–637. [DOI] [PubMed] [Google Scholar]
- 14.Wu Y, Shaughnessy G, Hoffman CA, et al. Quantification of Blood Velocity with 4D Digital Subtraction Angiography Using the Shifted Least-Squares Method. Am J Neuroradiol. 2018;39(10):1871–7. [DOI] [PMC free article] [PubMed] [Google Scholar]
- 15.Bates D, Mächler M, Bolker B, et al. Fitting Linear Mixed-Effects Models Usinglme4. Journal of Statistical Software. 2015;67. [Google Scholar]
- 16.Dunn OJ, Clark V. Correlation Coefficients Measured on the Same Individuals. Journal of the American Statistical Association. 1969;64:366–377. [Google Scholar]
- 17.R Core Team (2019). R: A language and environment for statistical computing. R Foundation for Statistical Computing, Vienna, Austria: URL https://www.R-project.org/. [Google Scholar]
- 18.Chen C-W, Hsu L-S, Weng J-C, et al. Assessment of small hepatocellular carcinoma: perfusion quantification and time-concentration curve evaluation using color-coded and quantitative digital subtraction angiography. Medicine. 2018;97. [DOI] [PMC free article] [PubMed] [Google Scholar]
- 19.Lin Y-Y, Lee R-C, Guo W-Y, et al. Quantitative Real-Time Fluoroscopy Analysis on Measurement of the Hepatic Arterial Flow During Transcatheter Arterial Chemoembolization of Hepatocellular Carcinoma: Comparison with Quantitative Digital Subtraction Angiography Analysis. CardioVascular and Interventional Radiology. 2016;39:1557–1563. [DOI] [PubMed] [Google Scholar]
- 20.Meram E, Harari C, Shaughnessy G, et al. Quantitative 4D-Digital Subtraction Angiography to Assess Changes in Hepatic Arterial Flow during Transarterial Embolization: A Feasibility Study in a Swine Model. J Vasc Interv Radiol. 2019;30(8):1286–92 [DOI] [PubMed] [Google Scholar]
- 21.Meram E, Shaughnessy G, Longhurst C, et al. Optimization of quantitative 4D-digital subtraction angiography in a porcine liver model. Eur Radiol Exp. 2020; 37(4). [DOI] [PMC free article] [PubMed] [Google Scholar]
- 22.Ghibes P, Hefferman G, Nikolaou K, et al. Quantitative Evaluation of Peripheral Arterial Blood Flow Using Peri-Interventional Fluoroscopic Parameters: An in Vivo Study Evaluating Feasibility and Clinical Utility. Biomed Res Int. 2020; 2020:9526790. [DOI] [PMC free article] [PubMed] [Google Scholar]
Associated Data
This section collects any data citations, data availability statements, or supplementary materials included in this article.