

Abstract
Cholangiocarcinoma (CCA) is a highly lethal disease without effective therapeutic approaches. The whole genome sequencing data indicated that there are about 20% of CCA patients having IDH1 mutations which have been suggested to target 2-oxoglutarate (OG) dependent dioxygenases in promoting CCA carcinogenesis. However, the clinical study indicates that the CCA patients with mutant IDH1 have better prognosis than those with wild-type IDH1, further complicating the roles of 2-OG-dependent enzymes. This study aimed to clarify if TET1, which is one of the 2-OG dependent enzymes functioning in regulating 5-hydroxymethylcytosine (5hmC) formation, is involved in CCA progression. By analyzing the Cancer Genome Atlas (TCGA) dataset, TET1 mRNA was found to be substantially up-regulated in CCA patients when compared with non-cancerous bile ducts. Additionally, TET1 protein expression was significantly elevated in human CCA tumors as well. CCA cells were challenged with α-ketoglutarate (α-KG) and dimethyl-α-KG (DM-α-KG) which are co-substrates for TET1 dioxygenase. The treatments of α-KG and DM-α-KG promoted 5hmC formation and malignancy of CCA cells. Molecular and pharmacological approaches were used to inhibit TET1 activity and these treatments substantially suppressed 5hmC and CCA carcinogenesis. Mechanistically, it was found that knockdown of TET1 may suppress CCA progression by targeting cell growth and apoptosis through epigenetic regulation. Consistently, targeting TET1 significantly inhibited CCA malignant progression in a liver orthotopic xenograft model via targeting cell growth and apoptosis. In conclusion, our data suggests that expression of TET1 is highly associated with CCA carcinogenesis. It will be important to evaluate the TET1 expression in CCA tumors before the application of IDH1 mutation inhibitor, since the inhibitor suppresses 2-HG expression which may result in activation of TET, potentially leading to CCA malignancy.
Keywords: alpha-ketoglutarate, cancer metabolism, IDH1 mutations, 2-hydroxyglutarate, bile duct cancer
Introduction
Cholangiocarcinoma (CCA) is originated from the bile duct and locates either inside or outside the liver. It is considered to be one type of liver cancers and surgical resection, if available, is probably the most effective treatment (1). However, most of patients are diagnosed at the late stage due to no obvious symptoms and there is no effective therapy for them. Thus, there is an urgent need for developing novel therapeutic targets for CCA patients. The recent studies have identified IDH1/2 mutations in about 20 % of CCA patients (2, 3) and suggested the potential of targeting these mutations in repressing CCA carcinogenesis (4). The function of wild-type IDH1/2 is to catalyze the reversible decarboxylation of isocitrate to α-ketoglutarate (α-KG) (5). Unlike wild-type IDH1/2, mutant IDH1/2 would produce 2-hydroxyglutarate (2-HG) which has been shown to promote malignant tumorigenesis by modulating epigenetic modification and altering 2-oxoglutarate (2-OG) dependent dioxygenases (6–8). Due to this finding, the specific inhibitors for IDH1 and IDH2 mutations have been developed and their therapeutic potentials have been confirmed in preclinical animal models (9, 10). Surprisingly, it was found that patients with mutant IDH have better prognosis than those with wild-type IDH in glioma(11), acute myeloid leukemia(12), and CCA(13). In addition, expression of mutant IDH1 in established wild-type IDH1 glioma cells could substantially inhibit the malignant progression in vitro and in vivo(14). Although it may be possible that the molecular signaling transduction is slightly different among these three types of cancers, the major effects shall be very similar. Under these circumstances, we may have to carefully evaluate the functions of those 2-OG dependent enzymes in CCA carcinogenesis before we can apply the specific inhibitors for IDH mutations in clinical.
The methylcytosine dioxygenase TET1 (TET1) is one of the 2-OG dependent dioxygenases involved in modulating formation of 5-hydroxymethycytosine (5hmC) which has been proposed to participate in active DNA demethylation process(15). There are three TET family enzymes including TET1, TET2, and TET3. Although they are all involved in regulating 5hmC, they do affect its formation in distinct subsets of target genes (16, 17). Loss of TET2 has been demonstrated to promote leukemiogenesis(18). Knockout of TET3 in TET2 deficient mice could acutely result in aggressive myeloid cancer (19). Unlike TET2 and TET3, TET1 has been shown to function either as an oncogene or a tumor suppressor in leukemia (20, 21). Interestingly, this controversial phenotype has also been described in glioma (22, 23). Although there are studies indirectly linking TET1 as a tumor suppressor in liver cancers (24), there is no direct evidence demonstrating TET1’s role in CCA progression. Thus, the current study aimed to clarify the role of TET1 in the malignant progression of CCA.
Materials and Methods
Cell lines and reagents
H1, SSP25, TFK-1, and HuCCT1 cells were purchased from RIKEN cell line bank (Japan). These cell lines were maintained in complete RPMI growth medium which contains 10% fetal bovine serum (FBS), 2mM L-glutamine, and 100U/ml penicillin-Streptomycin. The pLKO.1-shRNA-luciferase (shLuc), pLKO.1-shRNA-TET1 clones #23 (shTET1#23), and #26 (shTET1#26) were purchased from Dharmacon (Clone ID: TRCN0000075023 for shTET1#23, and Clone ID: TRCN0000075026 for shTET1#26, Lafayette, CO). Primary human cholangiocytes which are positive for CK7 and CK19 were purchased from Celprogen Inc (Catalog Number : 36755-12) were plated in the special dishes coated with matrix (Celprogen Inc , Catalog Number : E36755-12-T75) and maintained in the cholangiocyte specific medium (Celprogen Inc, Catalog Number : M36755-12S). The human cholangiocytes were negative for HIV1 and 2, Syphilis, Hepatitis B Virus, Human T Lymphocyte Virus 1 and 2, Hepatitis C Virus, West Nile Virus, and Trypanosoma cruzi. The human cholangiocytes which have been simultaneously immortalized by us were named as hBD cells and maintained in regular cell culture dishes with the complete DMEM growth medium prepared with 10% fetal bovine serum, 1% L-glutamine, and 1% penicillin/streptomycin. Reagents used in the current study including α-ketoglutarate (α-KG), dimethyl-α-ketoglutarate (DM-α-KG), deferoxamine mesylate (DFO), dimethyloxalylglycine (DMOG), noble agar, thiazolyl blue tetrazolium blue (MTT), and methylene blue were all from Sigma-Aldrich (St. Louis, MO).
MTT cell growth assay
To analyze cell growth, 1-2x10^3 H1, HuCCT1, SSP25, and TFK1 cells were prepared in complete RPMI growth medium and seeded in 96-wells plates. For hBD cells, 1x10^3 cells were prepared in DMEM medium and seeded onto 96-well culture plates. For the treatments of DMOG, DFO, α-KG, DM-α-KG, CCA cells were challenged with 1mM DMOG, 100μM DFO, 25μM α-KG, and 62.5 μM DM-α-KG 24 hours post-seeding. The treatments were changed daily as indicated at days 1, 2, 3, 4, and 5. For shLuc-, shTET1#23-, and shTET1#26-treated CCA cells, CCA cells were prepared in RPMI medium and seeded in 96-wells plates. For MTT incubation, culture medium were replaced with 5mg/ml MTT solution (prepared in sterile PBS) diluted in complete RPMI medium (1:10 ratio) and incubated for 1-2 hours. After incubation, discard the incubation solution and dissolve the purple MTT crystal (this may be stored at −20°C for 1 week) with DMSO. The solution with dissolved MTT crystal was measured at OD570 and OD650. The relative cell growth rates were calculated using the values of OD570-OD650.
Soft agar colony formation
A base agar layer was prepared with 0.5ml 2X RPMI (RPMI for 1 liter package was prepared in 500ml sterile water with 20% FBS, 4mM L-glutamine, and 200U/ml penicillin-Streptomycin) and 0.5ml 1.6 % noble agar. After the base agar became solid, 2.5-5 x 10^4 H1, HuCCT1, TFK1, and SSP25 cells were prepared in 0.5ml 2X RPMI and mixed with 0.5 ml 0.8 % noble agar. The mixed cells were immediately seeded on the top of base agar before becoming solid. When the cell layer became solid, 0.5ml complete culture medium was added to the well. Culture medium was replaced by removing 0.35ml old medium and adding 0.5ml complete culture medium. Cells were maintained for 14-21 days and formed colonies were stained with 10% Giemsa staining solution. Stained colonies were imaged with camera and counted manually.
Lentiviral virus production
The HEK-293T cells were sub-cultured in a 10-cm cell culture dish 24 hours before transfection. To do trasnfection, the psPAX2 (5μg), pMD.2G (2μg), and pLKO.1 (10μg) containing target shRNAs were mixed in 1.5 ml OPTI-MEM. The mixture was further mixed with 45μl TransIT-LT1 (Mirus Bio) and incubated for 20 minutes. After that, the transfection mixture was added to the HEK-293T cells which were sub-cultured one day before transfection. 48 hours post-transfection, supernatants which contain lentivirus was collected and filtrated through a 0.45μm sterile filter. 72 hours later, lentivirus was collected again. The mixture of lentivirus and culture medium containing 4μg/ml polybrene was applied to CCA cells right after collection and incubated for 24 hours. 72 hours post-infection, the CCA cells were selected for 48 hours by puromycin and subjected to the proposed experiments.
Animal study
6-weeks old nude mice were purchased from Charles River Laboratories (Wilmington, MA). 2x10^6 H1 CCA cells transduced with shRNA-luciferase or shRNA-TET1 were prepared in serum free DMEM plus matrixgel (1:1 ratio) and orthotopically and slowly inoculated into the liver. The experimental animals were monitored for 3 weeks and the tumor volumes were calculated by the formulation (Widtĥ2 x Length)/2. Tumor weights were measured using a scale. The mice were euthanized with CO2 following cervical dislocation. The tumors were removed and dissected for further analysis. All protocol was approved by the Institutional Animal Care and Use Committee of the First Affiliated Hospital of Harbin Medical University.
Dot blot assays of 5hmC and methylene blue staining
Genomic DNA of treated cells was prepared using phenol/chloroform extraction. Basically, cells were lysed with 500μl DNA lysis buffer (10mM Tris pH8.0, 100mM NaCl, 10mM EDTA pH8.0, 0.5 % SDS in dH2O) plus 10μl proteinase K (20mg/ml) at 55°C water bath overnight. The lysed cells were mixed with 200μl solution of phenol:chloroform:isoamyl alcohol (25:24:1 saturated with 10 mM Tris, pH 8.0, 1 mM EDTA; please take upper layer of the solution without mixing the lower layer part), shaked by hands for 3 minutes, centrifuged at 14000rpm for 3 minutes. 300 μl of supernatant were carefully transferred to a new tube, mixed with 300 μl isopropanol, incubated at room temperature for 10 minutes, and centrifuged at 12000rpm for 10 minutes. Supernatants were gently discarded without losing DNA. DNA pellets were washed with 1ml 75% ethanol and centrifuged at 12000rpm for 3 minutes. Discard supernatants and air dry the DNA for 20 minutes. DNA was dissolved in TE buffer and quantified accordingly. To do 5hmC dot blot assay, DNA was denatured at 100°C for 10 minutes and rapidly cooled down on ice before applying to a GeneScreen Plus Hybridization Transfer Membrane (PerkinElmer). 1, 0.5, 0.25 μg of denatured DNA was blotted on a spot of the membrane, air dried for 30 minutes, and cross linked with UV light. The membrane was blocked with 5% milk prepared in TBST at room temperature for 1 hour and incubated with the 5hmC antibody (ActiveMotif) prepared in TBST (1:10000 dilution) at 4°C overnight. The membrane was washed with TBST for 5 minutes 3 times and then incubated with goat anti-rabbit antibody conjugated with HRP (1:10000 dilution) for 1 hour. The membrane was washed with TBST 10 minutes for 3 times and incubated with SuperSignal™ West Dura Extended Duration Substrate (Thermo Fisher Scientific). The images were taken using a Bio-Rad gel image system. 5hmC quantification was done using the image J software (NIH). For methylene blue staining, 1, 0.5, 0.25 μg of non-denatured DNA was blotted on a new membrane, air dried for 30 minutes, and fixed with the UV light. The membrane was stained with methylene staining solution (0.1% methylene in 0.5 M sodium acetate, pH 5.2) for 15 minutes. The membrane was washed in deionized H2O for 3 minutes 3 times. Images were taken and quantified as 5hmC ones.
Real-time quantitative PCR (RT-qPCR)
To prepare mRNA, cells were lysed with 1ml TRIzol (Thermo Fisher Scientific) at room temperature for 30 minutes. The TRIzol lysed cells were processed and mRNA was extracted according to the instruction manual. 1μg of mRNA was used to perform reverse transcription by using the iScript™ cDNA Synthesis Kit (Bio-Rad). The specific primers listed in Supplemental table 1 were used to analyze gene changes in shLuc, shTET1#23, and shTET1#26 CCA cells. The RT-qPCR reactions were performed with the SYBR green master mix reagent and relative gene changes were analyzed using the ΔΔCt protocol.
Western blotting
Cells were lysed with the Radioimmunoprecipitation buffer (Thermo Fisher Scientific) and quantified with the Pierce BCA Protein Assay Kit (Thermo Fisher Scientific). Protein samples (50μg of total protein) were mixed with protein sample buffers, incubated at 100°C for 5 minutes at a heat block, and immediately cooled down at ice for 5 minutes. To detect TET1 protein, a 6% SDS-PAGE gel was used to resolve protein samples. 10% SDS-PAGE gels were used to analyze cyclin D1, cyclin E, PCNA, α-tubulin, Bcl-XL, Bcl2, and GAPDH. For pro-caspase 3 and cleaved caspase 3, a 15% SDS-PAGE was used. To examine γ-H2AX, a 12% SDS-PAGE gel was adopted. The detail western blotting procedures were performed as previously described (25). The secondary antibodies used in this study were anti-mouse-conjugated (Santa Cruz Biotechnology, 1:3000) in with HRP and anti-rabbit-conjugated with HRP (Santa Cruz Biotechnology, 1:10000). Protein images were taken as described in 5hmC section.
Human tissues
Human tumor tissues (n=91) and non-cancerous biliary tissue samples (n=12) were from the pathology department of the First Affiliated Hospital of Harbin Medical University. This study was approved by the Institutional Review Board (IRB) of the First Affiliated Hospital of Harbin Medical University and conducted in accordance with all current ethical guidelines.
Immunohistochemistry
Tumor tissues or non-cancerous biliary tissues were fixed in 4% formaldehyde, embedded in paraffin, and prepared into 4-μm-thick slices. The antigen was retrieved and endogenous peroxidase activity was quenched through a 30-minute treatment in methanol with 3% hydrogen peroxide. Non-specific antigen was blocked for 1h. The slices were incubated with primary antibodies (TET1 Invitrogen, #MA5-16312; TET2 Abcam, #ab94580; TET3 Invitrogen, #PA5-31860) overnight at 4°C. After rinsed, HRP (Vector Laboratories, #PK-6102) was added into the slices and incubated for 40 minutes. The slices were incubated with peroxidase-label for 30 minutes, developed with DAB Kit (Vector Laboratories, #SK-4100) and counterstained with hematoxylin. For quantitation, 5 microscopic fields were randomly selected at 100× magnification. Images were analyzed by ImageJ software (U. S. National Institutes of Health, Bethesda, Maryland, USA, https://imagej.nih.gov/ij/).
Insilco analysis
We obtained the mRNA expression profiles of CCA and non-cancerous bile duct tissues from GSE76297, GSE89747, GSE26566, and The Cancer Genome Atlas Program (TCGA) which includes 36 tumor and 9 normal samples, . To compare the difference of expression levels, we performed the Student T test.
To assess the linkage of signaling pathways for the gene list of α-KG dependent enzymes, gene ontology (GO) term analysis was conducted by using GO-directed acyclic graph chart of 10 GO terms which belong to molecular function. Each node at the right half of the circle represents one of the 10 GO terms and each node at the left half of the circle represents a gene.
To evaluate the potential of pathway that TET1 might be involved in CCA progression, we employed the “GSVA” package and KEGG signaling pathways to show the difference of activated pathways in high and low TET1 groups, of which the TET1 level was divided by the mean TET1 expression calculated from all TCGA-CHOL patients.
Statistical analysis
The treatment groups were compared to their relative controls. Thus, the student t test was used to analyze statistical difference between control and treatment groups. A p value less than 0.5 is considered as significant difference.
Results
TET1 is highly expressed in CCA tumors.
Differential expression levels of 2-OG-dependent enzymes were identified among non-cancerous biliary tissues, CCA tumors with WT IDH1, and CCA tumors with mutant IDH1 (Fig. 1A). We, by evaluating the statistical difference using false discovery rate correction, did not observe significant difference between CCA tumors with WT IDH1 and those with mutant IDH1 regarding the mRNA expression of 2-OG dependent enzymes (data not shown). The function of 2-OG dependent enzymes and the linkage between molecular signaling pathways and these enzymes were illustrated (Fig. 1B). Recent studies have indicated the important role of 5-hydroxymethylcytosine (5hmC) in CCA progression (26, 27). Thus, we examined how the TET family enzymes which function in regulating 5hmC formation are altered in non-cancerous bile duct tissues and CCA tumors. Interestingly, significant up-regulation of TET1, TET2, and TET3 mRNA expression was observed in CCA samples when compared with control bile ducts (Fig. 1C and Supplemental Fig. 1). We then examined the protein expression of TET2 and TET3, which are reproducibly demonstrated to be tumor suppressors(18, 19), in control and CCA samples. It was found that TET3 is elevated in CCA samples whereas TET2 is down-regulated in the tumors (Supplemental Figure 2). To illustrate the impact of TET1 on CCA malignancy (20, 21, 28), we determined the protein expression of TET1 and found that it is signficiantly increased in CCA malignant tissues (Fig. 1D–E). More important, the protein expression level of TET1 is found significantly correlated with CCA malignant progression (Table 1). The biochemical assays also revealed liver damages in CCA patients (Table 2). To clarify how TET1 is altered in CCA tumors, we, by adopting the Welch Two Sample t-test, analyzed the methylation status of TET1 promoter regions between control and CCA samples in TCGA-CHOL dataset. There is no significant difference regarding TET1 promoter methylation between non-cancerous bile duct and CCA tissues (p=0.207). The treatment of DNA methylation inhibitor-5-Azacytidine (5-Aza) did not induce TET1 expression, either (Supplemental Fig. 3). This corroborated that TET1 elevation in CCA tumors is not due to TET1 promoter methylation. We further analyzed if TET1 expression has correlation with the expression of IDH1/IDH2 and TP53, IDH1/2 mutation, and TP53 mutation. We did not identify any significant correlation of TET1 with those targets analyzed among different datasets (Supplemental tables 2–5, except TP53 in TCGA-CHOL dataset (p=0.0018) and IDH2 in GSE266566 dataset (0.039174). Together, these results suggest the involvement of TET1 in CCA carcinogenesis.
Figure 1.
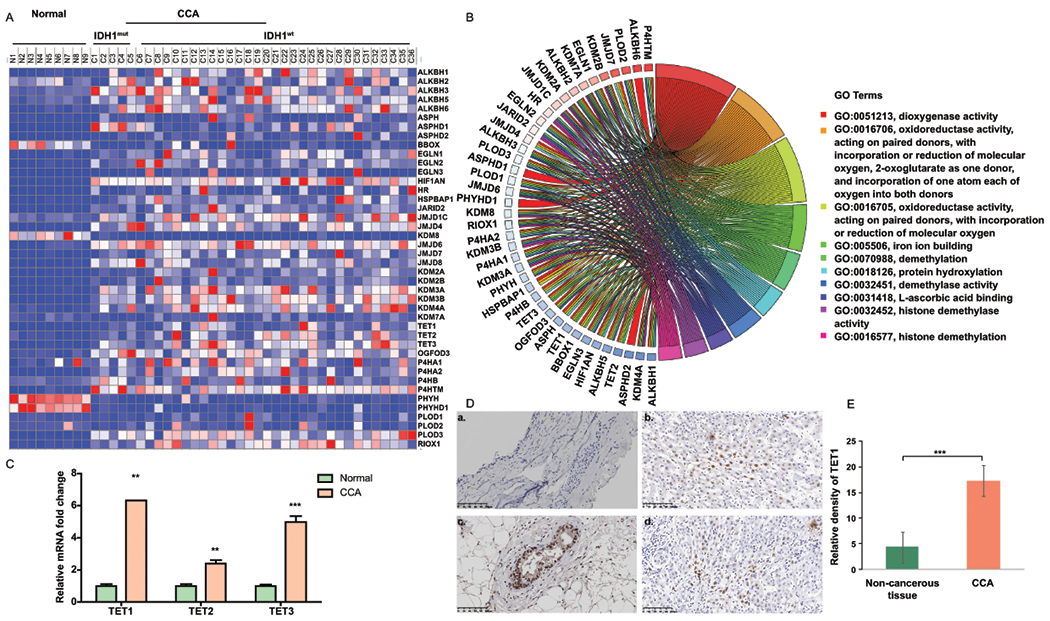
TET1 expression is elevated in CCA patients. (A) Heat map for the expression of 2-oxogluratate dependent enzymes was generated by using TCGA data which includes 9 normal samples, 6 CCA tumors with IDH1 mutation, and 30 CCA tumors with IDH1 wild-type. (B) The association of molecular signaling pathways and functions with α-KG dependent enzymes. (C) Relative TET1, TET2, and TET3 mRNA expression levels were analyzed in human normal bile ducts (n=9) and CCA patients (n=36) by using TCGA data. (D) The representative TET1 immunohistochemistry (IHC) images were shown in non-cancerous bile duct (a) and CCA samples(b-d). (E) Semi-quantification of TET1 IHC staining data was calculated by using the Image J software. **, p<0.01; ***, p<0.001 when compared with relevant control.
Table 1.
The correlation of clinical features and TET1 expression in CCA patients. Data was presented as mean±SD.
| Variable | Relative density of TET1 (IHC) | P |
|---|---|---|
| Pathological type | ||
| Well and moderately differentiated (n=53) | 16.28 (4.91) | 0.034 |
| Poorly differentiated (n=38) | 18.75 (5.71) | |
| Location of primary tumor | ||
| Intrahepatic cholangiocarcinoma (n=14) | 22.53 (4.27) | 0.007 |
| Extrahepatic cholangiocarcinoma (n=77) | 16.36 (5.07) | |
| Overall survival | ||
| < 1 year (n=19) | 24.35 (7.81) | 0.001 |
| > 1 year (n=72) | 15.45 (5.53) |
Table 2.
Patient clinical features. Pancreatic ductal adenocarcinoma, PDAC; Intraductal Papillary Mucosal Neoplasms, IPMN. Data was presented as mean SD.
| Variable | Non-Cholangiocarcinoma (n=12) | Cholangiocarcinoma (n=91) | P |
|---|---|---|---|
| Age (Years) | 54.4 (13.7) | 67.2 (8.5) | 0.011 |
| Gender | |||
| Female | 5 | 40 | |
| Male | 7 | 51 | |
| Primary disease | Chronic pancreatitis (2), PDAC (5), Ampullary carcinoma (3), IPMN (2) | Intrahepatic or Extrahepatic cholangiocarcinoma | |
| Operation | Pancreatoduodenectomy | Pancreatoduodenectomy | |
| Lab examination | |||
| ALT (U/L) | 90.23 (76.51) | 186.41 (79.38) | 0.033 |
| AST (U/L) | 73.38 (47.70) | 195.86 (114.54) | 0.035 |
| TBIL (umol/L) | 87.16 (84.53) | 220.33 (144.19) | 0.046 |
| DBIL (umol/L) | 51.30 (61.76) | 131.22 (79.36) | 0.027 |
| CA19-9 (U/ml) | 293.47 (370.77) | 195.20 (131.95) | 0.368 |
| CEA (ng/ml) | 4.77 (3.32) | 3.95 (3.14) | 0.920 |
| AFP (IU/ml) | 2.90 (2.04) | 3.24 (2.85) | 0.596 |
| Diabetes | 5 (41.7%) | 22 (24.2%) | |
| Smoking | 6 (50%) | 38 (41.8%) | |
| Drinking | 4 (30%) | 24 (26.3%) | |
| NASH | 2 (16.7%) | 15 (16.5%) | |
| Hepatitis | 1 (8.3%) | 8 (8.8%) | |
| Pathology diagnosis | Non-tumorous biliary tissue | Cholangiocarcinoma |
Altering TET1 activity affects CCA growth.
To determine the role of TET1 in CCA progression, we examined TET1 expression in cholangioctyes (hBD) and CCA cell lines, including H1, HuCCT1, SSP25, and TFK-1 which all have wild-type IDH1(29). We found that all CCA cell lines examined have higher TET1 expression than hBD (Fig. 2A). TET2 and TET3 were examined in these cells. Interestingly, TET2 is up-regulated but TET3 is down-regulated in CCA cells when compared with non-malignant cholangiocytes (Fig. 2A). We activated TET1 activity in H1, HuCCT1, SSP25, and TFK-1 cells by using α-KG and DM-α-KG which is a potent form of α-KG. Both treatments significantly increased CCA cell growth about 10-20% (Fig. 2B and C), but they failed to promote cell growth in CCA cells with TET1 deficiency. These treatments did not affect cell growth in cholangiocytes, either (Supplemental Fig. 4). We then used an iron chelator-DFO and the α-KG antagonist-DMOG to suppress TET1 activity in CCA cells and evaluated the consequent impact on carcinogenesis. Consistently, inhibiting TET1 activity diminished CCA growth (Fig 2D and E). The 5hmC dot blot assay was used to validate TET1’s enzymatic activity. As shown, α-KG and DM-α-KG increased 5hmC formation in a serial dilution of DNA dot blot assay in CCA cells, whereas DFO and DMOG treatments suppressed it. The methylene blue staining results indicated even loading of DNA from all samples (Fig. 2H). The TET1 protein expression levels were determined in CCA cells treated with α-KG, DM-α-KG, DFO, and DMOG. The treatments of α-KG and DM-α-KG slightly promoted TET1 expression, but DFO and DMOG substantially reduced TET1 expression (Fig. 2F). To further determine the role of TET1 in CCA carcinogenesis, the anchorage-independent soft agar colony formation assay was also adopted herein. As expected, α-KG and DM-α-KG promoted soft agar colony formation in H1 and HuCCT1 CCA cells. DFO and DMOG significantly inhibited anchorage-independent growth abilities in those cells (Fig. 2G). Our results suggested that altering TET1 activity affects CCA growth.
Figure 2.
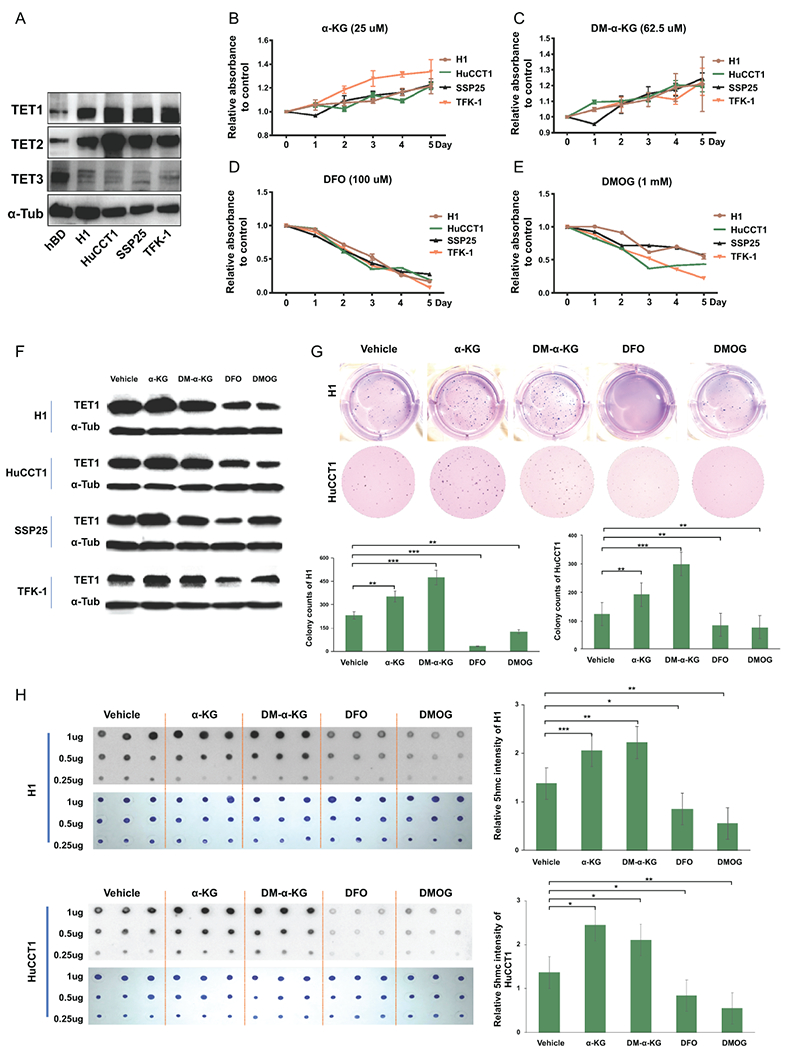
CCA cell growth was modulated by TET1 activity. (A) The expression levels of TETs in normal cholangiocytes (hBD) and CCA cell lines (H1, HuCCT1, SSP25 and TFK-1) were examined by western blotting. The results of cell growth rates were analyzed in CCA cells treated with (B) α-KG, (C) DM-α-KG, (D) DFO, and (E) DMOG as indicated. The medium including agents were changed every other day. (F) TET1 protein expression was determined in CCA cells treated with α-KG, DM-α-KG, DFO and DMOG for 3 days. α-Tubulin served as loading control. (G)The colony formation abilities were evaluated in H1 and HuCCT1 in the presence or absence of α-KG, DM-α-KG, DFO and DMOG. Graph results indicate the average of triplicate experiments. (H) Dot blot assays were adopted to analyze 5hmC (black spots) levels in H1 (upper panel) and HuCCT1 (lower panel) cells treated as indicated for 3 days. The methylene blue staining data (blue spots) served as DNA loading control. Graph next to the 5hmC image is quantification of 5hmC. *p<0.05; **p<0.01; ***p<0.001.
Knockdown of TET1 substantially suppressed CCA carcinogenesis in vitro.
We used shRNA-TET1 to specifically knockdown TET1 expression in four CCA cell lines and evaluated this impact on CCA progression. To prevent off-target effects, we selected 2 shRNAs for knocking down TET1, including shTET1#23 and shTET1#26, in those CCA cell lines. Both shRNAs successfully reduced TET1 expression, although they had differentially suppressive effects on TET1 in those cells. The results of MTT assay suggested that specific inhibition of TET1 did substantially decrease CCA cell growth (Fig. 3A–D). The anchorage-independent soft agar colony formation was used to verify this finding. When compared to the shLuc control cells, both shTET1#23 and shTET1#26 strongly repressed the colony formation capacities of 2 CCA cell lines (Fig. 3E). The results of 5hmC dot blot and methylene blue staining assays demonstrated successful inhibition of TET1 enzymatic functions in catalyzing 5hmC formation in CCAs (Fig. 3F). Thus, specifically targeting TET1 led to substantial suppression in CCA malignancy.
Figure 3.
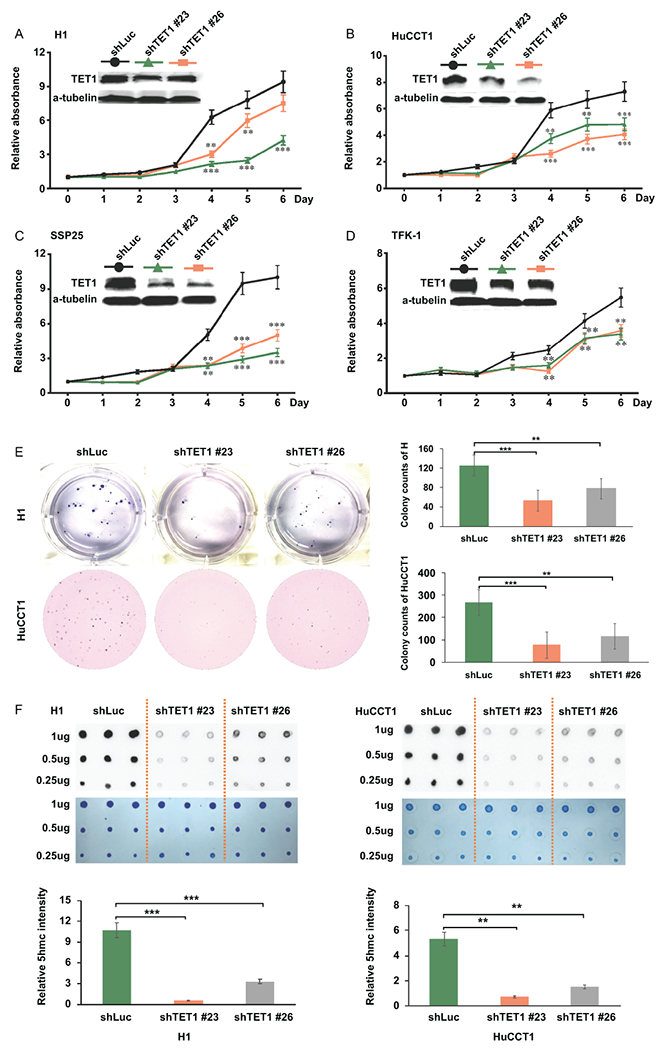
Targeting TET1 specifically with 2 shRNAs reduced CCA cell growth. (A-D) Relative cell growth rates were analyzed (A) H1, (B) HuCCT1, (C) SSP25 and (D) TFK-1 treated with shRNA-luciferase (shLuc), shRNA-TET1#23 (shTET1#23), and shRNA-TET1#26 (shTET1#26) by MTT assay. The relative absorbance is the ratio of the absolute value of absorbance at the specific time point to the day 0. The western blotting data was used to verify TET1 down-regulation. (E) Knockdown of TET1 reduced soft-agar colony formation abilities of H1 and HuCCT1. (F) Dot blot results of 5hmC in H1 and HuCCT1 treated with shLuc, shTET1#23, and shTET1#26. Methylene blue staining data served as DNA loading control. Bottom graph results show the quantification of 5hmC. *p<0.05; **p<0.01; ***p<0.001.
Inhibiting TET1 resulted in down-regulation of proliferative and anti-apoptotic signaling pathways.
To determine the molecular mechanisms by which TET1 modulates CCA progression, we examined mTOR, PI3K, EGFR, Akt, and PDGFα pathways since the TET1-mediated activation of these oncogenic pathways has been suggested in triple-negative breast cancers(30). However, we did not observe similar impacts of TET1 on these pathways in CCA cells (Supplemental Fig. 5). Therefore, we further screened a panel of genes related to cell proliferation and analyzed cyclin D1 and cyclin E which have been previously demonstrated down-regulated in TET1-knockdown cells (31). We found that knockdown of TET1 did not have consistent impacts on the expression levels of CDK4, cdc25a, CDKN1A, CDKN2B, CDKN2C which are critical mediators in cell cycle progression and cell proliferation (Supplemental Fig. 6). Interestingly, shTET#23 and shTET#26 both significantly suppressed cyclin D1 and cyclin E expression in H1 and HuCCT1 CCA cells (Fig. 4A and B). These findings were further verified in protein expression. TET1 was demonstrated significantly down-regulated (Fig. 4C). Additionally, the protein expression levels of cyclin D1 and cyclin E were found decreased upon knockdown of TET1 in CCA cells. The cell proliferation marker, Ki67 was found down-regulated as well. But, PCNA was not altered in TET1 knockdown cells (Fig. 4D). Thus, the mRNA and protein expression data demonstrated that targeting TET1 may suppress CCA cell growth via targeting cell proliferation.
Figure 4.
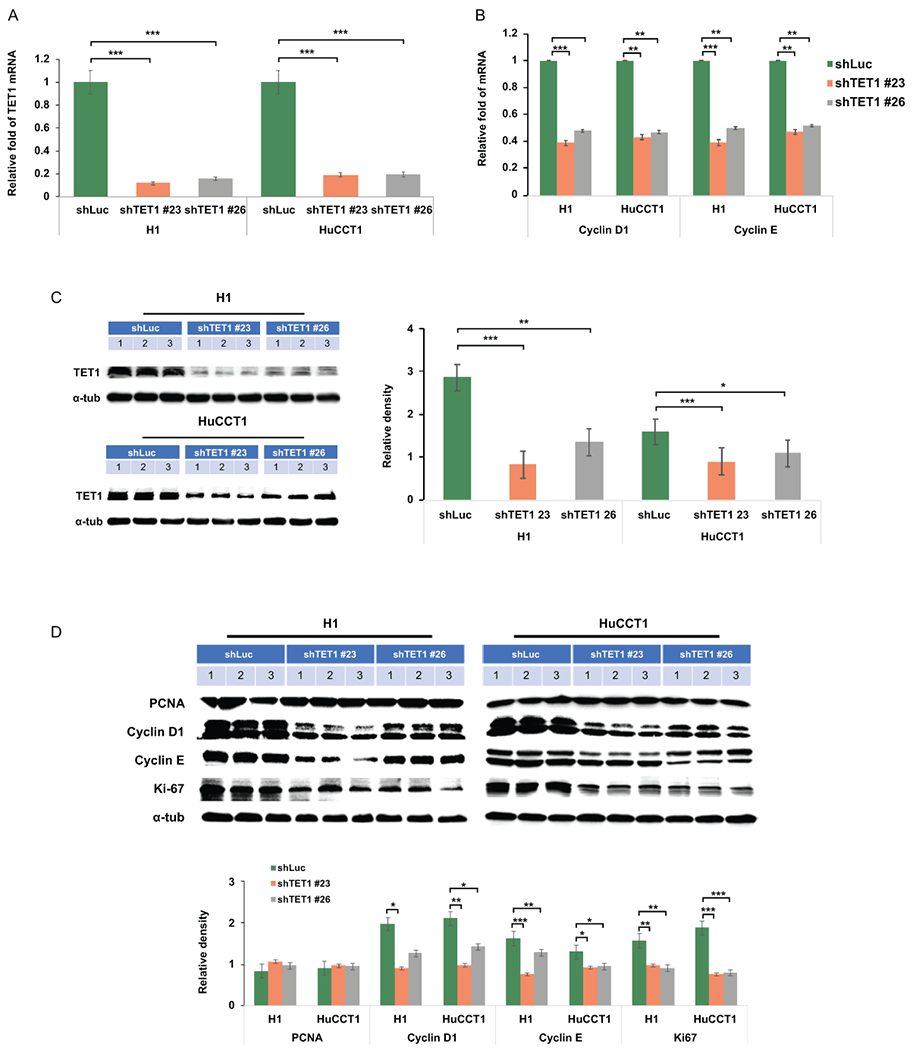
Knockdown of TET1 inhibited cell proliferation associated signaling pathways. (A) TET1, (B) cyclin D1, and cyclin E1 mRNA expression levels were examined in shLuc-, shTET1#23-, and shTET1#26-treated H1 and HuCCT1 cells. (C) TET1 protein levels were verified in H1 and HuCCT1 cells as indicated. (D) PCNA, cyclin D1, cyclin E1, and a-tubulin were determined in control and TET1-knockdown H1 and HuCCT1 CCA cells. Graph results indicate the average of triplicate semi-quantifications of western blotting data. *p<0.05; **p<0.01; ***p<0.001.
Cell apoptosis is one of the factors contributing to cell growth retardation. Thus, we analyzed the molecules involved in cell apoptosis. As shown the pro-apoptotic genes were not significantly altered, except Mcl-1 (Supplemental Fig. 7). However, elevation of Mcl-1 should promote cell survival which we did not observe in TET1 knockdown cells. We also identified some significant changes in anti-apoptotic and DNA damage associated genes, including Bcl-2 and Bcl-XL(32), in shTET1#23- and shTET1#26-treated CCA cells when compared with the controls (Fig. 5A). The cell apoptosis marker, cleaved PARP was also measured in control and TET1 knockdown CCA cells. Down-regulation of anti-apoptotic genes in TET1 knockdown CCA cells did exert its effects in promoting cell apoptosis as evident with increased expression cleaved PARP (Fig. 5B). As DNA damage has been previously demonstrated to be involved in TET1-mediated apoptosis(33), we examined the DNA damage biomarker, γ-H2aX in these cells. The results indicated that elevated DNA damage occurred in TET1 knockdown CCA cells (Fig. 5C). Mechanistically, our signaling transduction studies demonstrated that targeting TET1 promotes DNA damage and apoptosis in CCA cells. To get insight whether TET1 epigenetically modulates the genes involved in these cellular phenotypes, we challenged cells with 5-Aza and evaluated how it affects TET1-mediated cyclin D1, cyclin E1, Bcl-2, and Bcl-XL expression. It was found that treating CCA cells with 5-Aza for 48 hours could mitigate the impact of TET1 knockdown on the protein expression of these genes (Supplemental Fig. 8). To further clarify how TET1 modulates CCA progression, we divided TCGA-CHOL samples into TET1 high and low groups by using median TET1 value as a cutting point. After gene set enrichment analysis(34), we found that Notch and ErbB signaling pathways are highly associated with TET1 expression (Supplemental Fig. 9). We then deciphered how they impact TET1-mediated CCA growth which is a combined outcome of cell proliferation and apoptosis. We challenged shLuc and shTET1#23 CCA cells with DAPT which is an inhibitor for γ secretase, an enzyme required for notch1 activity, and PD98059 which is an Inhibitor for MEK1 and MEK2, downstream signaling cascade of ErbB. It was found that these inhibitors substantially minimize the difference of cell growth between shLuc and shTET1 groups. Besides, we found that overexpression of intracellular domain of notch1 and MAPK, which is ErbB downstream kinase, in shTET1-treated cells significantly mitigate the impacts of TET1 knockdown on CCA growth (Supplemental Fig. 10). Taken together, TET1 may regulate cell growth and apoptosis via epigenetically modulating notch and ErbB signaling pathways.
Figure 5.
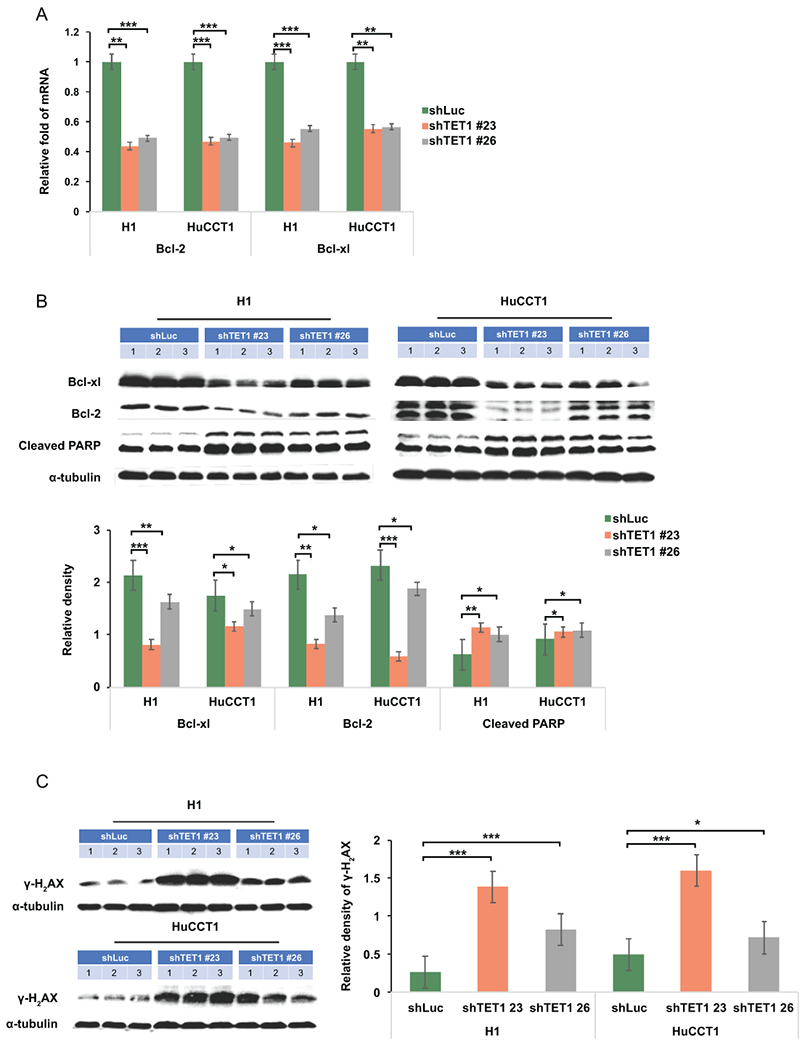
TET1 down-regulation suppressed anti-apoptotic protein expression but had no impacts on pro-apoptotic genes. (A) The mRNA expression of anti-apoptosis protein Bcl-2 and Bcl-XL was examined in CCA cells treated as indicated. (B) BCL-XL, Bcl2, cleaved PARP, and (C) γ-H2aX were determined in shLuc-, shTET1#23-, and shTET1#26-treated H1 and HuCCT1 cells. α-tubulin served as loading control. Graph data shows semi-quantification of western blotting results. *p<0.05; **p<0.01; ***p<0.001.
Targeting TET1 substantially inhibited CCA malignant progression in a liver orthotopic xenograft model.
To further determine if inhibition of TET1 suppress CCA malignant progression in vivo, we generated an orthotopic xenograft model by intrahepatically inoculating control and TET1 knockdown H1 CCA cells into nude mice. As expected, shLuc-treated H1 control CCA cells could form a huge tumor in the mouse liver. Intriguingly, knockdown of TET1 substantially reduced CCA tumor growth (Fig. 6A). By evaluating the histological results, the tumor samples derived from TET1 knockdown CCA cells were less malignant than those with control ones (Fig. 6B). More important, knockdown of TET1 significantly inhibited CCA carcinogenesis by reducing tumor weight and the ratio of tumor weight over mouse body weight in vivo (Fig. 6C). The TET1 protein expression levels were verified in controls and TET1 knockdown tumors (Fig. 7A). We also determined expression levels of several growth associated protein, including cyclin D1 and cyclin E in those samples. They were all significantly down-regulated in TET1 knockdown tumor tissues (Fig. 7B). The anti-apoptotic proteins, Bcl-2 and Bcl-XL were both decreased in TET1 knockdown ones. The apoptotic markers cleaved PARP and cleaved caspase 3 were found elevated in those tumors with TET1 knockdown (Fig. 7C). Furthermore, the DNA damage marker, γ-H2aX was demonstrated increased in TET1 knockdown tumors (Fig. 7D). The mRNA expression levels of cyclin D1 (CCND1), cyclin E1 (CCNE1), Bcl-2 (BCL2), and Bcl-XL (BCL2L1) were found increased in human CCA samples as well (Fig. 7E). Collectively, our data clearly suggested the role of TET1 in promoting CCA malignant progression (Fig. 7F).
Figure 6.
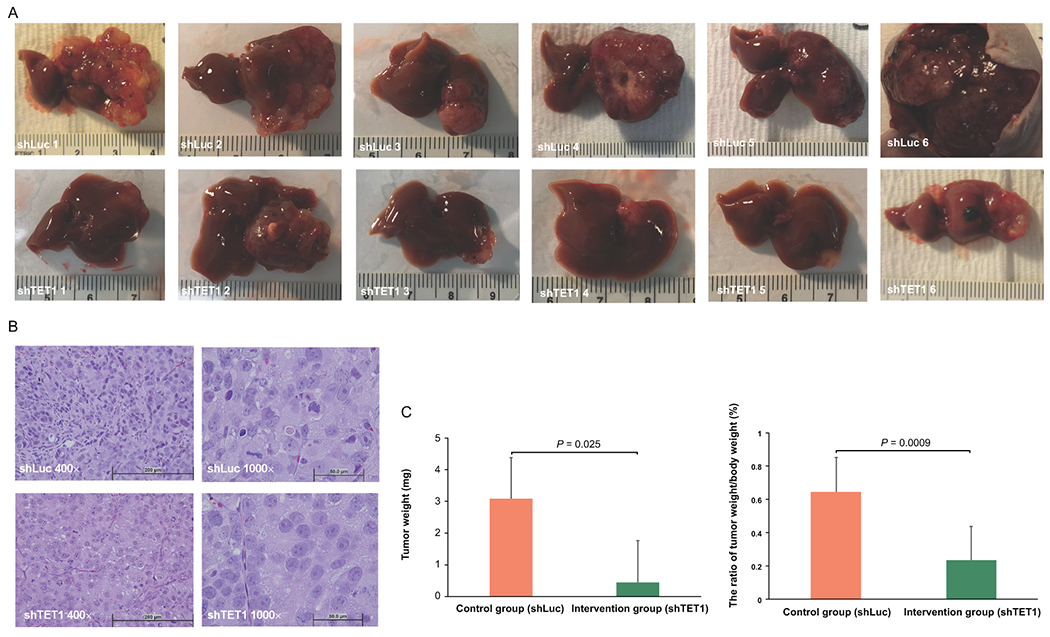
Knockdown of TET1 repressed CCA progression in vivo. (A) Gross images of xenograft tumors derived from shLuc- and shTET1#23-treated H1 CCA cells. (B) The representative H&E staining images (400× and 1000×) in shLuc and shTET1#23 groups. (C) The tumor weight and ratio of tumor weight to body weight are significantly decreased in shTET#23 group when compared with control one, n=6.
Figure 7.
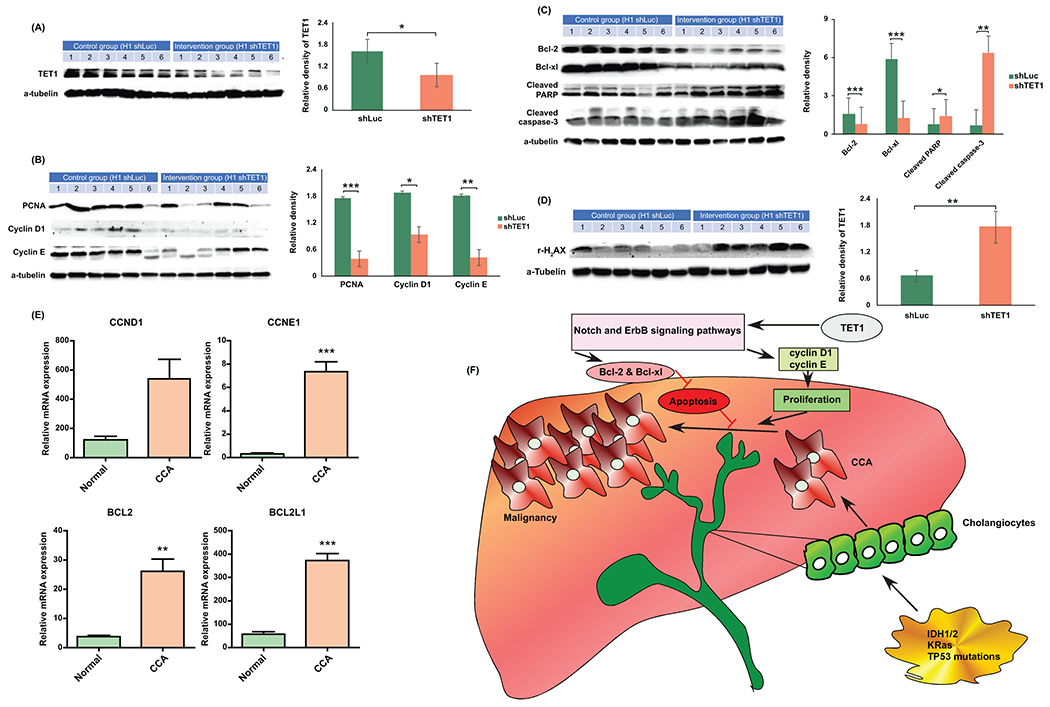
Targeting TET1 inhibited cell growth and induced cell apoptosis in vivo. (A) TET1 expression was verified in shLuc and shTET1#23 H1 orthotopic xenograft tumors. (B) Cell growth associated proteins including PCNA, Cyclin D1 and Cyclin E were analyzed in shLuc- and shTET1#23 H1 xenograft tumors. (C) Anti-apoptotic proteins, Bcl2 and Bcl-XL were decreased in shTET1#23-treated tumors. Cleaved caspase 3 and PARP were elevated in TET1 knockdown tumors. (D) The DNA damage marker, γ-H2aX was increased in TET1 kncokdown tumors as well. Graph data shows the semi-quantification results of relevant proteins. (E) The mRNA expression of cyclin D1 (CCND1), cyclin E1 (CCNE1), Bcl-2 (BCL2), and Bcl-XL (BCL2L1) was analyzed in human normal (n=9) and CCA tissues (n=36) by using TCGA data. (F) A summary cartoon illustrating how TET1 may modulate CCA progression. *p<0.05; **p<0.01; ***p<0.001.
Discussion
Due to the recent breakthrough in whole genome sequencing, IDH mutations have been identified in 20% of CCA patients and in more than 50% (50-80 %) of secondary glioblastoma patients (35). The specific inhibitors for IDH1 and IDH2 have been discovered and found effective in suppressing glioma(9) and leukemia (10) in preclinical models. However, it has been identified that glioma(11), AML(12), and CCA(13) patients with IDH mutations have better prognosis than those with wild-type IDH, albeit there are some controversial findings(36) that IDH mutations may target 2-OG-dependent enzymes in promoting malignant transformation and initiation. In addition, how IDH mutations affect 2-OG-dependent enzymes to modulate cancer malignant progression in a later stage may not be as originally expected. Under these circumstances, it would be essential to determine how 2-OG-dependent enzymes are involved in CCA progression. Thus, the current study was aimed to clarify the role of TET1 in CCA progression. By challenging CCA cells with α-KG and DM-α-KG, we uncovered that activation of TET1 enhances CCA progression. Removing TET1 co-substrates which include iron and α-KG by using DFO and DMOG significantly diminished CCA carcinogenesis. More important, knockdown of TET1 with 2 specific shRNAs substantially suppressed CCA malignancy. The findings were further validated in an orthotopic CCA xenograft model. Knockdown of TET1 also inhibited CCA progression in vivo. The molecular mechanism studies suggested that targeting TET1 may suppress CCA malignant progression by suppressing cell growth and activating cell apoptosis partially through epigenetically regulating notch and ErbB signaling pathways.
There are several studies aimed at clarifying how IDH1 mutations in those cancers may lead to good prognosis. One potential explanation is that IDH1 mutation limits NADPH production for de no lipogenesis through 2-HG production. Thus, IDH1 mutation retards cell growth when cells are in lipid-deficient condition(37). Another possible answer is that IDH1 mutation would inhibit ATM expression, resulting in decreased DNA repair, thus leading to elevated DNA damage and apoptosis(38, 39). Actually, there is one study indicating that mutant IDH1/2 glioma patients received systemic chemotherapies have better survival than those with wild-type IDH1/2 due to an impairment in PARP-mediated DNA repair (40). Interestingly, the current study demonstrated that targeting TET1 would result in decreased cell growth, elevated DNA damage, and increased apoptosis. In this scenario, IDH1 mutation would produce 2-HG which inhibits 2-OG-depependent enzymes, including TET1, thus possibly and partially contributing to good prognosis of CCA patients with mutant IDH1. In line with this hypothesis and our findings, the important role of TET1 in glioma and AML with wild-type IDH1/2 has been reported before. Targeting TET1 with small molecule inhibitors would significantly reduce cancer malignant progression in AML cells. Knockdown of TET1 also substantially inhibited carcinogenesis in glioblastoma cells (22, 41). Together, it is clearly that the role of TET1 must be carefully characterized in CCA cells before its application in clinics. More important, physicians may consider to evaluate TET1 status in CCA patients with IDH1 mutation before they treat those patients, since targeting IDH1 mutation may activate TET1 activity to promote CCA progression.
Although the current study did not investigate the role of TET1 in CCA initiation, TET1-mediated early transformation did display controversial findings (22, 28, 42). In liver cancers, knockout of TET1 recapitulated similar epigenetic genome changes in human hepatocarcinogenesis(42). Additionally, TET1 plays a tumor suppressor role in B cell lymphoma (21). In contrast, TET1-mediated 5hmC generation is required for glioblastomagenesis(22). Besides, TET1 is a direct target of MLL-fusion proteins and plays a oncogenic role in MLL-rearranged leukemia(20). In CCA, there is no direct evidence supporting TET1’s role in CCA transformation. However, the transgenic mouse generated with KRasG12D and IDH2R172K mutations demonstrated that IDH2 mutation promotes CCA malignant progression(4). The finding could indirectly support that TET1 is a tumor suppressor in CCA initiation, since IDH2 mutation would produce 2-HG to inhibit TET1 function. Nevertheless, it has been previously shown that targeting 2-OG-dependent dioxygenases with multiple strategies including 2-HG and removal of their co-substrates would inhibit CCA malignant progression(29), thus further complicating the role of TET1 in CCA progression. Currently, the IDH1 mutation inhibitor, ivosidenib has been approved for the treatment of relapsed or refractory AML adult patients with IDH1 mutation by the Food and Drug Administration of United States. IDH2 mutations inhibitor, enasidenib has been approved to be used in AML patients with IDH2 mutations even earlier than ivosidenib. These may bring hopes for those CCA patients with IDH1/2 mutations if the clinical trials of these inhibitors display beneficial effects in CCA patients. However, there is still no potential treatment for those ~80% of CCA patients with wild-type IDH1/2. Our study investigates underlying molecular mechanism by which TET1 modulates CCA progression and suggests TET1 as a potential target in those CCA patients. To ensure the beneficial effects of targeting TET1 in CCA patients with IDH1 wild-type, further studies will be required to comprehensively illustrate the role of TET1 in CCA initiation.
Supplementary Material
Acknowledgement
The authors would like to thank the following funding agencies for their supports. Funding for this work was provided by 2017 AASLDF Pinnacle Research Development Award, an Institutional Development Award (IDeA) from the National Institute of General Medical Sciences of the National Institutes of Health under grant number P20GM109035, and Rhode Island Foundation #134279.
Financial Support: There is no conflict of interest among the authors. Funding for this work was provided by 2017 AASLDF Pinnacle Research Development Award, National Institute of General Medical Sciences of the National Institutes of Health under grant number P20GM109035, and Rhode Island Foundation #134279 to C-K.H.
List of Abbreviations:
- 2-HG
2-hydroxyglutarate
- 2-OG
2-oxoglutarate
- 5hmC
5-hydroxymethylcytosine
- α-KG
alpha-ketoglutarate
- TET1
Methylcytosine dioxygenase TET1
- IDH1
isocitrate dehydrogenase 1
- IDH1/2
isocitrate dehydrogenase 1 and 2
- DFO
Desferoxamine
- DMOG
Dimethyloxalylglycine
References
- 1.Razumilava N, Gores GJ. Cholangiocarcinoma. Lancet 2014;383:2168–2179. [DOI] [PMC free article] [PubMed] [Google Scholar]
- 2.Jiao Y, Pawlik TM, Anders RA, Selaru FM, Streppel MM, Lucas DJ, Niknafs N, et al. Exome sequencing identifies frequent inactivating mutations in BAP1, ARID1A and PBRM1 in intrahepatic cholangiocarcinomas. Nat Genet 2013;45:1470–1473. [DOI] [PMC free article] [PubMed] [Google Scholar]
- 3.Chan-On W, Nairismagi ML, Ong CK, Lim WK, Dima S, Pairojkul C, Lim KH, et al. Exome sequencing identifies distinct mutational patterns in liver fluke-related and non-infection-related bile duct cancers. Nat Genet 2013;45:1474–1478. [DOI] [PubMed] [Google Scholar]
- 4.Saha SK, Parachoniak CA, Ghanta KS, Fitamant J, Ross KN, Najem MS, Gurumurthy S, et al. Mutant IDH inhibits HNF-4alpha to block hepatocyte differentiation and promote biliary cancer. Nature 2014;513:110–114. [DOI] [PMC free article] [PubMed] [Google Scholar]
- 5.Dang L, White DW, Gross S, Bennett BD, Bittinger MA, Driggers EM, Fantin VR, et al. Cancer-associated IDH1 mutations produce 2-hydroxyglutarate. Nature 2009;462:739–744. [DOI] [PMC free article] [PubMed] [Google Scholar]
- 6.Xu W, Yang H, Liu Y, Yang Y, Wang P, Kim SH, Ito S, et al. Oncometabolite 2-hydroxyglutarate is a competitive inhibitor of alpha-ketoglutarate-dependent dioxygenases. Cancer Cell 2011;19:17–30. [DOI] [PMC free article] [PubMed] [Google Scholar]
- 7.Koivunen P, Lee S, Duncan CG, Lopez G, Lu G, Ramkissoon S, Losman JA, et al. Transformation by the (R)-enantiomer of 2-hydroxyglutarate linked to EGLN activation. Nature 2012;483:484–488. [DOI] [PMC free article] [PubMed] [Google Scholar]
- 8.Turcan S, Rohle D, Goenka A, Walsh LA, Fang F, Yilmaz E, Campos C, et al. IDH1 mutation is sufficient to establish the glioma hypermethylator phenotype. Nature 2012;483:479–483. [DOI] [PMC free article] [PubMed] [Google Scholar]
- 9.Rohle D, Popovici-Muller J, Palaskas N, Turcan S, Grommes C, Campos C, Tsoi J, et al. An inhibitor of mutant IDH1 delays growth and promotes differentiation of glioma cells. Science 2013;340:626–630. [DOI] [PMC free article] [PubMed] [Google Scholar]
- 10.Wang F, Travins J, DeLaBarre B, Penard-Lacronique V, Schalm S, Hansen E, Straley K, et al. Targeted inhibition of mutant IDH2 in leukemia cells induces cellular differentiation. Science 2013;340:622–626. [DOI] [PubMed] [Google Scholar]
- 11.Yan H, Parsons DW, Jin G, McLendon R, Rasheed BA, Yuan W, Kos I, et al. IDH1 and IDH2 mutations in gliomas. N Engl J Med 2009;360:765–773. [DOI] [PMC free article] [PubMed] [Google Scholar]
- 12.Patel JP, Gonen M, Figueroa ME, Fernandez H, Sun Z, Racevskis J, Van Vlierberghe P, et al. Prognostic relevance of integrated genetic profiling in acute myeloid leukemia. N Engl J Med 2012;366:1079–1089. [DOI] [PMC free article] [PubMed] [Google Scholar]
- 13.Wang P, Dong Q, Zhang C, Kuan PF, Liu Y, Jeck WR, Andersen JB, et al. Mutations in isocitrate dehydrogenase 1 and 2 occur frequently in intrahepatic cholangiocarcinomas and share hypermethylation targets with glioblastomas. Oncogene 2013;32:3091–3100. [DOI] [PMC free article] [PubMed] [Google Scholar]
- 14.Bralten LB, Kloosterhof NK, Balvers R, Sacchetti A, Lapre L, Lamfers M, Leenstra S, et al. IDH1 R132H decreases proliferation of glioma cell lines in vitro and in vivo. Ann Neurol 2011;69:455–463. [DOI] [PubMed] [Google Scholar]
- 15.Kohli RM, Zhang Y. TET enzymes, TDG and the dynamics of DNA demethylation. Nature 2013;502:472–479. [DOI] [PMC free article] [PubMed] [Google Scholar]
- 16.Huang Y, Chavez L, Chang X, Wang X, Pastor WA, Kang J, Zepeda-Martinez JA, et al. Distinct roles of the methylcytosine oxidases Tet1 and Tet2 in mouse embryonic stem cells. Proc Natl Acad Sci U S A 2014;111:1361–1366. [DOI] [PMC free article] [PubMed] [Google Scholar]
- 17.Shen L, Inoue A, He J, Liu Y, Lu F, Zhang Y. Tet3 and DNA replication mediate demethylation of both the maternal and paternal genomes in mouse zygotes. Cell Stem Cell 2014;15:459–471. [DOI] [PMC free article] [PubMed] [Google Scholar]
- 18.Moran-Crusio K, Reavie L, Shih A, Abdel-Wahab O, Ndiaye-Lobry D, Lobry C, Figueroa ME, et al. Tet2 loss leads to increased hematopoietic stem cell self-renewal and myeloid transformation. Cancer Cell 2011;20:11–24. [DOI] [PMC free article] [PubMed] [Google Scholar]
- 19.An J, Gonzalez-Avalos E, Chawla A, Jeong M, Lopez-Moyado IF, Li W, Goodell MA, et al. Acute loss of TET function results in aggressive myeloid cancer in mice. Nat Commun 2015;6:10071. [DOI] [PMC free article] [PubMed] [Google Scholar]
- 20.Huang H, Jiang X, Li Z, Li Y, Song CX, He C, Sun M, et al. TET1 plays an essential oncogenic role in MLL-rearranged leukemia. Proc Natl Acad Sci U S A 2013;110:11994–11999. [DOI] [PMC free article] [PubMed] [Google Scholar]
- 21.Cimmino L, Dawlaty MM, Ndiaye-Lobry D, Yap YS, Bakogianni S, Yu Y, Bhattacharyya S, et al. TET1 is a tumor suppressor of hematopoietic malignancy. Nat Immunol 2015;16:653–662. [DOI] [PMC free article] [PubMed] [Google Scholar]
- 22.Takai H, Masuda K, Sato T, Sakaguchi Y, Suzuki T, Suzuki T, Koyama-Nasu R, et al. 5-Hydroxymethylcytosine plays a critical role in glioblastomagenesis by recruiting the CHTOP-methylosome complex. Cell Rep 2014;9:48–60. [DOI] [PubMed] [Google Scholar]
- 23.Orr BA, Haffner MC, Nelson WG, Yegnasubramanian S, Eberhart CG. Decreased 5-hydroxymethylcytosine is associated with neural progenitor phenotype in normal brain and shorter survival in malignant glioma. PLoS One 2012;7:e41036. [DOI] [PMC free article] [PubMed] [Google Scholar]
- 24.Chuang KH, Whitney-Miller CL, Chu CY, Zhou Z, Dokus MK, Schmit S, Barry CT. MicroRNA-494 is a master epigenetic regulator of multiple invasion-suppressor microRNAs by targeting ten eleven translocation 1 in invasive human hepatocellular carcinoma tumors. Hepatology 2015;62:466–480. [DOI] [PMC free article] [PubMed] [Google Scholar]
- 25.Huang CK, Lee SO, Lai KP, Ma WL, Lin TH, Tsai MY, Luo J, et al. Targeting androgen receptor in bone marrow mesenchymal stem cells leads to better transplantation therapy efficacy in liver cirrhosis. Hepatology 2013;57:1550–1563. [DOI] [PubMed] [Google Scholar]
- 26.Goeppert B, Konermann C, Schmidt CR, Bogatyrova O, Geiselhart L, Ernst C, Gu L, et al. Global alterations of DNA methylation in cholangiocarcinoma target the Wnt signaling pathway. Hepatology 2014;59:544–554. [DOI] [PubMed] [Google Scholar]
- 27.Udali S, Guarini P, Moruzzi S, Ruzzenente A, Tammen SA, Guglielmi A, Conci S, et al. Global DNA methylation and hydroxymethylation differ in hepatocellular carcinoma and cholangiocarcinoma and relate to survival rate. Hepatology 2015;62:496–504. [DOI] [PubMed] [Google Scholar]
- 28.Wu BK, Brenner C. Suppression of TET1-dependent DNA demethylation is essential for KRAS-mediated transformation. Cell Rep 2014;9:1827–1840. [DOI] [PMC free article] [PubMed] [Google Scholar]
- 29.Huang CK, Iwagami Y, Zou J, Casulli S, Lu S, Nagaoka K, Ji C, et al. Aspartate beta-hydroxylase promotes cholangiocarcinoma progression by modulating RB1 phosphorylation. Cancer Lett 2018;429:1–10. [DOI] [PMC free article] [PubMed] [Google Scholar]
- 30.Good CR, Panjarian S, Kelly AD, Madzo J, Patel B, Jelinek J, Issa JJ. TET1-Mediated Hypomethylation Activates Oncogenic Signaling in Triple-Negative Breast Cancer. Cancer Res 2018;78:4126–4137. [DOI] [PMC free article] [PubMed] [Google Scholar]
- 31.Wu H, D'Alessio AC, Ito S, Xia K, Wang Z, Cui K, Zhao K, et al. Dual functions of Tet1 in transcriptional regulation in mouse embryonic stem cells. Nature 2011;473:389–393. [DOI] [PMC free article] [PubMed] [Google Scholar]
- 32.Zinkel S, Gross A, Yang E. BCL2 family in DNA damage and cell cycle control. Cell Death Differ 2006;13:1351–1359. [DOI] [PubMed] [Google Scholar]
- 33.Ji C, Nagaoka K, Zou J, Casulli S, Lu S, Cao KY, Zhang H, et al. Chronic ethanol-mediated hepatocyte apoptosis links to decreased TET1 and 5-hydroxymethylcytosine formation. FASEB J 2018:fj201800736R. [DOI] [PMC free article] [PubMed] [Google Scholar]
- 34.Subramanian A, Tamayo P, Mootha VK, Mukherjee S, Ebert BL, Gillette MA, Paulovich A, et al. Gene set enrichment analysis: a knowledge-based approach for interpreting genome-wide expression profiles. Proc Natl Acad Sci U S A 2005;102:15545–15550. [DOI] [PMC free article] [PubMed] [Google Scholar]
- 35.Turkalp Z, Karamchandani J, Das S. IDH mutation in glioma: new insights and promises for the future. JAMA Neurol 2014;71:1319–1325. [DOI] [PubMed] [Google Scholar]
- 36.Cairns RA, Mak TW. Oncogenic isocitrate dehydrogenase mutations: mechanisms, models, and clinical opportunities. Cancer Discov 2013;3:730–741. [DOI] [PubMed] [Google Scholar]
- 37.Badur MG, Muthusamy T, Parker SJ, Ma S, McBrayer SK, Cordes T, Magana JH, et al. Oncogenic R132 IDH1 Mutations Limit NADPH for De Novo Lipogenesis through (D)2-Hydroxyglutarate Production in Fibrosarcoma Sells. Cell Rep 2018;25:1018–1026 e1014. [DOI] [PMC free article] [PubMed] [Google Scholar]
- 38.Inoue S, Li WY, Tseng A, Beerman I, Elia AJ, Bendall SC, Lemonnier F, et al. Mutant IDH1 Downregulates ATM and Alters DNA Repair and Sensitivity to DNA Damage Independent of TET2. Cancer Cell 2016;30:337–348. [DOI] [PMC free article] [PubMed] [Google Scholar]
- 39.Molenaar RJ, Maciejewski JP, Wilmink JW, van Noorden CJF. Wild-type and mutated IDH1/2 enzymes and therapy responses. Oncogene 2018;37:1949–1960. [DOI] [PMC free article] [PubMed] [Google Scholar]
- 40.Lu Y, Kwintkiewicz J, Liu Y, Tech K, Frady LN, Su YT, Bautista W, et al. Chemosensitivity of IDH1-Mutated Gliomas Due to an Impairment in PARP1-Mediated DNA Repair. Cancer Res 2017;77:1709–1718. [DOI] [PMC free article] [PubMed] [Google Scholar]
- 41.Jiang X, Hu C, Ferchen K, Nie J, Cui X, Chen CH, Cheng L, et al. Targeted inhibition of STAT/TET1 axis as a therapeutic strategy for acute myeloid leukemia. Nat Commun 2017;8:2099. [DOI] [PMC free article] [PubMed] [Google Scholar]
- 42.Thomson JP, Ottaviano R, Unterberger EB, Lempiainen H, Muller A, Terranova R, Illingworth RS, et al. Loss of Tet1-Associated 5-Hydroxymethylcytosine Is Concomitant with Aberrant Promoter Hypermethylation in Liver Cancer. Cancer Res 2016;76:3097–3108. [DOI] [PMC free article] [PubMed] [Google Scholar]
Associated Data
This section collects any data citations, data availability statements, or supplementary materials included in this article.