Abstract
Metabolic reprograming towards aerobic glycolysis is a pivotal mechanism shaping immune responses. Here we show deficiency in NF-κB-inducing kinase (NIK) impairs glycolysis induction, rendering CD8+ effector T cells hypofunctional in tumor microenvironment. Conversely, ectopic expression of NIK promotes CD8+ T cell metabolism and effector function, thereby profoundly enhancing antitumor immunity and improving the efficacy of T cell adoptive therapy. NIK regulates T cell metabolism via an NF-κB-independent mechanism that involves stabilization of hexokinase 2 (HK2), a rate-limiting enzyme of the glycolytic pathway. NIK prevents autophagic degradation of HK2 through controlling cellular ROS levels, which in turn involves modulation of glucose-6-phosphate dehydrogenase (G6PD), an enzyme mediating production of the antioxidant NADPH. We show that the G6PD-NADPH redox system is important for HK2 stability and metabolism in activated T cells. These findings establish NIK as a pivotal regulator of T cell metabolism and highlight a posttranslational mechanism of metabolic regulation.
Keywords: T cell metabolism, Glycolysis, T cell exhaustion, antitumor immunity, NIK, HK2, G6PD, ROS
T cells play a central role in immune responses against infections and cancer1. A hallmark of T cell activation is metabolic reprograming2, 3. While naive T cells have low metabolic demands and mainly rely on oxidative phosphorylation (OXPHOS) for energy generation, activated T cells shift the cellular metabolism towards aerobic glycolysis and also increases OXPHOS, which is crucial for effector T cell generation and function2, 3, 4. T cell metabolism is typically compromised in the tumor microenvironment, which is associated with T cell exhaustion, a dysfunctional state induced in chronic infections and tumorigenesis and characterized by expression of high levels of immune checkpoint molecules and decreased proliferative capacity and effector function5, 6, 7, 8, 9, 10. Immune checkpoint molecules, such as PD1, CTLA4, Tim3, and Lag3, have been implicated in the inhibition of T cell metabolism in tumor microenvironments, although the intracellular signaling mechanisms are poorly understood6, 8, 11.
In addition to energy generation, T cell metabolism is linked to the production of reactive oxygen species (ROS)12. While physiological levels of ROS are important for T cell activation, excessive ROS production can cause cell damage and dysfunction. The cellular ROS levels are maintained by a balance between ROS production and antioxidant mechanisms, and a major antioxidant mechanism is provided by the NADPH redox system 12. NADPH is produced by the pentose phosphate pathway, which is parallel to glycolysis and dependent on a rate-limiting enzyme, glucose-6-phosphate dehydrogenase (G6PD)13, 14. By maintaining the concentration of NADPH, G6PD prevents aberrant ROS accumulation and oxidative stress13, 15, 16.
The molecular mechanisms connecting T cell signaling and the metabolic activities are incompletely understood. One well-defined metabolic pathway in early-phase T cell activation involves activation of PI3 kinase (PI3K) and its downstream kinase AKT, which activate the metabolic kinase mammalian target of rapamycin (mTOR) and transcription factors involved in the induction of glycolysis-related genes8,17,18,19, 20. How the glycolytic metabolism is maintained in effector T cells is less well understood. NF-κB-inducing kinase (NIK) is known as a mediator of noncanonical NF-κB activation stimulated by various TNF receptor (TNFR) superfamily members21. Although NIK is known for regulating B cell survival and lymphoid organ development, it is notable that many TNFRs function as costimulatory signals that promote the function of effector T cells21,22. Indeed, recent studies suggest that NIK is crucial for inflammatory CD4+ T cell function and neuroinflammation23. Notably, NIK is dispensable for naive T cell activation but is required for effector T cell function and recall responses23. How NIK regulates T cell responses has been elusive, and whether NIK plays a role in regulating antitumor CD8+ T cell responses is also unclear.
In the present study, we identified NIK as a pivotal regulator of T cell metabolism and antitumor immunity. NIK functions posttranslationally through mediating stabilization of hexokinase 2 (HK2), a rate-limiting enzyme of the glycolytic pathway. NIK prevents autophagic degradation of HK2 by controlling cellular ROS levels, which in turn involves NIK-mediated regulation of G6PD and, thereby, the NADPH redox system. These findings establish NIK as a pivotal regulator of T cell metabolism and provide a novel link between the G6PD-NADPH redox system and glycolysis.
Results
T cell-specific deletion of NIK impairs antitumor immunity
To examine the role of NIK in regulating antitumor T cell responses, we employed mutant mice harboring T cell-specific deletion of the NIK-encoding gene Map3k14. We challenged Map3k14 T cell-conditional knockout (Map3k14tKO) mice and age-matched wildtype control mice with B16F10 melanoma cells, a poorly immunogenic tumor model 24. Compared to wildtype mice, the Map3k14tKO mice had drastically increased tumor burden, coupled with reduced tumor-infiltrating CD4+ and CD8+ T cells as well as interferon-γ (IFN-γ)-producing effector CD8+ T cells (Fig. 1a-c). The draining lymph node of tumor-bearing Map3k14tKO mice had a moderately increased frequency of CD4+ and CD8+ T cells, but the percentage of effector CD8+ T cells expressing CD44 and CXCR3 markers was reduced (Fig. 1d,e). A more profound reduction in the frequency and absolute number of CD44+CXCR3+ CD8+ effector T cells was detected in the tumor (Fig. 1f).
Figure 1. T cell-specific deletion of NIK impairs antitumor immunity.
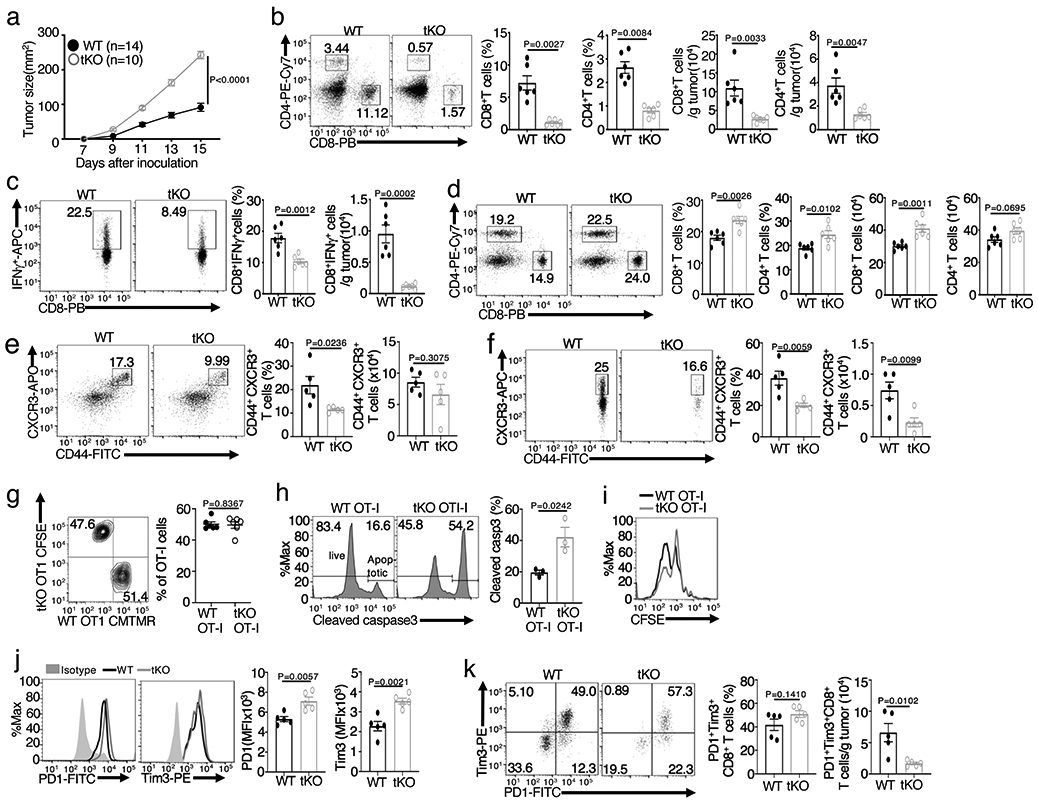
a, Tumor growth curve of Map3k14tKO (tKO) and wildtype (WT) control mice injected s.c. with 2 x 10⁵ B16F10 melanoma cells. b,c, Flow cytometric analysis of the frequency and absolute cell number of CD4+ and CD8+ T cells (b) and IFN-γ-producing CD8+ effector T cells (c) in the tumor of day16 B16F10-implanted Map3k14tKO and wildtype mice (b,c, n=6 per genotype). d-f, Flow cytometric analysis of the frequency and absolute number of CD4+ and CD8+ T cells in the draining lymph node (d), CD44+CXCR3+ CD8+ effector T cells in the draining lymph node (e), and CD44+CXCR3+ CD8+ effector T cells in the tumor (f) of day16 B16F10-implanted Map3k14tKO and wildtype control mice (d, n=6 per genotype; e,f, n=5 per genotype). g, Flow cytometrc analysis of tumor-infiltrating wildtype and Map3k14tKO OT-I CD8+ T cells in B16-OVA-tumor bearing B6 mice adoptively transferred (on day 17) with a mixture (1:1 ratio) of in vitro activated wildtype (CMTMR labeled) and Map3k14tKO (CFSE labeled) OT-I CD8+ T cells (n=6 per group). h,i, Flow cytometric analysis of apoptosis based on caspase 3 cleavage (h) and proliferation based on CFSE dilution (i) of tumor-infiltrating wildtype and Map3k14tKO OT-I CD8+ T cells in B16-OVA-tumor bearing B6.SJL mice adoptively transferred on day 14 with in vitro activated and CFSE-labeled wildtype and Map3k14tKO CD8+ T cells for 7 days; n=3 per genotype. j,k, Flow cytometric analysis of the expression level (MFI) of PD1 and Tim3 in CD8+ T cells (j) or the frequency and absolute number of PD1+Tim3+ CD8+ T cells (k) in the tumor of day16 B16F10-implanted Map3k14tKO and wildtype mice (j,k, n=5 per genotype). Data are representative of two (g-i) or three (a-f, j,k) independent experiments. Summary data are shown as mean ± s.e.m. with P values determined by two-way analysis of variance (ANOVA) with Bonferroni correction (a), two-tailed Student’s t test (b-h, j, k).
T cell adoptive transfer assays revealed that NIK-deficient OT-I CD8+ T cells were fully functional in tumor infiltration but displayed markedly increased apoptosis and moderately reduced proliferation in the tumor, compared to the wildtype CD8+ T cells (Fig. 1g-i). The tumor-infiltrating Map3k14tKO CD8+ T cells displayed increased surface expression of PD1 and Tim3 (Fig. 1j), immune checkpoint molecules associated with T cell exhaustion9, 10. On the other hand, NIK deficiency did not increase the frequency of PD1+Tim3+ tumor-infiltrating CD8+ T cells and even caused a drastic reduction in their absolute number (Fig. 1k). The latter phenotype was likely due to the overall reduction in tumor-infiltrating CD8+ effector T cells (Fig. 1b), since PD1 and Tim3 expression is associated with effector T cell generation25. These findings suggest that NIK facilitates antitumor immunity by mediating the survival and function of tumor-infiltrating CD8+ effector T cells.
Ectopic NIK expression prevents CD8+ T cell exhaustion and promotes antitumor immunity
To further investigate the role of NIK in negatively regulating antitumor immunity, we employed a transgenic mouse model, R26StopFLMap3k14tg, carrying a Map3k14 transgene under the control of a loxP-flanked STOP cassette 26. By crossing R26StopFLMap3k14tg mice with CreER mice, we generated R26StopFLMap3k14tgCreER (hereafter called Map3k14tgCreER) and Map3k14+/+CreER mice, which were then injected with tamoxifen to induce Cre function for producing NIK-induced transgenic (NIKiTg) and wildtype control mice, respectively (Extended Data Fig. 1a,b). To mimic therapeutic approaches, the Map3k14tgCreER and Map3k14+/+CreER mice were pre-implanted with tumor cells and then injected with tamoxifen to induce NIK expression (Extended Data Fig. 1c). Ectopic expression of NIK in the NIKiTg mice caused a profound suppression of tumor growth and improved survival in both MC38 colon cancer and B16F10 melanoma models (Fig. 2a-e), associated with increased tumor-infiltrating CD4+ and CD8+ T cells as well as IFN-γ-producing CD8+ effector T cells (Fig. 2f,g and Extended Data Fig. 1d). Compared to the tumor-bearing wildtype mice, the tumor-bearing NIKiTg mice had reduced T cell numbers in draining lymph node (Fig. 2h and Extended Data Fig. 1e), likely due to enhanced T cell activation and tumor infiltration induced by NIK. Indeed, the draining lymph node and tumor of the NIKiTg mice had an increased frequency of effector CD8+ T cells expressing the surface markers CD44 and CXCR3 (Fig. 2i,j and Extended Data Fig. 1f,g). Thus, contrary to NIK deficiency, inducible expression of NIK in adult mice promotes tumor immunity by inducing tumor-infiltrating CD8+ effector T cells.
Figure 2. Ectopic expression of NIK prevents T cell exhaustion and promotes antitumor immunity.
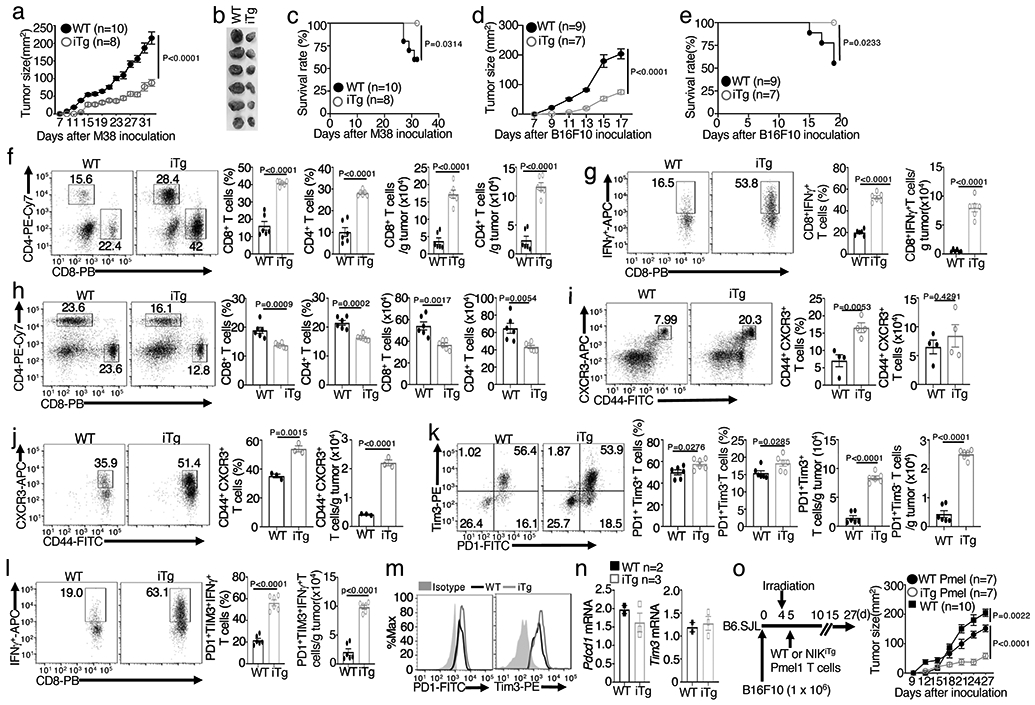
a-c, Tumor growth curve (a), image of day 32 tumors (b), and survival curve (c) of the MC38-bearing NIKiTg and wildtype control mice. d,e, Tumor growth (d) and survival (e) curves of NIKiTg and wildtype control mice injected s.c. with 5 x 10⁵ B16F10 melanoma cells. f,g, Flow cytometric analysis of the frequency and absolute cell number of CD4+ and CD8+ T cells (f) and IFN-γ-producing CD8+ effector T cells (g) in day-32 tumor of MC38-bearing NIKiTg and wildtype control mice (f,g, n=6 per genotype). h-j, Flow cytometric analysis of the frequency and absolute cell number of CD4+ and CD8+ T cells in the draining lymph node (h) and CD44+CXCR3+ CD8+ effector T cells in the draining lymph node (i) or tumor (j) of day-32 MC38-implanted NIKiTg and wildtype control mice (h, n=6 per group; i, n=4 per group; j, n=3 per group). k,l, Flow cytometric analysis of the frequency and absolute cell number of PD1+Tim3+ and PD1+Tim3− CD8+ T cells (k) and IFN-γ-producing gated PD1+Tim3+ CD8+ T cells (l) in day-32 tumor of the MC38-bearing wildtype or iTg mice (k,l, n=6 per genotype). m,n, Flow cytometry (m) and qRT-PCR (n) analyses of PD1 and Tim3 expression level in tumor-infiltrating PD1+Tim3+ CD8+ T cells of MC38-bearing (day 32) wildtype or iTg mice (n, WT: n=2; NIKiTg: n=3) . o, Schematic of experimental design (left) and tumor growth curve (right) of B16F10-impanted B6 mice adoptively transferred with in vitro generated (treated with 4OH-tamoxifen) NIKiTg Pmel1 or WT Pmel1 CD8+ T cells, activated with anti-CD3 plus anti-CD28 for 5 days. Control mice were inoculated with B16F10 cells without irradiation and Pmel1 T cell injection. Data are representative of three independent experiments. Summary data are shown as mean ± s.e.m. with P values determined by two-way analysis of ANOVA with Bonferroni correction (a,d,o), two sided log-rank test (c,e), or two-tailed Student’s t test (f-l).
NIK transgenic expression increased the number of tumor-infiltrating CD8+ T cells with PD1+Tim3+ exhaustion markers (Fig. 2k and Extended Data Fig. 1h). However, although the wildtype PD1+Tim3+ CD8+ T cells were weak in IFN-γ production, characteristics of exhaustion, the NIKiTg PD1+Tim3+ CD8+ T cells were highly competent in IFN-γ production (Fig. 2l and Extended Data Fig. 1i). Ectopic NIK expression did not reduce the level of PD1 and Tim3 expression (Fig. 2m,n), suggesting that NIK might functionally suppress CD8+ T cell exhaustion.
NIK expression improves the efficacy of adoptive T cell therapy
To evaluate the therapeutic potential for NIK, we performed adoptive T cell therapy involving transfer of melanoma-specific murine CD8+ effector T cells into B16F10 melanoma-bearing B6.SJL mice. For generating melanoma-specific CD8+ T cells, we employed the Pmel1 TCR transgenic mice, producing CD8+ T cells recognizing the tumor antigen gp100 expressed in B16F10 cells27. CD8+ T cells isolated from Map3k14TgCreER Pmel1 or Map3k14+/+CreER Pmel1 mice and treated in vitro with 4OH-tamoxifen, along with activation by anti-CD3 plus anti-CD28, to generate NIKiTg Pmel1 and WT Pmel1 CD8+ effector T cells. The tumor-bearing mice transferred with NIKiTg Pmel1 CD8+ T cells displayed a significantly reduced tumor growth rate and drastically increased tumor-infiltrating CD8+ T cells and IFN-γ-producing CD8+ effector T cells, compared to the tumor-bearing mice transferred with wildtype Pmel1 CD8+ T cells (Fig. 2o and Extended Data Fig. 2a,b). The NIKiTg Pmel1 CD8+ effector T cells also displayed stronger in vitro cytotoxic activity towards B16F10 tumor cells (Extended Data Fig. 2c). In addition, the tumor-infiltrating NIKiTg effector CD8+ T cells had improved survival, although not proliferative, ability compared with wildtype effector CD8+ T cells (Extended Data Fig. 2d-f). These results suggest that ectopic expression of NIK may be an effective approach to improve the efficacy of adoptive T cell therapy in cancer treatment.
NIK is required for metabolic reprogramming of activated T cells
We next examined the role of NIK in regulating glycolytic metabolism by measuring extracellular acidification rate (ECAR) and oxygen consumption rate (OCR), indicators of aerobic glycolysis and OXPHOS, respectively28. As expected4, naive CD8+ T cells displayed a low level of OCR and barely detectable level of ECAR, but both ECAR and OCR were profoundly induced upon T cell activation (Fig. 3a,b and Extended Data Fig. 3a). NIK deficiency drastically reduced the basal ECAR and maximum ECAR as well as the baseline and maximum OCR (Fig. 3a,b). The NIK-deficient CD8+ T cells isolated from the B16F10 tumors revealed an even more profound defect in ECAR and OCR, suggesting that NIK deficiency might render effector T cells more vulnerable to metabolic suppression in tumor microenvironment (Fig. 3c,d). The crucial role of NIK in mediating effector T cell metabolism was further demonstrated in an immune response against Listeria monocytogenes infection (Fig. 3e,f).
Figure 3. NIK regulates metabolic reprogramming along with T cell activation both in vivo and in vitro.
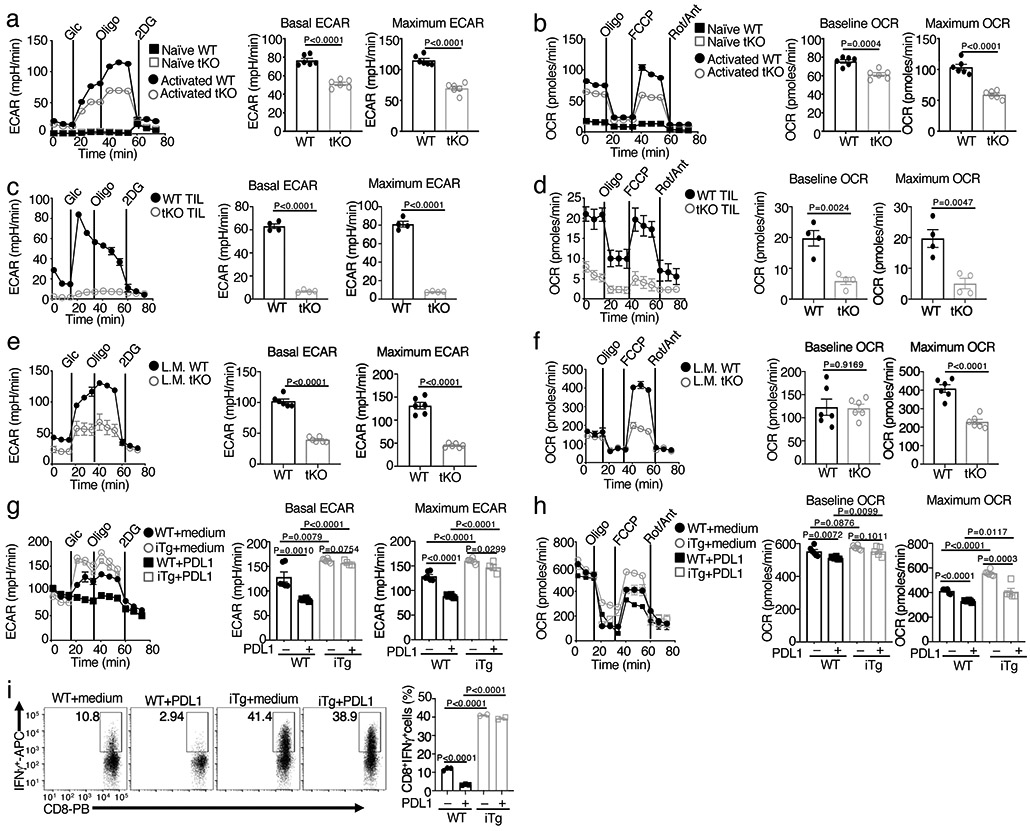
a,b, Seahorse analysis of basal ECAR (measured after glucose injection, Glc) and maximum ECAR (measured after oligomycin injection, Oligo) conditions (a) and Seahorse analysis of baseline OCR (no treatment) and maximum OCR (FCCP injection) (b) in Map3k14tKO (tKO) or wildtype (WT) control OT-I CD8+ T cells, either naive or activated by anti-CD3 plus anti-CD28 for 24 h. c,d, Seahorse analysis of ECAR (c) and OCR (d), as described in a and b, using total T cells isolated from day 16 tumor of B16F10-implanted wildtype (WT) or Map3k14tKO (n=5) and activated with anti-CD3 and anti-CD28 for 24 h. e,f, Seahorse analysis of ECAR (e) and OCR (f) using OT-I CD8+ T cells freshly isolated from the spleen of day 7 L. monocytogenes (L.M.)-infected wildtype (WT) or Map3k14tKO mice without in vitro activation (n=3). g,h, Seahorse analysis of ECAR (g) and OCR (h) using wildtype (WT) or NIKiTg CD8+ T cells activated for 72 h with anti-CD3 plus anti-CD28 in the presence of 4OH-tamoxifen (0.2 μg/ml, to induce CreER-mediated NIK expression), followed by treatment with PDL1 (0.5 μg/ml) or medium for 24 h. i, Flow cytometric analysis of intracellular IFN-γ in wildtype (WT) or NIKiTg CD8+ T cells activated for 72 h with anti-CD3 plus anti-CD28 in the presence of the CreER inducer 4OH-tamoxifen as in (f), followed by treatment with soluble PDL1 or medium for 24 h. Data are representative of three independent experiments. Summary data are shown as mean ± s.e.m. based on multiple wells (a-h, each circle represents a well) or mice (i, each circle represents a mouse), with P values determined by two-tailed Student’s t test.
Contrary to NIK-deficient T cells, NIKiTg CD8+ T cells displayed higher ECAR and OCR than the wildtype control CD8+ T cells under activation conditions (Fig. 3g,h). Since ectopic NIK expression could improve the effector function of CD8+ T cells expressing the exhaustion markers PD1 and Tim3 (Fig. 2l), we determined whether NIK could prevent PD1-mediated inhibition of T cell glycolytic metabolism. As expected11, PD1 ligation by its ligand, PDL1, suppressed both ECAR and OCR in wildtype CD8+ T cells (Fig. 3g,h). However, the NIKiTg CD8+ T cells were highly resistant to PDL1-mediated inhibition of ECAR, although they were less effective in preventing PDL1-mediated OCR inhibition (Fig. 3g,h). Ectopic expression of NIK also prevented PDL1-mediated inhibition of IFN-γ induction in CD8+ T cells (Fig. 3i). These results establish NIK as a pivotal regulator of CD8+ T cell glycolysis and provide insight into the mechanism by which NIK promotes the effector function of PD1+Tim3+ CD8+ T cells in tumor microenvironment.
NIK prevents autophagic degradation of HK2
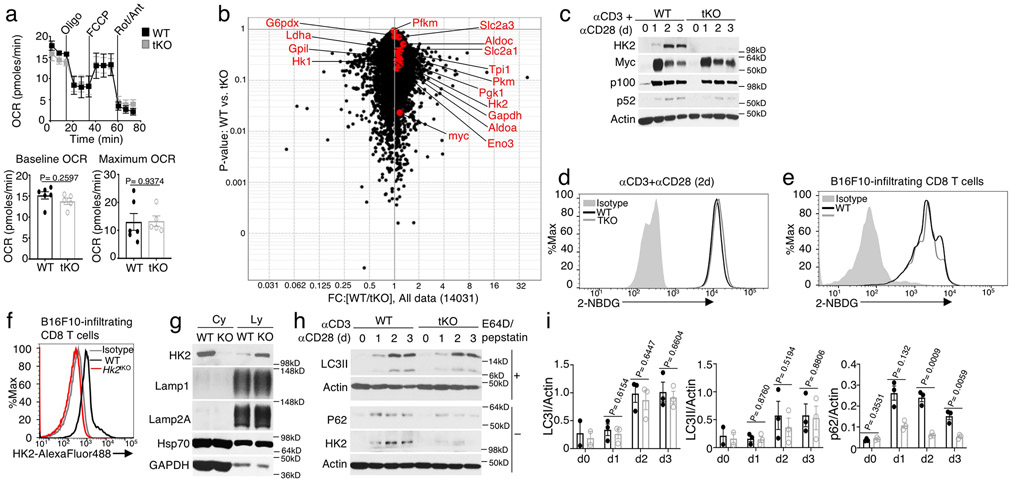
NIK deficiency or overexpression did not alter TCR-CD28-stimulated activation of AKT or phosphorylation of mTORC1-downstream targets, S6 and 4EBP1 (Fig. 4a,b). NIK deficiency also had little or no effect on TCR-CD28-stimulated expression of a panel of glycolysis-related factors at the mRNA or protein level (Fig. 4c,d and Extended Data Fig. 3b,c). Furthermore, NIK was dispensable for glucose uptake in CD8+ T cells stimulated in vitro or isolated from B16F10 tumors (Extended Data Fig. 3d,e). Interestingly, however, the NIK-deficient T cells had a drastic reduction in HK2 at the protein, although not mRNA, levels (Fig. 4d,e). Conversely, T cells from NIKiTg mice had a markedly higher level of HK2 protein, although not mRNA, than T cells from wildtype mice (Fig. 4f,g). Consistent with the in vitro experiments, HK2 level was profoundly reduced in tumor-infiltrating NIK-deficient CD8+ T cells and increased in tumor-infiltrating NIKiTg CD8+ T cells, compared to that of wildtype CD8+ T cells (Fig. 4h-j). The specificity of the HK2 flow cytometry was confirmed by using HK2-deficient CD8+ T cells (Extended Data Fig. 3f). The HK2 expression defect in NIK-deficient T cells was not rescued by a proteasome inhibitor but could be efficiently resuced by several lysosomal inhibitors, including bafilomycin A1 (BafA1), a combination of pepstatin A and E64-D, and chloroquine (CQ), could rescue HK2 level in the NIK-deficient T cells (Fig. 4k-n). Furthermore, NIK deficiency promoted HK2 localization to the lysosome (Extended Data Fig. 3g). These results suggest that NIK prevents lysosomal degradation of HK2.
Figure 4. NIK deficiency causes autophagic degradation of HK2.
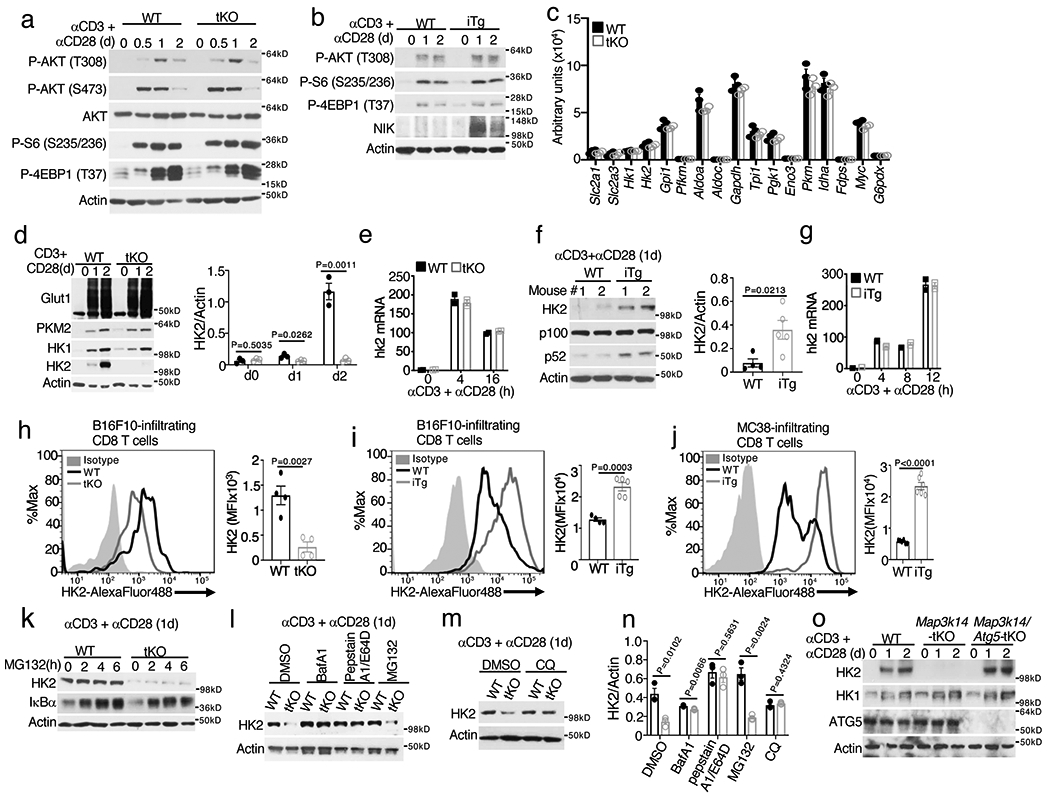
a,b, Immunoblot analysis of the indicated phosphorylated (p-) and total proteins in wildtype (WT) and Map3k14tKO (tKO) OT-I CD8+ T cells (a) or WT and NIKiTg (iTg) CD8+ T cells (generated in vitro by treating Map3k14+/+CreER and Map3k14TgCreER CD8+ T cells with 4OH-tamoxifen) (b), stimulated with anti-CD3 plus anti-CD28 for the indicated time periods. c, Summary of RNA sequencing data on the expression of glycolysis-regulatory genes in Map3k14tKO and WT OT-I CD8+ T cells, activated with anti-CD3 plus anti-CD28 for 24 hr (n=3 per genotype). d-g, Immunoblot analysis of the indicated proteins (d,f) and qRT-PCR analysis of Hk2 mRNA (e,g) in Map3k14tKO and wildtype control T cells (d,e) or NIKiTg (iTg) and wildtype control (WT) T cells (f,g), activated with anti-CD3 plus anti-CD28 for the indicated time points. Summary graphes of d and f are based on densitometric quantification of two (f) or three (d) independent experiments. h-j, Flow cytometric analysis of intracellular HK2 in tumor infiltrating CD8+ T cells from day16 B16F10-implanted Map3k14tKO and wildtype control mice (h), day18 B16F10-implanted NIKiTg and wildtype control mice (i), or day 32 MC38-implanted NIKiTg and wildtype control mice (j) (h, n=4 per genotype; i, WT: n=4; NIK-iTg: n=5; j, n=6 per genotype). k-m, Immunoblot analysis of the indicated proteins in wildtype and Map3k14tKO OT-I CD8+ T cells stimulated for 24 h with anti-CD3 plus anti-CD28 followed by incubation with MG132 for the indicated time (k), with the indicated agents or solvent control DMSO for 6 h (l), or with chloroquine (CQ) for 12 h (m). n, Summary of k to m based on densitometric quantification of three independent experiments. o, Immunoblot analysis of the indicated proteins in total T cells isolated from the spleen of wildtype, Map3k14tKO, and Map3k14/Atg5tKO mice and activated with anti-CD3 and anti-CD28 for the indicated time points. Data are representative of two (c,f) or three (a,b,d,e,g-o) independent experiments. Summary data are shown as mean ± s.e.m. with P values determined by two-tailed Student’s t test.
Since Autophagy mediates lysosomal degradation of cellular proteins and damaged organelles29, we tested the role of autophagy in HK2 degradation by deleting an essential autophagy component, Atg5, in NIK-deficient T cells. While NIK-deficient T cells had a severe loss of HK2, this phenotype was no longer detected in T cells derived from Map3k14/Atg5tKO (Map3k14fl/flAtg5fl/flCD4+-Cre) mice (Fig. 4o). Autophagic flux involves lipidation of microtubule-associated protein 1 light chain 3 (LC3) to convert it from a cytosolic form (LC3-I) to a lapidated form (LC3-II)30. In addition to the nonselective autophagy, LC3-II also mediates selective autophagy by interacting with specific receptors31. NIK deficiency did not promote LC3 modification; however, it caused profound loss of p62 (Extended Data Fig. 3h,i), a selective autophagy receptor known to be degraded along with degradation of cargos31. Together, these findings suggest the involvement of selective autophagy in mediating HK2 degradation in NIK-deficient T cells.
HK2 deletion in T cells impairs effector T cell function and antitumor immunity
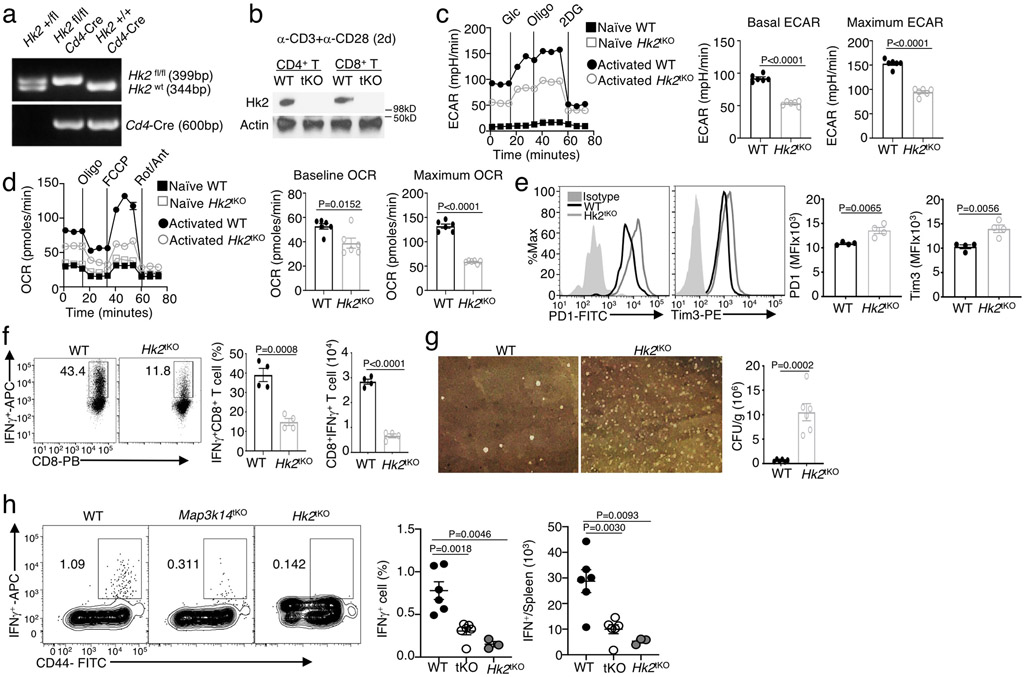
Like NIK, HK2 is dispensable for early stages of T cell activation; however, whether HK2 has an essential role in effector T cell function remains elusive32. We found that HK2 deletion in T cells significantly inhibited glycolysis, as well as OXPHOS, in activated T cells (Extended Data Fig. 4a-d). Furthermore, the T cell-conditional Hk2 KO (Hk2tKO) mice had a severe defect in mounting antitumor immunity (Fig. 5a-d). As seen with the NIK-deficient CD8+ T cells (Fig. 1j), the tumor-infiltrating HK2-deficient CD8+ T cells displayed increased expression levels of PD1 and Tim3 (Extended Data Fig. 4e). The Hk2tKO mice also had impaired T cell responses to L. monocytogenes infection, displaying reduced IFN-γ-producing effector CD8+ T cells and increased bacterial titer in the spleen (Extended Data Fig. 4f,g). A previous study suggests that HK2 is important for T cell-mediated inflammation in the lung and intestine but is dispensable for T cell responses to acute infection by the Armstrong strain of lymphocytic choriomeningitis virus (LCMV)32. Becaused the requirement of HK2 for antitumor immunity, we examined the role of HK2 in mediating T cell responses to chronic infections by LCMV clone 13, a well-established model for studying CD8+ effector T cell functions9. Interestingly, mice harboring T cell-specific deletion of either HK2 or NIK displayed a defect in CD8+ T cell responses to LCMV clone 13 infection (Extended Data Fig. 4h). Together, these findings suggest an important role for HK2 in regulating the effector function of T cells in immune responses against both tumorigenesis and infections, emphasizing the functional significance of NIK-mediated HK2 stabilization.
Figure 5. HK2 is required for antitumor immunity.
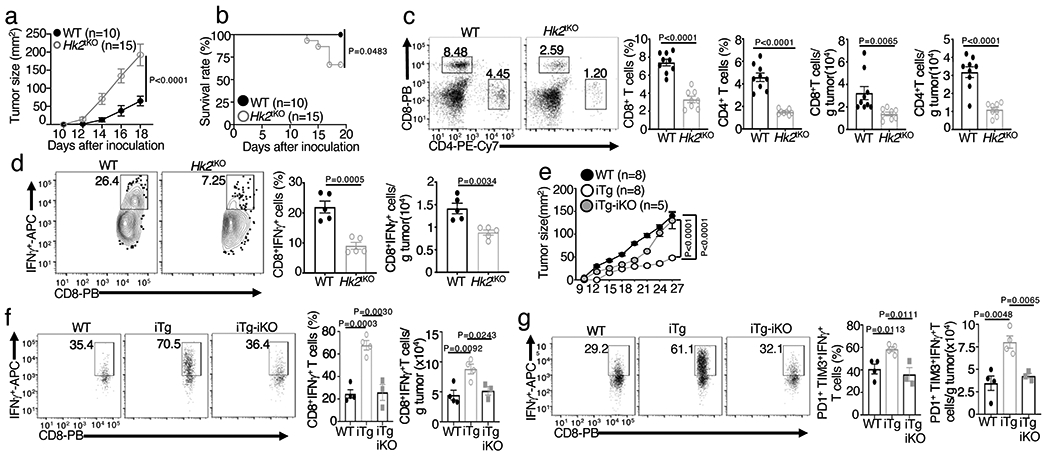
a,b, Tumor growth (a) and survival (b) curves of Hk2tKO or wildtype (WT) control mice injected s.c. with 105 B16F10 melanoma cells for the indicated time periods. c,d, Flow cytometric analysis of the frequency and absolute number of CD4+ and CD8+ T cells (c) and IFN-γ-producing CD8+ effector T cells (d) in day 20 tumor of the B16F10-implanted Hk2tKO and wildtype control mice (c,WT: n=9; Hk2tKO: n=8; d, n=5 per genotype). e, Tumor growth curve of MC38 tumor-bearing wildtype, NIKiTg (iTg), and NIKiTgHk2iKO (iTg-iKO) mice. f,g, Flow cytometric analysis of the frequency and absolute cell number of IFN-γ-producing CD8+ T cells (f) and gated PD1+Tim3+ CD8+ T cells (g) in day-27 tumor of the MC38 tumor-bearing mice (f,g, WT: n=4, iTg: n=4, iTg-iKO: n=3) . Data are representative of two (e-g) or three (a-d) independent experiments. Flow cytometry data are presented as representative plots (left) and summary graphs (mean ± s.e.m.) based on multiple mice (right, each circle represents an individual mouse). P values were determined by two-way analysis of ANOVA with Bonferroni correction (a,e), two-tailed Student’s t test (c,d,f,g) or two sided log- rank test (b).
To further examine the importance of NIK-mediated HK2 stabilization, we challenged Map3k14TgHk2fl/flCreER mice with B16F10 melanoma cells along with tamoxifen injection to construct tumor-bearing mice with simultaneous induction of NIK expression and HK2 deletion (NIKiTgHk2iKO). While NIKiTg mice displayed profoundly stronger antitumor immunity than WT control mice, these phenotypes were largely reversed in the NIKiTgHk2iKO mice (Fig. 5e,f and Extended Data Fig. 5a). HK2 deletion in NIKiTg mice also reduced the frequency and number of tumor-infiltrating PD1+Tim3+ CD8+ T ells to the level of wildtype mice, although it had no obvious effect on the expression level of PD1 and Tim3 (Extended Data Fig. 5b,c). Furthermore, while the NIKiTg PD1+Tim3+ CD8+ T cells were competent in IFN-γ production, the NIKiTgHk2iKO PD1+Tim3+ CD8+ T cells resembled the wildtype PD1+Tim3+ CD8+ T cells in the low efficiency of IFN-γ production (Fig. 5g). Collectively, these findings suggest that NIK regulates T cell effector function in antitumor immunity via stabilizing HK2 and, thereby, facilitating glycolytic metabolism.
HK2 deletion blocks NIK-mediated autoimmune inflammation
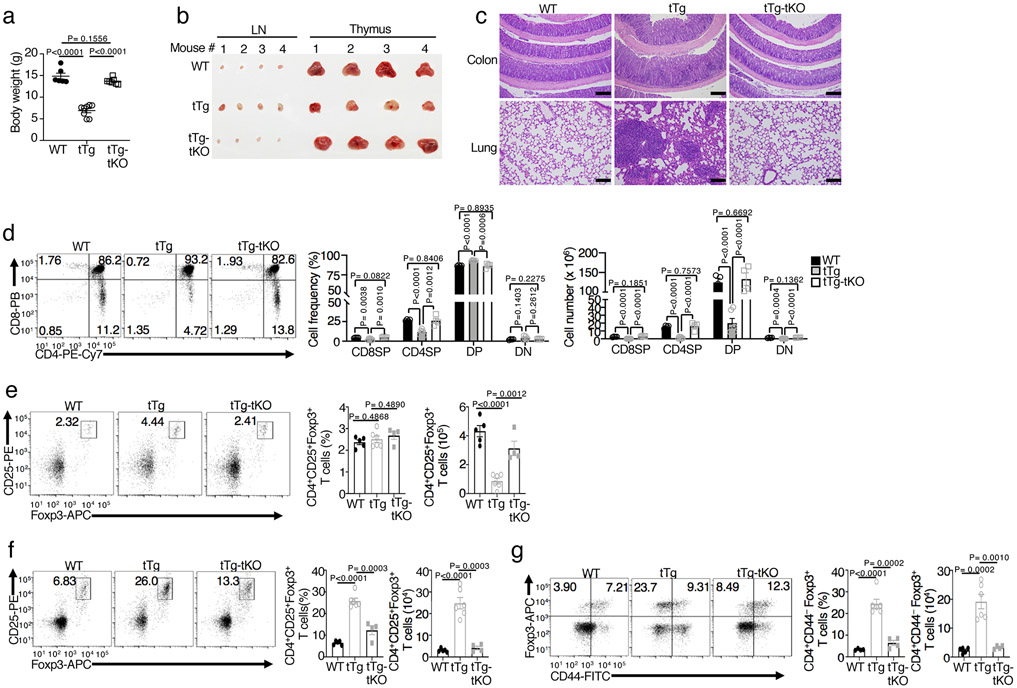
Mice with T cell-conditional expression of exogenous NIK (Map3k14tgCD4+-Cre, hereafter called NIKtTg) develop lethal autoimmunity, although the underlying mechanism remains elusive 33. Interestingly, while the NIKtTg mice displayed severe pathology, characterized by body weight reduction and organ inflammation, the NIKtTgHk2tKO mice no longer displayed these phenotypes (Fig. 6a-c). The NIKtTg mice also had a severe defect in thymocyte development, causing a significant reduction in the size of thymus and the number of double-negative (DN), double-positive (DP), as well as CD8+ and CD4+ single-positive (SP) thymocytes (Fig. 6b,d). Since CD4+-Cre expression occurs at the late stage of DN thymocyte development, these data suggest an effect starting from the DN stage. Importantly, these abnormalities in thymocyte development were rescued in the NIKtTgHk2tKO mice (Fig. 6b,d). The NIKtTg mice also had a defect in thymic regulatory T (Treg) cell production, which was rescued in the NIKtTgHk2tKO mice (Fig. 6e). In the periphery, NIKtTg mice had a marked proliferation of Treg cells with CD44lo surface markers, known to be functionally defective34, and deletion of HK2 also reversed this phenotype (Fig. 6f,g). These findings suggest that deregulated HK2 expression may contribute to the perturbed thymocyte development and autoimmune phenotypes in NIKtTg mice.
Figure 6. HK2 deletion blocks the autoimmune phenotype of NIKtTg mice.
a, Body weight of 36-day old wildtype (WT), NIKtTg (tTg), and NIKtTgHktKO (tTg-tKO) littermate mice (WT: n=5, tTg: n=8, tTg-tKO: n=7) .b, Image of inguinal lymph nodes and thymi of four pairs of mice with the indicated genotypes. c, H&E staining of colon and lung sections from moribund NIKtTg, NIKtTgHktKO and age-matched littermate wildtype control mice were assessed for leukocyte infiltrates by hematoxylin-eosin stain. Scale bars: 100 μm.(n=3 in each group). d-g, Flow cytometric analysis of the frequency and absolute cell number of double-negative (DN), double-positive (DP), CD8+ single-positive (SP), and CD4+ SP thymocytes (d), thymic CD25+foxp3+ Treg cells (e), lymph node CD25+foxp3+ Treg cells (f), and lymph node CD44−foxp3+ Treg cells (g) in NIKtTg, NIKtTgHktKO or wildtype mice (e-f, NIKiTg: n=6, NIKtTgHktKO: n=4, wildtype: n=5). Data are representative of two (a-c,e-g) or three (d) independent experiments. Summary data are shown as mean ± s.e.m. with P values determined by two-tailed Student’s t test (a,d-g) .
HK2 degradation in NIK-deficient T cells involves aberrant ROS accumulation
To examine the potential involvement of noncanonical NF-κB in HK2 regulation, we employed a mouse strain, Nfkb2Lym1, carrying a point mutation in the Nfkb2 gene and, thus, expressing a p100 mutant lacking the phosphorylation site and defective in NIK-induced processing 35. We used the Lym1 heterozygous mice, Nfkb2Lym1/+, since they display strong phenotype in p100 processing and biological functions35, 36. Despite the impaired noncanonical NF-κB activation (p100 processing to generate p52), the Nfkb2Lym1/+ mice had normal level of HK2 expression (Extended Data Fig. 6a). Consistently, the Nfkb2Lym1/+ T cells were also normal in TCR-CD28-stimulated glycolysis and OXPHOS (Extended Data Fig. 6b, c), suggesting an NF-κB-independent function of NIK in the regulation of HK2 stability and T cell metabolism.
NIK and HK2 did not physically interact, suggesting an indirect mechanism of HK2 regulation by NIK (Extended Data Fig. 6d). NIK-deficient T cells had a markedly higher level of ROS compared to wildtype T cells (Fig. 7a). NIK deficiency also rendered CD8+ T cells aberrantly producing ROS in immune responses against L. monocytogenes infection and in tumor microenvironment (Fig. 7b, c). Conversely, the NIKiTg CD8+ T cells had reduced ROS level (Fig. 7d,e). Since ROS has been implicated as an intracellular trigger for autophagy37, we sought to determine the potential connection of ROS with HK2 degradation. Incubation of NIK-deficient T cells with nicotinamide (NAM), a well-defined ROS inhibitor 38, 39, largely rescued the expression of HK2 in NIK-deficient T cells, coupled with reduced ROS level (Fig. 7f and Extended Data Fig. 7a). Incubation of NIK-deficient T cells with several other antioxidants, glutathionine, vitamin C, and N-acetylcysteine, also restored the level of HK2 (Fig. 7g and Extended Data Fig. 7b). Conversely, CD8+ T cell activation in the presence of ROS inducers, H2O2, paraquat and 1-chloro-2,4-dinitrobenzene (CDNB), caused HK2 degradation (Extended Data Fig. 7c,d), which was inhibited in Atg5-deficient T cells (Extended Data Fig. 7d). Furthermore, the lysosomal localization of HK2 was inhibited by NAC (Extended Data Fig. 7e). These results suggest that aberrant ROS accumulation contributes to lysosomal degradation of HK2 in NIK-deficient T cells.
Figure 7. NIK protects HK2 degradation through regulation of G6PD-NADPH redox system and ROS level.
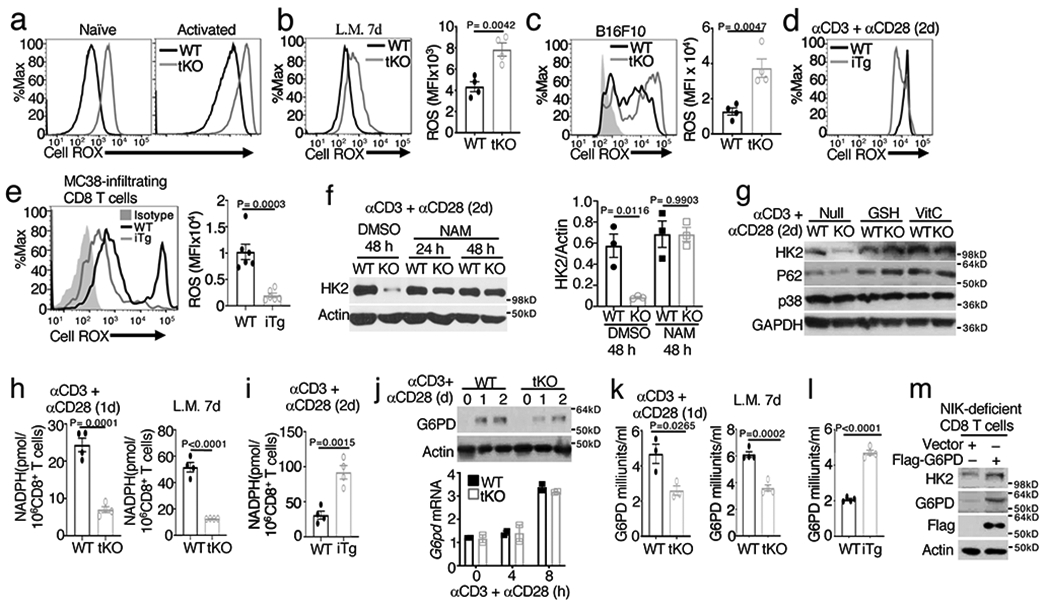
a-c, Flow cytometric analysis of cellular ROS levels (Cell ROX) in naive or in vitro activated (anti-CD3 plus anti-CD28 24 h) OT-I CD8+ T cells from wildtype (WT) and Map3k14tKO (tKO) mice (a) or in OT-I CD8+ T cells freshly isolated from the spleen of day 7 L. monocytogenes (L.M.)-infected (b) or in tumor infiltrating CD8+ T cells from day 16 tumor of B16F10-implanted (c) wildtype and Map3k14tKO mice (b,c, n=4 per genotype). d,e, Flow cytometric analysis of cellular ROS levels in activated (anti-CD3 plus anti-CD28 48h) total T cells from wildtype and NIKiTg mice (d) or in tumor infiltrating CD8+ T cells from day-32 MC38-implanted wildtype and NIKiTg mice (e) (e, n=6 per genotype). f,g, Immunoblot analysis of HK2 expression in wildtype or Map3k14tKO (KO) OT-I CD8+ T cells activated with anti-CD3 plus anti-CD28 for the indicated time periods in the presence of the ROS inhibitor NAM (f), GSH and Vit C (g) or solvent control DMSO. The right panel of f is a summary graph of densitometric quantification data based on three independent experiments. h, Whole-cell NADPH concentration measured in 1 x 10⁶ in vitro activated (anti-CD3 plus anti-CD28 24 h) wildtype or Map3k14tKO OT-I CD8+ T cells (left), or OT-I CD8+ T cells isolated from the spleen of day 7 L. monocytogenes (L.M.)-infected wildtype and Map3k14tKO mice (right) (n=4 per genotype). i, Whole-cell NADPH concentration measured with in vitro activated (anti-CD3 plus anti-CD28 48h) CD8+ T cells prepared from wildtype or NIKiTg mice (n=4 per getotype). j, Immunoblot (upper) and qRT-PCR (lower) analysis of G6PD expression in wildtype or Map3k14tKO OT-I CD8+ T cells activated with anti-CD3 plus anti-CD28 for the indicated time points. k, G6PD activity in wildtype and Map3k14tKO OT-I CD8+ T cells activated in vitro for 24 h with anti-CD3 plus anti-CD28 (left, n=3 per genotype) or isolated from L. monocytogenes (L.M.)-infected mice (right, n=4 per genotype). l, G6PD activity in total T cells isolated from wildtype or NIKiTg mice injected with tamoxifen for 5 days and activated in vitro with anti-CD3 plus anti-CD28 for 24 h (n=4 per genotype). m, Immunoblot analysis of HK2 and G6PD (using both G6PD and Flag antibodies) in NIK-deficient CD8+ T cells transduced with (+) either an empty vector or Flag-tagged G6PD vector. Data are representative of three independent experiments. Summary data are shown as mean ± s.e.m. with P values determined by two-tailed Student’s t test.
NIK regulates the G6PD-NADPH redox system
Cellular ROS level is maintained by a balance between ROS production and antioxidant mechanisms, and a major antioxidant mechanism is provided by the NADPH redox system12. NIK deficiency did not seem to affect signal-induced ROS production, since both wildtype and NIK-deficient T cells increased ROS production upon activation by the TCR-CD28 signals (Fig. 7a). NIK deficiency also had no obvious effect on the mass and membrane potential of mitochondria (Extended Data Fig. 7f). The NIK-deficient CD8+ T cells had profoundly decreased activity of the antioxidant NADPH when activated in vitro by TCR-CD28 stimuli or in vivo by L. monocytogenes infection (Fig. 7h). Conversely, the NADPH activity was increased in the NIKiTg CD8+ T cells (Fig. 7i). An important function of NADPH is to act as a cofactor of glutathione reductase for converting oxidized glutathione, glutathione disulfide (GSSG), to reduced form of glutathione (GSH)12. In line with the role of NIK in NADPH regulation, the GSH/GSSG ratio was significantly reduced in NIK-deficient (Map3k14tKO) CD8+ T cells and increased in NIK-overexpressing (NIKiTg) CD8+ T cells (Extended Data Fig. 7g).
NADPH is produced by the pentose phosphate pathway, which is dependent on a rate-limiting enzyme, G6PD13, 14. By maintaining the concentration of NADPH, G6PD prevents aberrant ROS accumulation and oxidative stress13, 15. Interestingly, G6PD expression was induced along with T cell activation, which was moderately reduced at the protein level and not affected at the mRNA level by NIK deficiency (Fig. 7j). However, the G6PD enzymatic activity was significantly reduced in the NIK-deficient OT-I CD8+ T cells that were activated in vitro by anti-CD3 plus anti-CD28 or in vivo by L. monocytogenesis infection (Fig. 7k). Conversely, the NIKiTg T cells displayed increased G6PD activity than wildtype T cells (Fig. 7l). Functionally, overexpression of exogenous G6PD could restore HK2 expression in the NIK-deficient T cells (Fig. 7m), suggesting the involvement of G6PD in NIK-mediated HK2 stabilization.
G6PD is required for HK2 stable expression and T cell functions
We further studied G6PD function using a G6pd mutant (G6pdmut) mouse strain with impaired G6PD expression due to a point mutation in the 3’ end of the untranslated exon 1 of G6pd gene40,41. G6pdmut T cells had markedly reduced concentration of NADPH, associated with a lower level of HK2 protein although not Hk2 mRNA, under activated conditons (Fig. 8a-c). The HK2 protein level in G6pdmut T cells was restored upon incubation with the ROS inhibitor NAM (Fig. 8d). Reconstitution of the G6pdmut T cells with exogenous G6PD also efficiently restored HK2 expression (Fig. 8e). To confirm the T cell-intrinsic function of G6PD, we generated bone marrow chimeric mice by adoptively transferring wildtype or G6pdmut bone marrow cells into Rag2-KO recipient mice. T cells derived from G6pdmut chimeric mice had markedly reduced HK2 expression and increased ROS level compared to the wildtype control T cells (Fig. 8f,g). These findings demonstrate a crucial role for G6PD in regulating the fate of HK2, which involves control of ROS production via the G6PD-NADPH redox system.
Figure 8. G6PD is required for HK2 stable expression and T cell functions.
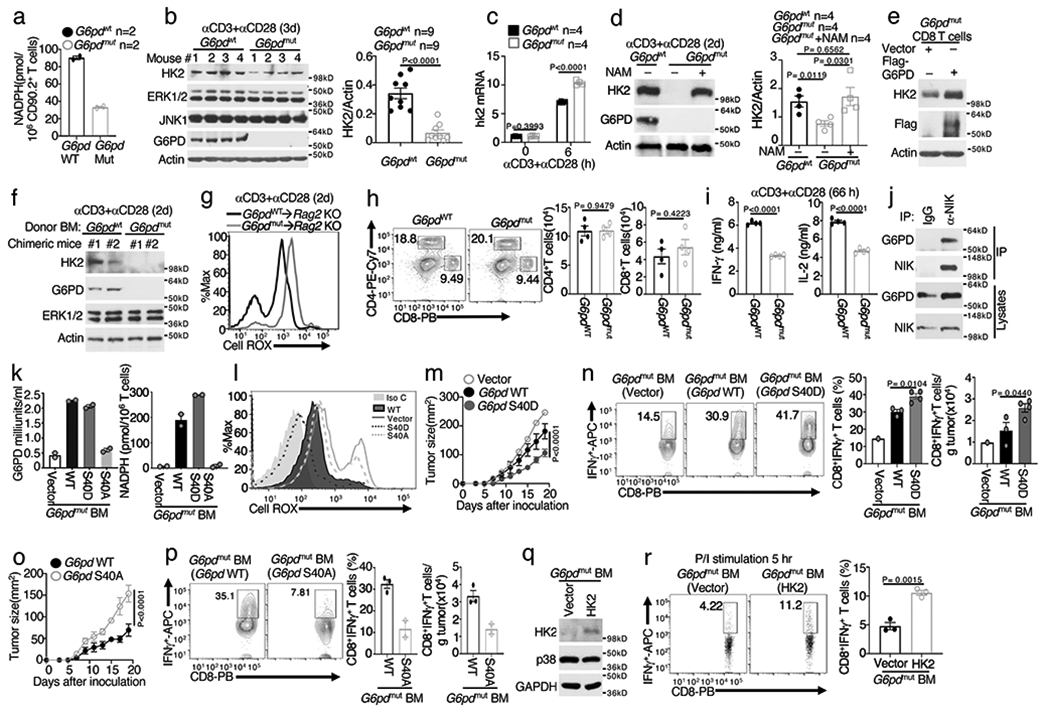
a-c, Whole-cell NADPH concentration (a), immunoblot (b), right panel in b is a summary graph of densitometric quantification of three independent experiments, and qRT-PCR (c) assays using total T cells isolated from wildtype (G6pdWT) or G6PDmut mice, in vitro activated with anti-CD3 plus anti-CD28 for 72 h (a,b) or as indicated (c) (a, n=2 per genotype; c, n=4 per genotype). d, Immunoblot analysis using lysates of G6PDWT or G6PDmut T cells, stimulated with anti-CD3 plus anti-CD28 for 48 h in the presence (+) or absence (−) of NAM. Right panel is a summary graph of densitometric quantification of two independent experiments (n=4 per genotype). e, Immunoblot analysis using lysates of G6PDmut CD8+ T cells transduced with either a control vector or Flag-G6PD. f,g, Immunoblot (f) and flow cytometric analysis of ROS level (g) using total T cells isolated from chimeric mice transferred with G6PDWT or G6PDmut bone marrows, in vitro activated with anti-CD3 plus anti-CD28 for 48 h. h, Flow cytometric analysis of CD4+ and CD8+ T cells in the spleen of G6PDWT and G6PDmut mice. i, ELISA of IFN-γ and IL-2 in the supernatant of G6PDWT and G6PDmut CD8+ T cell cultures stimulated with anti-CD3 plus anti-CD28 for 66 h. j, CoIP analysis of endogenous NIK-G6PD interaction using whole-cell lysates of CD8+ T cells isolated from NIKiTg mice and activated for 48 h with anti-CD3 plus anti-CD28 in the presence of 4OH-tamoxifen. MG132 and BV6 were added during the last 4 h to block NIK degradation. An immunoprecipitation with IgG was included as a negative control. k,l, Summary graph of G6PD activity and NADPH concentration (k) and flow cytometric analysis of ROS level (l) in splenic CD8+ T cells of chimeric mice adoptively transferred with G6PDmut bone marrow cells transduced with an empty vector (vector) or expression vectors encoding G6PD wildtype (WT) or mutants. m-p, Tumor growth curves (m,o) and flow cytometric analysis of tumor-infiltrating CD8+ T cells producing IFN-γ (n,p) in chimeric mice adoptively transferred with G6PDmut bone marrow cells transduced with the indicated expression vectors (m,n, vector: n=7, 1 survived; WT: n=4, 3 survived; S40D: n=5, 5 survived); o,p, WT: n=4, 3 survived; S40A: n=5, 2 survived). q, Immunoblot using T cells of chimeric mice adoptively transferred with G6PDmut bone marrow cells that had been transduced with an empty vector or HK2. r, Flow cytometric analysis of IFN-γ-producing CD8+ T cells derived from chimeric mice of vector- or HK2-transduced G6PDmut bone marrow cells (described in q), in vitro stimulated for 5 h with PMA plus Ionomycin in the presence of monensin (n=3 per genotype). Data are representative of one (k-r), two (a,d,e-i), or three (b,c,,j) independent experiments. Summary data are shown as mean ± s.e.m. with P values determined by two-tailed Student’s t test.
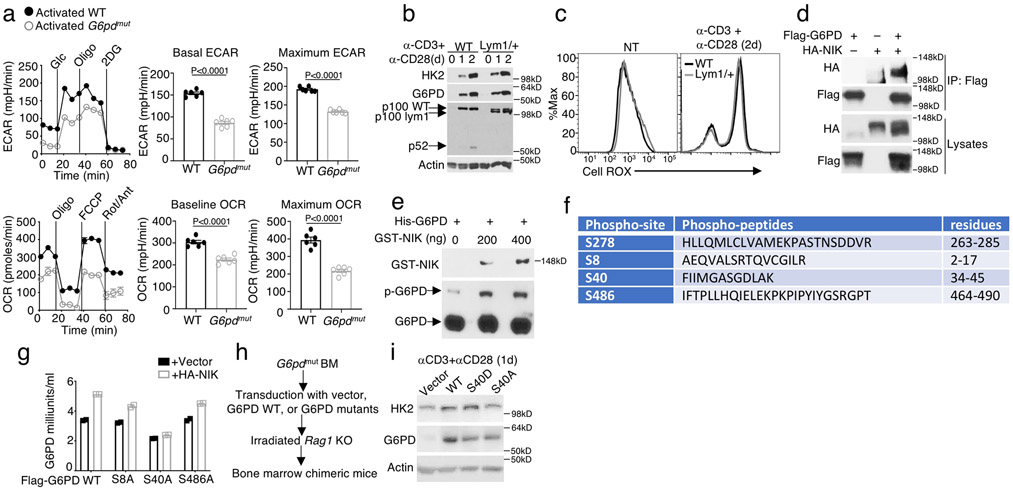
G6pd mutation did not alter the frequency of peripheral T cells but impaired T cell function, as shown by the significantly reduced cytokine production and glycolytic metabolism (Fig. 8h,i and Extended Data Fig. 8a). Regarding the mechanism of G6PD regulation by NIK, noncanonical NF-κB activation was dispensable, since Nfkb2Lym1/+ and wildtype T cells had comparable levels of G6PD (Extended Data Fig. 8b). Nfkb2Lym1/+ T cells also did not display aberrant ROS concentration (Extended Data Fig. 8c). Interestingly, NIK physically interacted with G6PD in both OT-I CD8+ T cells and transiently transfected 293 cells, and NIK phosphorylated G6PD in vitro (Fig. 8j and Extended Data Fig. 8d,e). Mass spectrometry identified four serine residues of G6PD phosphorylated by NIK (Extended Data Fig. 8f). All of these serines, except S278, are conserved between human and mouse G6PD proteins. In transfected cells, NIK stimulated G6PD activity, which was not affected by S8A or S486A mutation but abolished by S40A mutation (Extended Data Fig. 8g).
To further examine the role of S40 phosphorylation, we generated bone marrow chimeric mice using G6pdmut bone marrow cells reconstituted with G6PD wildtype, S40A, or a phospho-mimetic form, S40D (Extended Data Fig. 8h). CD8+ T cells derived from the G6PD wildtype and S40D, but not S40A, bone marrow chimeric mice displayed strong G6PD activity (Fig. 8k). Reconstitution of the G6pdmut T cells with G6PD wildtype or S40D, but not S40A, also rescued the NADPH production (Fig. 8k), prevented aberrant ROS production (Fig. 8l), and increased HK2 expression (Extended Data Fig. 8i). Furthermore, chimeric mice expressing G6PD S40D displayed stronger antitumor immunity, while those expressing S40A displayed reduced antitumor immunity, compared to chimeric mice expressing wildtype G6PD (Fig. 8m-p). Chimeric mice were also generated using G6pdmut bone marrow cells transduced with either a vector control or HK2 (Fig. 8q). HK2 overexpression efficiently rescued the defect of the G6pdmut T cell IFN-γ production (Fig. 8r).Together, these results suggest that NIK-mediated G6PD regulation plays an important role in regulating the level of HK2 and, thereby, the function of CD8+ effector T cells.
Discussion
The results presented in this paper established NIK as a novel regulator of T cell metabolism and antitumor immunity. In contrast to the PI3K-AKT-mTORC1 signaling axis, which triggers the initiation of glycolysis through promoting glucose uptake and transcriptional induction of glycolytic enzymes, NIK functions through a posttranslational mechanism involving stabilization of HK2. NIK controls cellular ROS level by maintaining the G6PD-NADPH redox system. These findings not only identified NIK as a pivotal regulator of T cell metabolism but also suggested a novel link between the redox system and metabolic pathways.
We have previously shown that NIK is dispensable for naive T cell activation but plays a crucial role in mediating effector T cell function and recall responses21, 23. Our present study provides a mechanistic insight into NIK function, since competent glycolysis is essential for effector T cell functions. Our data suggest that NIK is crucial for CD8+ T cell responses against tumorigenesis. Interestingly, transgenic expression of NIK using an inducible system strongly promoted antitumor immunity, associated with increased glycolytic metabolism and effector function of CD8+ T cells. Using a preclinical model of cancer therapy, we further demonstrated that ectopic NIK expression in CD8+ effector T cells significantly improved the efficacy of adoptive T cell therapy. We found that ectopic NIK expression rendered PD1+Tim3+ tumor-infiltrating CD8+ T cells competent in IFN-γ production, a result reminiscent of the recent finding that immune checkpoint inhibitor therapy reinvigorates exhausted CD8+ T cells without reducing checkpoint molecule expression42, 43.
Our work revealed an NF-κB-independent mechanism of NIK function in regulating the fate of HK2, a rate-limiting enzyme catalyzing the first step of glycolysis. Prior studies suggest a dispensable role for HK2 in mediating T cell responses to acute infections by herpes simplex virus 1 (HSV1) and Amstrong strain of LCMV32, 44. Interestingly, our present study demonstrated an important role for HK2 in regulating CD8+ T cell function in antitumor immunity. The discrepancies between our study and the previous studies are likely due to the different experimental models used: the previous studies employed acute viral infection models, whereas our present study used tumor immunity models that mimic chronic virual infections. In further support of this explanation, we found that HK2 deficiency impaired CD8+ T cell responses to chronic infections by LCMV clone 13. Our present study also led to the identification of a T cell-intrinsic role for HK2 in regulating thymocyte development and mediating the lethal autoimmunity caused by constitutive overexpression of NIK in T cells. Together, these findings suggest that HK2 plays a crucial role in regulating specific aspects of T cell functions, particularly CD8+ T cell responses to tumorigenesis and chronic viral infections.
Our data suggest that NIK deficiency causes HK2 degradation by selective autophagy due to aberrant ROS accumulation. NIK facilitates production of NADPH, a major redox system controlling ROS level, by phosphorylating and promoting the activity of G6PD, an enzyme catalyzing NADPH generation in the pentose oxidation pathway. We obtained genetic evidence that G6PD was crucial for controlling ROS concentration, preventing HK2 degradation, and supporting T cell metabolism. Collectively, these findings demonstrate a novel mechanism of metabolic regulation involving posttranslational regulation of HK2 by NIK and extablish NIK as an important regulator of effector T cell function in antitumor immunity. These findings also suggest that NIK regulates T cell function via both noncanonical NF-κB-dependent and independent mechanisms.
ONLINE METHODS
Mice.
Map3k14 flox mice (C57BL/6 background), provided by Genentech 45, were crossed with Cd4-Cre transgenic mice (B6.Cg-Tg(Cd4-cre)1Cwi/BfluJ, Jackson Laboratory) to produce age-matched Map3k14+/+Cd4-Cre (named WT) and Map3k14fl/fl Cd4-Cre (named Map3k14 T cell-conditional knockout or Map3k14tKO) mice. The NIK transgenic mice R26StopFLMap3k14tg, carrying a Map3k14 transgene encoding wildtype NIK under the control of a loxP-flanked STOP cassette26 (C57BL/6-Gt(ROSA)26Sortm5(Map3k14)Rsky/J, Jackson Laboratories), were crossed with ROSA26-CreER (B6.129-Gt(ROSA)26Sortm1(cre/ERT2)Tyj/J, Jackson Laboratory) to generate Map3k14+/+CreER and R26StopFLMap3k14tgCreER (hereafter called Map3k14TgCreER) mice, which were injected intraperitoneally with tamoxifen (1 mg/mouse) in corn oil daily for five consecutive days to induce Cre-function for generation of wildtype and NIK-induced transgenic (NIKiTg) mice, respectively. The R26StopFLMap3k14tg mice were also crossed with Cd4-Cre to generate Map3k14+/+Cd4-Cre (called WT) and R26StopFLMap3k14tgCd4-Cre (called NIK T cell-conditional transgenic or NIKtTg) mice. Hk2 flox mice (backcrossed to C57BL/6J background) were purchased from the European Mouse Mutant Archive (EMMA) and described previously46. Hk2 flox mice were crossed with Cd4-Cre transgenic mice to produce age-matched Hk2+/+Cd4-Cre (named WT) and Hk2fl/fl Cd4-Cre (named T cell-conditional Hk2 knockout or Hk2tKO) mice. G6pdmut and wildtype control mice, backcrossed to C57BL/6 background, were as described41. OT-I (C57BL/6-Tg(TcraTcrb)1100Mjb/J), Pmel1 (B6.Cg-Thy1a/Cy Tg(TcraTcrb)8Rest/J), C57BL/6J, B6.SJL (B6.SJL-Ptprca Pepcb/BoyJ), and Rag1 KO (B6.129S7-Rag1tm1Mom/J) mice were from Jackson Laboratory. Rag2 KO mice (129S6/SvEvTac-Rag2tm1.Fwa) were from Taconic Biosciences. Experiments were performed with young adult (6 to 8-week-old) female and male mice except where indicated otherwise. Mice were maintained in a specific-pathogen-free facility of the University of Texas MD Anderson Cancer Center, and all animal experiments were done in accordance with protocols approved by the Institutional Animal Care and Use Committee of the University of Texas MD Anderson Cancer Center.
Antibodies and reagents.
Antibodies used for western blot were:G6PD (clone D5D2, REF 12263, , CST);HK2 (clone C64G5, REF 2867, CST);NIK (clone A12, REF sc-8417, SantaCruz,);HK1(REF 19662-1-AP, Ptroteintech);Glut1(clone EPR3915, REF ab115730, abcam);PKM2(clone D78A4, REF 4053, CST);AKT (clone C67E7, REF 4691, CST);p-AKT(Ser 473) (clone D9E, REF 4060, CST);p-AKT(Thr308) (clone D25E6, REF 13038, CST);c-myc (clone D84C12, REF 5605, CST);P-S6(Ser235/236) (clone D57.2.2E, REF 4858, CST);ERK1/2 (clone 137F5, REF 4695, CST);IκBα (clone L35A5, REF 4814, CST);P100/P52 ( REF 4882, CST);P62(clone D6M5X, REF 23214, CST);LC3(REF PM036, MBL);ATG5(clone D5F5U, REF 12994, CST);Lamp1(clone C54H11, REF 3243, CST);Lamp2A(clone AMC2, Cat.51-2200, ThermoFisher);Hsp70(REF 4872, CST);GAPDH(REF 10494-1-AP, Ptroteintech);Actin (clone C4, REF sc-47778, SantaCruz);HA-HRP (clone 3F10, REF 12013819001 Roche, Sigma);Flag-HRP(clone 6F7, REF SAB4200119, Sigma). Antibodies used for flow cytometry were: CD4 (clone GK1.5, REF 25-0041-82, eBioscience);CD8 (clone 53-6.7, Cat 100725, Biolegend);CD44 (clone 1M7, REF 11-0441-85, eBioscience);CD45.1(clone A20, REF 11-0453-85, eBioscience);CD45.2(clone 104, REF 25-0454-82, eBioscience);PD-1(clone J43, REF 11-9985-82, eBioscience);Tim-3(clone RMT3-23, Cat 119703, Biolegend);IFN-γ (clone XMG1.2, Cat 505810, Biolegend);CXCR3(clone CXCR3-173, REF 17-1831-82, eBioscience);HK2 (clone EPR20839, REF ab209847, abcam);Goat anti-Rabbit IgG H&K(Alexa Fluor® 488) (REF ab150077, abcam) . Pepstatin A, E64D, Chloroquine, Nicotinamide (NAM), Glutathione (GSH), L-Ascorbic acid (VitC), N-Acetyl-L-cysteine (NAC), Paraquat dichloride, CDNB and Hydrogen Peroxide (H2O2) were from Sigma Aldrich. CellROX™ Deep Red Reagent was from Invitrogen.
Tumor models.
Map3k14tKO or Hk2tKO mice and their age- and sex-matched wildtype control mice (6–8 weeks old) were injected s.c. with B16F10 murine melanoma cells (ATCC) or with 5 × 10⁵ MC38 colon cancer cells (ATCC) and monitored for tumor growth and survival. Mice with tumor size reaching 225 mm2 were considered lethal and sacrificed according to protocols approved by the Institutional Animal Care and Use Committee of the University of Texas MD Anderson Cancer Center. At the indicated time point, all mice were sacrificed for flow cytometry analysis of immune cells from both the draining lymph nodes and tumors. For testing the therapeutic effect of ectopic NIK expression in tumor rejection, age- and sex-matched Map3k14+/+CreER and Map3k14tgCreER mice were injected s.c. with B16F10 or MC38 tumor cells, and the tumor-bearing mice were then injected with tamoxifen i.p. to induce NIK expression as indicated in the experiments, producing tumor-bearing wildtype and NIKiTg mice.
Adoptive cell therapy was performed using Pmel1 TCR transgenic mice that produce CD8+ T cells recognizing the B16 melanoma antigen gp100. In brief, Map3k14+/+CreER and Map3k14tgCreER mice were crossed with Pmel1 mice to generate Map3k14+/+CreER-Pmel1 and Map3k14tgCreER-Pmel1 mice. Splenocytes were isolated from these mice and treated with 0.2 μg/ml 4OH-tamaxifen in vitro along with activation with plate-coated anti-CD3 (1μg/ml) and soluble anti-CD28 (1μg/ml) to produce activated wildtype and NIKiTg Pmel1 CD8+ T cells. The culture was provided with mIL-2 (10 ng/ml) on day 2, and CD8+ T cells were purified from the culture on day 5 and used for adoptive transfer experiments. To generate tumor-bearing mice, wildtype B6.SJL mice (expressing the CD45.1 congenital marker) were injected s.c. with 106 B16F10 melanoma cells and, after 4 d, the tumor-bearing mice were subjected to whole-body irradiation (500 rad, 137Cs irradiator) to induce lymphodepletion. One day after the irradiation, the mice were injected with in vitro-activated wildtype Pmel1 or NIKiTg Pmel1 CD8+ T cells (106). Control mice were not irradiated or injected with Pmel T cells. Tumor size was measured every other day for the indicated time period.
T cell transfer for measuring tumor infiltration and intratumoral survival.
CD8+ T cells isolated from wildtype OT-I or Map3k14tKO OT-I mice were stimulated in vitro using plate-bound anti-CD3 (1 μg/ml) plus soluble anti-CD28 (1 μg/ml) antibodies, provided with mIL-2 (10 ng/ml) on day 2, and cultured for an additional day. For tumor infiltration analysis, the activated OT-I T cells were labeled with 1 mM chloromethyltetramethyl rhodamine (CMTMR) (for wildtype cells) or 1 mM carboxyfluorescein succinimidyl ester (CFSE) (for Map3k14tKO cells), mixed at 1:1 ratio (1.1 millions of each), and adoptively transferred into B16-OVA-bearing B6 mice (17 days after tumor cell injection). After 24h of T cell transfer, tumor-infiltrating wildtype and Map3k14tKO OT-I CD8+ T cells were quantified by flow cytometry based on CMTMR (red) and CFSE (green), respectively. For intratumoral survival and proliferation assays, the activated OT-1 CD8+ T cells were labeled with CFSE and adoptively transferred into day 14 B16-OVA-tumor implanted B6.SJL mice. After 7 days, apoptosis and proliferation of the tumor-infiltrating OT-I CD8+ T cells was analyzed by flow cytometry based on caspase 3 cleavage and CFSE dilution, respectively.
T cell isolation, treatment, and flow cytometry analysis.
Total and CD8+ T cells were isolated from splenocytes and lymph-node cells with anti-CD90.2- and anti-CD8-conjugated magnetic beads (Miltenyi Biotec), respectively. Naïve T cells were further purified by FACS sorting based on CD44lo CD62Lhi surface markers. For in vitro generation of NIKiTg and wildtype control T cells, T cells isolated from the Map3k14TgCreER and Map3k14+/+CreER mice were treated with 4OH-tamoxifen (0.2 μg/ml) for the indicated time periods. T cells were activated with plate-coated anti-CD3 (1 μg/ml) and anti-CD28 (1 μg/ml) for the indicated time points. For intracellular cytokine detection, T cells isolated from the spleen, draining lymph node, or tumors of mice or in vitro cultures were stimulated for 5 h with PMA (50 ng/ml) plus ionomycin (0.5 μg/ml) in the presence of monensin (eBioscience). Single cell suspensions of the cells were subjected to flow cytometry analysis. FACS data were analyzed with FlowJo v.10.5.3. Gating strategy is shown in Supplementary Fig. 1.
For isolation of tumor-infiltrating T cells, tumors were weighed, cut into pieces, and digested for 30 min at 37°C in RPMI 1640 medium containing 0.1 mg/ml DNase I and 100U/ml collagenase IV. Digested tissues were pressed through a 100-μm cell strainer, and cells were collected by centrifugation at 1500 rpm for 5 min at room temperature. After incubation in a red blood cell lysis buffer, the cell suspensions were passed through a 70 μm cell strainer and collected by centrifugation for flow cytometric analysis of tumor-infiltrating T cell frequencies. For T cell restimulation and cytokine production analyses, T cells were enriched using Percoll gradient and further purified with a Pan T Cell Isolation Kit (Thermo Fisher). In some experiments, cells from 2 or 3 tumor samples were combined in order to obtain sufficient T cell numbers for the analyses.
Quantitative reverse transcription PCR (qRT-PCR) assays
RNA was isolated using TRIzol reagent and subjected to qRT-PCR assays using SYBR reagent (Bio-Rad) and the following primers for mouse genes. Hk2 (forward: GATCGCCGGATTGGAACAGA; reverse: GGTCTAGCTGCTTAGCGTCC); G6pd (forward: GAAACTGGCTGTGCGCT; reverse: CCAGGTCACCCGATGCACCC); Actb (forward: CGTGAAAAGATGACCCAGATCA; reverse: CACAGCCTGGATGGCTACGT); Pdcd1 (forward: GGG CAC TTG ACT CTC CCT ACT; reverse: ATA TCC CCC TTT CCT TCC CT); Havcr2 (forward: AGGTCATTGGAAAATGCTTATGTGTTTGAG; reverse: CAGTAGGTCCCATGGTCATCC).
L. monocytogenes infection.
Age- and sex-matched wildtype and Map3k14tKO or wildtype and HK2tKO mice (6–8 weeks old) were infected intravenously with 1 x 10⁵ CFU of recombinant L. monocytogenes expressing chicken ovalbumin (OVA) (provided by H. Shen, University of Pennsylvania). Four days after infection, the mice were sacrificed for analysis of bacterial burden in spleen or liver. Seven days after infection, the mice were sacrificed for analysis of OVA-specific CD8+ effector T cells in the spleen. In brief, splenocytes were stimulated overnight with 10 μg/ml of OVA257–264 peptide (SIINFEKL, Genemed Synthesis), with a protein transport inhibitor, monensin, added during the last hour of culture. The cells were then subjected to intracellular IFN-γ staining and flow cytometry analysis.
Lymphocytic Choriomeningitis virus infection.
Age- and sex-matched wildtype and Map3k14tKO or wildtype and HK2tKO mice (6–8 weeks old) were infected intravenously with 4x10⁶ PFU of Lymphocytic Choriomeningitis virus (LCMV) clone 13 (provided by E. John Wherry, Univerisity of Pennsylvania). 84 days after infection, the mice were sacrificed for anlaysis of antigen specific CD8+ T cells in the spleen. In brief, splenocytes were stimulated with 3 μg/ml of LCMV GP33-41 peptide (KAVYNFATM, AnaSpec) for 14 h with monensin added during the last hour. The cells were then subjected to intracellular IFN-γ staining and flow cytometry analysis.
Metabolic assays.
ECAR and OCR were measured with an XF96 extracellular flux analyzer (Seahorse Bioscience) as previously described 47. In brief, naive CD8+ T cells isolated from the spleen of the indicated mice were either not treated (defined as naive) or activated for 24 h in vitro with anti-CD3 plus anti-CD28 (defined as activated) and then subjected to metabolic assays. For metabolic assay of tumor infiltrating lymphocytes (TIL), Map3k14tKO and age- and sex-matched wildtype control mice (6–8 weeks old) were injected s.c. with 2x10⁵ B16F10 murine melanoma cells. TIL isolated from 5 pairs day16 tumor was mixed and further sorted with CD90.2+ macs beads (miltenyi Biotec) followed by activated with anti CD3 and anti CD28 for 24 hours. The re-activated TIL was subjected to ECAR and OCR analysis. In some experiments, OT-I CD8+ T cells were isolated from the day 7 spleen of L. monocytogenes-infected mice directly subjected to metabolic analysis. ECAR was measured with an XF96 extracellular flux analyzer in a glycolysis stress test medium under basal (injection of glucose) and maximum or stressed (injection of oligomycin) conditions. OCR measured using a Mito stress kit (Seahorse Biosciences) under baseline (no treatment) and maximum or stressed (injection of FCCP) conditions, as previously described 47. NADPH measurements were performed with NADP/NADPH Quantitation Colorimetric Kit (BioVision), and G6PD activity was determined with Glucose-6-Phosphate Dehydrogenase Activity Assay Kit (Sigma-Aldrich). GSH/GSSG Ratio was detected with GSH/GSSG Ratio Detection Assay Kit (abcam).
Glucose uptake assay for T cells.
Sorted CD8+ T cells activated with anti-CD3 and anti-CD28 for the indictaed time period or CD8+ TILs prepared as described above were washed with PBS at room temperature and then incubated in glucose-free RPMI 1640 medium ( Thermo Fisher) containing 100 μM 2-NBDG (Cayman Chemical). For negative controls, the cells were incubated in glucose-free RPMI 1640 medium without 2-NBDG. After 1 h incubation in a 37°C water bath, cells were washed with ice-cold PBS and immediately subjected to flow cytometry analysis of 2-NBDG uptake.
Immunoblot and co-immunoprecipitation.
For immunoblot analysis, T cells or 293T cells were lysed in RIPA buffer (50 mM Tris-HCl pH 7.4, 150 mM NaCl, 1% (vol/vol) Nonidet P-40, 0.5% (vol/vol) sodium deoxycholate and 1 mM EDTA). Cytosol and lysosomal fractions were prepared with Lysosome Purification Kit from BioVision following the manufacturer’s instructions. Co-immunoprecipitation assays were performed essentially as described 48. Primary OT-I CD8+ T cells treated with anti-CD3 plus anti-CD28 for the indicated time points along with the proteasome inhibitor MG132 and the c-IAP inhibitor BV6. MG132 and BV6 were added for stabilizing NIK.The treated OT-I CD8+ T cells or transiently transfected 293T cells were lysed in RIPA buffer and subjected to immunoprecipitation using the indicated antibodies followed by immunoblot analysis of the co-precipitated proteins.
Mapping sites of G6PD phosphorylation induced by NIK
G6PD was phosphorylated by NIK in an in vitro kinase assay performed as previous described49. In brief, the assay was carried out in 20 μl of reaction mixture containing 50 mM Tris-HCl (pH 7.5), 2 mM ATP, 5 mM MgCl2, 0.1uM OA, 500 ng recombinant human G6PD (Novus Biologicals) as the substrate, and different doses (200 ng and 400 ng) of recombinant human NIK protein (ThermoFisher Scientific). The mixture was incubated at 30°C for 30 min and analyzed by immunoblot analysis with Phos-tag SDS Page from Wako Chemicals. The product from in vitro kinase assay was subjected for LC-MS/MS analysis in Proteomics Core Facility of the University of Texas MD Anderson Cancer Center.
In vitro cytotoxic T cell assays.
CD8+ T cells isolated from Map3k14+/+CreER or Map3k14TgCreER Pmel1 mice were activated in vitro for 1 day with anti CD3 plus anti-CD28 in the presence of the CreER inducer 4–OH tamoxifen and then cultured for 4 days in IL-2-supplemented medium. The generated wildtype and NIKiTg Pmel1 effector CD8+ T cells were labeled with CFSE and cocultured for 3 h with B16F10 tumor cells (1 x10⁵) in the indicated ratios in a U-bottom 96-well plate. Cells in each well were dissociated with 0.25% trypsin-EDTA, and the CFSE-negative tumor cells were subjected to flow cytometry for measuring cleaved caspase 3 to assess the cytotoxicity of the effector CD8+ T cells.
Retroviral transduction.
Human HK2 cDNA was cloned into the pMIGR1-GFP retroviral vector, and murine G6pd cDNA was cloned into the pPRIChp-mCherry retroviral vector. For production of retroviral particles, HEK293 cells were transfected with the retroviral expression vectors along with the packaging vector pCL-Eco. For transduction of primary T cells, naive OT-I CD8+ T cells were stimulated in 48-well plates (1 x 10⁶/well) for 24 h with plate-bound anti-CD3 (1 μg/ml) plus anti-CD28 (1μg/ml) in the presence of 10 ng/ml IL-15 and 5 ng/ml IL-2, then infected twice (at 48 h and 72 h) with retroviruses. For bone marrow cell infection, bone marrow cells were cultured in 48 well plates (1 x 10⁶/well) for 24 h with 100 ng/ml SCF, 10 ng/ml IL-6 and 10 ng/ml IL-3 and then infected twice (at 48 h and 72 h) with retroviruses. Twenty-four hours after the second retroviral transduction, transduced cells were enriched by flow cytometric cell sorting on the basis of GFP (for pMIGR1-based vectors) or mCherry (for pPRIChp-based vectors) expression.
Bone marrow adoptive transfer.
Bone marrow cells were isolated from G6pdmut and wildtype control mice under sterile conditions. After removing red blood cells (RBCs) in an RBC lysis buffer (Sigma), the bone marrow cells were counted and resuspended in ice-cold sterile PBS, and 2 x 10⁶ bone marrow cells were transferred into lethally irradiated (1000 rad) Rag1 KO (where indicated Rag2 KO) mice. After 6 weeks, the bone marrow chimeric mice were used for the indicated experiments. In some experiments, the G6pdmut bone marrow cells were transduced with the indicated expression vectors and enriched by flow cytometric sorting as described above in the Retroviral Transduction section.
RNA sequencing analysis.
Naïve CD8+ T cells were isolated from the spleen of young adult (6-8-week-old) wildtype OT-I or Map3k14tKO OT-I mice and were either immediately lysed for RNA preparation or activated for 24 h with anti-CD3 (1 μg/ml) and anti-CD28 (1 μg/ml). Total RNA was isolated with TRIzol (Invitrogen) and subjected to RNA sequencing analysis using an Illumina sequencer in the sequencing and microarray facility of the University of Texas MD Anderson Cancer Center as previous described 47.
Statistical analysis.
Statistical analyses were performed with GraphPad Prism 8 (GraphPad Software). For tumor growth curve, differences between groups were evaluated by two-way ANOVA with Bonferroni correction. For survival, differences between groups were evaluated by two-sided log-rank test. Other statistical analyses were performed by two-tailed unpaired t test. All statistical tests were justified as appropriate and the data met the assumptions of the tests. The variance was similar between the groups being statistically compared. All data are shown as mean ± s.e.m. Each experiment was repeated independently with similar results. The number of animals, number of independent experiments and methods of statistical tests used are indicated for each experiment in the figure legends.
Data availability
The RNA sequencing datasets have been deposited to Gene Expression Omnibus under the accession number GSE155576 (https://www.ncbi.nlm.nih.gov/geo/query/acc.cgi?acc=GSE155576); the mass spectrometry data have been deposited to the ProteomeXchange Consortium via the PRIDE partner repository with the dataset identifier PXD020943 and 10.6019/PXD020943 (project webpage: http://www.ebi.ac.uk/pride/archive/projects/PXD020943). Other datasets generated during the current study are available from the corresponding author on reasonable request.
Extended Data
Extended Data Fig. 1. NIK regulates T cell exhaustion and antitumor immunity.
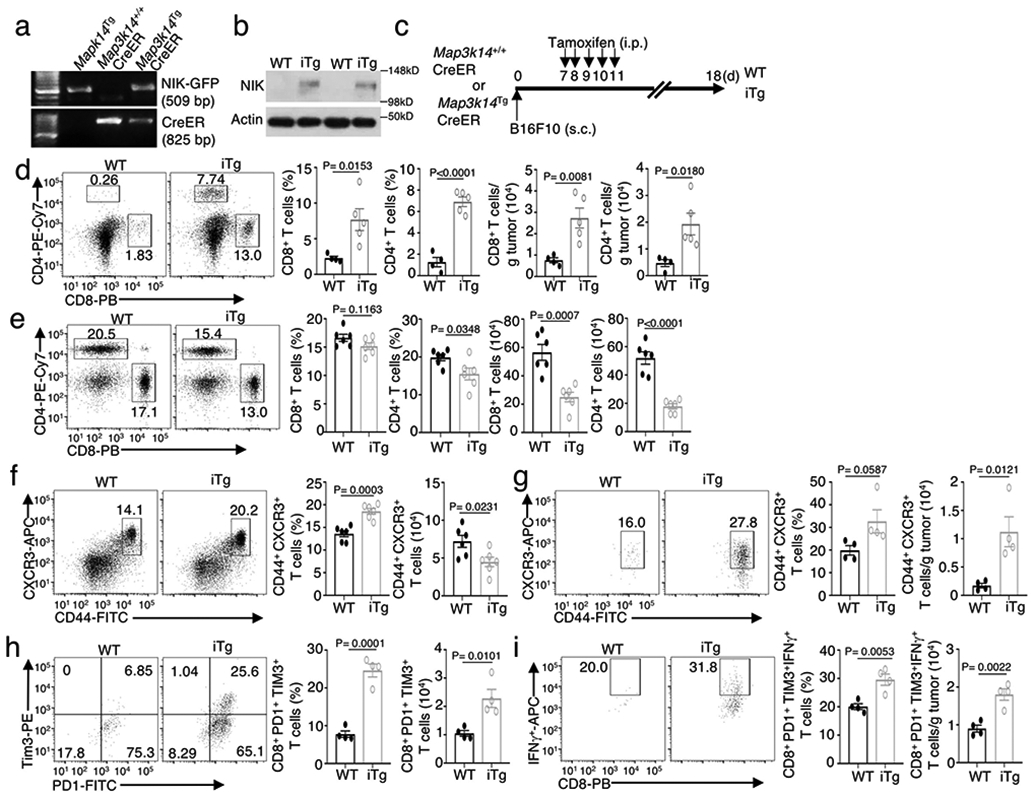
a, genotyping PCR of R26StopFLMap3k14 (Map3k14Tg), Map3k14+/+CreER, and R26StopFLMap3k14-CreER (Map3k14TgCreER) mice, showing the PCR products of NIK-GFP in Map3k14Tg allele and CreER. b, Immunoblot analysis of NIK expression in tamoxifen-treated Map3k14+/+CreER (WT) and Map3k14TgCreER (iTg) mice. c, Schematic of experimental design for producing B16F10 tumor-bearing NIKiTg and WT control mice. Each mouse was injected s.c. with 5 x 10⁵ B16F10 cells (WT=9, iTg=7). d,e, Flow cytometric analysis of the frequency and absolute cell number of CD4 and CD8 T cells in the tumor (d) or draining lymph node (e) of day 18 B16F10 tumor-implanted NIK-iTg and WT mice (d, WT: n=4; iTg: n=5; e, n=6 per genotype). f,g, Flow cytometric analysis of the frequency and absolute number of CD44+CXCR3+ CD8 effector T cells in the draining lymph node (f) or tumor (g) of day 18 B16F10 tumor-implanted NIK-iTg and wildtype mice (f, n=6 per genotype; g, n=4 per genotype). h,i, Flow cytometric analysis of the frequency and absolute number of PD1+Tim3+ CD8+ T cells (h) or IFNγ-producing PD1+Tim3+ CD8 T cells (i) in the tumor of day 18 B16F10-implanted NIKiTg and wildtype control mice (h,i, n=4 per genotype). Data are representative of three independent experiments. Summary data are shown as mean ± s.e.m. with P values determined by two-tailed Student’s t test.
Extended Data Fig. 2. Ectopic expression of NIK improves CD8 T cell function in adoptive T cell therapy.
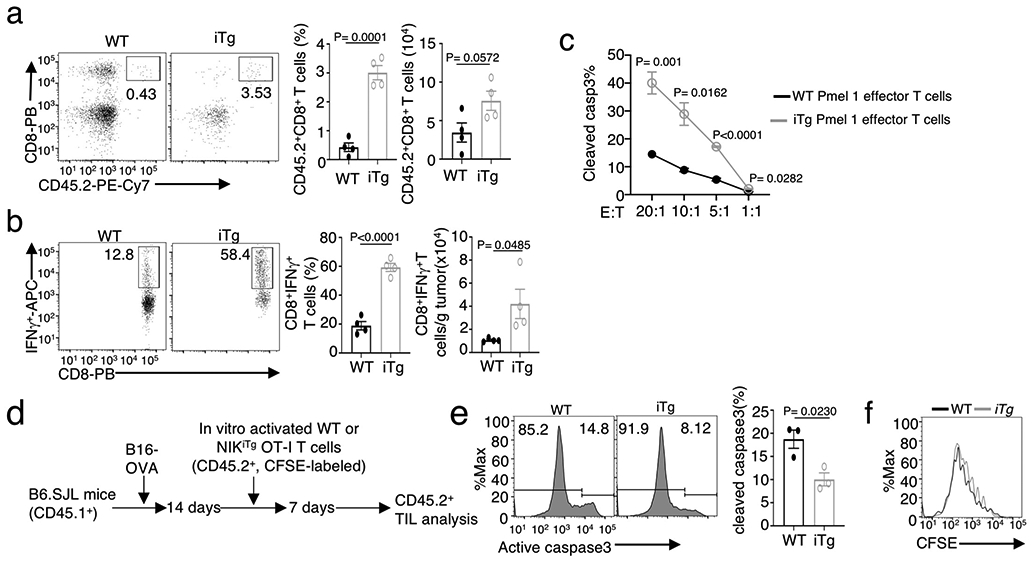
a,b, Flow cytometric analysis of the frequency of total donor CD8 T cells (a and IFNγ-producing donor CD8 T cells (b) in the tumor of B16F10 melanoma-bearing B6.SJL recipient mice adoptively transferred with wildtype or NIKiTg Pmel1 CD8 T cells as described in Fig. 2o (n=4 per genotype). c, In vitro cytotoxicity assay of wildtype (WT) and NIKiTg Pmel1 CD8 effector T cells towards B16F10 tumor cells at the indicated effector to tumor (E:T) ratios. d-f, Schematic of experimental design (d) and flow cytometric analysis of apoptosis based on caspase 3 cleavage (e) or proliferation based on CFSE dilution (f) of tumor-infiltrating wildtype (WT) and NIKiTg OT-I CD8 T cells in B16-OVA-tumor bearing B6.SJL mice adoptively transferred with in vitro activated and CFSE-labeled WT or NIKiTg CD8 T cells for 7 days (e, n=3 per genotype). Data are representative of two independent experiments. Summary data are shown as mean ± s.e.m. with P values determined by two-tailed Student’s t test.
Extended Data Fig. 3. NIK deficiency has no effect on mRNA expression of glycolysis-regulatory genes and glucose uptake but promotes.
a, Seahorse analysis of OCR under baseline (no treatment) and maximum or stressed (injection of FCCP) conditions in untreated Map3k14tKO (tKO) or wildtype (WT) naïve CD8 T cells. Data are shown as a representative plot (upper) and summary graphs (lower, each circle represents a well). b, Volcano plot of RNA sequencing analysis of differentially expressed genes in Map3k14tKO OT-I CD8 T cells relative to WT OT-I CD8 T cells, activated with anti-CD3 plus anti-CD28 for 24 hr. c, Immunoblot analysis of the indicated proteins in WT or Map3k14tKO OT-I CD8 T cells stimulated with anti-CD3 plus anti-CD28 for the indicated time periods. d,e, Flow cytometric analysis of glucose uptake using in vitro activated (d) or B16F10 tumor-infiltrating (e) CD8 T cells. f, Flow cytometry analysis of HK2 expression in tumor-infiltrating CD8 T cells of B16F10-bearing wildtype (WT) or Hk2tKO mice, showing the specificity of the HK2 staining. g, Immunoblot analysis of HK2 and the indicated control proteins in the cytoplasmic (Cy) and lysosomal (Ly) fractions of wildtype (WT) and Map3k14tKO CD8 T cells. h, Immunoblot analysis of the indicated proteins in whole cell lysates of wildtype or Map3k14tKO CD8 T cells treated for the indicated time points in the presence (+) or absence (−) of lysosomal inhibitors, E64D plus pepstatin A. i, Summary of h based on densitometric quantification of three independent experiments. Data are representative of two (b,f) or three(a,c-e,g-h) independent experiments. Summary data are shown as mean ± s.e.m. with P values determined by two-tailed Student’s t test.
Extended Data Fig. 4. T cell-specific deletion of HK2 impairs T cell metabolism and immune responses against tumorigenesis and bacterial infection.
a,b, Genotyping PCR (a) and immunoblot (b) analysis of the Hk2tKO (tKO) and wildtype (WT) control mice. c,d, Seahorse analysis of basal ECAR (measured after glucose injection, Glc) and maximum ECAR (measured after oligomycin injection, Oligo) (c) and Seahorse analysis of baseline OCR (no treatment) and maximum OCR (FCCP injection) (d) in Hk2tKO or wildtype OT-I CD8 T cells either naïve or activated with anti-CD3 and anti-CD28 for 24 h. e, Flow cytometric analysis of the expression level of PD1 and Tim3 in CD8 T cells isolated from day-20 tumor of the B16F10-implanted Hk2tKO and wildtype control mice (n=4 per genotype). f,g, Flow cytometric analysis of the frequency and absolute number of IFNγ-producing CD8 effector T cells in splenocytes (f) and bacterial burden in the spleen (g, presented as a representative image and a summary graph based on multiple mice) of Hk2tKO or wildtype mice infected i.v. with L. monocytogenes (1 x 10⁵ CFU/mouse) for 7 (f) or 4 (g) days (f, n=4 per genotype; g, n=6 per genotype). h, Flow cytometric analysis of IFNγ-producing CD8 T cells in the spleen of the indicated mouse strains infected for 84 days with LCMV clone 13(4x10⁶ PFU/mouse), restimulated in vitro with 3 μg/ml LCMV gp33-41 peptide for 14 h with monensin added during the last hour; WT(n=6), Map3k14tKO(n=6) and Hk2tKO(n=3). Data are representative of two (f-h) or three (a-e) independent experiments. Summary data are shown as mean ± s.e.m. with P values determined by two-tailed Student’s t test.
Extended Data Fig. 5. NIK-mediated stimulation of antitumor T cell responses requires HK2.
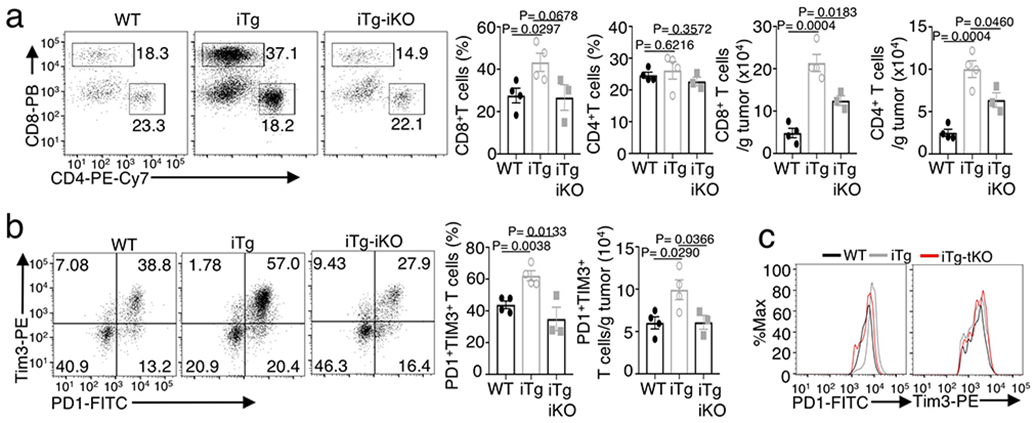
Flow cytometric analysis of the frequency and absolute cell number of CD4 and CD8 T cells (a), PD1+Tim3+ CD8 T cells (b) and flow cytometric analysis of the expression level (MFI) of PD1 and Tim3 in CD8 T cells (c) in day-27 tumor of wildtype (WT), NIKiTg (iTg), NIKiTgHk2iKO (iTg-iKO) mice injected s.c. with 5 x 10⁵/mouse MC38 colon cancer cells (a,b, WT: n=4; iTg: n=4; iTg-iKO: n=3). Data are representative of two independent experiments. Summary data are shown as mean ± s.e.m. with P values were determined by two-tailed Student’s t test.
Extended Data Fig. 6. Noncanonical NF-κB activation is not required for HK2 stabilization or T cell metabolism.
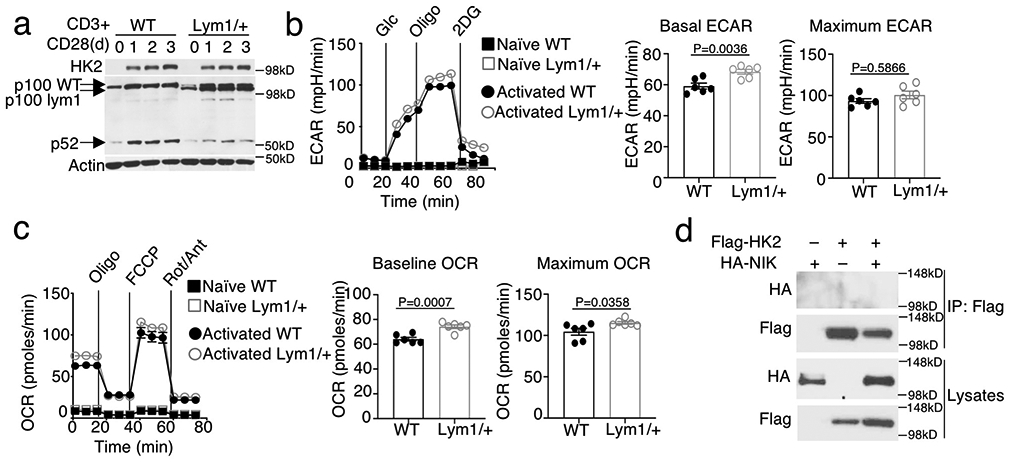
a, Immunoblot analysis of HK2 expression and p100 processing (as a measure of noncanonical NF-kB activation) in WT or Nfkb2Lym1/+ (Lym1/+) OT-I CD8 T cells stimulated with anti-CD3 plus anti-CD28 for the indicated time periods. b,c, Seahorse analysis of basal ECAR (after glucose injection) and maximum ECAR (after oligomycin injection) (b) and Seahorse analysis of baseline OCR (no treatment) and maximum OCR (FCCP injection) (c) of WT or Nfkb2Lym1/+ (Lym1/+) OT-I CD8 T cells, either naïve or activated with anti-CD3 and anti-CD28 for 24 h, under baseline and stressed conditions. d, Coimmunoprecipitation analysis of NIK-HK2 interaction using whole-cell lysates of 293 cells transfected with (+) or without (−) the indicated expression vectors. Data are representative of three independent experiments. Summary data are shown as mean ± s.e.m. based on multiple wells (each circle represents a well) with P values determined by two-tailed Student’s t test.
Extended Data Fig. 7. ROS is involved in HK2 degradation in NIK-deficient CD8 T cells.
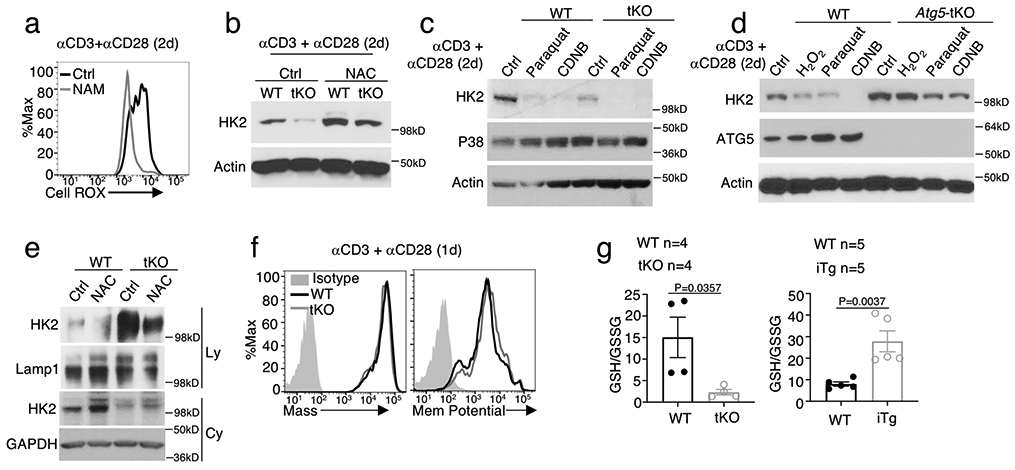
a, Flow cytometric analysis of ROS levels in Map3k14tKO OT-I CD8 T cells activated with anti-CD3 plus anti-CD28 for 48h in the presence of NAM or solvent control DMSO. b,c, Immunoblot analysis of HK2 expression in Map3k14tKO (tKO) or wildtype (WT) OT-I CD8 T cells activated with anti-CD3 plus anti-CD28 for 48h in the presence of the antioxidant N-acetylcysteine (NAC) or medium control (b) or the indicated ROS inducers and DMSO control (c). d, Immunoblot analysis of HK2 in wildtype (WT) or Atg5-tKO CD8 T cells activated with anti-CD3 plus anti-CD28 for 48h in the presence of the indicated ROS inducers or medium control. e, Immunoblot analysis of HK2 and the indicated loading controls in lysosomal (Ly) and cytoplasmic (Cy) fractions of wildtype (WT) and Map3k14tKO CD8 T cells activated with anti-CD3 plus anti-CD28 for 48 h in the presence of NAC or medium control. f, Flow cytometry analysis of the mass and membrane potential of mitochondria in wildtype (WT) and Map3k14tKO (tKO) CD8 T cells stimulated with anti-CD3 plus anti-CD28 for 24 h. g, Ratio of reduced (GSH) and oxidized (GSSG) forms of glutathione in Map3k14tKO (upper), NIKiTg (lower), or wildtype (WT) control OT-I CD8 T cells activated in vitro with anti-CD3 plus anti-CD28 for 48 h. Data are representative of three independent experiments. Summary data are shown as mean ± s.e.m. with P values determined by two-tailed Student’s t test.
Extended Data Fig. 8. G6PD phosphorylation by NIK and role in regulating HK2 expression and T cell metabolism.
a, Seahorse analysis of basal ECAR (measured after glucose injection, Glc) and maximum ECAR (measured after oligomycin injection, Oligo) and Seahorse analysis of baseline OCR (no treatment) and maximum OCR (FCCP injection) in G6PDmut or wildtype (WT) control T cells activated by anti-CD3 plus anti-CD28 for 48 h. b,c, Immunoblot analysis of the indicated proteins (b) and ROS detection (c) in wildtype or Nfkb2lym1/+ (Lym1/+) CD8 T cells, which were either not treated (NT) or stimulated with anti-CD3 plus anti-CD28 for the indicated time periods. d, CoIP analysis of NIK-G6PD interaction (upper) and immunoblot analysis of HA-NIK and Flag-G6PD expression in whole-cell lysates (WCL) of 293 cells transfected with (+) or without (−) Flag-G6PD and HA-NIK. e, Phos-tag SDS PAGE and Immunoblot analysis of phosphorylated (p-) and total G6PD as well as GST-NIK in an in vitro kinase assay mix containing 500 ng recombinant His-G6PD and the indicated amounts of recombinant GST-NIK. f, NIK-induced G6PD phosphorylation sites identified by mass spectrometry analysis of G6PD phosphorylated in vitro by NIK. g, G6PD activity in 293T cells transiently transfected with Flag-tagged wildtype G6PD or the indicated G6PD mutants along with either an empty vector or HA-NIK. h,i, Schematic of experimental design (h) and immunoblot analysis of G6PD expression in T cells isolated from bone marrow chimeric mice constructed using G6PDmut bone marrow cells reconstituted with either an empty vector (Vector) or the indicated G6PD expression vectors (i). For a and g, data are shown as representative plots, each circle represents a well. Data are representative of one (f) or three (a-e,g-i) independent experiments. Summary data are shown as mean ± s.e.m. with P values determined by two-tailed Student’s t test.
Supplementary Material
Acknowledgements
We thank Genentech Inc. for providing Map3k14 flox mice. This study was supported by a grant from the National Institutes of Health (GM84459 to S.-C.S.) and partially supported by a grant from the National Research Foundation (NRF) funded by the South Korean government (MISP 2011-0018312 to J.B.K.). We thank the flow cytometry, sequencing and microarray, Proteomics, and animal facility of the shared resources at The MD Anderson Cancer Center, supported by the NIH/NCI Cancer Center Support Grant (CCSG) P30CA016672. The Proteomics Facility is also supported by the NIH grant IS10OD012304 and the Cancer Prevention and Research Institute of Texas (CPRIT) grant RP130397.
Footnotes
Competing financial interests statement
J.Y. is an employee of Precision for Medicine, H.D.B. is an employee of Genentech, Inc., and the other authors declare no competing financial interests. Genentech, Inc. provided the Map3k14 flox mice.
References
- 1.Durgeau A, Virk Y, Corgnac S & Mami-Chouaib F Recent Advances in Targeting CD8 T-Cell Immunity for More Effective Cancer Immunotherapy. Frontiers in immunology 9, 14 (2018). [DOI] [PMC free article] [PubMed] [Google Scholar]
- 2.Geltink RIK, Kyle RL & Pearce EL Unraveling the Complex Interplay Between T Cell Metabolism and Function. Annu Rev Immunol 36, 461–488 (2018). [DOI] [PMC free article] [PubMed] [Google Scholar]
- 3.Lim AR, Rathmell WK & Rathmell JC The tumor microenvironment as a metabolic barrier to effector T cells and immunotherapy. eLife 9 (2020). [DOI] [PMC free article] [PubMed] [Google Scholar]
- 4.Almeida L, Lochner M, Berod L & Sparwasser T Metabolic pathways in T cell activation and lineage differentiation. Semin Immunol 28, 514–524 (2016). [DOI] [PubMed] [Google Scholar]
- 5.Chang CH et al. Posttranscriptional control of T cell effector function by aerobic glycolysis. Cell 153, 1239–1251 (2013). [DOI] [PMC free article] [PubMed] [Google Scholar]
- 6.Buck MD, Sowell RT, Kaech SM & Pearce EL Metabolic Instruction of Immunity. Cell 169, 570–586 (2017). [DOI] [PMC free article] [PubMed] [Google Scholar]
- 7.Rivadeneira DB & Delgoffe GM Antitumor T-cell Reconditioning: Improving Metabolic Fitness for Optimal Cancer Immunotherapy. Clin Cancer Res 24, 2473–2481 (2018). [DOI] [PMC free article] [PubMed] [Google Scholar]
- 8.Li X et al. Navigating metabolic pathways to enhance antitumour immunity and immunotherapy. Nat Rev Clin Oncol 16, 425–441 (2019). [DOI] [PubMed] [Google Scholar]
- 9.Hashimoto M et al. CD8 T Cell Exhaustion in Chronic Infection and Cancer: Opportunities for Interventions. Annual review of medicine 69, 301–318 (2018). [DOI] [PubMed] [Google Scholar]
- 10.McLane LM, Abdel-Hakeem MS & Wherry EJ CD8 T Cell Exhaustion During Chronic Viral Infection and Cancer. Annu Rev Immunol (2019). [DOI] [PubMed] [Google Scholar]
- 11.Patsoukis N et al. PD-1 alters T-cell metabolic reprogramming by inhibiting glycolysis and promoting lipolysis and fatty acid oxidation. Nat Commun 6, 6692 (2015). [DOI] [PMC free article] [PubMed] [Google Scholar]
- 12.Rashida Gnanaprakasam JN, Wu R & Wang R Metabolic Reprogramming in Modulating T Cell Reactive Oxygen Species Generation and Antioxidant Capacity. Front Immunol 9, 1075 (2018). [DOI] [PMC free article] [PubMed] [Google Scholar]
- 13.Ronquist G & Theodorsson E Inherited, non-spherocytic haemolysis due to deficiency of glucose-6-phosphate dehydrogenase. Scand J Clin Lab Invest 67, 105–111 (2007). [DOI] [PubMed] [Google Scholar]
- 14.Stanton RC Glucose-6-phosphate dehydrogenase, NADPH, and cell survival. IUBMB Life 64, 362–369 (2012). [DOI] [PMC free article] [PubMed] [Google Scholar]
- 15.Ho HY, Cheng ML & Chiu DT Glucose-6-phosphate dehydrogenase--from oxidative stress to cellular functions and degenerative diseases. Redox Rep 12, 109–118 (2007). [DOI] [PubMed] [Google Scholar]
- 16.Yang HC et al. The Redox Role of G6PD in Cell Growth, Cell Death, and Cancer. Cells 8 (2019). [DOI] [PMC free article] [PubMed] [Google Scholar]
- 17.Yang K & Chi H mTOR and metabolic pathways in T cell quiescence and functional activation. Semin. Immunol 24, 421–428 (2012). [DOI] [PMC free article] [PubMed] [Google Scholar]
- 18.Maciver NJ, Michalek RD & Rathmell JC Metabolic regulation of T lymphocytes. Annu. Rev. Immunol 31, 259–283 (2013). [DOI] [PMC free article] [PubMed] [Google Scholar]
- 19.Saravia J, Raynor JL, Chapman NM, Lim SA & Chi H Signaling networks in immunometabolism. Cell Res 30, 328–342 (2020). [DOI] [PMC free article] [PubMed] [Google Scholar]
- 20.Shyer JA, Flavell RA & Bailis W Metabolic signaling in T cells. Cell Res 30, 649–659 (2020). [DOI] [PMC free article] [PubMed] [Google Scholar]
- 21.Sun SC The non-canonical NF-kappaB pathway in immunity and inflammation. Nat Rev Immunol 17, 545–558 (2017). [DOI] [PMC free article] [PubMed] [Google Scholar]
- 22.Dejardin E The alternative NF-kappaB pathway from biochemistry to biology: pitfalls and promises for future drug development. Biochem. Pharmacol 72, 1161–1179 (2006). [DOI] [PubMed] [Google Scholar]
- 23.Li Y et al. Cell intrinsic role of NF-kappaB-inducing kinase in regulating T cell-mediated immune and autoimmune responses. Sci Rep 6, 22115 (2016). [DOI] [PMC free article] [PubMed] [Google Scholar]
- 24.Wang J, Saffold S, Cao X, Krauss J & Chen W Eliciting T cell immunity against poorly immunogenic tumors by immunization with dendritic cell-tumor fusion vaccines. J Immunol 161, 5516–5524 (1998). [PubMed] [Google Scholar]
- 25.Ahn E et al. Role of PD-1 during effector CD8 T cell differentiation. Proc Natl Acad Sci U S A 115, 4749–4754 (2018). [DOI] [PMC free article] [PubMed] [Google Scholar]
- 26.Sasaki Y et al. NIK overexpression amplifies, whereas ablation of its TRAF3-binding domain replaces BAFF:BAFF-R-mediated survival signals in B cells. Proc. Natl. Acad. Sci. USA 105, 10883–10888 (2008). [DOI] [PMC free article] [PubMed] [Google Scholar]
- 27.Overwijk WW et al. Tumor regression and autoimmunity after reversal of a functionally tolerant state of self-reactive CD8+ T cells. J Exp Med 198, 569–580 (2003). [DOI] [PMC free article] [PubMed] [Google Scholar]
- 28.Pearce EL, Poffenberger MC, Chang CH & Jones RG Fueling immunity: insights into metabolism and lymphocyte function. Science 342, 1242454 (2013).24115444 [Google Scholar]
- 29.Mizushima N Autophagy: process and function. Genes Dev 21, 2861–2873 (2007). [DOI] [PubMed] [Google Scholar]
- 30.Kaur J & Debnath J Autophagy at the crossroads of catabolism and anabolism. Nat Rev Mol Cell Biol 16, 461–472 (2015). [DOI] [PubMed] [Google Scholar]
- 31.Lamark T, Svenning S & Johansen T Regulation of selective autophagy: the p62/SQSTM1 paradigm. Essays Biochem 61, 609–624 (2017). [DOI] [PubMed] [Google Scholar]
- 32.Mehta MM et al. Hexokinase 2 is dispensable for T cell-dependent immunity. Cancer Metab 6, 10 (2018). [DOI] [PMC free article] [PubMed] [Google Scholar]
- 33.Murray SE et al. NF-kappaB-inducing kinase plays an essential T cell-intrinsic role in graft-versus-host disease and lethal autoimmunity in mice. J. Clin. Invest 121, 4775–4786 (2011). [DOI] [PMC free article] [PubMed] [Google Scholar]
- 34.Bollyky PL et al. CD44 costimulation promotes FoxP3+ regulatory T cell persistence and function via production of IL-2, IL-10, and TGF-beta. J Immunol 183, 2232–2241 (2009). [DOI] [PMC free article] [PubMed] [Google Scholar]
- 35.Tucker E et al. A novel mutation in the Nfkb2 gene generates an NF-kappa B2 "super repressor". J. Immunol 179, 7514–7522 (2007). [DOI] [PubMed] [Google Scholar]
- 36.Yu J et al. T Cell-Intrinsic Function of the Noncanonical NF-kappaB Pathway in the Regulation of GM-CSF Expression and Experimental Autoimmune Encephalomyelitis. Pathogenesis. J. Immunol 193, 422–430 (2014). [DOI] [PMC free article] [PubMed] [Google Scholar]
- 37.Filomeni G, De Zio D & Cecconi F Oxidative stress and autophagy: the clash between damage and metabolic needs. Cell Death Differ 22, 377–388 (2015). [DOI] [PMC free article] [PubMed] [Google Scholar]
- 38.Kamat JP & Devasagayam TP Nicotinamide (vitamin B3) as an effective antioxidant against oxidative damage in rat brain mitochondria. Redox Rep 4, 179–184 (1999). [DOI] [PubMed] [Google Scholar]
- 39.Choi HJ, Jang SY & Hwang ES High-Dose Nicotinamide Suppresses ROS Generation and Augments Population Expansion during CD8(+) T Cell Activation. Mol Cells 38, 918–924 (2015). [DOI] [PMC free article] [PubMed] [Google Scholar]
- 40.Pretsch W, Charles DJ & Merkle S X-linked glucose-6-phosphate dehydrogenase deficiency in Mus musculus. Biochem Genet 26, 89–103 (1988). [DOI] [PubMed] [Google Scholar]
- 41.Ham M et al. Glucose-6-Phosphate Dehydrogenase Deficiency Improves Insulin Resistance With Reduced Adipose Tissue Inflammation in Obesity. Diabetes 65, 2624–2638 (2016). [DOI] [PubMed] [Google Scholar]
- 42.Pauken KE et al. Epigenetic stability of exhausted T cells limits durability of reinvigoration by PD-1 blockade. Science 354, 1160–1165 (2016). [DOI] [PMC free article] [PubMed] [Google Scholar]
- 43.Wei SC et al. Distinct Cellular Mechanisms Underlie Anti-CTLA-4 and Anti-PD-1 Checkpoint Blockade. Cell 170, 1120–1133 e1117 (2017). [DOI] [PMC free article] [PubMed] [Google Scholar]
- 44.Varanasi SK, Jaggi U, Hay N & Rouse BT Hexokinase II may be dispensable for CD4 T cell responses against a virus infection. PLoS One 13, e0191533 (2018). [DOI] [PMC free article] [PubMed] [Google Scholar]
- 45.Brightbill HD et al. Conditional Deletion of NF-kappaB-Inducing Kinase (NIK) in Adult Mice Disrupts Mature B Cell Survival and Activation. J. Immunol 195, 953–964 (2015). [DOI] [PubMed] [Google Scholar]
- 46.Gershon TR et al. Hexokinase-2-mediated aerobic glycolysis is integral to cerebellar neurogenesis and pathogenesis of medulloblastoma. Cancer Metab 1, 2 (2013). [DOI] [PMC free article] [PubMed] [Google Scholar]
- 47.Zhou X et al. The deubiquitinase Otub1 controls the activation of CD8(+) T cells and NK cells by regulating IL-15-mediated priming. Nat Immunol 20, 879–889 (2019). [DOI] [PMC free article] [PubMed] [Google Scholar]
- 48.Xiao G, Harhaj EW & Sun SC NF-kappaB-inducing kinase regulates the processing of NF-kappaB2 p100. Mol. Cell 7, 401–409 (2001). [DOI] [PubMed] [Google Scholar]
- 49.Ouyang C et al. Transforming growth factor (TGF)-beta-activated kinase 1 (TAK1) activation requires phosphorylation of serine 412 by protein kinase A catalytic subunit alpha (PKACalpha) and X-linked protein kinase (PRKX). J Biol Chem 289, 24226–24237 (2014). [DOI] [PMC free article] [PubMed] [Google Scholar]
Associated Data
This section collects any data citations, data availability statements, or supplementary materials included in this article.
Supplementary Materials
Data Availability Statement
The RNA sequencing datasets have been deposited to Gene Expression Omnibus under the accession number GSE155576 (https://www.ncbi.nlm.nih.gov/geo/query/acc.cgi?acc=GSE155576); the mass spectrometry data have been deposited to the ProteomeXchange Consortium via the PRIDE partner repository with the dataset identifier PXD020943 and 10.6019/PXD020943 (project webpage: http://www.ebi.ac.uk/pride/archive/projects/PXD020943). Other datasets generated during the current study are available from the corresponding author on reasonable request.


