

Abstract
Background
The permanence of neuromuscular adaptations following anterior cruciate ligament reconstruction is not known. The aim of this study was to compare bilateral muscle co-contraction indices, time to peak ground reaction force, and timing of muscle onset between anterior cruciate ligament reconstruction subjects 10–15 years post reconstruction with those of matched uninjured controls during a one-leg hop landing.
Methods
Nine healthy controls and 9 reconstruction subjects were recruited. Clinical and functional knee exams were administered. Lower limb co-contraction indices, time to peak ground reaction force, and muscle onset times were measured bilaterally. Differences in clinical and functional outcomes were assessed with unpaired t-tests, and mixed model repeated measures were used to examine effects of group, limb and interaction terms in electromyography measures.
Findings
89% of control knees were clinically “normal”, whereas only 33% of reconstructed knees were “normal”. Anterior cruciate ligament-reconstructed subjects tended to achieve shorter functional hop distances but demonstrated symmetrical lower limb electromyography measures that were no different from those of controls’ with the exception that biceps femoris activation was delayed bilaterally prior to ground contact but was greater during the injury risk phase of landing.
Interpretation
With the exception of hamstring activation, lower limb electromyography measures were largely similar between ligament-reconstructed and matched control subjects, which was in contrast to the clinical findings. This result brings into question the significance of neuromuscular function at this long-term follow-up but raises new questions regarding the role of symmetry and pre-injury risk.
Keywords: Anterior Cruciate Ligament, neuromuscular, electromyography, ground reaction force
1. Introduction
Understanding neuromuscular function and its bearing on abnormal kinematics and dynamic joint stability has received a great deal of attention in the anterior cruciate ligament (ACL) literature (Barrance, et al., 2006; Chmielewski, et al., 2005a; Hurd and Snyder-Mackler, 2007; Lanier, et al., 2020; Malfait, et al., 2016; Nawasreh, et al., 2019; Neuman, et al., 2008; Rudolph, et al., 2001; Theisen, et al., 2016). Using co-contraction indices to describe the degree that muscle agonist/antagonist pairs are activated simultaneously (Tsai, et al., 2012), these studies suggest that generalized knee muscle co-contraction functions to increase joint stability initially (Ford, et al., 2008), but that more refined muscle activation patterning can then be trained to achieve functional stability in the absence of the ligamentous constraint normally provided by the ACL (Chmielewski, et al., 2005a; Chmielewski, et al., 2005b; Draganich and Vahey, 1990; Hurd and Snyder-Mackler, 2007). Conversely, individuals who continue to exhibit generalized co-contraction and joint stiffening strategies to compensate for ACL loss are less likely to complete conservative treatment successfully and eventually go on to ACL reconstruction (Rudolph, et al., 1998). Thus, it is thought that persistent co-contraction and joint stiffening in these “non-copers” likely reflects an abnormal neuromuscular strategy that failed to restore joint stability in ACL deficient patients. To this end, greater co-contraction indices (Coats-Thomas, et al., 2013; Gokeler, et al., 2010; Tsai, et al., 2012), increased joint stiffness (Renner, et al., 2018; Trigsted, et al., 2018), and earlier muscle activation onset times (Coats-Thomas, et al., 2013; Gokeler, et al., 2010; Tsai, et al., 2012) have similarly been described in ACL reconstruction (ACLR) patients. Therefore, these three measures of neuromuscular function are likely to reflect the incomplete restoration of normal joint stability and could contribute to the abnormal biomechanics observed during one-leg hopping following ACL reconstruction (Deneweth, et al., 2010).
Current ACLR rehabilitation protocols aim to address these known biomechanical and neuromuscular consequences of ACL injury and reconstruction, where regaining limb symmetry in passive and active ranges of motion, strength, and coordinated neuromuscular activation patterns is advocated (Davies, et al., 2017; van Grinsven, et al., 2010); however, changes in contralateral limb neuromuscular function that resemble those of the ACL-reconstructed limb have also been documented (Goerger, et al., 2015; Hiemstra, et al., 2007; Swanik, et al., 1999). Despite these rehabilitative efforts, persistent ipsilateral deficits in clinical knee function and knee laxity are common even 7 years after ACL reconstruction (Akelman, et al., 2016; Group, et al., 2018). Thus the significance of symmetry in measures of neuromuscular function thought to reflect incomplete restoration of joint stability (e.g., co-contraction (Coats-Thomas, et al., 2013; Gokeler, et al., 2010; Tsai, et al., 2012), joint stiffening (Renner, et al., 2018; Trigsted, et al., 2018), early muscle activation onset (Coats-Thomas, et al., 2013; Gokeler, et al., 2010; Tsai, et al., 2012)) in the context of long-term clinical knee function following ACLR remains unclear.
The aim of this study was therefore to compare bilateral electromyography measures of neuromuscular function thought to be related to joint stability between ACLR subjects 10–15 years post reconstruction with those of uninjured controls during a one-leg hop landing. We hypothesized that relative to controls and their contralateral limb, ACLR subjects would have: (1) greater co-contraction indices, (2) a shorter duration of time from ground contact to peak ground reaction force (as a proxy for joint stiffness), and (3) earlier muscle activation prior to ground contact. We further hypothesized that clinical and functional measures of the ACL-reconstructed knees would be inferior to measures from both the contralateral side and to those of uninjured control subject knees.
2. Methods
2.1. Subjects
Nine healthy control subjects (6 male, 3 female; age = 38.6 ± 5.9 years), and nine ACLR subjects (5 males, 4 females; age = 33.6 ± 10.5 years) were recruited from an ongoing prospective randomized controlled trial (NCT00434837; 88 total subjects [11 female controls] actively participating in all on-site examinations at the time of follow-up) (Akelman, et al., 2016; Fleming, et al., 2013). At the time of enrolment in the parent study, ACLR subjects had sustained a unilateral ACL injury and were candidates for reconstruction surgery; patients who had an ACL injury more than 12 months old, had sustained a significant concomitant injury to the menisci or other ligaments, had a previous knee injury, or exhibited evidence of OA were ineligible. To be eligible to participate in the sub-study at either 10, 12, or 15-year follow-up, subjects had to be willing to participate in all on-site examinations associated with the parent study protocol, the ACL graft had to be visible with minimal metal susceptibility artifact on magnetic resonance (MR) images and females could not be pregnant. At follow-up enrolment into the sub-study, none of the ACLR patients reported injury to the contralateral knee and none had sustained overt graft failure based on a clinical exam and MR imaging (data not shown).
Of the 9 ACLR subjects, two received bone-patellar tendon-bone autografts (1 male; 1 female), while the remaining seven received hamstring tendon autografts. At the time of parent study enrolment, control subjects were matched to ACLR subject demographics, had no prior ligament or meniscus injury, and were randomly assigned an index limb in proportion to the injury group. All subjects – both ACLR and matched controls – were between ten and fifteen years follow-up from their initial enrolment in the parent study (Table 1).
Table 1.
Subject demographics and clinical outcome measures at follow-up.
| Sex | Subject Group | Age | Index Limb | BMI | Follow-Up Year | IKDC Score | KT-1000a | Hop Distanceb |
|---|---|---|---|---|---|---|---|---|
| Male | ACLR | 27 | L | 25 | 12 | B | −1 | 94 |
| Male | ACLR | 29 | L | 33 | 12 | A | 3 | 85 |
| Male | ACLR | 30 | L | 29 | 12 | B | −2 | 93 |
| Male | ACLR | 30 | R | 26 | 12 | B | 0 | 84 |
| Male | ACLR | 27 | R | 27 | 10 | B | 1 | 113 |
| Female | ACLR | 31 | L | 22 | 15 | A | 1 | 100 |
| Female | ACLR | 39 | R | 29 | 12 | B | 0 | 97 |
| Female | ACLR | 29 | R | 32 | 12 | A | −2 | 85 |
| Female | ACLR | 60 | R | 26 | 12 | B | −14 | 92 |
| Male | Control | 33 | R | 27 | 12 | B | 0 | 108 |
| Male | Control | 34 | L | 27 | 12 | A | 0 | 95 |
| Male | Control | 41 | L | 26 | 12 | A | 1 | 100 |
| Male | Control | 35 | L | 26 | 12 | A | −1 | 95 |
| Male | Control | 47 | L | 24 | 12 | A | 0 | 94 |
| Male | Control | 31 | L | 31 | 12 | A | −1 | 111 |
| Female | Control | 43 | L | 21 | 12 | A | 1 | 96 |
| Female | Control | 38 | R | 26 | 10 | A | 0 | 106 |
| Female | Control | 45 | R | 21 | 12 | A | −1 | 100 |
Expressed as (mm) difference from contralateral limb; positive values indicate increased laxity.
Expressed as (%) difference from contralateral limb; >100 indicates greater than contralateral.
Subjects provided written informed consent following Institutional Review Board approval prior to participating.
2.2. Data Collection
The International Knee Documentation Committee (IKDC) examination (Irrgang, et al., 1998) and an arthrometer (KT-1000; MedMetric, San Diego)(Malcom, et al., 1985) were administered by a licensed physiotherapist to document clinical knee function and knee laxity, respectively, at the time of data collection (10, 12, or 15 years follow-up). It is likely that operator error occurred for the arthrometer measure for one ACLR subject (−14mm difference from contralateral limb; Table 1), but her data were included nevertheless. All biomechanical data were collected at the W.M. Keck Foundation X-Ray of Motion of Moving Morphology (XROMM) lab at Brown University (www.xromm.org; www.xmaportal.org [Dynamic Knee Contact During a Hop Landing])(Brainerd, et al., 2010). Subjects were outfitted with 19 retroreflective markers and 7 electromyography (EMG) electrodes on each limb. Markers were placed on the subject’s thigh, shank, and foot. EMG electrodes were placed on the quadriceps (rectus femoris [RF] and vastus medialis oblique [VMO]), hamstrings (semitendinosus [ST], and biceps femoris [BF]), gastrocnemius (medial gastrocnemius [MG], and lateral gastrocnemius [LG]), and tibialis anterior (TA). Before electrode placement, the skin was prepped by shaving and lightly abrading the area, and then cleaned with an alcohol prep pad. The anatomical placement of the electrodes over the muscle bellies followed the procedures described by Perotto (Perotto, 2011). Joint motion, muscle EMG, and ground reaction force data were recorded synchronously. EMG data were collected wirelessly at 3000 Hz (Desktop DTS, Noraxon, Scottsdale, AZ), and were synchronized with motion data that were collected at 125Hz using an 8-camera system (Oqus 5+, Qualisys, Goteborg, Sweden). Ground reaction forces were collected at 3000Hz (9260AA, Kistler USA, Hudson, NY).
2.3. One Leg Hop Activity
All subjects performed a one leg hop for distance, a test commonly used to gauge patient function in ACLR rehabilitation protocols (Davies, et al., 2017). For this maneuver, the subject jumped off and landed on the ipsilateral leg. The goal of the test was to achieve a maximum jump distance while landing without taking a second step to regain balance. The average of three successful trials was recorded, and the distance required to jump for the data collection was reduced to 65% of the average trial distance to ensure subjects could land reproducibly and safely at the center of the force plate. At least three hop trials were collected bilaterally. For analysis, the hop landing was sub-divided into three distinct phases as described previously (Coats-Thomas, et al., 2013; Hanson, et al., 2008): 1) the preparatory phase (PREP), which spans from 50ms before ground contact to contact; 2) the loading phase (LOAD), which spans from ground contact to peak knee flexion; and 3) the injury risk phase (RISK), which is a sub-division of the LOAD phase and describes the first 40ms following ground contact when anterior tibial translation and corresponding ACL length can reach their peak (Torry, et al., 2011b). Fig 1 depicts the temporal relationship of these landing phases with respect to the magnitude of the ground reaction force.
Fig 1.
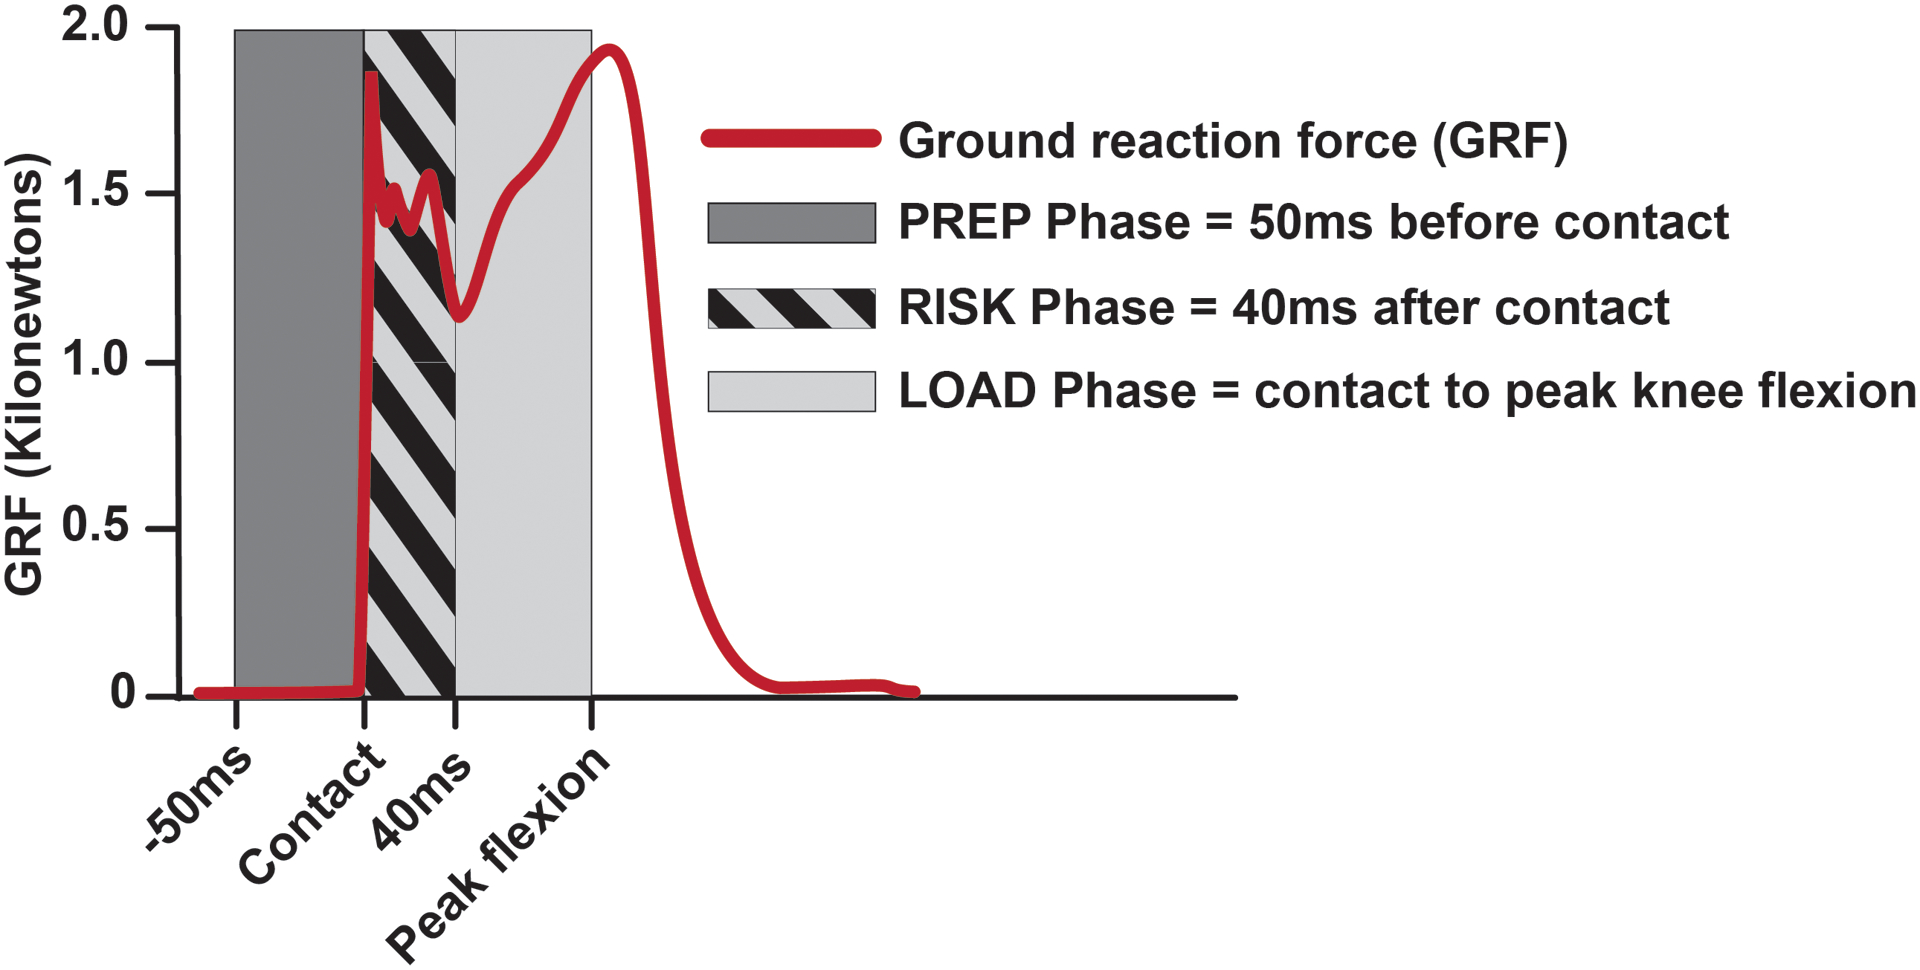
EMG recordings were analyzed across three landing phases, adapted from Hanson and colleagues (Hanson, et al., 2008).
2.4. Data Processing and Analysis
2.4.1. Raw EMG Signals
Post-processing was done using Visual3D (C-Motion, Germantown, MD). EMG signals were full wave rectified, bandpass filtered between 20 and 500 Hz, and smoothed using a root mean square spline over a 300 ms moving window (Coats-Thomas, et al., 2013). EMG amplitudes were normalized to account for variation in EMG signal amplitudes across muscles and subjects. Working with data from one muscle at a time for each subject, the portion of EMG waveform from each of the six trials that corresponded to 0.5 seconds before ground contact to 0.5 seconds after contact – the time period that encapsulated jump take-off and landing – was identified. The maximum EMG signal recorded was then extracted from the temporally aligned EMG waveforms and used to normalize the signal amplitude across trials. This was repeated for each of the seven muscles studied for each subject.
2.4.2. Co-contraction Indices
For each of the three landing phases analyzed, normalized EMG signals were integrated for each muscle to attain the area under the curve (Coats-Thomas, et al., 2013; Lustosa, et al., 2011). Normalized values of the RF and VMO were summed (RF + VMO) to represent the quadriceps muscle group. Similarly, ST and BF were summed (ST + BF) to represent the hamstrings, and MG and LG were summed (MG + LG) to represent the gastrocnemius muscle groups. Co-contraction indices were expressed as ratios of these integrated and summed values for quadriceps:hamstrings (Q:H, Equation 1) and gastrocnemius:tibialis anterior (G:TA, Equation 2) muscle agonist/antagonist pairs:
| (1) |
| (2) |
From Equation, 1 Q:H=1 indicates perfect co-contraction of quadriceps and hamstring muscle groups, whereas Q:H indices >1 indicates greater quadriceps activation (or less hamstring activation) and Q:H<1 less quadriceps activation (or greater hamstring activation). In the case of the G:TA co-contraction index, a G:TA=2 is perfect co-contraction of the gastrocnemii and tibialis anterior muscles; G:TA>2 indicates greater gastrocnemii activation and G:TA<2 is the converse.
2.4.3. Muscle Onset
Muscle onset times were extracted by determining the inflection point of the EMG signal amplitude between takeoff and ground contact (Fig 2). This inflection in EMG signal amplitude was universal across all subjects and muscle groups, and therefore represented the transition between muscle activity associated with take-off versus landing phases of the one leg hop.
Fig 2.
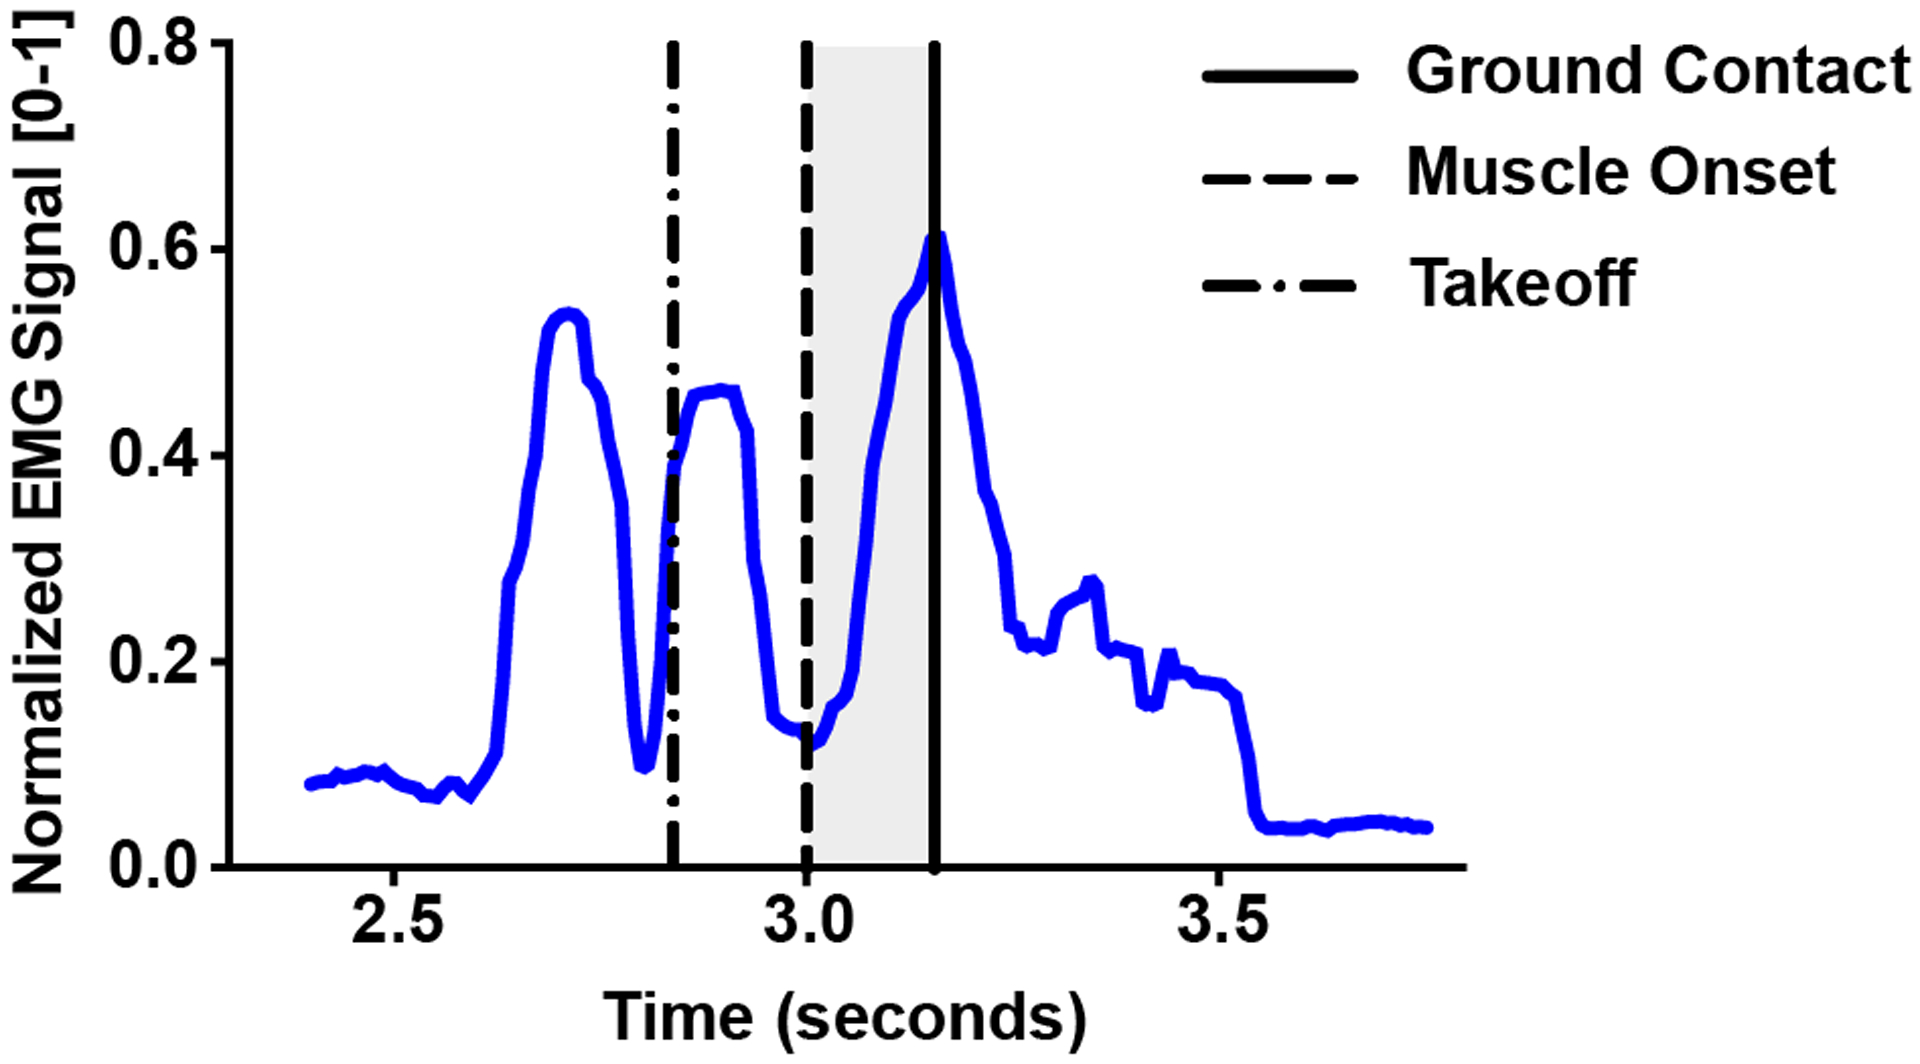
A typical trace of a normalized EMG signal during a hop landing. Muscle onset (solid dashed line) was determined as the inflection point of the EMG amplitude between takeoff (broken dashed line) and ground contact (solid line). The shaded region denotes the time differential between muscle onset and ground contact.
2.4.4. Peak Knee Flexion
Optical motion capture data were low-pass filtered using a 4th-order recursive Butterworth filter with a cutoff off 25 Hz and smoothed using a cubic spline (Coats-Thomas, et al., 2013; Miranda, et al., 2013). Segment anatomical coordinate systems were defined from markers placed over anatomical landmarks at the time of data collection, and knee kinematics were expressed in the joint coordinate system described by Grood and Suntay (Grood and Suntay, 1983). The time at which peak knee flexion occurred during the hop landing was used to define the end of the LOAD phase.
2.4.5. Ground Contact
A 4th-order Butterworth filter with 100Hz cut-off frequency was applied to the ground reaction force (GRF) data. Ground contact was considered to have occurred when the magnitude of the GRF exceeded 50N. The timing of peak GRF was extracted and used to determine the elapsed time between contact and peak GRF.
2.5. Statistical Analysis
Subject demographic characteristics and hop distances expressed as percent of contralateral limb distance were compared between ACLR and control groups using two-sample t-tests. An exact Mann-Whitney test was used to test for between group differences in arthrometer laxity measures. Mixed model repeated measures analyses were used to examine the effects of group (ACLR vs. control), limb (reconstructed vs. contralateral) and their interaction on EMG outcome measures. Simple effects (i.e., group within limb) were evaluated based on partial F-tests. Analyses were performed using SAS Statistical Software Version 9.4 (SAS Institute, Cary, NC). Statistical significance was evaluated based on p<0.05.
3. Results
3.1. Subject Demographics & Clinical Knee Function
There were no significant differences between ACLR and control subjects’ mean age or body mass index (BMI). ACLR IKDC examination scores ranged from A (normal) to B (nearly normal). All but one control subjects’ IKDC scores were A’s (one B), confirming clinically normal knees. Table 2 shows that the distribution in IKDC scores align closely with those previously reported in the larger parent study at 7-year follow-up (Akelman, et al., 2016), where a chi-square test confirmed that the distribution in ACLR IKDC scores (n=61) was significantly different from controls (n=32).
Table 2.
Comparison of cohort IKDC scores to parent study IKDC at 7-year follow-upa
| Sub-Study at 10–15yr Follow-Up | Parent Study at 7yr Follow-Up | |||
|---|---|---|---|---|
| Score | ACLR | Control | ACLR | Control |
| A | 3 (33.3) | 8 (88.9) | 15 (24.6) | 24 (75) |
| B | 6 (66.7) | 1 (11.1) | 38 (62.3) | 8 (25) |
| C | 0 (0.0) | 0 (0.0) | 8 (13.1) | 0 (0.0) |
| D | 0 (0.0) | 0 (0.0) | 0 (0.0) | 0 (0.0) |
Values are expressed as n (%)
Knee laxity was not different between ACLR and control subjects (p=0.750; Fig 3).
Fig 3.
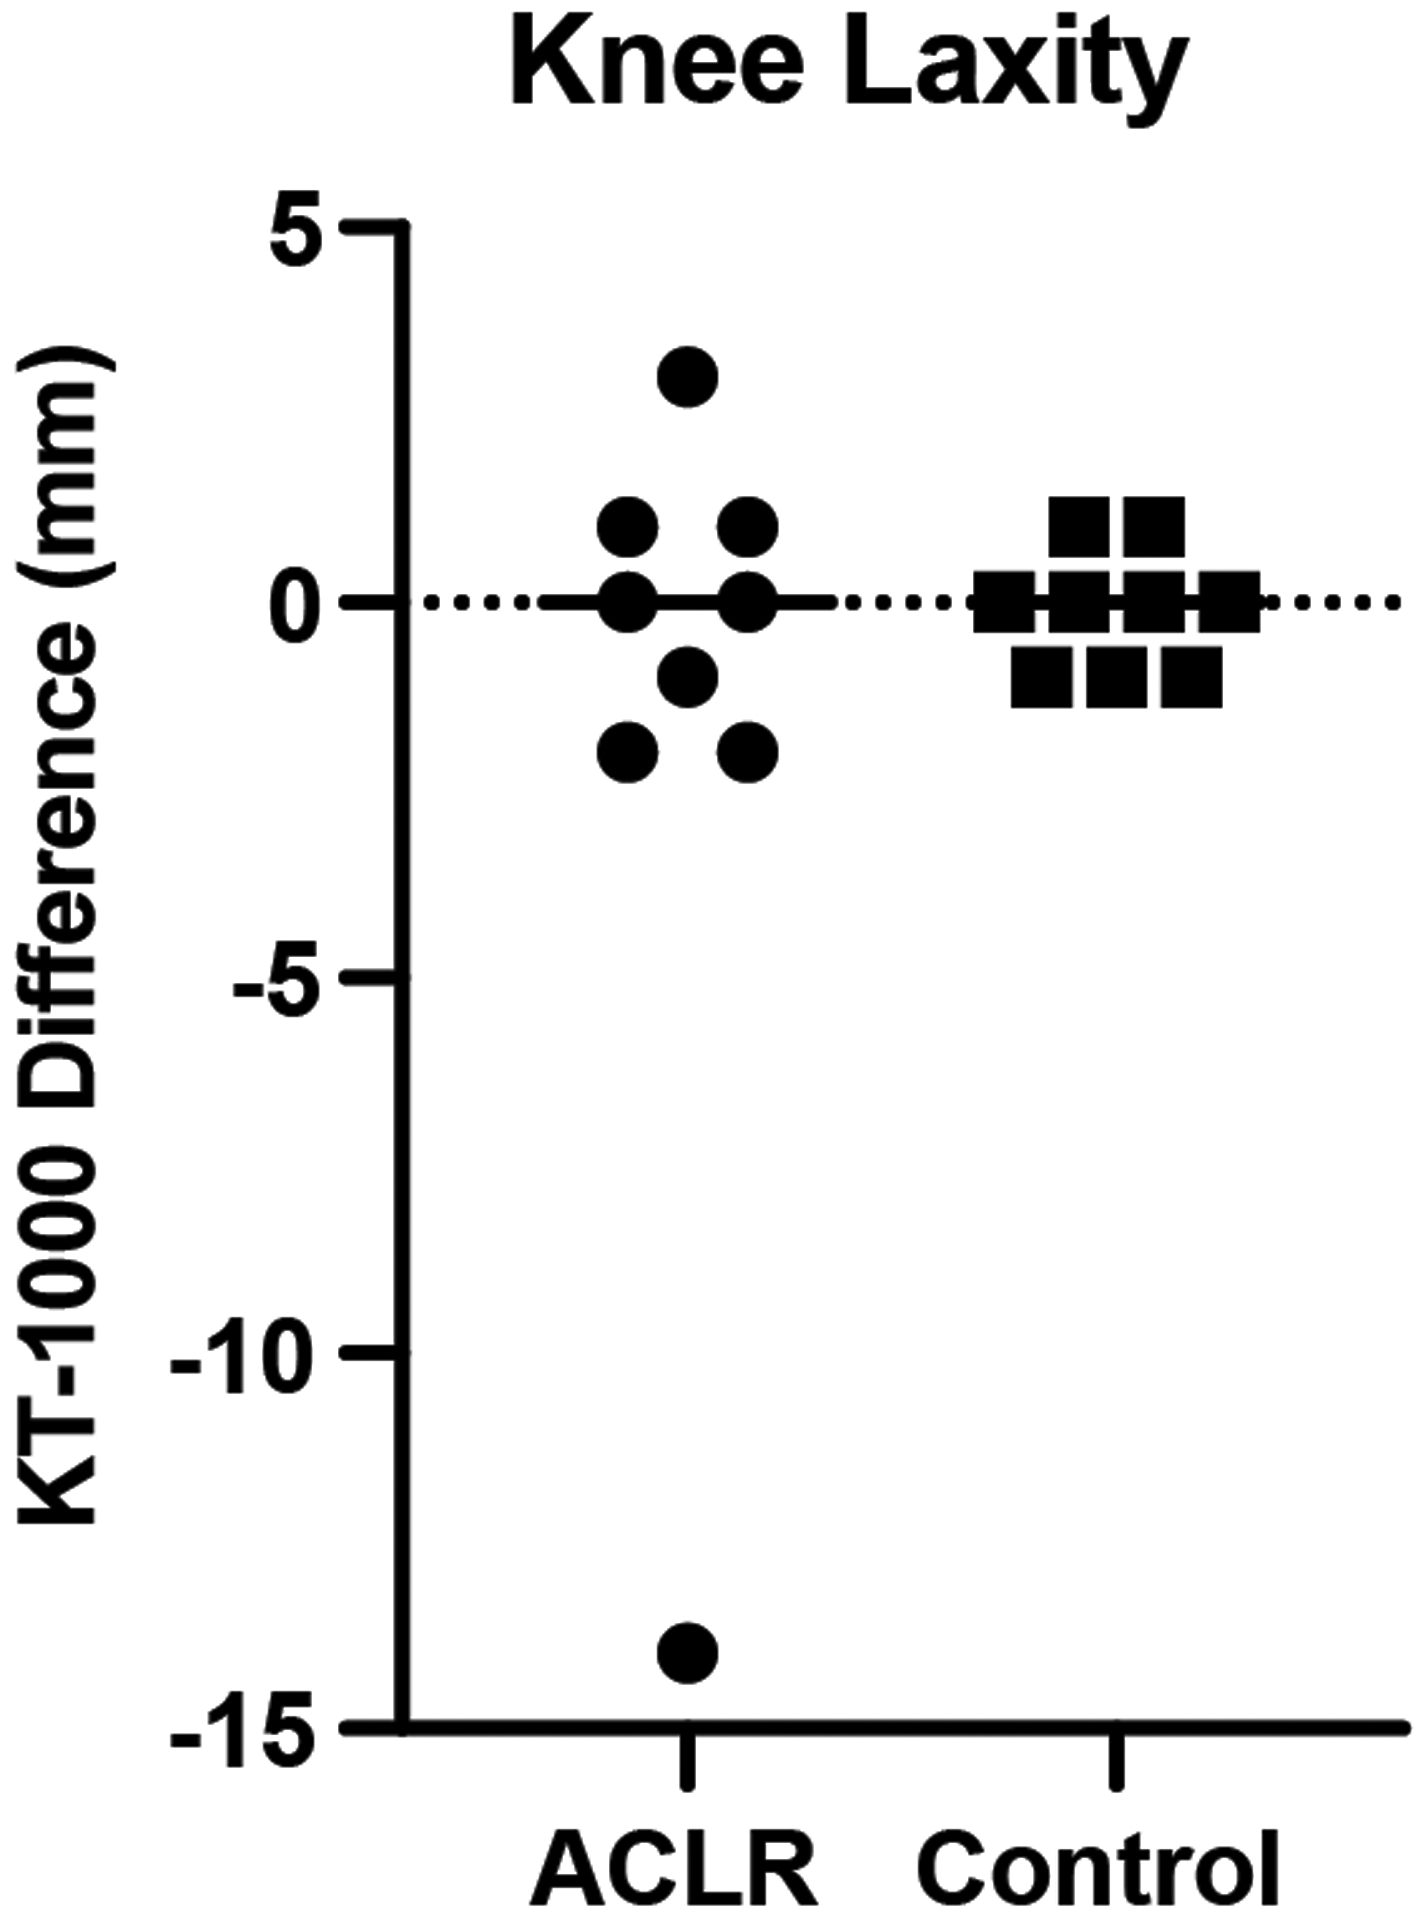
Arthrometer measures expressed as the millimeter difference between the index and contralateral limb displacements with positive values indicating greater index limb laxity. Data for ACLR subjects are represented by circular symbols; data for control subjects are represented by squares. The group means are shown by the horizontal bars.
The reconstructed limb hop distance (93.7% ± 9%) was slightly shorter than that of controls’ (100.6% ± 6%) but did not reach statistical significance (p=0.08; Fig 4).
Fig 4.
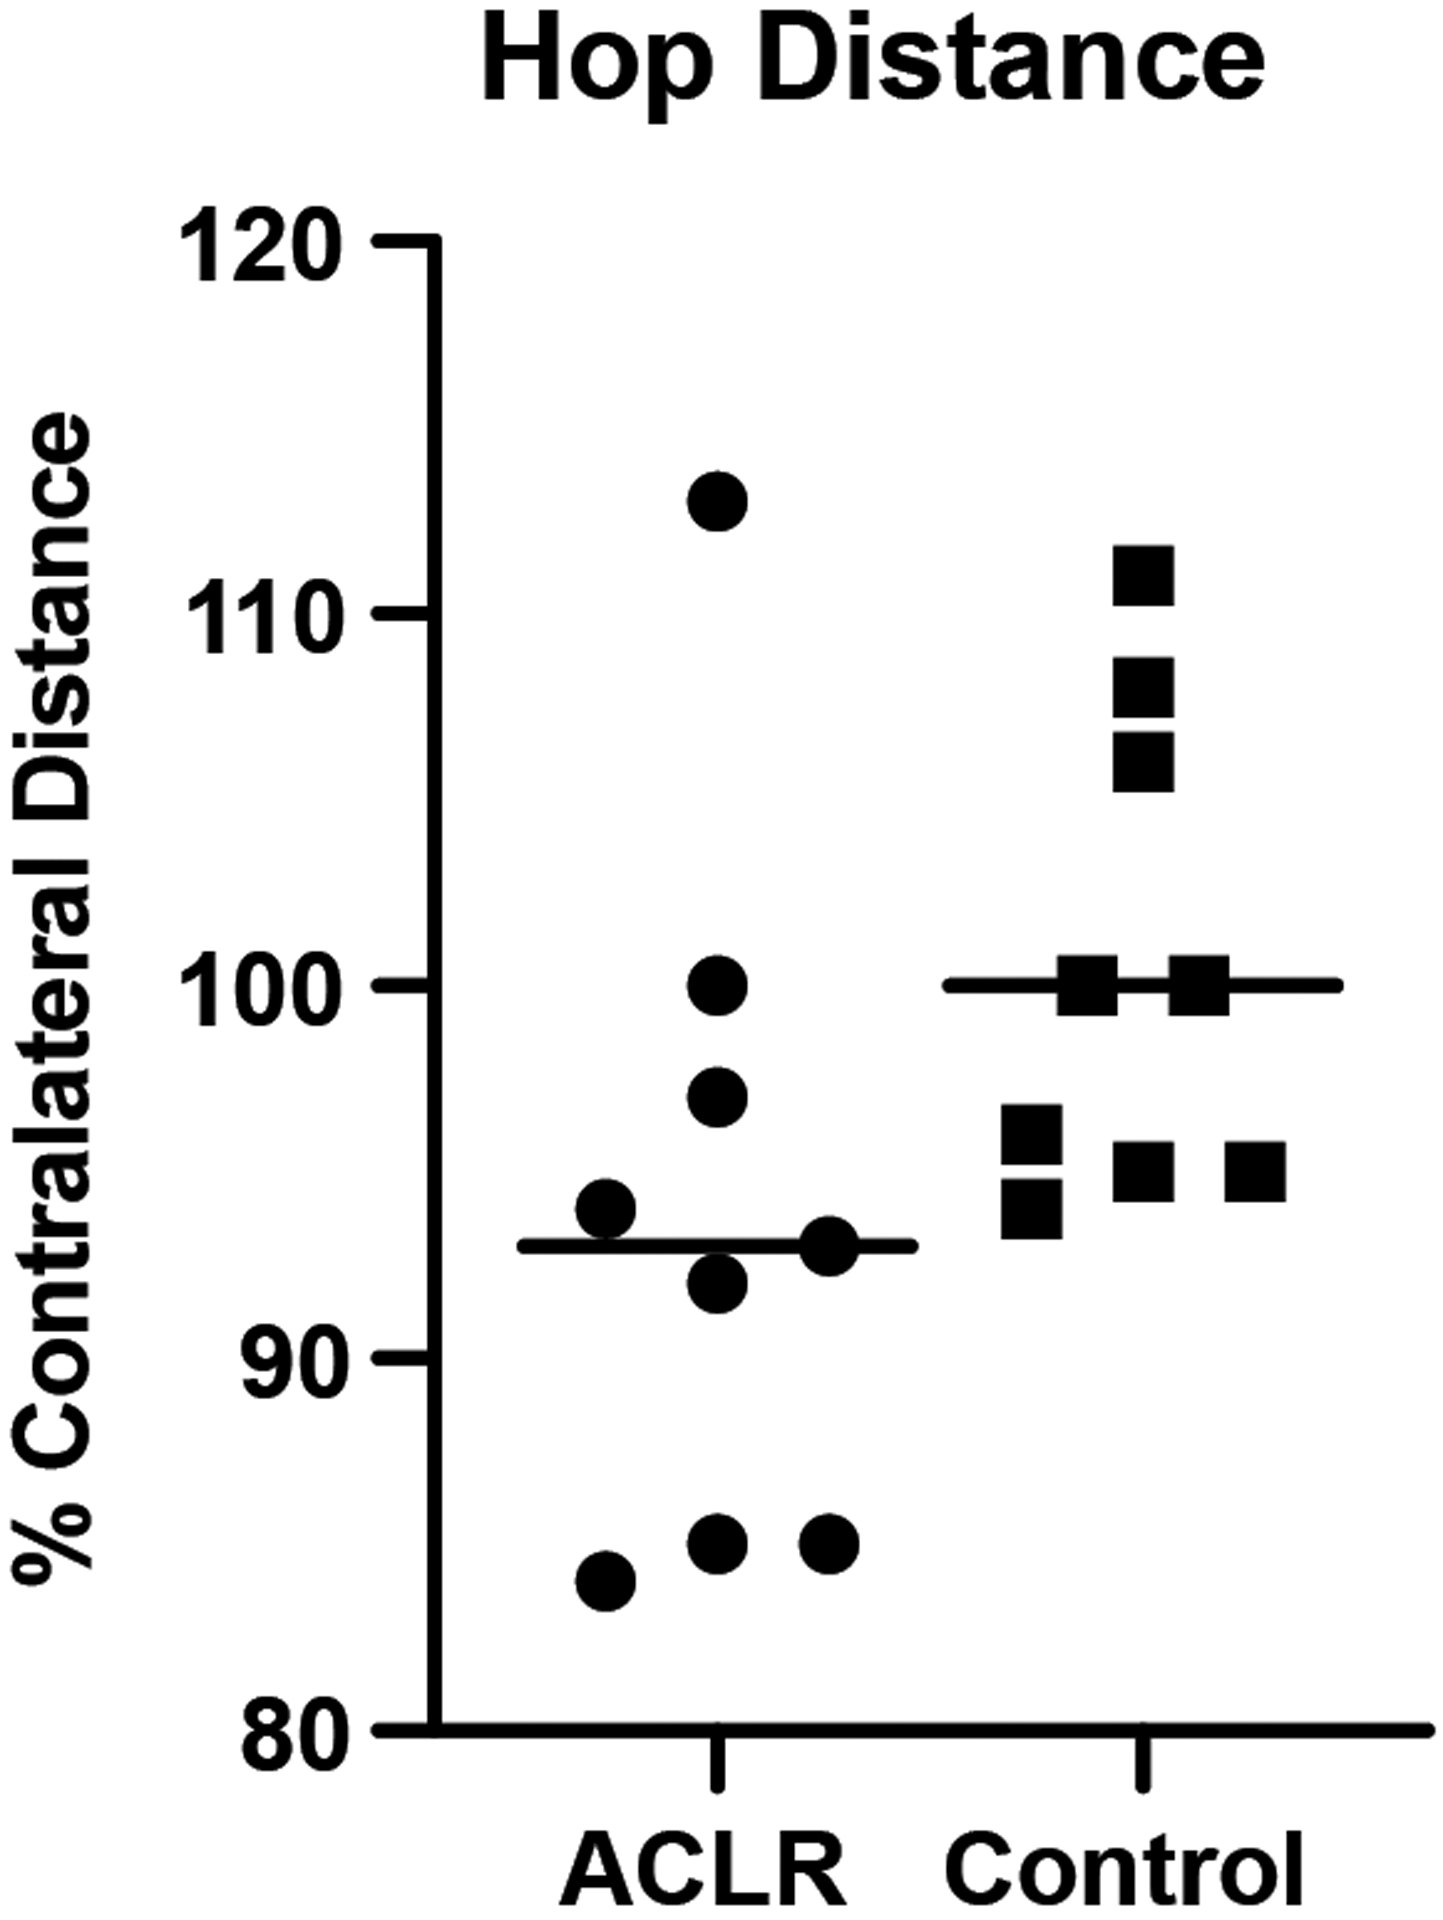
One leg hop distance expressed as the percent of contralateral limb values. Data for ACLR subjects are represented by circular symbols; data for control subjects are represented by squares. The group means are shown by the horizontal bars.
3.2. Co-contraction Indices
No significant group or limb main effects or interactions were detected in Q:H or G:TA co-contraction indices, although the Q:H index was approximately 26% lower bilaterally in ACLR subjects during the risk phase of landing, indicating greater co-contraction with Q:H indices being closer to 1: ACLR=1.6±0.9 vs. Control=2.1±1.1; p = 0.22 (Fig 5.C). Additional analyses revealed that this trend was driven largely by greater hamstring activation as measured by the area under the curve (AUC) in ACLR subjects compared to controls (ACLR=30.4±14.0 [μV]•ms vs. Control=20.3±6.7 [μV]•ms, Fig 4; group effect; p=0.046).
Fig 5.
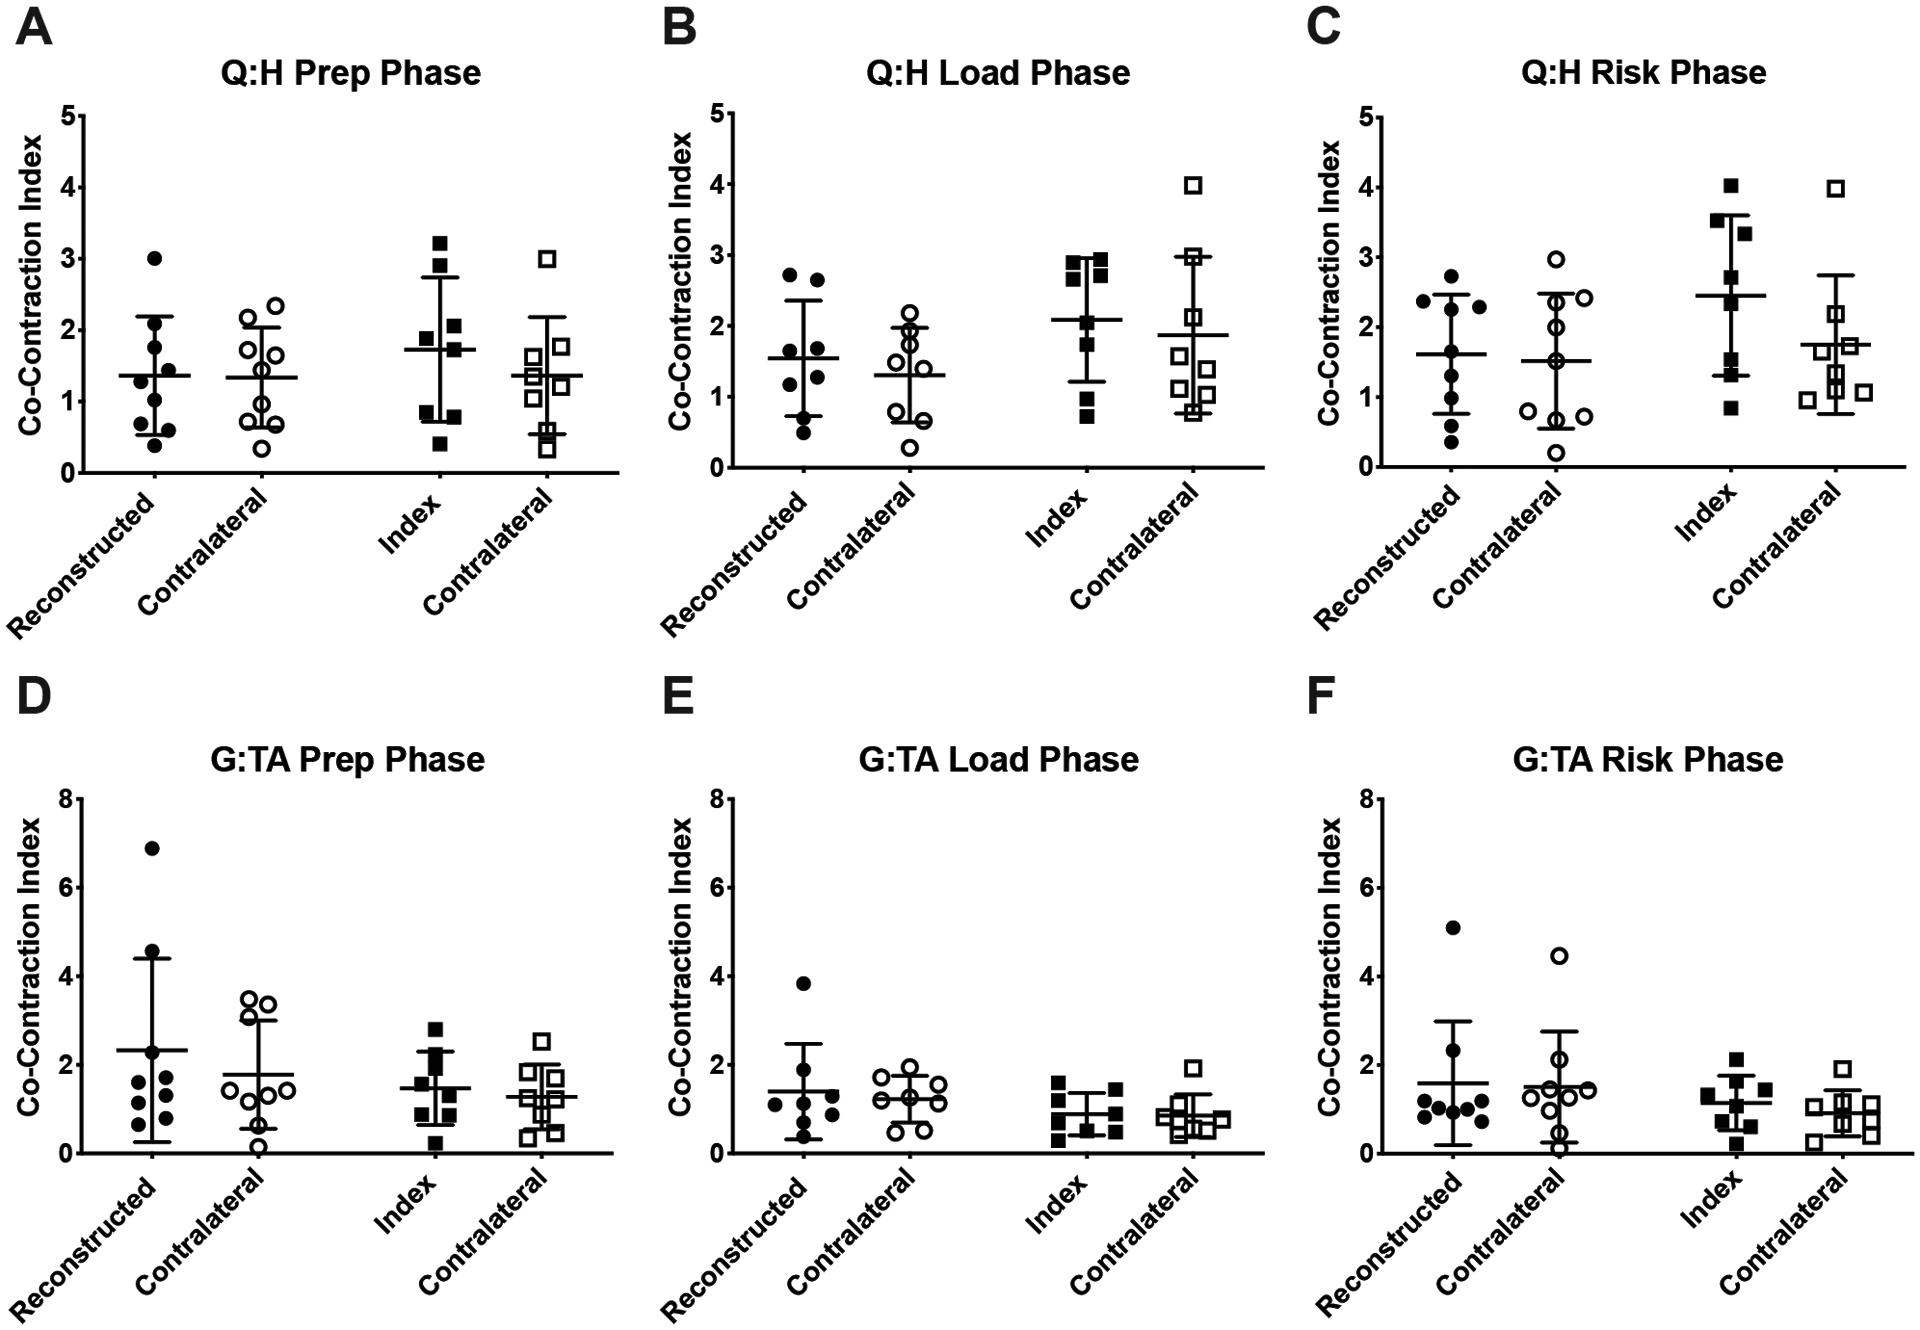
Co-contraction indices of the quadriceps:hamstrings (Q:H), and gastrocnemius:tibialis anterior (G:TA) muscle groups. Data for ACLR subjects are represented by circular symbols; data for control subjects are represented by squares. The group means are shown by the horizontal bars, and the error bars are ± 1 SD.
3.3. Time to Peak Ground Reaction Force
There were no significant group or limb main effects or interaction for time from ground contact to peak ground reaction force (Fig 6). The variability in ACLR surgical limb values (SD=52.1ms) was 4 times greater than contralateral limb (SD=12.03ms) and pooled controls (SD=11.95ms).
Fig 6.
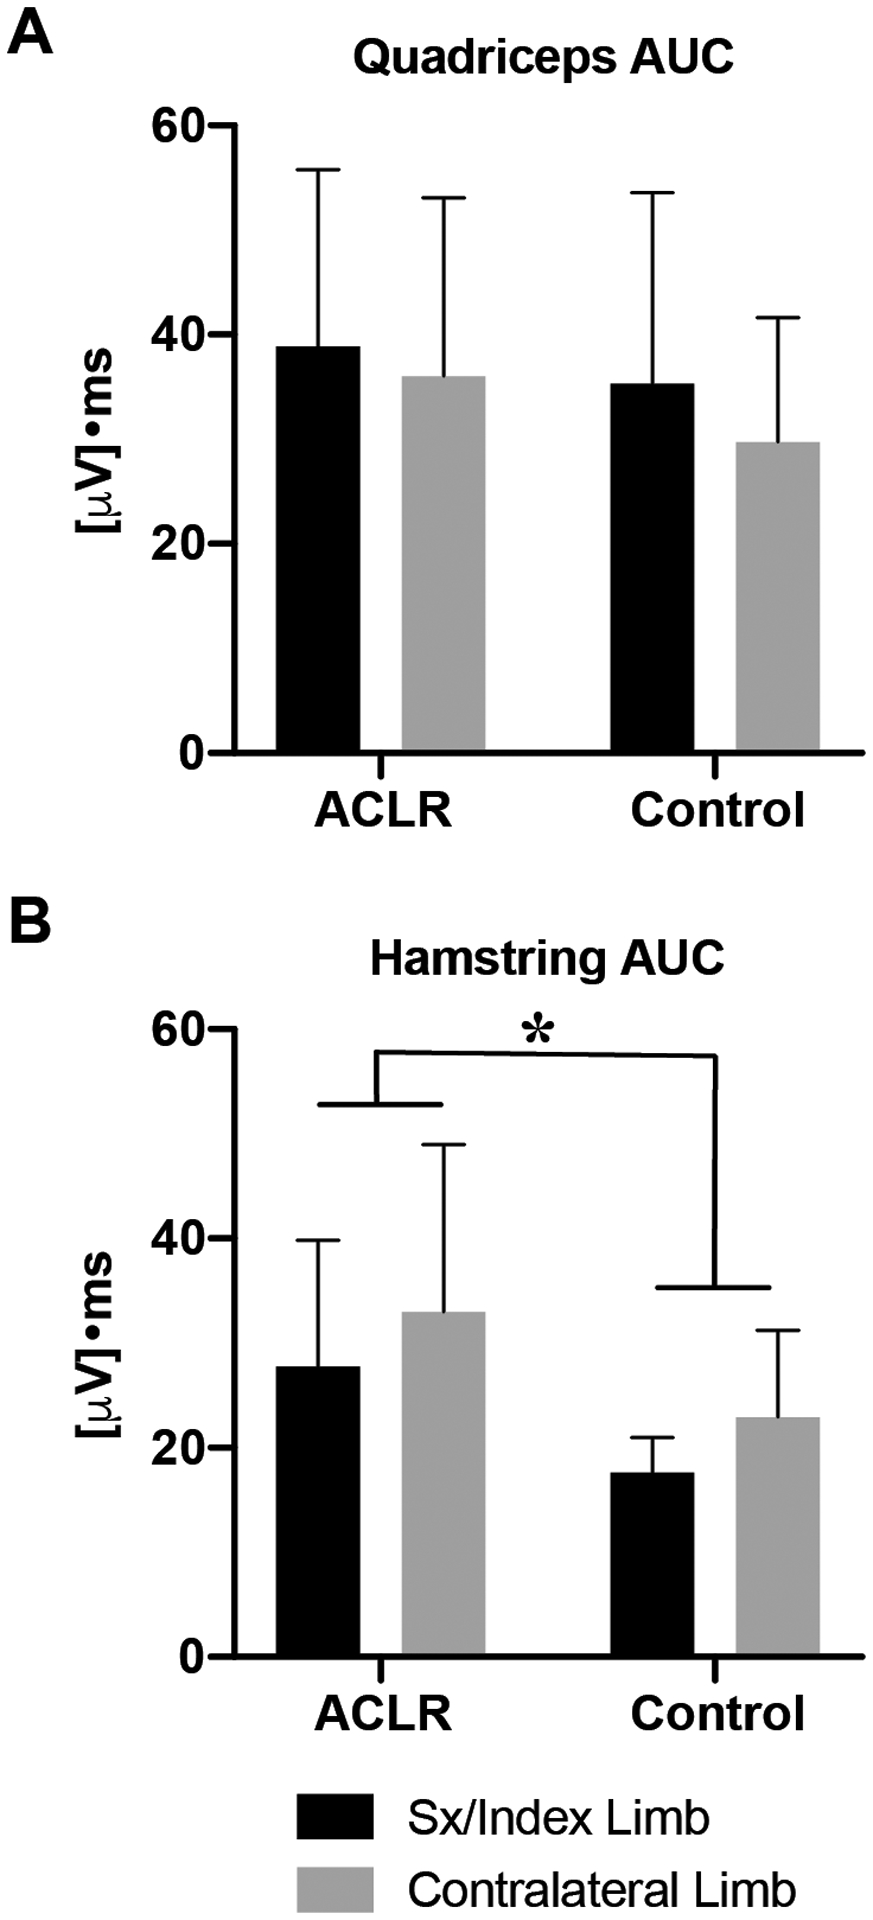
Area under the curve (AUC) for normalized EMG signals of the quadriceps (A) and hamstrings (B) muscle groups during the RISK phase of the hop landing. Error bars are ± 1 SD. ‘*’ indicates a significant difference between ACLR and Control group means (p<0.05).
3.4. Muscle Onset
The time of biceps femoris onset prior to contact was significantly shorter in ACLR subjects by an average of 52ms (ACLR=142.2±67.0ms; Control=194.1±51.8ms [group main effect, p= 0.036]), which was more pronounced in contralateral limbs (p=0.013; Fig 7.C). Although not significant, a similar trend was observed in semitendinosis muscle onset (P=0.09; Fig 7.D). No significant main effects or interactions were detected in any additional muscle onset times.
Fig 7.
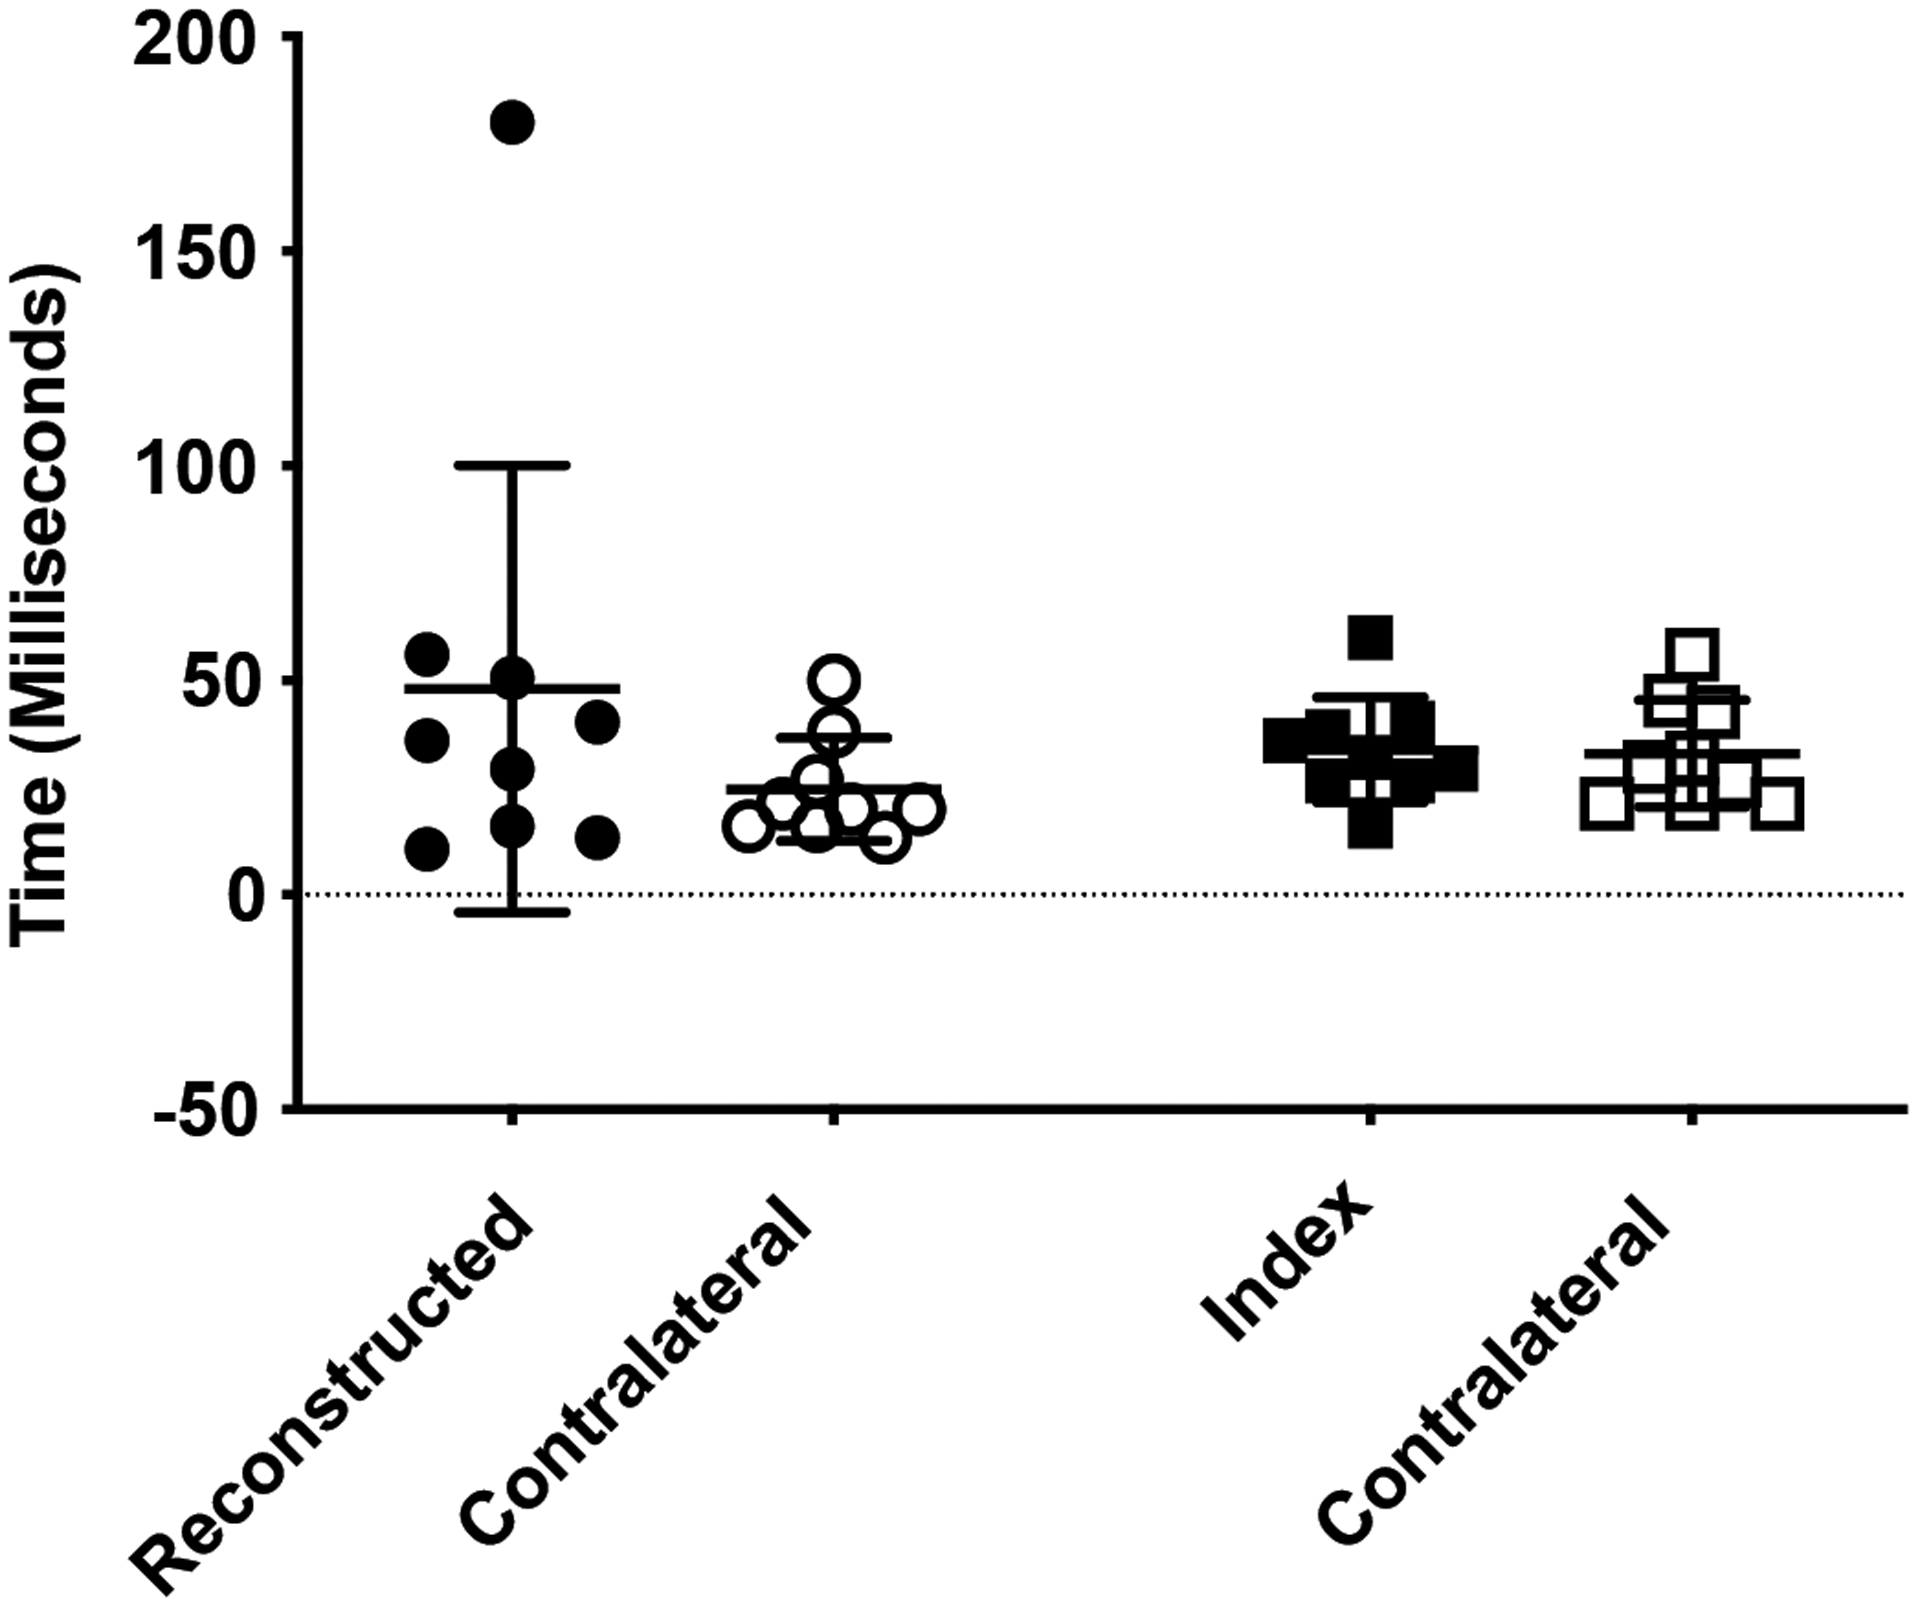
Time from ground contact to peak ground reaction force. Data for ACLR subjects are represented by circular symbols; data for control subjects are represented by squares. The group means are shown by the horizontal bars. Error bars are ± 1 SD.
4. Discussion
To the best of our knowledge, this is the first study to examine neuromuscular function in ACLR subjects at such a long post-operative follow-up interval and to compare function both bilaterally and to uninjured controls. The major findings were that there were no statistically significant differences in the lower limb electromyography measures between ACL-reconstructed and matched control subjects, and that these measures were bilaterally symmetrical in both groups. These observations are in contrast to our hypotheses where we believed that ACLR subjects would exhibit greater co-contraction, a shorter duration from contact to peak ground reaction force, and earlier muscle activation in preparation for a one-leg hop landing. Nevertheless, subtle trends were apparent and deeper ad-hoc analyses of these trends revealed that ACLR subjects delayed biceps femoris activation bilaterally prior to ground contact, and then exhibited greater hamstring contraction during the RISK phase of landing.
Although the mean time to peak GRF was not statistically different within subjects or groups as shown in Fig 7, the standard deviation of this measure within ACLR subjects was dramatically greater (435%) than either the contralateral limb or control subjects. Excluding the data point from the single ACLR subject with a particularly long time of 180ms to peak GRF, mean ACLR limb variation remained ~145% greater than contralateral limb or pooled control values. The significance of this variation in loading rate is unknown at present, but similar increases in ground reaction force variability during a balancing task was noted in subjects following a tibial nerve block procedure (Fiolkowski, et al., 2005). Collectively, these results could suggest that the loss of proprioceptive feedback to the central nervous system affects postural stability. Whether our results reflect a similar mechanism that follows from the loss of proprioceptive information normally provided by mechanoreceptors and free nerve endings within the intact ACL remains to be seen, but this line of questioning warrants further investigation.
Within ACLR subjects specifically, we expected to observe greater co-contraction in the ACL-reconstructed limb, but co-contraction indices were symmetrical bilaterally. Although not statistically significant, the Q:H co-contraction index during the risk phase was lower in ACLR subjects compared to controls (Fig 5.C.) and is indicative of greater co-contraction. Ad-hoc analyses revealed that this observation could be explained by greater hamstring activation, as shown in Fig 6. Given that the hamstrings are antagonists to anterior tibial translation – a degree of freedom particularly sensitive to ACL deficiency (Amis and Dawkins, 1991; Defrate, et al., 2006; Gabriel, et al., 2004) – greater contraction likely serves as a neuromuscular compensatory mechanism to offset ACL graft dysfunction. It is particularly intriguing that the difference in hamstring activation was observed only during the RISK phase of landing, in which ACL injury is most likely to occur (Torry, et al., 2011a).
Also of note was that the time interval between hamstring activation and ground contact in ACLR subjects was shorter compared to control subjects and that this phenomenon was present bilaterally (Fig 8.C.). Based on the alignment of tibiofemoral bone bruising visible in pre-surgical magnetic resonance images of ACL-injured patients, the tibia is significantly anteriorly translated at the presumptive time of ligament failure (Owusu-Akyaw, et al., 2018). Thus, if the hamstring activation is ill-timed insofar as being even further delayed during a high-demand activity such as a jump landing or cutting maneuver, hamstring function could fail to adequately constrain anterior tibial translation and result in ACL tear or graft rupture. Because of the symmetry in this delayed hamstring onset in our ACLR subjects, it may be plausible that it is inherent to this population; that is, the latent onset was present prior to ACL injury. Although we do not have the data to test this hypothesis directly, recent work by Capin and colleagues would seem to support this speculation whereby ACLR subjects who achieved symmetry sooner and returned to sport were at greater risk of reinjury or contralateral injury (Capin, et al., 2017). Moreover, interlimb symmetry increased with post-operative time regardless of rehabilitation strategy (Capin, et al., 2019). Thus, the contribution of functional limb symmetry to long-term joint health – and whether it reflects “normal” neuromuscular function – remains controversial. While pre-injury data would be necessary to investigate the role of temporal hamstring activation in the setting of ACL injury risk, the symmetry in neuromuscular function but differences in temporal activation between injured and non-injured cohorts nevertheless speaks to the importance of including a matched control group in future prospective longitudinal studies.
Fig 8.
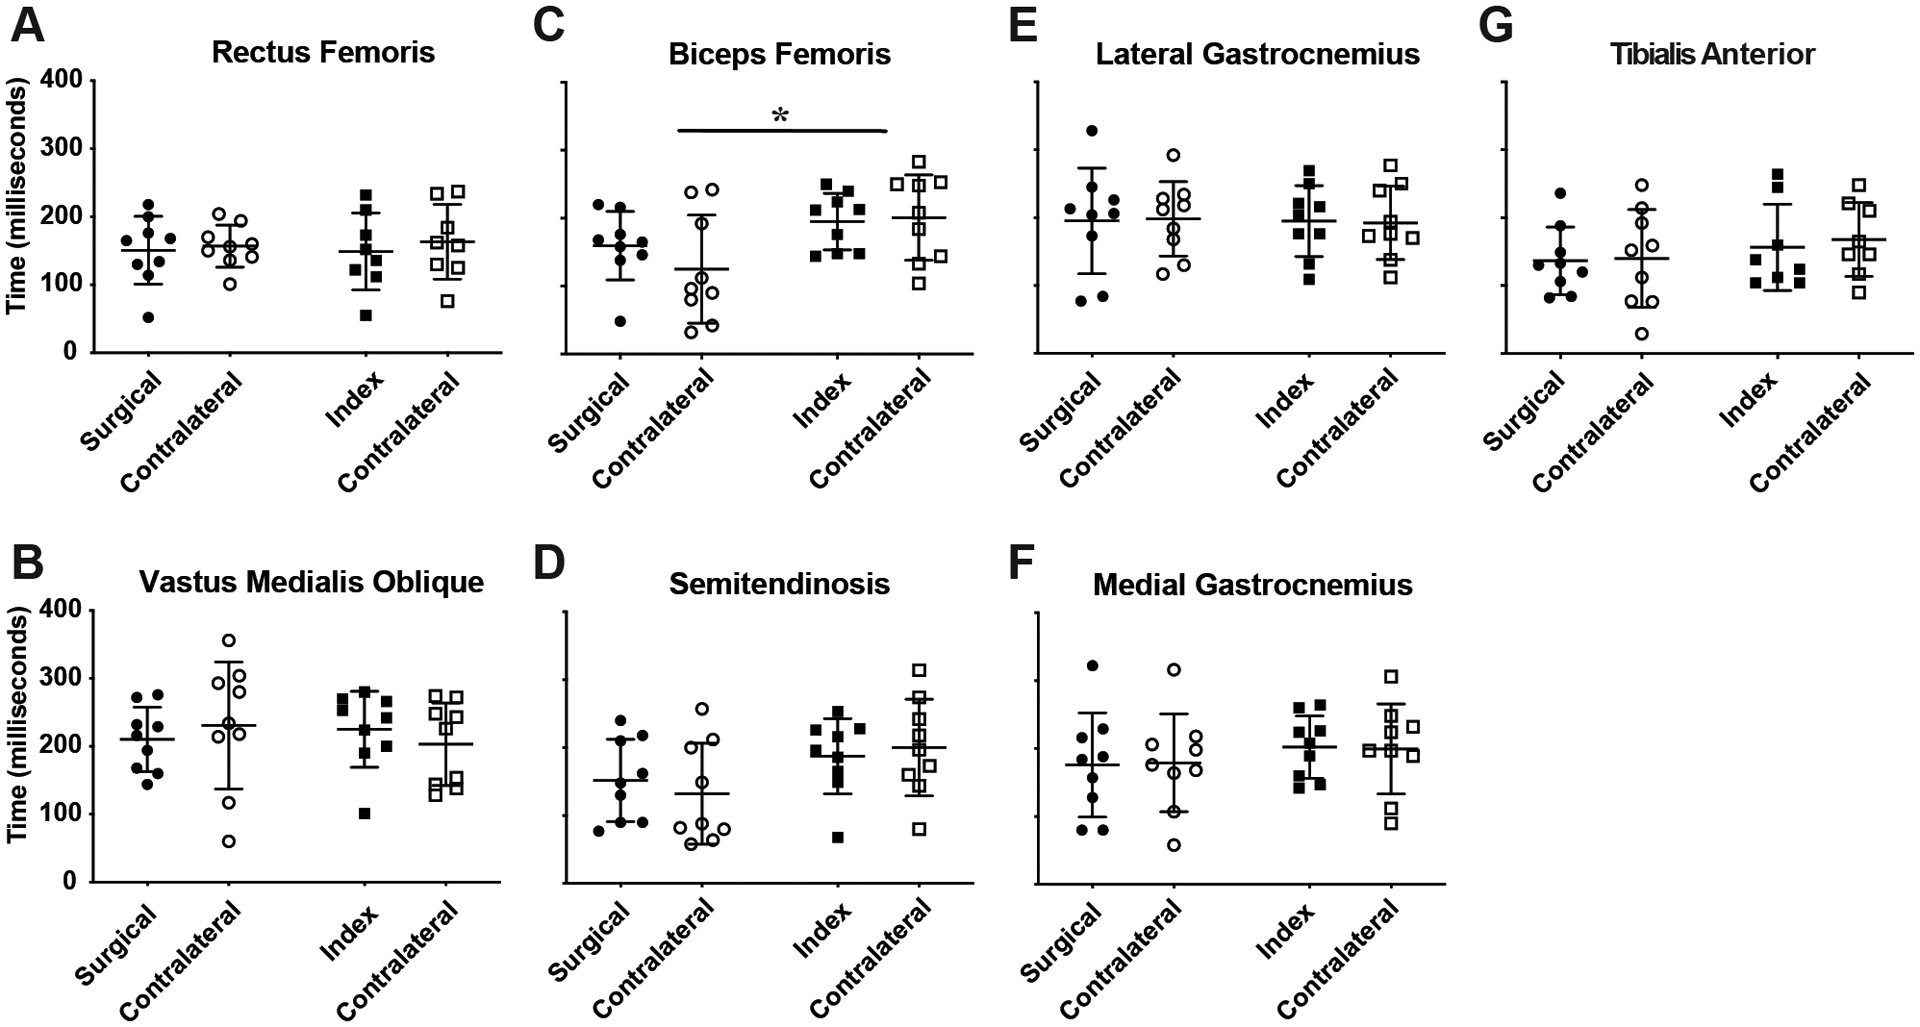
Time of muscle onset prior to ground contact. Data for ACLR subjects are represented by circular symbols; data for control subjects are represented by squares. A & B show data of the quadriceps muscle groups; C & D show hamstring muscle data; E & F are gastrocnemius muscle groups; and G is the tibialis anterior data. Y-axes values are the same for all subpanels (0–400ms), as shown in A & B on the far left. Significant differences are denoted by “*” in C. The group means are shown by the horizontal bars, and the error bars are ± 1 SD.
From a clinical standpoint, reconstructed knees were scored as “normal” in only 33% of ACLR subjects whereas they were “normal” in 89% of controls. These IKDC results are in line with the 7-year follow-up of the larger parent clinical trial from which the cohort of subjects was recruited (Akelman, et al., 2016). Although the distances hopped by ACLR and control subjects were within 7% of each other and not statistically different, this magnitude of difference was similar to that previously reported at 7-year follow-up in the parent study where the difference reached significance with a larger sample size. Therefore, we find it plausible that a functional difference in hop distance likely exists between these subject groups and find it surprising that the EMG measures between ACLR and control subjects were largely similar save for the few, subtle, neuromuscular differences in hamstring function just discussed above. This finding could suggest that other factors related more directly to the injury and/or surgery and early rehabilitative period could have more significant roles in establishing the long-term (>10 years) clinical trajectory of this patient population.
We note several limitations of our study: (1) surface electrodes were used to record EMG signals, whereas intra-muscular needle electrodes would have been a more accurate (but invasive) approach; (2) we did not include full body kinematic and kinetic measures in our analyses which would have enabled direct measures of limb (Farley and Gonzalez, 1996) and joint stiffness (Renner, et al., 2018), and could have revealed whether delayed biceps femoris activation modulates frontal plane knee kinematics; (3) whereas we focused on the knee because of its relevance to post-traumatic OA risk following ACL injury and reconstruction specifically, inclusion of hip and ankle measures may reveal additional compensatory mechanisms present at long-term follow-up; (4) there is a possibility of selection bias, whereby only “high-functioning” ACLR subjects chose to participate because of the demanding nature of the hop activity – the lack of differences in static knee laxity between this group of ACLR and control subjects would seem to support this notion – thereby limiting the scope of inference of the results; and (5) because we chose to recruit subjects from the parent prospective randomized controlled trial in order to ultimately investigate the degenerative changes within the joint at a time they are likely to be present, our available sample size was limited.
5. Conclusion
At a post-operative interval of between 10 and 15 years after ACLR, lower limb electromyography measures during a 1-leg hop landing are largely similar between ACLR and matched control subjects. This similarity in neuromuscular function between groups is in contrast to the clinical findings, bringing in to question the significance of neuromuscular function at this long-term follow-up. Nevertheless, subtle differences were detected in biceps femoris activation that could be related to both ACL injury risk and compensatory strategies associated with dynamic graft function. Interpretation of these results alongside measures of cartilage health, patient-reported outcomes and biomechanical analyses that follow from the prospective longitudinal parent study (NCT00434837) may yield further insight into PTOA risk.
Acknowledgements
We gratefully acknowledge support from the National Institutes of Health [NIAMS K99/R00-AR069004, R01-AR047910, and R01-AR074973, and NIGMS P30-GM122732 (Bioengineering Core of the COBRE Centre for Skeletal Health and Repair)], the Lucy Lippitt Endowment, and the RIH Orthopaedic Foundation. We especially thank Cynthia Chrostek and Orianna Duncan for assistance with subject recruitment, Stacy Faiola, PT, for performing the clinical assessments, and Erika Tavares for her guidance with data collection at the Keck Foundation XROMM Laboratory.
Footnotes
Conflict of Interest
Dr. Fleming receives royalties from Springer Publishing and a stipend from Sage Publishing for his work as an associate editor for a medical journal and is a founder of Miach Orthopaedics. All other authors do not have any conflicts of interest to that may have influenced the results of this study. Results of the present study are presented clearly, honestly, and without fabrication, falsification, or inappropriate data manipulation.
References
- Akelman MR, Fadale PD, Hulstyn MJ, Shalvoy RM, Garcia A, Chin KE, Duryea J, Badger GJ, Tung GA and Fleming BC, 2016. Effect of Matching or Overconstraining Knee Laxity During Anterior Cruciate Ligament Reconstruction on Knee Osteoarthritis and Clinical Outcomes: A Randomized Controlled Trial With 84-Month Follow-up. Am J Sports Med 44, 1660–1670. [DOI] [PMC free article] [PubMed] [Google Scholar]
- Amis AA and Dawkins GP, 1991. Functional anatomy of the anterior cruciate ligament. Fibre bundle actions related to ligament replacements and injuries. J Bone Joint Surg Br 73, 260–267. [DOI] [PubMed] [Google Scholar]
- Barrance PJ, Williams GN, Snyder-Mackler L and Buchanan TS, 2006. Do ACL-injured copers exhibit differences in knee kinematics? Clinical Orthopaedics and Related Research 454, 74–80. [DOI] [PubMed] [Google Scholar]
- Brainerd EL, Baier DB, Gatesy SM, Hedrick TL, Metzger KA, Gilbert SL and Crisco JJ, 2010. X-ray reconstruction of moving morphology (XROMM): precision, accuracy and applications in comparative biomechanics research. J Exp Zool A Ecol Genet Physiol 313, 262–279. [DOI] [PubMed] [Google Scholar]
- Capin JJ, Khandha A, Zarzycki R, Manal K, Buchanan TS and Snyder-Mackler L, 2017. Gait mechanics and second ACL rupture: Implications for delaying return-to-sport. J Orthop Res 35, 1894–1901. [DOI] [PMC free article] [PubMed] [Google Scholar]
- Capin JJ, Zarzycki R, Ito N, Khandha A, Dix C, Manal K, Buchanan TS and Snyder-Mackler L, 2019. Gait Mechanics in Women of the ACL-SPORTS Randomized Control Trial: Interlimb Symmetry Improves Over Time Regardless of Treatment Group. J Orthop Res 37, 1743–1753. [DOI] [PMC free article] [PubMed] [Google Scholar]
- Chmielewski TL, Ramsey DK and Snyder-Mackler L, 2005a. Evidence for differential control of tibial position in perturbed unilateral stance after acute ACL rupture. J Orthop Res 23, 54–60. [DOI] [PubMed] [Google Scholar]
- Chmielewski TL, Hurd WJ, Rudolph KS, Axe MJ and Snyder-Mackler L, 2005b. Perturbation training improves knee kinematics and reduces muscle co-contraction after complete unilateral anterior cruciate ligament rupture. Phys Ther 85, 740–749. [PubMed] [Google Scholar]
- Coats-Thomas MS, Miranda DL, Badger GJ and Fleming BC, 2013. Effects of ACL reconstruction surgery on muscle activity of the lower limb during a jump-cut maneuver in males and females. J Orthop Res 31, 1890–1896. [DOI] [PMC free article] [PubMed] [Google Scholar]
- Davies GJ, McCarty E, Provencher M and Manske RC, 2017. ACL Return to Sport Guidelines and Criteria. Curr Rev Musculoskelet Med 10, 307–314. [DOI] [PMC free article] [PubMed] [Google Scholar]
- Defrate LE, Papannagari R, Gill TJ, Moses JM, Pathare NP and Li G, 2006. The 6 degrees of freedom kinematics of the knee after anterior cruciate ligament deficiency: an in vivo imaging analysis. Am J Sports Med 34, 1240–1246. [DOI] [PubMed] [Google Scholar]
- Deneweth JM, Bey MJ, McLean SG, Lock TR, Kolowich PA and Tashman S, 2010. Tibiofemoral joint kinematics of the anterior cruciate ligament-reconstructed knee during a single-legged hop landing. Am J Sports Med 38, 1820–1828. [DOI] [PubMed] [Google Scholar]
- Draganich LF and Vahey JW, 1990. An in vitro study of anterior cruciate ligament strain induced by quadriceps and hamstrings forces. J Orthop Res 8, 57–63. [DOI] [PubMed] [Google Scholar]
- Farley CT and Gonzalez O, 1996. Leg stiffness and stride frequency in human hunning. Journal of Biomechanics 29, 181–186. [DOI] [PubMed] [Google Scholar]
- Fiolkowski P, Bishop M, Brunt D and Williams B, 2005. Plantar feedback contributes to the regulation of leg stiffness. Clin Biomech (Bristol, Avon) 20, 952–958. [DOI] [PubMed] [Google Scholar]
- Fleming BC, Fadale PD, Hulstyn MJ, Shalvoy RM, Oksendahl HL, Badger GJ and Tung GA, 2013. The effect of initial graft tension after anterior cruciate ligament reconstruction: a randomized clinical trial with 36-month follow-up. Am J Sports Med 41, 25–34. [DOI] [PMC free article] [PubMed] [Google Scholar]
- Ford KR, van den Bogert J, Myer GD, Shapiro R and Hewett TE, 2008. The effects of age and skill level on knee musculature co-contraction during functional activities: a systematic review. Br J Sports Med 42, 561–566. [DOI] [PMC free article] [PubMed] [Google Scholar]
- Gabriel MT, Wong EK, Woo SL, Yagi M and Debski RE, 2004. Distribution of in situ forces in the anterior cruciate ligament in response to rotatory loads. J Orthop Res 22, 85–89. [DOI] [PubMed] [Google Scholar]
- Goerger BM, Marshall SW, Beutler AI, Blackburn JT, Wilckens JH and Padua DA, 2015. Anterior cruciate ligament injury alters preinjury lower extremity biomechanics in the injured and uninjured leg: the JUMP-ACL study. British Journal of Sports Medicine 49, 188–195. [DOI] [PubMed] [Google Scholar]
- Gokeler A, Hof AL, Arnold MP, Dijkstra PU, Postema K and Otten E, 2010. Abnormal landing strategies after ACL reconstruction. Scand J Med Sci Sports 20, e12–19. [DOI] [PubMed] [Google Scholar]
- Grood ES and Suntay WJ, 1983. A joint coordinate system for the clinical description of three-dimensional motions: application to the knee. J Biomech Eng 105, 136–144. [DOI] [PubMed] [Google Scholar]
- Group MK, Spindler KP, Huston LJ, Chagin KM, Kattan MW, Reinke EK, Amendola A, Andrish JT, Brophy RH, Cox CL, Dunn WR, Flanigan DC, Jones MH, Kaeding CC, Magnussen RA, Marx RG, Matava MJ, McCarty EC, Parker RD, Pedroza AD, Vidal AF, Wolcott ML, Wolf BR and Wright RW, 2018. Ten-Year Outcomes and Risk Factors After Anterior Cruciate Ligament Reconstruction: A MOON Longitudinal Prospective Cohort Study. Am J Sports Med 46, 815–825. [DOI] [PMC free article] [PubMed] [Google Scholar]
- Hanson AM, Padua DA, Troy Blackburn J, Prentice WE and Hirth CJ, 2008. Muscle activation during side-step cutting maneuvers in male and female soccer athletes. J Athl Train 43, 133–143. [DOI] [PMC free article] [PubMed] [Google Scholar]
- Hiemstra LA, Webber S, MacDonald PB and Kriellaars DJ, 2007. Contralateral limb strength deficits after anterior cruciate ligament reconstruction using a hamstring tendon graft. Clin Biomech (Bristol, Avon) 22, 543–550. [DOI] [PubMed] [Google Scholar]
- Hurd WJ and Snyder-Mackler L, 2007. Knee instability after acute ACL rupture affects movement patterns during the mid-stance phase of gait. J Orthop Res 25, 1369–1377. [DOI] [PMC free article] [PubMed] [Google Scholar]
- Irrgang JJ, Ho H, Harner CD and Fu FH, 1998. Use of the International Knee Documentation Committee guidelines to assess outcome following anterior cruciate ligament reconstruction. Knee Surg Sports Traumatol Arthrosc 6, 107–114. [DOI] [PubMed] [Google Scholar]
- Lanier AS, Knarr BA, Stergiou N, Snyder-Mackler L and Buchanan TS, 2020. ACL injury and reconstruction affect control of ground reaction forces produced during a novel task that simulates cutting movements. J Orthop Res [DOI] [PMC free article] [PubMed] [Google Scholar]
- Lustosa LP, Ocarino JM, de Andrade MA, Pertence AE, Bittencourt NF and Fonseca ST, 2011. Muscle co-contraction after anterior cruciate ligament reconstruction: Influence of functional level. J Electromyogr Kinesiol 21, 1050–1055. [DOI] [PubMed] [Google Scholar]
- Malcom LL, Daniel DM, Stone ML and Sachs R, 1985. The Measurement of Anterior Knee Laxity After ACL Reconstructive Surgery. Clinical Orthopaedics and Related Research 196, 35–41. [PubMed] [Google Scholar]
- Malfait B, Dingenen B, Smeets A, Staes F, Pataky T, Robinson MA, Vanrenterghem J and Verschueren S, 2016. Knee and Hip Joint Kinematics Predict Quadriceps and Hamstrings Neuromuscular Activation Patterns in Drop Jump Landings. PLoS One 11, e0153737. [DOI] [PMC free article] [PubMed] [Google Scholar]
- Miranda DL, Rainbow MJ, Crisco JJ and Fleming BC, 2013. Kinematic differences between optical motion capture and biplanar videoradiography during a jump-cut maneuver. J Biomech. 46, 567–573. [DOI] [PMC free article] [PubMed] [Google Scholar]
- Nawasreh ZH, Marmon AR, Logerstedt D and Snyder-Mackler L, 2019. The Effect of Training on a Compliant Surface on Muscle Activation and Co-Contraction after Anterior Cruciate Ligament Injury. Int J Sports Phys Ther 14, 3554–3563. [PMC free article] [PubMed] [Google Scholar]
- Neuman P, Englund M, Kostogiannis I, Friden T, Roos H and Dahlberg LE, 2008. Prevalence of tibiofemoral osteoarthritis 15 years after nonoperative treatment of anterior cruciate ligament injury: a prospective cohort study. Am J Sports Med 36, 1717–1725. [DOI] [PubMed] [Google Scholar]
- Owusu-Akyaw KA, Kim SY, Spritzer CE, Collins AT, Englander ZA, Utturkar GM, Garrett WE and DeFrate LE, 2018. Determination of the Position of the Knee at the Time of an Anterior Cruciate Ligament Rupture for Male Versus Female Patients by an Analysis of Bone Bruises. Am J Sports Med 46, 1559–1565. [DOI] [PMC free article] [PubMed] [Google Scholar]
- Perotto A, Delgagi EF, 2011. Section VII Leg & Section VIII Thigh In: Anatomical guide for the electromyographer:the limbs and trunk. (5th Ed) Springfield, Ill, 181–260. [Google Scholar]
- Renner KE, Franck CT, Miller TK and Queen RM, 2018. Limb asymmetry during recovery from anterior cruciate ligament reconstruction. J Orthop Res 36, 1887–1893. [DOI] [PubMed] [Google Scholar]
- Rudolph KS, Eastlack ME, Axe MJ and snyder-Mackler L, 1998. Movement patterns after anterior cruciate ligament injury: a comparison of patients who compensate well for the injury and those who require operative stabilization. Journal of Electromyography and Kinesiology 8, 349–362. [DOI] [PubMed] [Google Scholar]
- Rudolph KS, Axe MJ, Buchanan TS, Scholz JP and Snyder-Mackler L, 2001. Dynamic stability in the anterior cruciate ligament deficient knee. Knee Surg Sports Traumatol Arthrosc 9, 62–71. [DOI] [PubMed] [Google Scholar]
- Swanik CB, Lephart SM, Giraldo JL, Demont RG and Fu FH, 1999. Reactive muscle firing of anterior cruciate ligament-injured females during functional activities. J Athl Train 34, 121–129. [PMC free article] [PubMed] [Google Scholar]
- Theisen D, Rada I, Brau A, Gette P and Seil R, 2016. Muscle Activity Onset Prior to Landing in Patients after Anterior Cruciate Ligament Injury: A Systematic Review and Meta-Analysis. PLoS One 11, e0155277. [DOI] [PMC free article] [PubMed] [Google Scholar]
- Torry MR, Myers C, Pennington WW, Shelburne KB, Krong JP, Giphart JE, Steadman JR and Woo SL, 2011a. Relationship of anterior knee laxity to knee translations during drop landings: a bi-plane fluoroscopy study. Knee Surg Sports Traumatol Arthrosc 19, 653–662. [DOI] [PMC free article] [PubMed] [Google Scholar]
- Torry MR, Shelburne KB, Peterson DS, Giphart JE, Krong JP, Myers C, Steadman JR and Woo SL, 2011b. Knee kinematic profiles during drop landings: a biplane fluoroscopy study. Med Sci Sports Exerc 43, 533–541. [DOI] [PubMed] [Google Scholar]
- Trigsted SM, Cook DB, Pickett KA, Cadmus-Bertram L, Dunn WR and Bell DR, 2018. Greater fear of reinjury is related to stiffened jump-landing biomechanics and muscle activation in women after ACL reconstruction. Knee Surg Sports Traumatol Arthrosc 26, 3682–3689. [DOI] [PubMed] [Google Scholar]
- Tsai LC, McLean S, Colletti PM and Powers CM, 2012. Greater muscle co-contraction results in increased tibiofemoral compressive forces in females who have undergone anterior cruciate ligament reconstruction. J Orthop Res 30, 2007–2014. [DOI] [PubMed] [Google Scholar]
- van Grinsven S, van Cingel RE, Holla CJ and van Loon CJ, 2010. Evidence-based rehabilitation following anterior cruciate ligament reconstruction. Knee Surg Sports Traumatol Arthrosc 18, 1128–1144. [DOI] [PubMed] [Google Scholar]