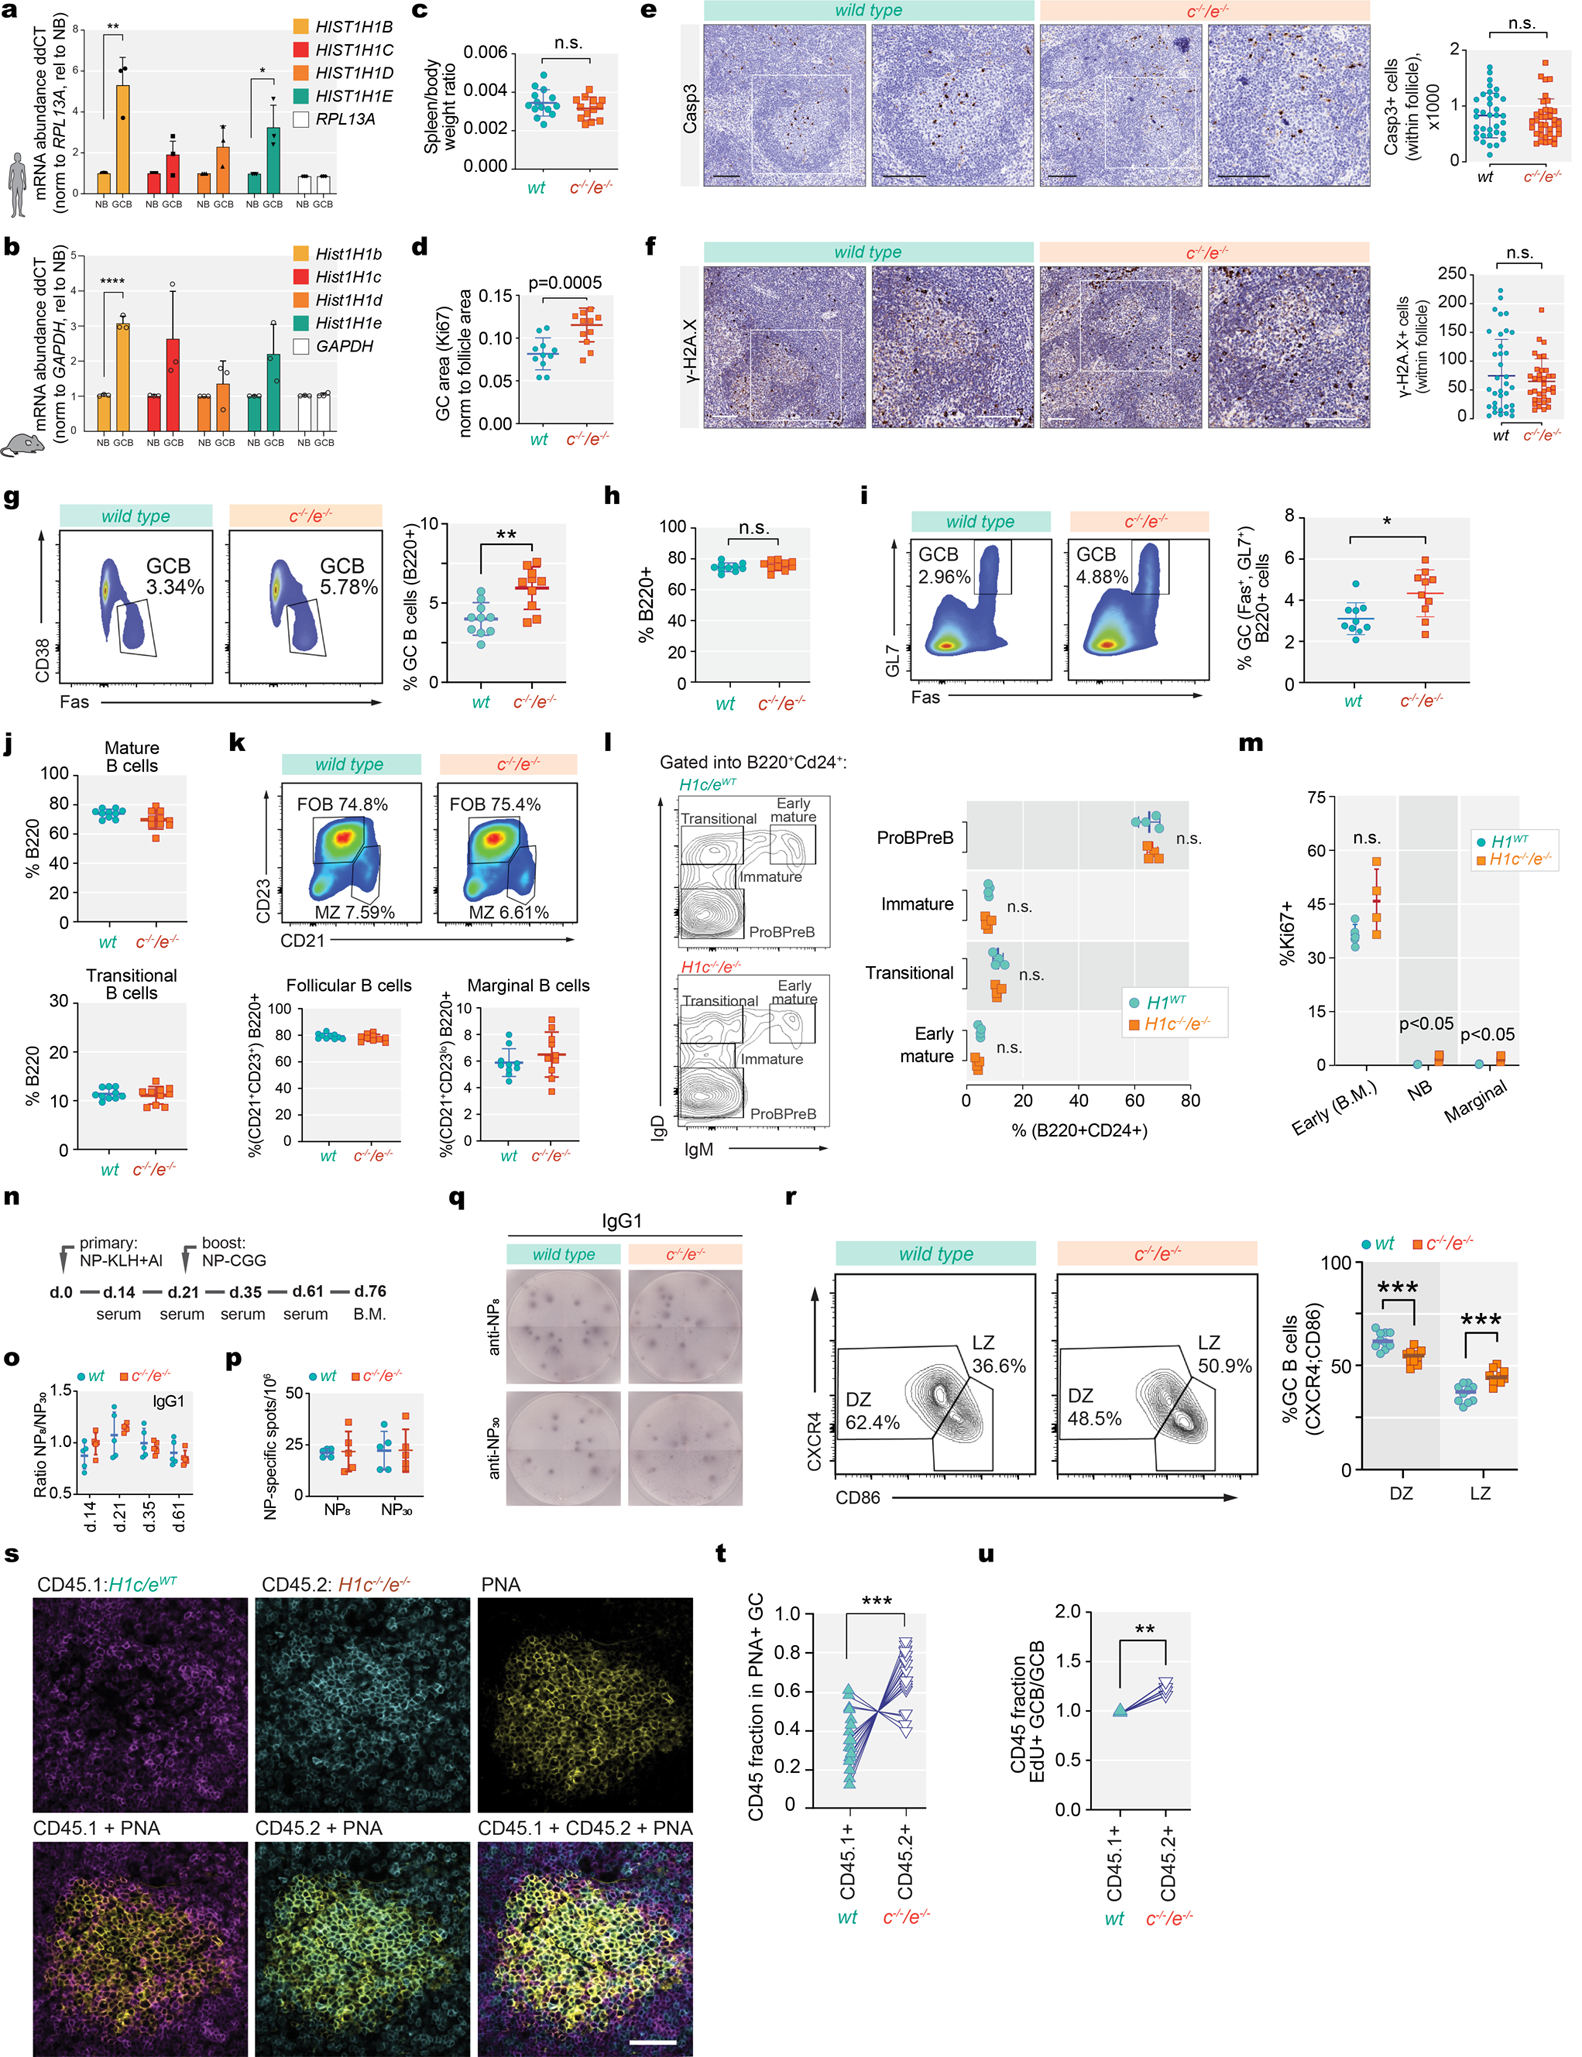
Extended Data Fig. 3 |. H1c−/−/e−/−mature B-cells manifest normal development in spleen and bone marrow.

a, Human Hist1H1B-E mRNA normalized to RPL13A in GC B cells relative to Naïve B cells (HIST1H1B, **P=0.004; HIST1H1E, **P=0.027), isolated from three independent human tonsil specimens. Data are mean ± sd, two-sided unpaired t-tests. b, Mouse Hist1h1b-e mRNA levels normalized to GAPDH in sorted GC B-cells (n=3) relative to Naïve B-cells(n=3) (HIST1H1B, **P<0.0001). Data are mean ± sd, two-sided unpaired t-tests. c, Quantification of spleen/body weight ratios of two-months old H1c−/−/e−/− (n=13) and wild-type littermate control (n=14) mice. Data are pooled from two independent experiments. d, Quantification of GC area (Ki67 staining) in the spleens of H1c−/−/e−/−(n=10) and WT (n=10) mice. ***P=0.0005. Data are mean ± sd, .two-sided unpaired t-tests. e-f, Immunohistochemistry images of spleen sections of cleaved Casp3 (e) and gamma-H2AX (f) staining and quantification (right) of positively stained follicular cells from H1c−/−/e−/− (n=3) and littermate wild-type H1 control (n=3) mice immunized with SRBC and sacrificed 10d post immunization. Scale bars, 100 μm. P<0.05, two-sided unpaired t-tests. Data are mean ± sd. g, Flow cytometry analysis and quantification of (Fas+CD38−) GC B cells within total B-cells from H1c−/−/e−/−and WT mice (n=10 per genotype). Two-sided unpaired t-tests,**P=0.0018. Data are mean ± sd. h, Quantification of flow cytometry %B220+ of splenocytes in H1c−/−/e−/− (n=10) and WT (n=10) mice 9 days post SRBC immunization. P<0.05,two-sided unpaired t-tests. Data are mean ± sd. i, Flow cytometry analysis and quantification of GC B-cells (Fas+GL7+) from H1c−/−/e−/− (n=10) and WT (n=10) mice. Two-sided unpaired t-tests, *P=0.041.Data are mean ± sd. j, Flow cytometry analysis and quantification of mature B-cells (B220+IgD+IgM+) and transitional B-cells (B220+IgDintIgM+) in spleens from H1c−/−/e−/−(n=10) and WT (n=10) mice. P<0.05, two-sided unpaired t-tests. Data are mean ± sd. k, Flow cytometry quantification of follicular B cells (B220+D23+CD21+) and marginal zone B cells (B220+D23loCD21+) in spleens from H1c−/−/e−/−(n=10) and WT (n=10) mice. P<0.05, two-sided unpaired t-tests.Data are mean ± sd. l, Flow cytometry analysis gated on B220+CD24+ and quantification of ProPreB (IgM−IgD−), Immature (IgM−IgDlo), Transitional (IgD+IgM−), and Early Mature (IgD+IgM+) B cells in bone marrow of H1c−/−/e−/−(n=4) and WT (n=5). P<0.05, two-sided unpaired t-tests. Data are mean ± sd. m, Percentage of Ki67+early B-cells (B220+CD24+) in bone-marrow of H1c−/−/e−/− (n=4) and WT H1 (n=5) mice, as well as naive B-cells (***P=0.0004)and marginal zone B-cells (***P=0.001) in the spleens of H1c−/−/e−/− (n=5) and WT H1 (n=5) mice. n, Schematic diagram of primary NP-KLH and secondary immunization 21 days after with NP-CGG. o, Ratio between high (NP8) and low (NP30) affinity NP-specific IgG1 antibody titers in sera of H1c−/−/e−/− (n=5) and WT (n=5) mice by ELISA. P<0.05, two-sided unpaired t-testsData are mean ± sd. p, ELISPOT quantification of NP-specific (anti-NP8and anti-NP30) IgG1-secreting cells from the bone marrow of H1c−/−/e−/− (n=5) and WT (n=5) mice. P<0.05, two-sided unpaired t-test. Data are mean ± sd. Data are representative from two independent experiments. q, Representative images of anti-NP8 and anti-NP30 96-well ELISPOT. r, Flow cytometry analysis and quantification of centroblasts within dark zone (DZ) (CXCR4+CD86−), ***P=0.0002 and centrocytes within light zone (LZ) (CXCR4−CD86+), ***P=0.0002 within GCB cells from H1c−/−/e−/−(n=10) and WT (n=10) mice. Two-sided unpaired t-test, ***P=0.0002. Data are representative from three independent experiments. s, Immunofluorescence confocal microscopy images of GCs at day 7 post immunization in mixed chimeras. Scale bar = 50 μm. Images are representative of two independent experiments. t, Quantification based on (s) the fraction of PNA+CD45.1 or CD45.2 cells (17 GCs, n=3 mice). Two-sided paired t-test, ***P= 0.0004. u, Relative EdU+ GC B-cell/GC B-cell fraction for WT CD45.1+and H1c−/−/e−/− CD45.2+at day 7 post immunization (n=4 chimeras). Two-sided paired t-test, **P= 0.0065. Data are representative from two independent experiments.
