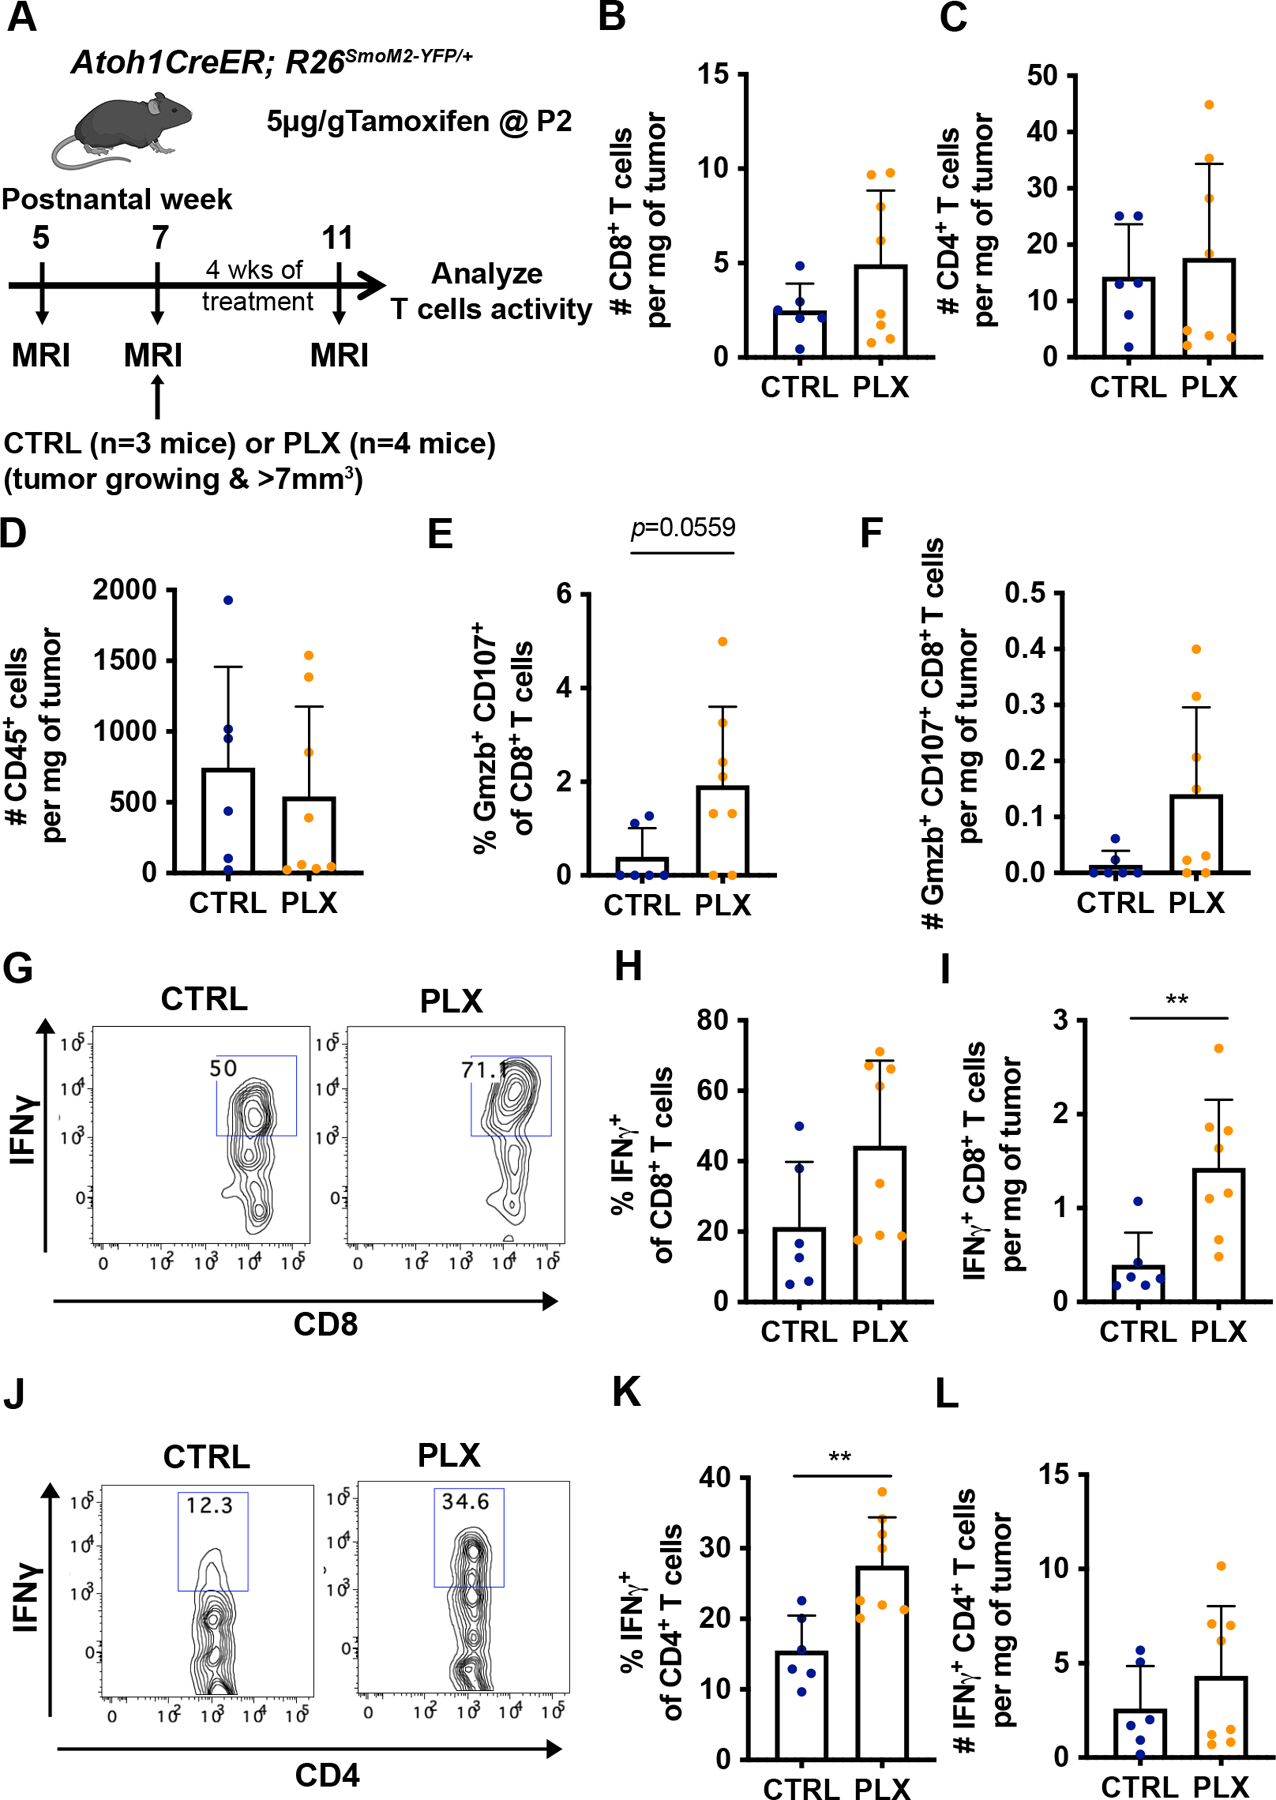
Figure 6. Depletion of TAMs in Atoh1-SmoM2 mice leads to an increase of pro-inflammatory T cells.

(A) Schematic representation of experimental design. (B–D) Number of CD8+ T cells (B), CD4+ T cells (C), and CD45+ immune cells (D) per milligram (mg) of tumor in control (CTRL)- and PLX-treated tumors. (E) Percentage of Granzyme B+ (Gzmb) CD107+CD8+ T cells of total CD8+ T cells. (F) Number of Gzmb+ CD107+CD8+ T cells per mg of tumor. (G–I) Representative flow cytometry panels from the CD45hi TCRβ+ CD8+ population (G) showing the proportion (H) and the number (I) of IFNγ+CD8+ T cells. (J–L) Representative flow cytometry panels from the CD45hiTCRβ+CD4+ population (J) showing the proportion (K) and the number (L) of IFNγ+CD4+ T cells. Mean ± SD. Significance was determined using unpaired t test for (B–F), (H–I) and (K–L). **p<0.01.
